Embed Size (px)
Citation preview
International Journal of Research in Engineering and Science (IJRES)
ISSN (Online): 2320-9364, ISSN (Print): 2320-9356 www.ijres.org Volume 9 Issue 8 ǁ 2021 ǁ PP. 80-89
www.ijres.org 80 | Page
Determination of Economic Base Width of Transmission Tower
for Different Wind Zones
Milind Nataraj Shyamenahalli (Student at dept of Civil Engineering, NCET Bangalore)
Chaitra D M (Asst.Proffesor at dept of Civil Engineering, NCET Bangalore)
Abstract Transmission line towers are one of the most important structures for transmitting the power across the country.
Newer transmission towers are built at every location even in rural areas. Economy in design and construction
of transmission tower is of utmost importance. The base width of the tower plays a major role in its stability and
economy. The present study deals with the calculation of optimum base width for transmission tower. The tower
geometry having the height 34.120m and base width 6.307m. which is obtained from A.P.S.E.B (Andhra
Pradesh State Electricity Board) substation, the analysis was performed for a 220kV transmission tower using
STADD Pro. The analysis was run for base width varying from 3m to 15m and four heights run as eight models
for each hight of tower with monoslope on two opposite sides for two different wind zones. Based on the comparison of results, useful incites were drawn on the most optimum base width coefficient and the aspect
ratio which gives the most economical section
Keywords: Economical section, base width, STAAD Pro, Aspect ratio
---------------------------------------------------------------------------------------------------------------------------------------
Date of Submission: 23-07-2021 Date of acceptance: 08-08-2021
---------------------------------------------------------------------------------------------------------------------------------------
I. INTRODUCTION
In each nation, the need of electric force utilization has kept on expanding, the pace of interest being
more noteworthy in the creating nations. Transmission tower lines (Figure 1.1) are one of most significant life-
line structures. Transmission towers are vital to flexibly power to different districts of the country. This has
prompted the expansion in the structure of intensity stations and resulting increment in power transmission lines from the creating stations to the various corners where it’s required. Interconnections between frameworks are
additionally expanding to improve unwavering quality and economy. The cross-segment of transmitters, the dispersing among conduits, and the area of ground wires
concerning the channels will choose the plan of towers and establishments. The significant segments of a
transmission line comprise of the conduits, ground wires, protection, towers and establishments. More often
than not transmission lines are intended for wind. When the outside burdens following up on the pinnacle are
resolved, one continues with an investigation of the powers in different individuals with the end goal of
repairing their sizes. Transmission towers comprise around 28 to 42 percent of the all out expense of the Transmission lines.
The expanding interest for electrical vitality can be met progressively prudent by creating diverse light weight designs of transmission line towers.
Steel towers are widely utilized in the development of transmission lines. The steel structures are
planned as a self-supporting structure. The expense of the towers is around 40% of the all out expense of the
transmission line and consequently economy in tower configuration has expected extraordinary significance.
1.1.2 OBJECTIVES
The objective of the study is to validate the optimum base width coefficient for monoslope
transmission towers. For carrying out analysis two tower configurations with starting dimension of 6.307m base
width and 34.120m height for a 220kV tower was considered, the analysis was performed along with the
validation of optimum base width coefficient, the parameters like displacements, height to width ratio, weight
per length is also compared to arrive at optimum design.
1.1.3 SCOPE
This study is carrying out the linear analysis of transmission tower models using STAAD Pro with
inbuilt design module also partially validated with MS Excel spreadsheet and IS:800-2007 code guidelines. The
Effect Of Temperature On Linear Alkylbene (Lab) Yield From Rerun Column
www.ijres.org 81 | Page
loads acting on the transmission towers are calculated based on guidelines of IS:802-1995. This study is limited
to monoslope transmission tower of heights 34.120m and 55m with base widths 3m, 5m, 6.307m, 9m, 12m,
15m.
1.2 THE METHODOLOGY
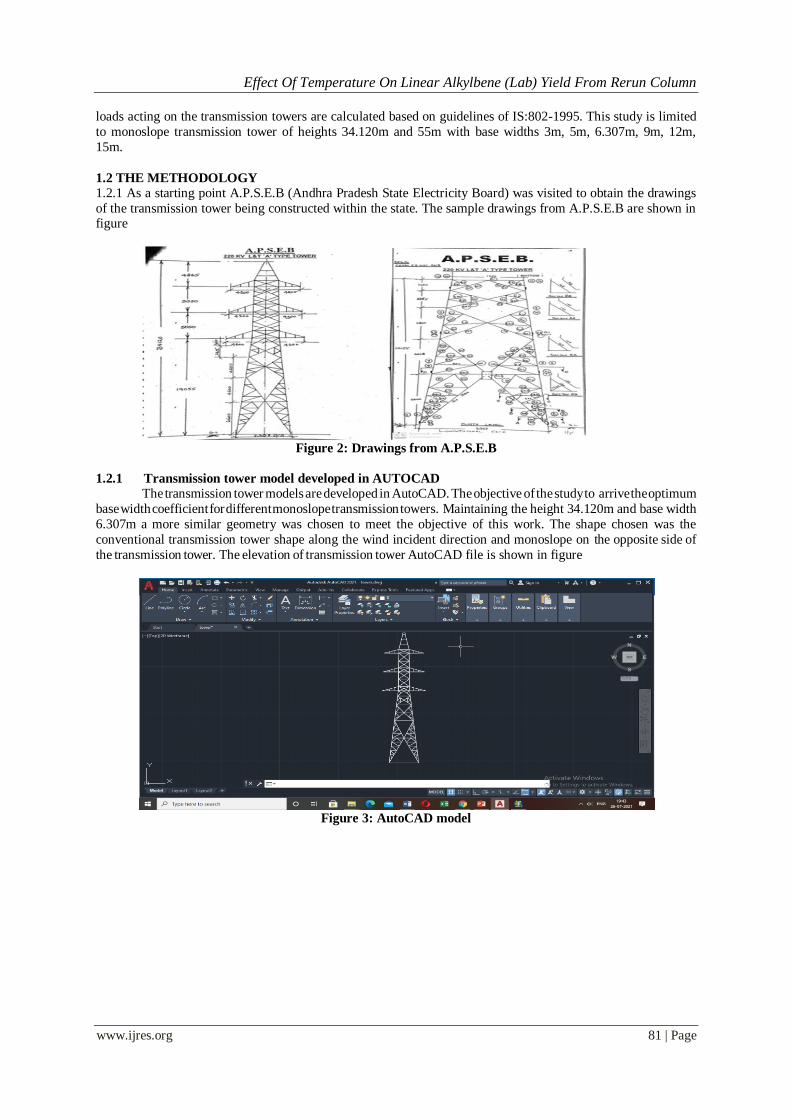
1.2.1 As a starting point A.P.S.E.B (Andhra Pradesh State Electricity Board) was visited to obtain the drawings
of the transmission tower being constructed within the state. The sample drawings from A.P.S.E.B are shown in figure
Figure 2: Drawings from A.P.S.E.B
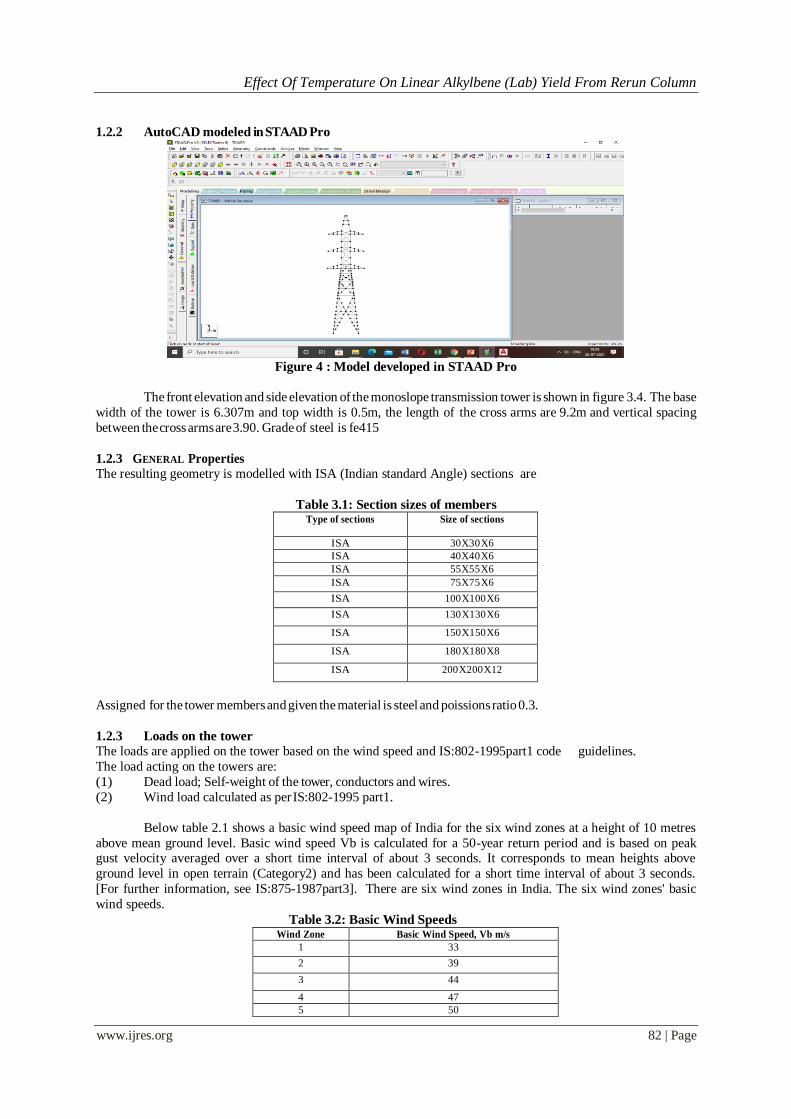
1.2.1 Transmission tower model developed in AUTOCAD
The transmission tower models are developed in AutoCAD. The objective of the study to arrive the optimum
base width coefficient for different monoslope transmission towers. Maintaining the height 34.120m and base width
6.307m a more similar geometry was chosen to meet the objective of this work. The shape chosen was the
conventional transmission tower shape along the wind incident direction and monoslope on the opposite side of
the transmission tower. The elevation of transmission tower AutoCAD file is shown in figure
Figure 3: AutoCAD model
Effect Of Temperature On Linear Alkylbene (Lab) Yield From Rerun Column
www.ijres.org 82 | Page
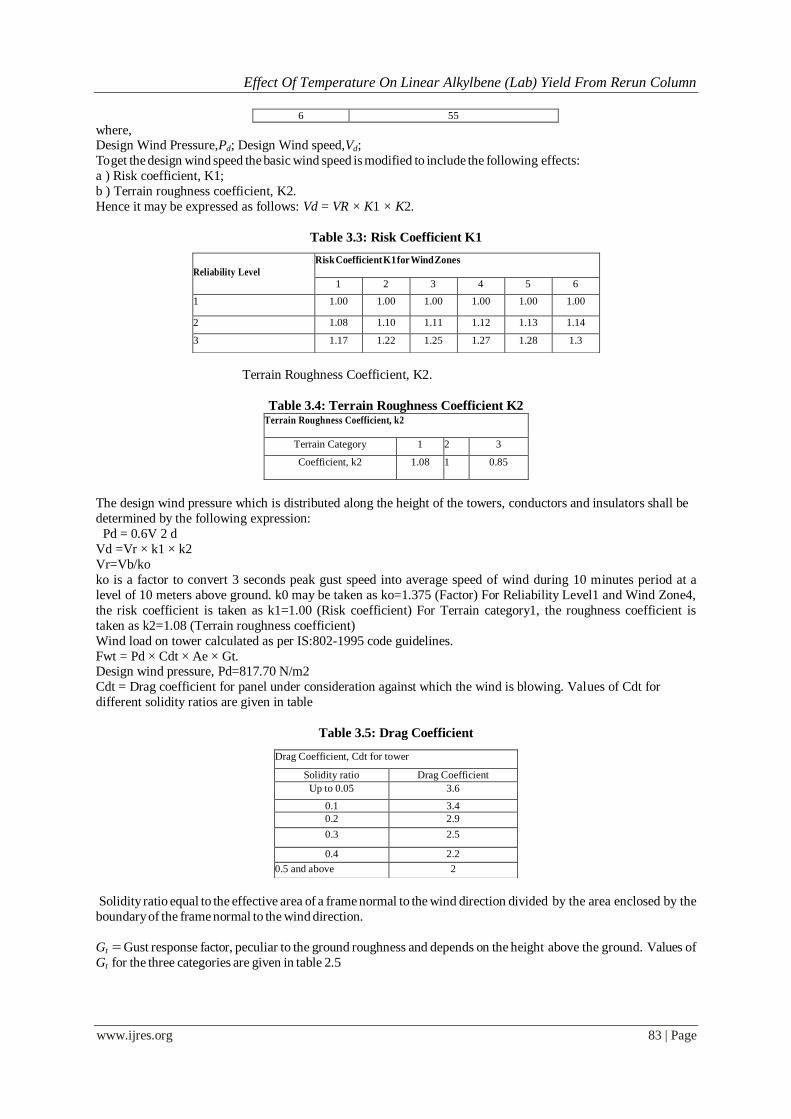
1.2.2 AutoCAD modeled in STAAD Pro
Figure 4 : Model developed in STAAD Pro
The front elevation and side elevation of the monoslope transmission tower is shown in figure 3.4. The base
width of the tower is 6.307m and top width is 0.5m, the length of the cross arms are 9.2m and vertical spacing
between the cross arms are 3.90. Grade of steel is fe415
1.2.3 GENERAL Properties
The resulting geometry is modelled with ISA (Indian standard Angle) sections are
Table 3.1: Section sizes of members Type of sections Size of sections
ISA 30X30X6
ISA 40X40X6
ISA 55X55X6
ISA 75X75X6
ISA 100X100X6
ISA 130X130X6
ISA 150X150X6
ISA 180X180X8
ISA 200X200X12
Assigned for the tower members and given the material is steel and poissions ratio 0.3.
1.2.3 Loads on the tower
The loads are applied on the tower based on the wind speed and IS:802-1995part1 code guidelines.
The load acting on the towers are:
(1) Dead load; Self-weight of the tower, conductors and wires.
(2) Wind load calculated as per IS:802-1995 part1.
Below table 2.1 shows a basic wind speed map of India for the six wind zones at a height of 10 metres
above mean ground level. Basic wind speed Vb is calculated for a 50-year return period and is based on peak gust velocity averaged over a short time interval of about 3 seconds. It corresponds to mean heights above
ground level in open terrain (Category2) and has been calculated for a short time interval of about 3 seconds.
[For further information, see IS:875-1987part3]. There are six wind zones in India. The six wind zones' basic
wind speeds.
Table 3.2: Basic Wind Speeds Wind Zone Basic Wind Speed, Vb m/s
1 33
2 39
3 44
4 47
5 50
Effect Of Temperature On Linear Alkylbene (Lab) Yield From Rerun Column
www.ijres.org 83 | Page
6 55
where, Design Wind Pressure,Pd; Design Wind speed,Vd;
To get the design wind speed the basic wind speed is modified to include the following effects:
a ) Risk coefficient, K1;
b ) Terrain roughness coefficient, K2.
Hence it may be expressed as follows: Vd = VR × K1 × K2.
Table 3.3: Risk Coefficient K1
Terrain Roughness Coefficient, K2.
Table 3.4: Terrain Roughness Coefficient K2 Terrain Roughness Coefficient, k2
Terrain Category 1 2 3
Coefficient, k2 1.08 1 0.85
The design wind pressure which is distributed along the height of the towers, conductors and insulators shall be
determined by the following expression:
Pd = 0.6V 2 d
Vd =Vr × k1 × k2
Vr=Vb/ko
ko is a factor to convert 3 seconds peak gust speed into average speed of wind during 10 minutes period at a
level of 10 meters above ground. k0 may be taken as ko=1.375 (Factor) For Reliability Level1 and Wind Zone4,
the risk coefficient is taken as k1=1.00 (Risk coefficient) For Terrain category1, the roughness coefficient is
taken as k2=1.08 (Terrain roughness coefficient)
Wind load on tower calculated as per IS:802-1995 code guidelines.
Fwt = Pd × Cdt × Ae × Gt. Design wind pressure, Pd=817.70 N/m2
Cdt = Drag coefficient for panel under consideration against which the wind is blowing. Values of Cdt for
different solidity ratios are given in table
Table 3.5: Drag Coefficient
Solidity ratio equal to the effective area of a frame normal to the wind direction divided by the area enclosed by the
boundary of the frame normal to the wind direction.
Gt = Gust response factor, peculiar to the ground roughness and depends on the height above the ground. Values of
Gt for the three categories are given in table 2.5
Reliability Level
Risk Coefficient K1 for Wind Zones
1 2 3 4 5 6
1 1.00 1.00 1.00 1.00 1.00 1.00
2 1.08 1.10 1.11 1.12 1.13 1.14
3 1.17 1.22 1.25 1.27 1.28 1.3
Drag Coefficient, Cdt for tower
Solidity ratio Drag Coefficient
Up to 0.05 3.6
0.1 3.4
0.2 2.9
0.3 2.5
0.4 2.2
0.5 and above 2
Effect Of Temperature On Linear Alkylbene (Lab) Yield From Rerun Column
www.ijres.org 84 | Page
Table 3.6: Gust Response Factor
Ae = Total net surface area in m2 of the panel's legs, bracings, cross arms, and secondary members projected
normal to the face. Fwt/Ae = 6.33 kN/m2
After modelling, analysis is performed. After the analysis, based on unity check the design of the members is
verified, then those members which are failing the unity check ratio are increased in size, maintaining the sections type
as ISA (Indian Standard Angle) and the analysis is re run until the unity check is satisfied. Simultaneously, as
tower members are verified based on the guidelines of IS:800-2007
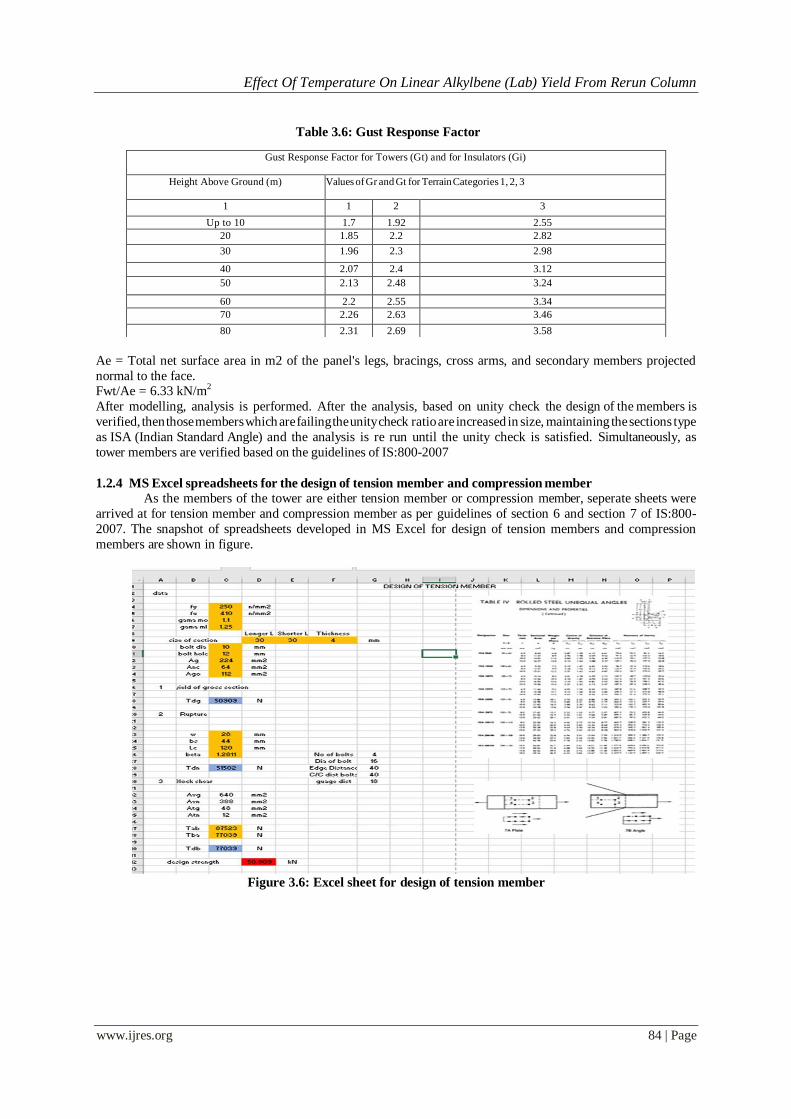
1.2.4 MS Excel spreadsheets for the design of tension member and compression member
As the members of the tower are either tension member or compression member, seperate sheets were
arrived at for tension member and compression member as per guidelines of section 6 and section 7 of IS:800-
2007. The snapshot of spreadsheets developed in MS Excel for design of tension members and compression
members are shown in figure.
Figure 3.6: Excel sheet for design of tension member
Gust Response Factor for Towers (Gt) and for Insulators (Gi)
Height Above Ground (m) Values of Gr and Gt for Terrain Categories 1, 2, 3
1 1 2 3
Up to 10 1.7 1.92 2.55
20 1.85 2.2 2.82
30 1.96 2.3 2.98
40 2.07 2.4 3.12
50 2.13 2.48 3.24
60 2.2 2.55 3.34
70 2.26 2.63 3.46
80 2.31 2.69 3.58
Effect Of Temperature On Linear Alkylbene (Lab) Yield From Rerun Column
www.ijres.org 85 | Page
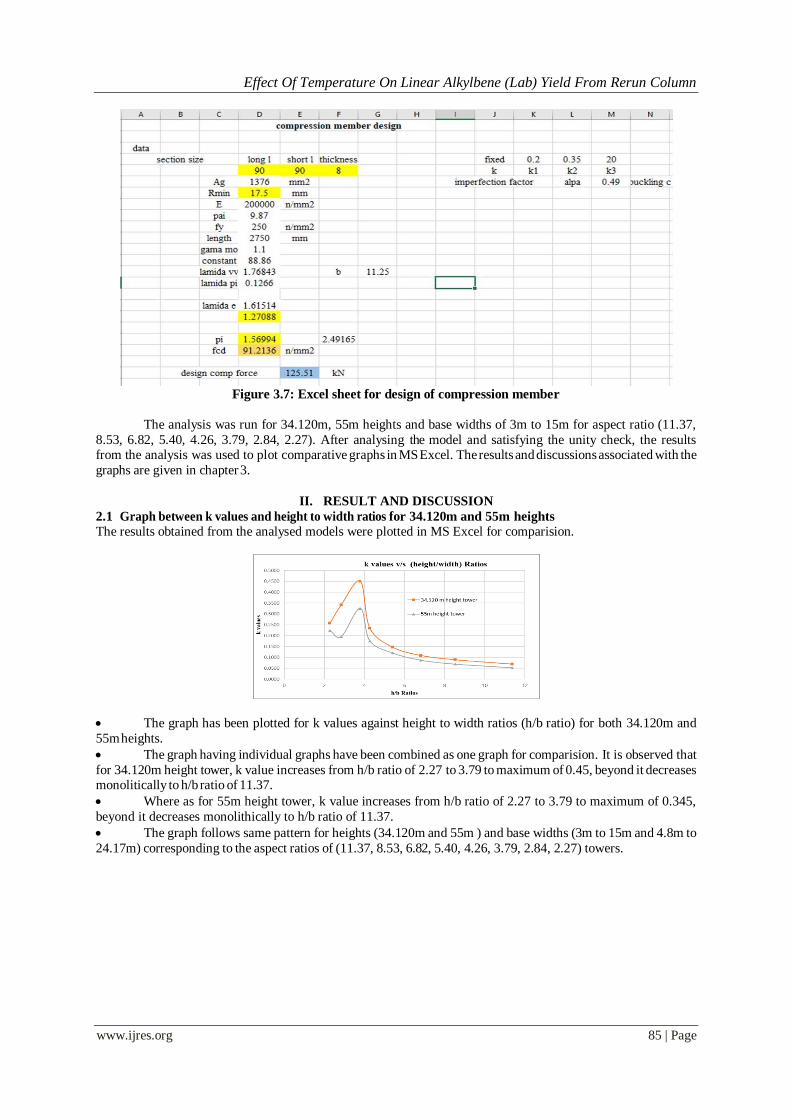
Figure 3.7: Excel sheet for design of compression member
The analysis was run for 34.120m, 55m heights and base widths of 3m to 15m for aspect ratio (11.37,
8.53, 6.82, 5.40, 4.26, 3.79, 2.84, 2.27). After analysing the model and satisfying the unity check, the results from the analysis was used to plot comparative graphs in MS Excel. The results and discussions associated with the
graphs are given in chapter 3.
II. RESULT AND DISCUSSION
2.1 Graph between k values and height to width ratios for 34.120m and 55m heights
The results obtained from the analysed models were plotted in MS Excel for comparision.
The graph has been plotted for k values against height to width ratios (h/b ratio) for both 34.120m and
55m heights.
The graph having individual graphs have been combined as one graph for comparision. It is observed that
for 34.120m height tower, k value increases from h/b ratio of 2.27 to 3.79 to maximum of 0.45, beyond it decreases monolitically to h/b ratio of 11.37.
Where as for 55m height tower, k value increases from h/b ratio of 2.27 to 3.79 to maximum of 0.345,
beyond it decreases monolithically to h/b ratio of 11.37.
The graph follows same pattern for heights (34.120m and 55m ) and base widths (3m to 15m and 4.8m to
24.17m) corresponding to the aspect ratios of (11.37, 8.53, 6.82, 5.40, 4.26, 3.79, 2.84, 2.27) towers.
Effect Of Temperature On Linear Alkylbene (Lab) Yield From Rerun Column
www.ijres.org 86 | Page
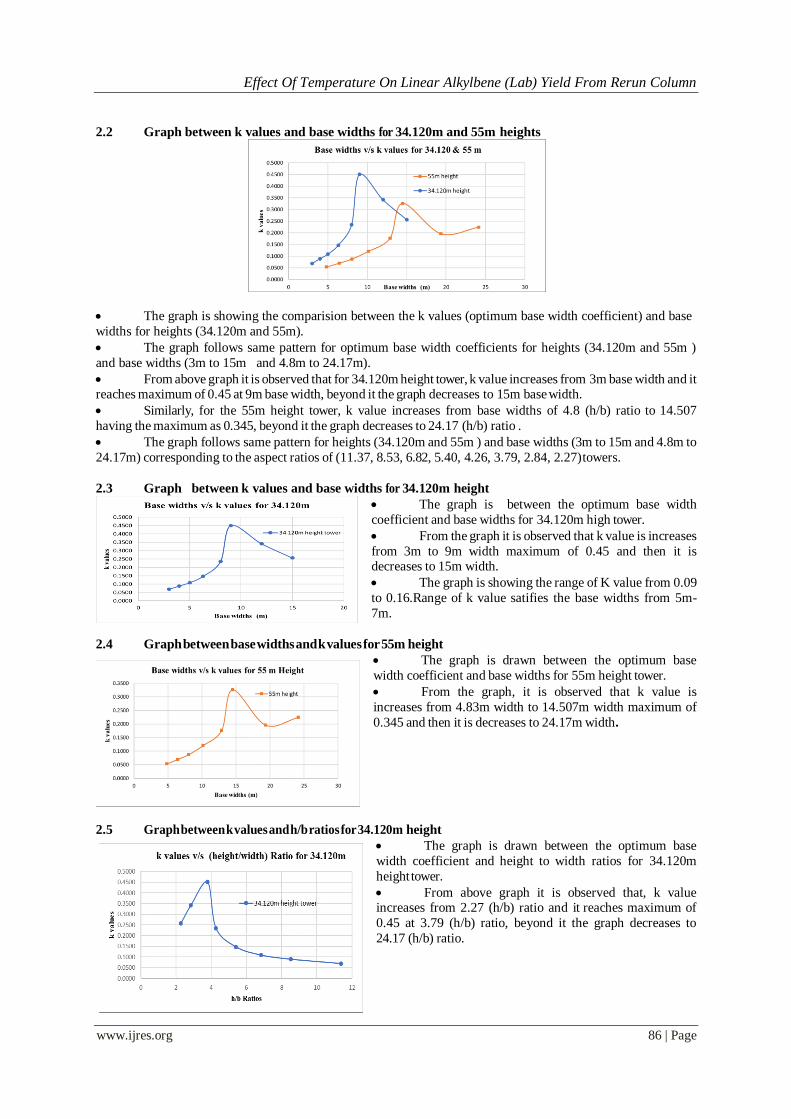
2.2 Graph between k values and base widths for 34.120m and 55m heights
The graph is showing the comparision between the k values (optimum base width coefficient) and base
widths for heights (34.120m and 55m).
The graph follows same pattern for optimum base width coefficients for heights (34.120m and 55m )
and base widths (3m to 15m and 4.8m to 24.17m).
From above graph it is observed that for 34.120m height tower, k value increases from 3m base width and it reaches maximum of 0.45 at 9m base width, beyond it the graph decreases to 15m base width.
Similarly, for the 55m height tower, k value increases from base widths of 4.8 (h/b) ratio to 14.507
having the maximum as 0.345, beyond it the graph decreases to 24.17 (h/b) ratio .
The graph follows same pattern for heights (34.120m and 55m ) and base widths (3m to 15m and 4.8m to
24.17m) corresponding to the aspect ratios of (11.37, 8.53, 6.82, 5.40, 4.26, 3.79, 2.84, 2.27) towers.
2.3 Graph between k values and base widths for 34.120m height
The graph is between the optimum base width
coefficient and base widths for 34.120m high tower.
From the graph it is observed that k value is increases
from 3m to 9m width maximum of 0.45 and then it is decreases to 15m width.
The graph is showing the range of K value from 0.09
to 0.16.Range of k value satifies the base widths from 5m-
7m.
2.4 Graph between base widths and k values for 55m height
The graph is drawn between the optimum base
width coefficient and base widths for 55m height tower.
From the graph, it is observed that k value is
increases from 4.83m width to 14.507m width maximum of
0.345 and then it is decreases to 24.17m width.
2.5 Graph between k values and h/b ratios for 34.120m height
The graph is drawn between the optimum base
width coefficient and height to width ratios for 34.120m
height tower.
From above graph it is observed that, k value increases from 2.27 (h/b) ratio and it reaches maximum of
0.45 at 3.79 (h/b) ratio, beyond it the graph decreases to
24.17 (h/b) ratio.
Effect Of Temperature On Linear Alkylbene (Lab) Yield From Rerun Column
www.ijres.org 87 | Page
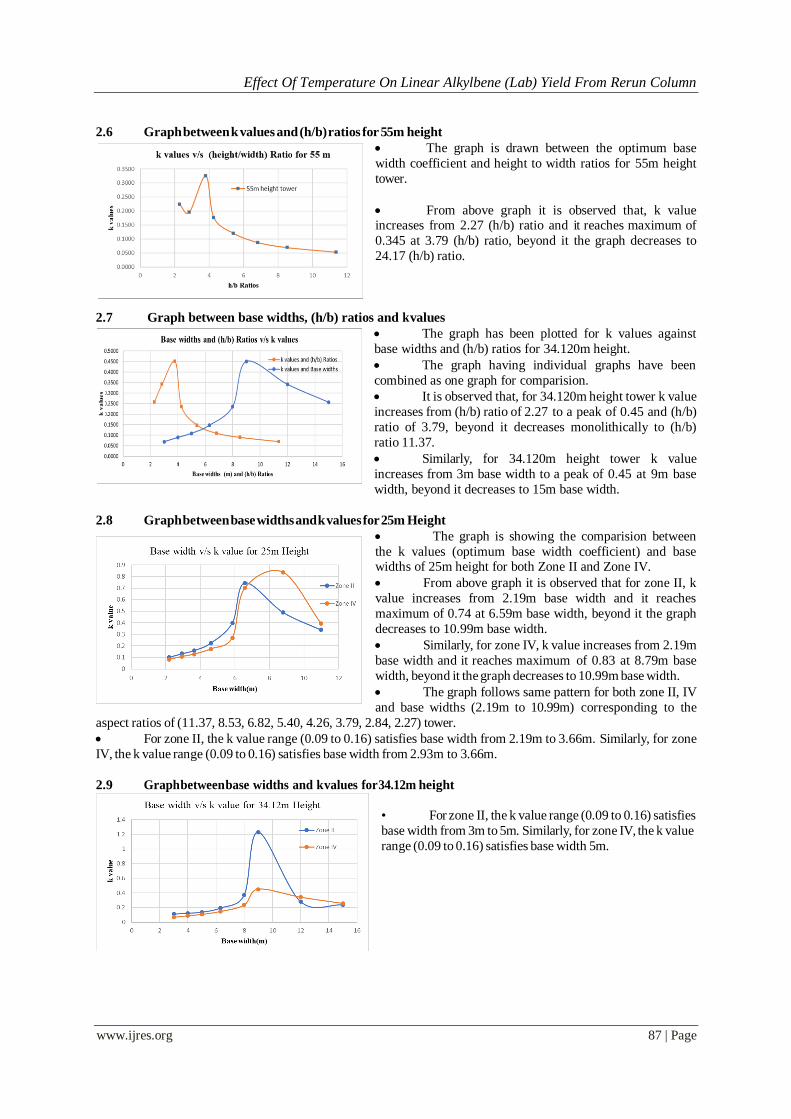
2.6 Graph between k values and (h/b) ratios for 55m height
The graph is drawn between the optimum base
width coefficient and height to width ratios for 55m height
tower.
From above graph it is observed that, k value increases from 2.27 (h/b) ratio and it reaches maximum of
0.345 at 3.79 (h/b) ratio, beyond it the graph decreases to
24.17 (h/b) ratio.
2.7 Graph between base widths, (h/b) ratios and k values
The graph has been plotted for k values against
base widths and (h/b) ratios for 34.120m height.
The graph having individual graphs have been
combined as one graph for comparision.
It is observed that, for 34.120m height tower k value
increases from (h/b) ratio of 2.27 to a peak of 0.45 and (h/b)
ratio of 3.79, beyond it decreases monolithically to (h/b)
ratio 11.37.
Similarly, for 34.120m height tower k value
increases from 3m base width to a peak of 0.45 at 9m base
width, beyond it decreases to 15m base width.
2.8 Graph between base widths and k values for 25m Height
The graph is showing the comparision between
the k values (optimum base width coefficient) and base widths of 25m height for both Zone II and Zone IV.
From above graph it is observed that for zone II, k
value increases from 2.19m base width and it reaches
maximum of 0.74 at 6.59m base width, beyond it the graph
decreases to 10.99m base width.
Similarly, for zone IV, k value increases from 2.19m
base width and it reaches maximum of 0.83 at 8.79m base
width, beyond it the graph decreases to 10.99m base width.
The graph follows same pattern for both zone II, IV
and base widths (2.19m to 10.99m) corresponding to the
aspect ratios of (11.37, 8.53, 6.82, 5.40, 4.26, 3.79, 2.84, 2.27) tower.
For zone II, the k value range (0.09 to 0.16) satisfies base width from 2.19m to 3.66m. Similarly, for zone
IV, the k value range (0.09 to 0.16) satisfies base width from 2.93m to 3.66m.
2.9 Graph between base widths and k values for 34.12m height
• For zone II, the k value range (0.09 to 0.16) satisfies
base width from 3m to 5m. Similarly, for zone IV, the k value
range (0.09 to 0.16) satisfies base width 5m.
Effect Of Temperature On Linear Alkylbene (Lab) Yield From Rerun Column
www.ijres.org 88 | Page
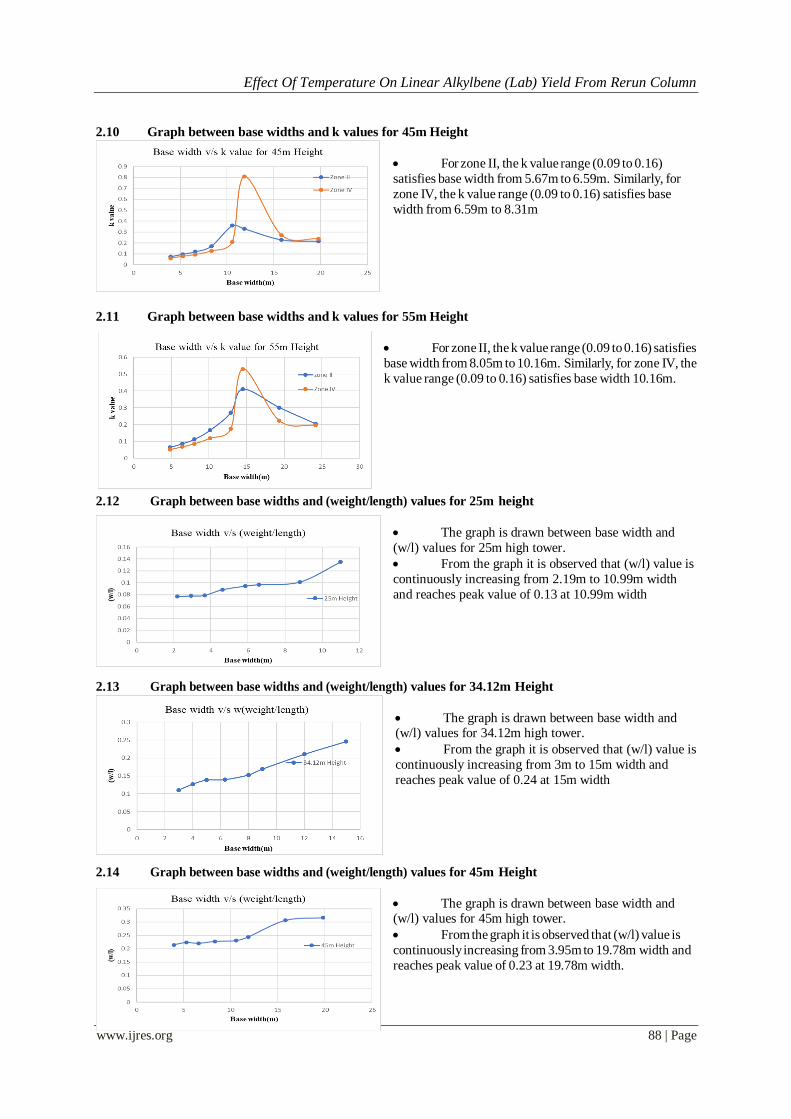
2.10 Graph between base widths and k values for 45m Height
For zone II, the k value range (0.09 to 0.16)
satisfies base width from 5.67m to 6.59m. Similarly, for
zone IV, the k value range (0.09 to 0.16) satisfies base
width from 6.59m to 8.31m
2.11 Graph between base widths and k values for 55m Height
For zone II, the k value range (0.09 to 0.16) satisfies
base width from 8.05m to 10.16m. Similarly, for zone IV, the
k value range (0.09 to 0.16) satisfies base width 10.16m.
2.12 Graph between base widths and (weight/length) values for 25m height
The graph is drawn between base width and
(w/l) values for 25m high tower.
From the graph it is observed that (w/l) value is
continuously increasing from 2.19m to 10.99m width
and reaches peak value of 0.13 at 10.99m width
2.13 Graph between base widths and (weight/length) values for 34.12m Height
The graph is drawn between base width and (w/l) values for 34.12m high tower.
From the graph it is observed that (w/l) value is
continuously increasing from 3m to 15m width and
reaches peak value of 0.24 at 15m width
2.14 Graph between base widths and (weight/length) values for 45m Height
The graph is drawn between base width and (w/l) values for 45m high tower.
From the graph it is observed that (w/l) value is
continuously increasing from 3.95m to 19.78m width and
reaches peak value of 0.23 at 19.78m width.
Effect Of Temperature On Linear Alkylbene (Lab) Yield From Rerun Column
www.ijres.org 89 | Page
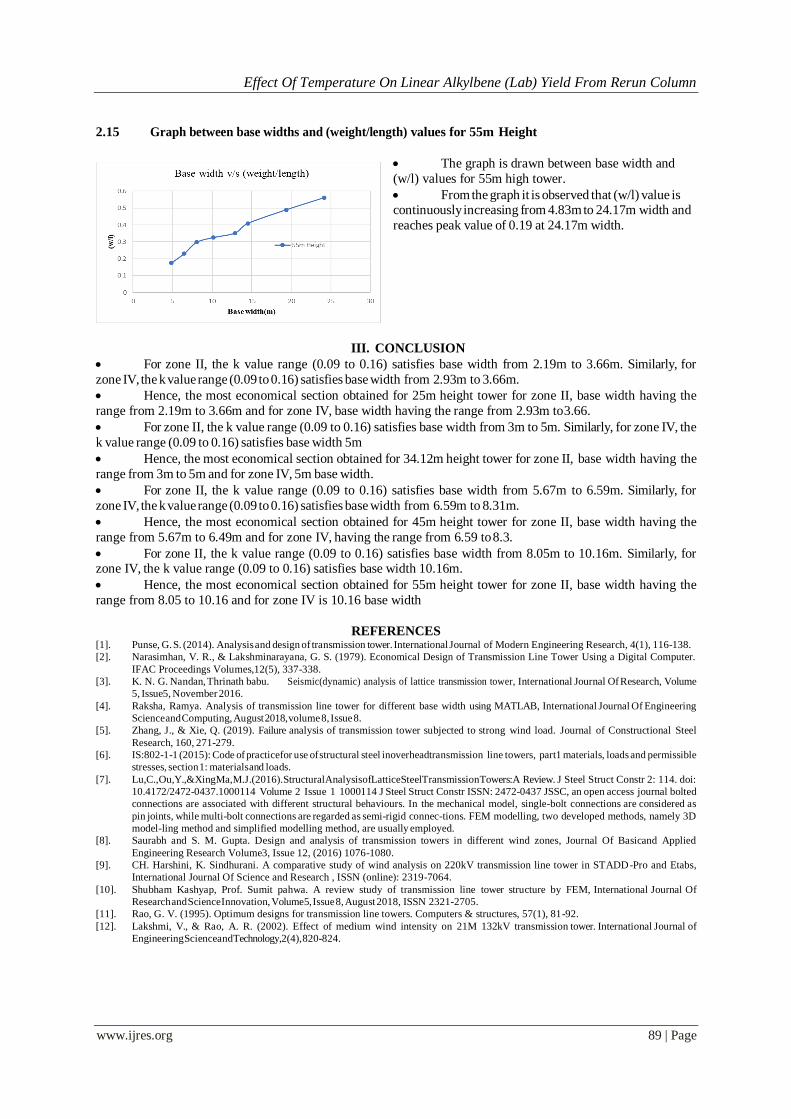
2.15 Graph between base widths and (weight/length) values for 55m Height
The graph is drawn between base width and
(w/l) values for 55m high tower.
From the graph it is observed that (w/l) value is continuously increasing from 4.83m to 24.17m width and
reaches peak value of 0.19 at 24.17m width.
III. CONCLUSION
For zone II, the k value range (0.09 to 0.16) satisfies base width from 2.19m to 3.66m. Similarly, for
zone IV, the k value range (0.09 to 0.16) satisfies base width from 2.93m to 3.66m.
Hence, the most economical section obtained for 25m height tower for zone II, base width having the
range from 2.19m to 3.66m and for zone IV, base width having the range from 2.93m to 3.66.
For zone II, the k value range (0.09 to 0.16) satisfies base width from 3m to 5m. Similarly, for zone IV, the
k value range (0.09 to 0.16) satisfies base width 5m
Hence, the most economical section obtained for 34.12m height tower for zone II, base width having the
range from 3m to 5m and for zone IV, 5m base width.
For zone II, the k value range (0.09 to 0.16) satisfies base width from 5.67m to 6.59m. Similarly, for
zone IV, the k value range (0.09 to 0.16) satisfies base width from 6.59m to 8.31m.
Hence, the most economical section obtained for 45m height tower for zone II, base width having the
range from 5.67m to 6.49m and for zone IV, having the range from 6.59 to 8.3.
For zone II, the k value range (0.09 to 0.16) satisfies base width from 8.05m to 10.16m. Similarly, for zone IV, the k value range (0.09 to 0.16) satisfies base width 10.16m.
Hence, the most economical section obtained for 55m height tower for zone II, base width having the
range from 8.05 to 10.16 and for zone IV is 10.16 base width
REFERENCES [1]. Punse, G. S. (2014). Analysis and design of transmission tower. International Journal of Modern Engineering Research, 4(1), 116-138.
[2]. Narasimhan, V. R., & Lakshminarayana, G. S. (1979). Economical Design of Transmission Line Tower Using a Digital Computer.
IFAC Proceedings Volumes,12(5), 337-338.
[3]. K. N. G. Nandan, Thrinath babu. Seismic(dynamic) analysis of lattice transmission tower, International Journal Of Research, Volume
5, Issue5, November 2016.
[4]. Raksha, Ramya. Analysis of transmission line tower for different base width using MATLAB, International Journal Of Engineering
Science and Computing, August 2018, volume 8, Issue 8.
[5]. Zhang, J., & Xie, Q. (2019). Failure analysis of transmission tower subjected to strong wind load. Journal of Constructional Steel
Research, 160, 271-279.
[6]. IS:802-1-1 (2015): Code of practicefor use of structural steel inoverheadtransmission line towers, part1 materials, loads and permissible
stresses, section 1: materials and loads.
[7]. Lu, C., Ou, Y., & Xing Ma, M. J. (2016). Structural Analysis of Lattice Steel Transmission Towers: A Review. J Steel Struct Constr 2: 114. doi:
10.4172/2472-0437.1000114 Volume 2 Issue 1 1000114 J Steel Struct Constr ISSN: 2472-0437 JSSC, an open access journal bolted
connections are associated with different structural behaviours. In the mechanical model, single-bolt connections are considered as
pin joints, while multi-bolt connections are regarded as semi-rigid connec-tions. FEM modelling, two developed methods, namely 3D
model-ling method and simplified modelling method, are usually employed.
[8]. Saurabh and S. M. Gupta. Design and analysis of transmission towers in different wind zones, Journal Of Basicand Applied
Engineering Research Volume3, Issue 12, (2016) 1076-1080.
[9]. CH. Harshini, K. Sindhurani. A comparative study of wind analysis on 220kV transmission line tower in STADD-Pro and Etabs,
International Journal Of Science and Research , ISSN (online): 2319-7064.
[10]. Shubham Kashyap, Prof. Sumit pahwa. A review study of transmission line tower structure by FEM, International Journal Of
Research and Science Innovation, Volume 5, Issue 8, August 2018, ISSN 2321-2705.
[11]. Rao, G. V. (1995). Optimum designs for transmission line towers. Computers & structures, 57(1), 81-92.
[12]. Lakshmi, V., & Rao, A. R. (2002). Effect of medium wind intensity on 21M 132kV transmission tower. International Journal of
Engineering Science and Technology, 2(4), 820-824.