Embed Size (px)
Citation preview

1
DETERMINATION OF COBALT(II) BY COPLEXATION WITH
3-(2'-THIAZOLYLAZO)-2,6-DIAMINOPYRIDINE AND
PREPARATION OF CHELATING RESIN TO SEPARATE
COBALT(II)
INTRODUCTION
Cobalt Cobalt is a grayish lustrous metal. It is brittle and hard. The properties of
cobalt are shown in Table 1. Cobalt is not found as the free metal. The abundance of
cobalt in the earth’s crust is 30 ppm. More than 200 ores are known to contain cobalt
but only a few are of commercial value. The more important are arsenides and
sulfides such as smaltite, CoAs2 and linnacite, Co3S4.
Table 1 Some properties of the elemental cobalt
Property
Cobalt
Atomic number 27
Number of naturally occurring isotopes 1
Atomic weight 58.933
Electronic configuration [Ar] 3d7 4s2
Electronegativity 1.7
Melting point / oC 1495
Boiling point / oC 2927
Thermal conductivity / W m-1 K-1 100
Density (20 oC) / g cm-3 8.9
Electrical resistivity (20oC) / µΩ cm 6
Source: Greenwood (1997)
2
N
SN N
(r)
(q)(a)
(d)
(c)
(b)
(e)
Cobalt is used in magnet steels, stainless steels, alloys, jet turbines, gas turbine
generators and electroplating. Cobalt salts are used for the production of brilliant and
permanent blue colors in porcelain, glass, pottery, tiles and enamels. Cobalt
compounds are used as paint pigments.
Cobalt metal powder is a fire hazard. Evidence indicates that minute quantities
of cobalt may be detrimental to higher plant life, particularly in water and sand
cultures. Cobalt toxicity is characterized by a chlorosis similar to that induced by lack
of iron. Growing cattle can consume up to 50 mg cobalt per 100 lb body weight
without ill effects. Sheep can tolerate up to 160 mg daily per 100 lb weight for at least
eight weeks without harmful effects. Higher dosages are injurious.
Thiazolylazodye Thiazolylazo dyes are easily prepared by the diazotization of 2-aminothiazole
and its derivatives. The diazotate formed is so reactive that it has to be coupled with the
aromatic substance in cold acidic solution.
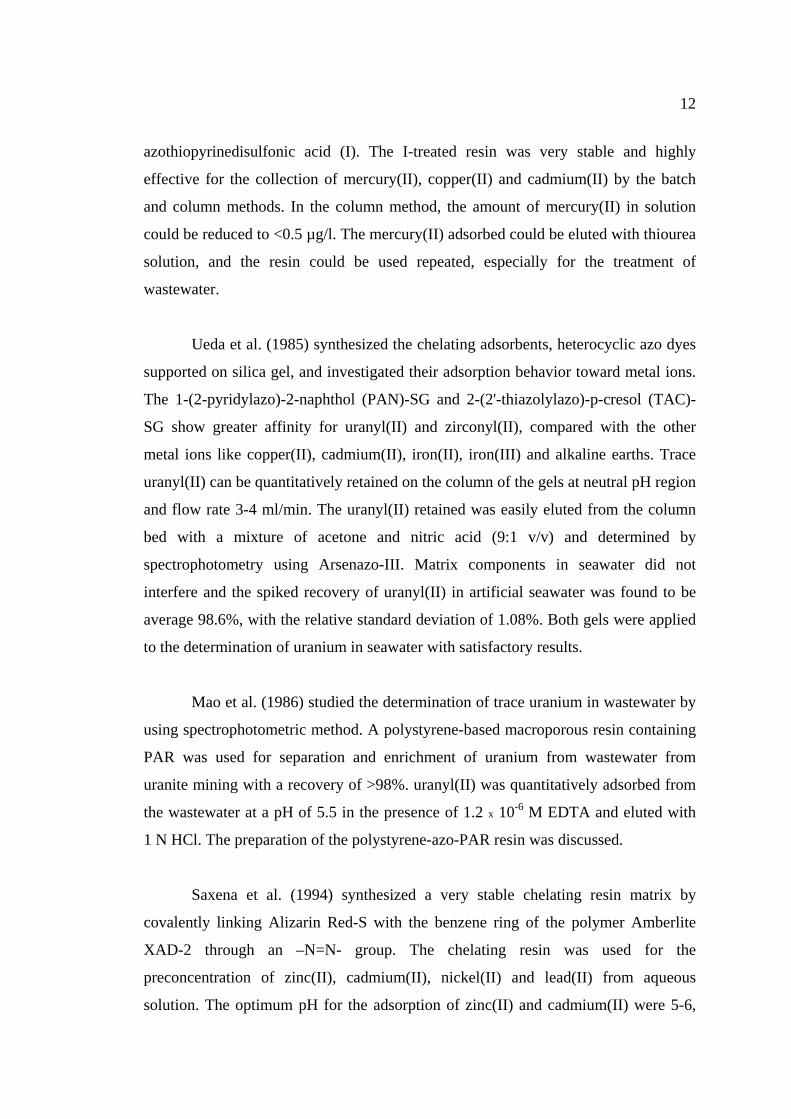
General properties of thiazolylazo dyes are red, violet or brownish in their
crystalline state, and only a few are readily soluble in water. However, their solubility
can be increased by the addition of organic solvent such as ethanol, dimethylformamide
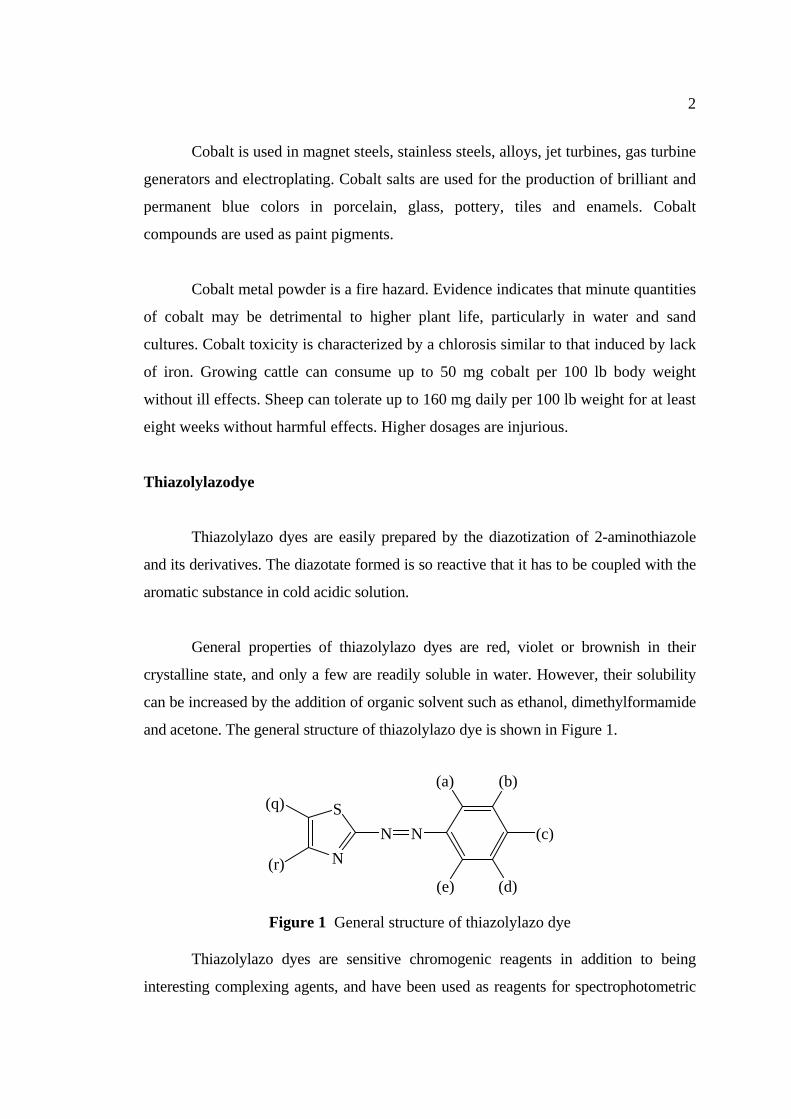
and acetone. The general structure of thiazolylazo dye is shown in Figure 1.
Figure 1 General structure of thiazolylazo dye
Thiazolylazo dyes are sensitive chromogenic reagents in addition to being
interesting complexing agents, and have been used as reagents for spectrophotometric
3
and extraction-photometric determinations of many metal ions. Some of them have also
proved to be particularly useful as indicators in complexometric titrations.
4-(2'-thiazolylazo)resorcinol (TAR) is the most widely used reagent, it is soluble
in strongly acidic solution, giving a red cation with an absorption maximum at 488 nm,
and in strongly alkaline solution, giving a red-violet anion with an absorption maximum
at 510 nm. TAR imparts a yellow color and an oranged-red color in neutral and dilute
acidic and dilute solutions of alkali, respectively (Busev, 1968). The dyes give colored
complexes with most metals, stable chelates being formed, especially with some of the
transition metals. In acidic and slightly acidic solutions, the metals form complexes
with the metal to ligand ratio of 1:1 or a mixture of complexes with ratios 1:1 and 1:2,
in alkaline solutions, the equilibrium is usually displaces towards the 1:2 complex
(Hovind, 1975).
The complexing reaction of TAR with some of the transition elements is very
slow because of the slow substitution of the aqua-complexes of these metals. Thus,
TAR reacts slowly with platinum, palladium, gold, rhodium, chromium, osmium,
ruthenium and iridium ions (Nickless, 1971).
Some of the reactions for complex formation of thiazolyazo dye lead to very
contrasting color changes. Thus palladium(II) forms blue complexes with 4-(5'-sulpho-
2'-thiazolylazo)resorcinol (STAR) in highly concentrated sulphuric acid solutions, the
color change being greater than that which occurs in weakly acidic solution (Oleinik,
1970).
For a thiazolylazo dye which has an amino group in the ortho position relative
to the azo group, the metal ion is bonded to the nitrogen of the amino group, the azo
group and the hetero atom of the thiazole ring, forming to five-membered rings.
In this work, TADAP is prepared by diazotization of 2-aminothiazole and
coupling with 2,6-diaminopyridine. The product is recrystallized and used as
chelating ligand for determination of cobalt(II).

4
Chelating resin
The use of adsorbents for preconcentration of trace elements has received
increasing attention in separation and analytical chemistry. In particular, chelating
resins and chelating reagent immobilized (adsorbed or chemically bonded) supports
have found widespread application for enrichment of aimed metals from a variety of
matrix. The imminodiacetate and alkylpolyamine containing chelating resins are
commonly employed for removal and preconcentration of trace heavy metals, and
macrocyclic hexaketone hexacarboxylic acid, and amidoxime resins have been
attempted for collection of uranium in seawater. Silica gel is relatively easy to
immobilize chelate ligand. Various chemically bonded gels have been prepared, e.g. ,
8-hydroxyquinoline, dithiocarbamates and dimethylglyoxime. Although they are
effective preconcentration aids with the fast metal ion exchange kinetics the low
swelling and the good thermal stability, preparations are troublesome and kinds of
silylation reagent are restricted. Terada et al. developed a variety of adsorbents, which
were simply prepared by impregnating chelating reagent on activated silica gel. The
gels were successfully used to preconcentrate and determine trace metals in natural
waters, e.g., 2-mercaptobenzothiazole-SG for copper(II), cadmium(II), lead(II) and
mercury(II), p-dimethylaminobenzilidenerhodanine-SG for gold(III), silver(I) and
lead(II), thionalide-SG for palladium(III), arsenic(III) and arsenic(V), and 1-nitroso-2-
naphthol for cobalt(II). They also examined silica gel, activated carbon and
polytrifluorochloroethylene powder and clarified that silica gel was most useful as a
carrier of chelating agents. Although these gels show low adsorption capacities of
metal ions, preparations of them can be freely designed according to the purposes
(Ueda, 1985).
Silica gel has been modified with chelating group in order to use in many filed
of application such as an ion exchanger, liquid chromatography. Of particular interest
is the used of these materials as adsorbent of metal ions from dilute solutions. The
preparation of chemically modified silica with organic molecules containing nitrogen,
sulfur, oxygen and the study of the adsorption of metal ions are great interesting.

5
Azo compounds containing a hetero ring are useful as the analytical reagents,
because their complexing properties are often specific. In the present study, several
chelating adsorbents, supported azo dyes on silica gel, were prepared and attempts
were made to evaluate their usefulness as a preconcentration aid for metal ions.
In this work, the chelating resin was prepared by using modified silica which
was immobilized with 3-(2'-thiazolylazo)-2,6-diaminopyridine (TADAP) for
separation of cobalt(II) from aqueous solutions and selectivity of this chelating resin
for cobalt(II) were studied.
6
LITERRATURE REVIEW
1. Synthesis of thiazolylazo derivatives and spectrophotometric determination
of metal ions
Busev et al. (1968) studied the methods which were given for the synthesis
and purification of 5-(2-thiazolylazo)-2,6-diaminopyridine (2,6-TADAP). The
maximum absorption wavelengths were given as a function of acidity (H2SO4 and
HCl in various concentrations). Molar extinction coefficients were calculated and
were given as a function of pH. 2,6-TADAP was not associated over a wide pH
range.
Garcia et al. (1982) studied 3-(2'-thiazolylazo)-2,6-diaminopyridine that
reacted with palladium(II) in strong HClO4 media, to produce a blue 1:1 complex
(λmax = 665 nm, ε = 1.37×10⁴ L mol-1 cm-1), which allowed the spectrophotometric
determination of 0.6-4.5 ppm palladium(II). The method was applied to determine
small amount of palladium(II) in samples of hydrogenation catalysts.
Gonzalez et al. (1983) studied ionization constants of the 3-(2′-thiazolylazo)-
2,6-diaminopyridine. They were determined at 25 °C by a spectrophotometric method
as pKa1 = -3.73 ± 0.03, pKa2 = 1.16 ± 0.02 and pKa3 = 4.19 ± 0.03. Formation
constant of the complexes with palladium(II) were also be investigated. In the
presence of Cl-, three complexes were formed, PdHLCl2+, PdHLCl2+ and PdHLCl3.
Gonzalez et al. (1986) studied the complexation equilibrium between
cobalt(III) and 3-(2'-thiazolylazo)-2,6-diaminobenzene (2,6-TADAB) and 3-(2'-
thiazolylazo)-2,6-diaminopyridine (2,6-TADAP) spectrophotometrically and
determined the protonation constants of the complexes. 2,6-TADAB (ε580 = 9.5 ±
104, H0 = 1.86) and 2,6-TADAP (ε595 = 1.16 ± 104 L mol-1 cm-1, H0 = 0.98) allowed
the determination of 0.024-0.47 and 0.12-2.36 ppm of cobalt(III), respectively. The
7
method using 2,6-TADAP was applied to the determination of cobalt(III) in low alloy
steels and hydrofining catalysts.
Perez et al. (1987) studied the complexation equilibrium between copper(II)
and 3-(2'-thiazolylazo)-2,6-diaminopyridine (I) and 3-(4'-methyl-2'-thiazolylazo)-2,6-
diaminopyridine (II) spectrophotometrically. The stability constants of the CuR2+
complexes (log β101) were 3.94 ± 0.03 and 3.98 ± 0.02 with I and II, respectively, and
those for Cu(OH)R+ (log β111) were 13.19 ± 0.11 and 13.14 ± 0.09, respectively,
where R = I or II. Both reagents were applied to the spectrophotometric determination
of copper(II) in low-alloy steels and Al-base alloys.
Shraydeh et al. (1992) studied the sensitive methods for the determination of
trace amounts of cobalt(II) and copper(II) by complexation with 3-(2'-thiazolylazo)-
2,6-diaminopyridine (2,6-TADAP). Copper(II) formed a 1:2 violet complex with the
reagent having a molar absorptivity of 1.00×10⁴ L mol-1 cm-1, Beer's law was obeyed
over the range 0-50.84 µg in the total volume of 10 mL. Cobalt(II) also formed a 1:1
green complex with a molar absorptivity of 1.07×10⁴ L mol-1 cm-1 and obeying Beer's
law over the range 0-23.57 µg in the total volume of 10 mL. The procedure was
simple and rapid without any complicate extension steps for copper(II) and without
oxidation of cobalt(II) to cobalt(III).
Oxspring et al. (1996) synthesized the chelating agent, 2-(5'-bromo-2'-
pyridylazo)-5-diethylaminophenol (PADAP), and found to be a good chromogenic
reagent for metal ions. Adsorptive stripping voltammetry (AdSV) is compared to
capillary zone electrophoresis (CZE) for the detection and determination of trace
concentrations of metal ions (cobalt(II), copper(II), cadmium(II), zinc(II), nickel(II)
and lead(II)) as their PADAP chelates. Limits of detection (LODs) for cadmium(II),
zinc(II), lead(II) and cobalt(II) were 8.3, 4.1, 3.0 and 0.5 x 10⁻⁸ M, respectively, using
the AdSV method with copper(II) and nickel(II) not giving reproducible cathodic
signals as their respective chelates. CZE was performed using 1 x 10⁻⁴ M PADAP in
the run buffer and gave higher LODs than AdSV but better selectivity.
8
Fan et al. (1998) synthesized the chromogenic reagents, 2-[2-(6-
methylbenzothiazolyl)azo]-5-(N-methyl-N-sulfomethyl)aminobenzoic acid (6-Me-
BTAMSB), 2-[2-(6-methylbenzothiazolyl)azo]-5-(N-ethyl-N-sulfomethyl)
aminobenzoic acid (6-Me-BTAESB) and 2-[2-(6-methylbenzothiazolyl)azo]-5-(N-
ethyl-N-carboxylmethyl) aminobenzoic acid (6-Me-BTAECB). Their
spectrophotometric characteristics were studied. In weak acid medium, they react with
nickel(II) to form blue-violet 2:1 complexes, the absorption maxima of which are at
642, 620 and 625 nm with apparent molar absorptivities of 8.81 x 10⁴, 8.22 x 10⁴ and
1.03 x 10⁵ l mol-1 cm-1, respectively. Beer’s law is obeyed over the ranges 0-7, 0-6 and
0-12 µg/25 ml nickel(II), respectively.
Bhalotra et al. (1999) used the fourth derivative spectrophotometry for the
trace determination of zinc using 1,2-(thiazolylazo)-2-naphthol (TAN) as an analytical
reagent and ammonium tetraphenylborate (ATPB) naphthalene as an adsorbent. Zn-
TAN was quantitatively retained on ATPB naphthalene in the pH range 6.5-9.5. The
calibration plot was linear in the concentration range 0.02-1.4 µg ml-1 Zn of DMF
solution. The sensitivity of the method as determined from the slope of the calibration
plot was 2.640 (d4A/dλ4)/ (µg ml-1). Nine replicate determinations of 5.0 µg of zinc in
5 ml of DMF gave a mean signal height of 2.660 (peak to peak height between λ1 =
597 nm and λ2 = 585 nm) with a relative standard deviation of 1.1%.
Hanna (1999) studied the complexation of para-Cl-phenylazo-R-acid azo dye
with palladium(II) spectrophotometrically. Protonation constant (pKa) of the ligand
was calculated and the stability constants of para-Cl-phenylazo-R-acid ligand with
palladium(II) ion was also be determined at a constant temperature (25.0°C), where
the molar ratio of this complex was 1:1 (metal:ligand) with log β1 = 3.75, and 1:2 with
log β2 = 8.55. Solid complex of para-Cl-phenylazo-R-acid was prepared and
characterized on the basis of elemental analysis and FTIR spectral data. A procedure
for the spectrophotometric determination of palladium(II) using para-Cl-phenylazo-R-
acid as a new azo chromophore was proposed where it was rapid, sensitive and highly
specific. Beer’s law was obeyed in the range 0.50–10.00 ppm at pH 5.0–6.0 to form a
violet–red complex (ε = 7.7×10 4 l-1 mol-1 cm-1 at λmax = 560 nm). Metal ions such as

9
copper(II), chromium(III), lanthanum(III), ytterbium(III), yttrium(III), and
rhodium(III) interfered with the complex. Ammonium salt of trimellitic acid such as
1,3,4-benzenetricarboxylic acid was used to precipitate some of the interfering ions
and a scheme for separation of palladium(II) from a synthetic mixture similar in
composition to platinum ore or deposit was made.
Kompany-Zareh et al. (1999) studied the spectrophotometric method for the
determination of copper(II) and nickel(II) by the use of diethyldithiocarbamate
(DDTC) as a chelating agent in the presence of aqueous anionic micellar medium of
sodium dodecyl sulfate (SDS). A partial least-squares procedure was used to access
data obtained from the calibration solutions. The operated method was validated by
applying it to the analysis of synthetic mixtures over the concentration ranges 0-286
µmol Cu/ml and 0-619 µmol Ni/ml. The relative errors in determinations were less
than 5 % in most cases.
Zareba and Melke (1999) used azo dyes, derivatives of 1,2,4-triazole and
pyrocatechine: 3-(3',4'-dihydroxyphenylazo-1')-1,2,4-triazole (TRIAP) and
3-(3',4'-dihydroxyphenylazo-1')-5-mercapto-1,2,4-triazole (METRIAP) for
spectrophotometric determination of aluminum(III). In aqueous-methanolic solution
at pH 6.20-6.50, aluminum ion formed stabile orange chelates. Molar ratio of L:
aluminum was 2:1 (TRIAP) or 3:1 (METRIAP). Other components of these
preparations, particularly magnesium(II), did not interfere the determination of
aluminium(III). The advantage of the developed method was easy to synthesize the
reagent, simple analytical procedure, stability of formed complexes and accuracy of
results.
Zhao et al. (1999) studied the synthesis and analytical reactions of a new
reagent, 5-(6-methoxy-2-benzothiazoleazo)-8-aminoquinoline (MBTAQ), with
cobalt(II) and nickel(II). In the presence of the cationic surfactants
cetyltrimethylammonium bromide (CTAB) and borax buffer solution, cobalt(II) and
nickel(II) form blue coloured, 1:2 and 1:3 (metal: ligand) complexes with MBTAQ,
respectively. The apparent molar absorptivities were 1.15 x 10⁵ l mol-1 cm-1 for
10
cobalt(II) and 1.28 x 10⁵ l mol-1 cm-1 for nickel(II) at 655 and 623 nm. The method
obey Beer’s law for 0-0.40 µg ml-1 of cobalt(II) and 0-0.32 µg ml-1 of nickel(II) and
detection limit were 0.00050 and 0.00045 µg ml-1.
Toral et al. (2000) studied a second derivative spectrophotometric method that
had been developed for the determination of palladium(II) and platinum(IV) in
mixtures. The method was based on the formation of the platinum(IV) and
palladium(II) complexes with 3-(2-thiazolylazo)-2,6-diaminopyridine, (2,6-TADAP),
in the presence of 1.7 M perchloric acid solution, upon heating at 90 °C for 30 min
and on the subsequent direct derivative spectrophotometric measurement. The zero-
crossing approach and the graphic method were used for determination of
platinum(IV) and palladium(II), respectively. Each analyte was determined in the
presence of one another in the ranges of 8.9x10⁻⁷ to 3.1x10⁻⁵ M for platinum(IV) and
4.6x10⁻⁷ to 6.8x10⁻⁵ M, for palladium(II). The detection limits achieved (3σ) were
found to be 2.7x10⁻⁷ M of platinum(IV) and 1.4x10⁻⁷ M of palladium(II). The relative
standard deviations were in all instances less than 1.0%. This work was also included
a study of effect of interferences and the application of the proposed method in
synthetic mixtures.
Amin et al. (2002) studied the complexation of yttrium(III) with 5-(4'-
chlorophenylazo)-6-hydroxypyrimidine-2,4-dione (I), 5-(2'-bromophenylazo)-6-
hydroxypyrimidine-2,4-dione (II), 5-(2',4'-dimethylphenylazo)-6-hydroxypyrimidine-
2,4-dione (III), 5-(4'-nitro-2',6'-dichlorophenylazo)-6- hydroxypyrimidine-2,4-dione
(IV), 5-(2'-methyl-4'-hydroxyphenylazo)-6- hydroxypyrimidine-2,4-dione (V). The
complex formation was completed spontaneously in buffer solution and the resulting
complex was stable for at least 3 h after dilution. Under the optimum conditions
employed, the molar absorptivities were found to be 1.60 x 10⁴, 1.29 x 10⁴, 1.96 x 10⁴,
1.45 x 10⁴ and 1.21 x 10⁴ l mol-1 cm-1 and the molar ratios were (1:1) and (1:2) (M:L).
The linear ranges were found within 95 µg of yttrium(III) in 25 ml solution. One of
the characteristics of the complex was its high tolerance for calcium and hence a
method of separation and enrichment of amounts of yttrium(III) by using calcium
11
oxalate precipitation was developed and applied to measure yttrium(III) in nickel-base
alloys.
Hashem et al. (2002) studied the solution properties of nickel(II) complex with
4-(2'-benzo-thiazolylazo) salicylic acid (BTAS) by zero-order absorption
spectrophotometry in 40 % (v/v) ethanol at 20oC. The equilibria that exist in solution
were established and the basic characteristics of complexes formed were determined.
A new direct spectrophotometric method for the determination of trace amounts of the
nickel(II) was proposed based on the formation of the nickel(II) (BTAS) complex at
pH 7.0. The absorption maximum and molar absorbtivity were 525 nm and 0.6 x 10⁴ l
mol-1 cm-1, respectively. The use of first-derivative spectrophotometry eliminated the
interference of iron(III) and enabled the simultaneous determination of nickel(II) and
iron(III) using BTAS. Quantitative determination of nickel(II) and iron(III) were
possible in the range 0.59-7.08 and 2.1-8.4 µg ml-1, respectively with a relative
standard deviation of 0.5%.
Salazar and Toral (2004) synthesized 3-[2´-thiazolylazo]-2,6-diaminopyridine
or 2,6-TADAP and used as chromophore reagent for the determination of metals of
the platinum group. In this work, a study on stability of the 2,6-TADAP, a synergetic
action of the temperature, the reaction time and the acidity of the medium were also
be investigated. According to spectral behavior it could be postulated that 2,6-
TADAP ligand suffers structural changes, having as consequence the formation of
another azo compound. Besides, the mechanism of decomposition and
characterization of the formed compound was also included. The characteristic
chemical of new azo compound was appropriate for the development of analytic
methods for the determination of metals belonging to the platinum group, using the
new ligand called 3-[N,N-ethyl-met-azo]-2,6-diaminopyridine or 2,6-DAPEMA.
2. Preparation of chelating resin for separation of metal ions
Nakayama et al. (1982) prepared a new chelate-forming resin bearing –SH and
azo groups from a common anion-exchange resin by treatment with
12
azothiopyrinedisulfonic acid (I). The I-treated resin was very stable and highly
effective for the collection of mercury(II), copper(II) and cadmium(II) by the batch
and column methods. In the column method, the amount of mercury(II) in solution
could be reduced to <0.5 µg/l. The mercury(II) adsorbed could be eluted with thiourea
solution, and the resin could be used repeated, especially for the treatment of
wastewater.
Ueda et al. (1985) synthesized the chelating adsorbents, heterocyclic azo dyes
supported on silica gel, and investigated their adsorption behavior toward metal ions.
The 1-(2-pyridylazo)-2-naphthol (PAN)-SG and 2-(2'-thiazolylazo)-p-cresol (TAC)-
SG show greater affinity for uranyl(II) and zirconyl(II), compared with the other
metal ions like copper(II), cadmium(II), iron(II), iron(III) and alkaline earths. Trace
uranyl(II) can be quantitatively retained on the column of the gels at neutral pH region
and flow rate 3-4 ml/min. The uranyl(II) retained was easily eluted from the column
bed with a mixture of acetone and nitric acid (9:1 v/v) and determined by
spectrophotometry using Arsenazo-III. Matrix components in seawater did not
interfere and the spiked recovery of uranyl(II) in artificial seawater was found to be
average 98.6%, with the relative standard deviation of 1.08%. Both gels were applied
to the determination of uranium in seawater with satisfactory results.
Mao et al. (1986) studied the determination of trace uranium in wastewater by
using spectrophotometric method. A polystyrene-based macroporous resin containing
PAR was used for separation and enrichment of uranium from wastewater from
uranite mining with a recovery of >98%. uranyl(II) was quantitatively adsorbed from
the wastewater at a pH of 5.5 in the presence of 1.2 x 10⁻⁶ M EDTA and eluted with
1 N HCl. The preparation of the polystyrene-azo-PAR resin was discussed.
Saxena et al. (1994) synthesized a very stable chelating resin matrix by
covalently linking Alizarin Red-S with the benzene ring of the polymer Amberlite
XAD-2 through an –N=N- group. The chelating resin was used for the
preconcentration of zinc(II), cadmium(II), nickel(II) and lead(II) from aqueous
solution. The optimum pH for the adsorption of zinc(II) and cadmium(II) were 5-6,
13
for nickel(II) and lead(II) were 3-4 and 6, respectively. Zinc(II), cadmium(II),
nickel(II) and lead(II) were eluted from the chelating resin by 4 M hydrochloric acid,
1 M nitric acid, 4 M hydrochloric acid and 3 to 4 M nitric acid, respectively. The
adsorption capacities of the resin were 511, 124, 135 and 306 µg/g of the resin for
zinc(II), cadmium(II), nickel(II) and lead(II), respectively.
Lemos et al. (1998) used polyurethane foam modified by 2-(2'-
benzothiazolylazo)-2-p-cresol (B-TAC) as an adsorbent for determination of
cadmium(II) trace levels. It was found that pH had effect on the adsorption of
cadmium(II) on B-TAC. The adsorption of cadmium(II) by B-TAC was investigated
within the pH range of 6.50 to 9.25. It was found that the maximum adsorption of
cadmium(II) was achieved at pH 9 in the ammonium buffer solution. Cadmium(II)
was eluted from the column by using hydrochloric acid at various concentrations as
eluents. The results showed that 0.1 M hydrochloric acid was the most suitable eluent
for desorption of cadmium(II) from B-TAC.
Kumar et al. (2000) synthesized a stable chelating resin matrix by covalently
linking o-aminophenol (o-AP) with the benzene ring of the polystyrene-
divinylbenzene resin, Amberlite XAD-2, through a –N=N- group. It was used to
preconcentrate copper(II), cadmium(II), cobalt(II), nickel(II), zinc(II) and lead(II),
prior to their determination by flame atomic absorption spectrometry. The optimum
pH values for quantitative sorption of copper(II), cadmium(II), cobalt(II), nickel(II),
zinc(II) and lead(II) were 6.2-7.4, 5.6-7.2, 5.6-9.0, 6.0-9.0, 5.7-7.0 and 5.0-6.0,
respectively. These metals are desorbed (recovery 91-98%) with 4 M nitric acid. The
sorption capacity of the resin is 3.37, 3.42, 3.29, 3.24, 2.94 and 3.32 mg of metal g-1
of resin, respectively, for copper(II), cadmium(II), cobalt(II), nickel(II), zinc(II) and
lead(II).
Krysztafkiewicz et al. (2002) studied the adsorption of several organic dyes on
a modified silica surface. For this purpose, ethylene glycol (EG)-silica was applied,
precipitated from sodium metasilicate solution using carbon dioxide in presence of
ethylene glycol. In order to promote their interaction with dyes, the silica surface was
14
modified using silane coupling agents with the amino functional group. Technique of
conducting the adsorption process was discussed. Studies on morphology and
microstructure were performed employing scanning electron microscopy (SEM).
Particle size distribution was also examined using the technique of dynamic light
scattering. The SEM micrographs and particle size distributions showed that highly
uniform pigments can be obtained employing EG-silica as a core. Studies on elution
of dyes from the silica surface demonstrated that, in general, stable pigments were
obtained.
Tawari and Singh (2002) prepared four chelating matrices by coupling
Amberlite XAD-2 with chromotropic acid (AXAD-2-CA or 1), pyrocatechol (AXAD-
2-PC or 2) and thiosalicylic acid (AXAD-2-TSA or 3) and impregnation of Amberlite
XAD-7 with xylenol orange (AXAD-7-XO or 4). All the four resins quantitatively
adsorbed lead(II) at pH 3-8 when the flow rate was maintained between 2 and 10 ml
min-1. Nitric acid (0.5-4.0 M) eluted lead(II) from all the chelating resins. The
adsorption capacity was in the range 16.0-186.0 µmol g-1. The limit of detection and
limit of quantification found in ranges 2.44-7.87 and 2.76-8.64 ng ml-1, respectively.
Barbette et al. (2004) synthesized the new modified silica gels, namely N-
tripropionate (or N-triacetate)-substituted tetraazzmacrocycles-bound silica gels, for
the extraction of uranium(VI). The effect of the nature of the ligand, the pH and the
temperature was studied both in bath experiments as well as in continuous extraction.
These silica gels were better than a commercially available acid-type chelating resin
for the extraction of uranium(VI). The results showed that the total removal of
uranium(VI) from a contaminated solution can be achieved by using a column packed
with such tetraazamacrocycles-bound silica gels.
Esteves et al. (2005) prepared a new hydroxypyrimidinone-functionalized
silica, (HOPY-PrN)-Si, with high affinity for hard metal ions. The new chelating
matrix was obtained by coupling a 1-hydroxy-2-(1H)-pyrimidinone derivative,
HOPY-PrN, to an epoxy-activated silica. It showed good stability at neutral and acidic
conditions and high sequestering capacity for hard metal ions, namely iron(III) and
15
aluminium(III). However, the presented silica-gel derivative was considerably less
expensive and also gave support to its potential interest as a adsorbent of traces hard
toxic metal ions from water streams or even from physiological fluids.
Hassanien and Abou-El-Sherbini (2005) prepared the aminopropylsilica gel
(APSG) by linking silica gel with aminopropyltrimethoxysilane. The APSG was
reacted subsequently with morin yielding morin-bonded silica gel (morin-APSG).
Morin-APSG was found to be highly stable in common organic solvents, acidic
medium (<2 M hydrochloric acid and nitric acid) or alkaline medium up to pH 8. The
separation and preconcentration of silver(I), gold(III), palladium(II), platinum(II) and
rhodium(III) from aqueous medium using morin-APGS were studied. The optimum
pH values for the separation of silver(I), gold(III), palladium(III), platinum(II) and
rhodium(III) on the adsorbent were 5.7, 2.2, 3.7, 3.7 and 6.8, giving rise to separation
efficiencies of 43.9, 85.9, 97.7, 60.9 and 91.0 %, respectively, where the activity was
found to be >90 % in the presence of acetate ion. The ion adsorption capacity of
morin-APSG towards copper (II) at pH 5.5 was found to be 0.249 mmol g-1 where the
adsorption capacities of silver(I) and palladium(III) were 0.087 and 0.121 mmol g-1
and 0.222 and 0.241 mmol g-1 at pH 2.2 and 5.7, respectively. Complete elution of the
adsorbed metal ions was carried out using 10 ml (0.5 M hydrochloric acid + 0.01 M
thiourea) in case of gold(III), palladium(III), platinum(II) and rhodium(III) and 10 ml
0.5 M nitric acid in case of silver(I).
Jesionowski et al. (2005) studied the physicochemical analysis on silicas
precipitated according to a novel method, in an emulsion system. Substrates for the
process involved solutions of sodium metasilicate and sulphuric acid while the
organic phase consisted of cyclohexane and non-ionic emulsifiers. The silicas were
used to obtain hybrid structures of the formed inorganic pigments. For this purpose,
the adsorption of organic dyes on the silica surface was preceded by modification of
the surface with silane coupling agent containing amine groups. Stable pigments were
obtained on silica core, the surface of which was modified with N-2-(aminoethyl)-3-
aminopropyltrimethoxysilane. Particles of the obtained pigment manifested a
spherical shape and particle size distribution proved that no agglomerate structures
16
were presented. High stability of the obtained pigments proved that the organic dye
was chemically bound to the modified silica surface.
Madrakian et al. (2005) synthesized a new modified silica gel using 2,4,6-
trimorpholino-1,3,5-triazin. The modified silica gel was used for separation,
preconcentration and determination of silver ion in natural water by atomic absorption
spectrometry (AAS). This new bonded silica gel was used as an effective adsorbent
for the solid-phase extraction (SPE) of silver ion from aqueous solutions.
Experimental conditions for effective adsorption of trace levels of silver ion were
optimized with respect to different experimental parameters in column process.
Common coexisting ions did not interfere with the separation and determination of
silver at pH 3.5 so that silver ion completely adsorbed on the column. The accuracy of
the method was estimated by using spring and tap water samples that were spiked
with different amounts of silver ion. The adsorption isotherm of silver ion was
obtained. The capacity of the adsorbent at optimum conditions found to be 384 µg of
silver per gram of adsorbent.
Ngeontae et al. (2006) synthesized silica gel which chemically bonded with
aminothioamidoanthraquinone. The metal adsorption properties of the modified silica
were studied towards lead(II), copper(II), nickel(II), cobalt(II) and cadmium(II). For
batch method, the optimum pH ranges for lead(II), copper(II) and cadmium(II)
extraction were >3 but for nickel(II) and cobalt(II) extraction were > 4. The contact
times to reach the equilibrium were less than 10 min. The adsorption isotherm fitted
the Langmuir’s model showed the maximum adsorption capacities of 0.56, 0.30, 0.15,
0.12 and 0.067 mmol/g for lead(II), copper(II), nickel(II), cobalt(II) and cadmium(II),
respectively. In the flow system, a column packed modified silica at 20 mg for
lead(II) and copper(II), 50 mg for cadmium(II), 60 mg for cobalt(II), nickel(II) was
studied at a flow rate of 4 and 2.5 ml/min for nickel(II). The adsorbed metals were
quantitatively eluted by 1 % nitric acid. The application of this modified silica gel to
preconcentration of pond water, tap water and drinking water gave high accuracy and
precision (% R.S.D. < 9).
17
MATERIALS AND METHODS
Materials
1. Apparatus
Absorbance measurements were carried out on a Perkin Elmer Lamda 35 UV-
Vis spectrophotometer. Perkin Elmer 1100B Atomic absorption spectrophotometer
was used for the quantitative determination of cobalt(II). The instrument was operated
under air-acetylene flame with analytical wavelength at 240.7 nm. Infrared spectra
(4000-200 cm-1) were obtained by a Perkin Elmer system 2000 Fourier transform
infrared spectrometer. Nuclear magnetic resonance spectra were recorded at 400 MHz
on a Bruker Advance DPX-400. An elemental analyzer was performed with a Perkin
Elmer series II CHNS/O analyzer 2400. The pH values were measured by using an
Inolab level 1-pH meter.
2. Reagents
- 2-aminobenzothiazole (C7H6N2S, Lab. grade, Fluka, Buchs, Switzerland)
- Sodium nitrite (NaNO2, Lab. grade, Merck, Darmstadt, Germany)
- 2,6-diaminopyridine (C5H7N3, Lab grade, Acros organics, New Jersey,
U.S.A.)
- Sodium acetate trihydrate (CH3COONa.3H2O, Lab. grade, BDH, Poole,
England)
- Cobalt standard for atomic absorption 1000 mg/l (Co(NO3)2, AR. grade,
Carlo Erba, Milan, Italy)
- Iron standard for atomic absorption 1000 mg/l (FeCl3.6H2O, AR. grade,
Carlo Erba, Milan, Italy)
- Nickel standard for atomic absorption 1000 mg/l (NiCl2.6H2O, AR.
grade, Carlo Erba, Milan, Italy)
18
- Cadmium standard for atomic absorption 1000 mg/l (AR. grade, Carlo Erba,
Milan, Italy)
- Lead standard for atomic absorption 1000 mg/l (Pb(NO3)2, AR. grade, Carlo
Erba, Milan, Italy)
- Potassium hydrogen phosphate (K2HPO4, Lab. grade, Fisher scientific
company, U.S.A.)
- Thiourea (H2NCSNH2 , AR. grade, Merck, Darmstadt, Germany)
- Ethylenediamine tetraacetic acid (C8H16N2O8, AR. grade, Ajax chemicals,
N.S.W., Australia)
- Sodium hydroxide (NaOH, AR. grade, Merck, Darmstadt, Germany)
- Sodium dihydrogen phosphate (NaH2PO4, AR. grade, Merck,
Darmstadt, Germany)
- Sodium phosphate (Na3PO4, AR. grade, J.T. Baker Chemicals, Deventer,
Holland)
- Sodium oxalate (Na2C2O4, AR. grade, Merck, Darmstadt, Germany)
- Potassium thiocyanate (KSCN, AR. grade, J.T. Baker, Phillipsburg, NJ, U.S.A.)
- Potassium bromide (KBr, AR. grade, Merck, Darmstadt, Germany)
- Potassium iodide (KI, AR. grade, Merck, Darmstadt, Germany)
- Citric acid (C6H8O7, AR. grade, APS Finechem, Seven Hills, Australia)
- Boric acid (H3BO3, AR. grade, Fisher Chemicals, Leicestershire. UK)
- Nitric acid (HNO3, Lab. grade, Carlo Erba, Rodano, Milan, Italy)
- Perchloric acid (HClO4, Lab. grade, Lab Scan, Bangkok, Thailand)
- Hydrochloric acid (HCl, Lab. grade, Lab Scan, Bangkok, Thailand)
- Dimethylsulfoxide, D-6 (C2D3OS, AR. grade, Merck, Darmstadt, Germany)
- Ethyl alcohol (CH3CH2OH, AR. grade, Mallinckrodt, St. Louis, Missouri,
U.S.A.)
- Silica gel (SiO2, Lab. grade, Merck, Darmstadt, Germany)
- (3-chloropropyl)trimethoxysilane (C6H15ClO3Si, AR. grade, Fluka, UK)
- Deionized water

19
Methods
1. Synthesis of 3-(2'-thiazolylazo)-2,6-diaminopyridine (TADAP
)
A gram of 2-aminothiazole was dissolved in 16 ml of 6 M hydrochloric acid
and cooled in an ice-bath. Sodium nitrite (0.70 g) was dissolved in a small amount of
water. Nitrite solution was slowly poured into the 2-aminothiazole solution while
stirring with a glass rod under low temperature (-5 to 0 °C). The solution of
diazonium salt was slowly poured while stirring into a well cooled solution of 2,6-
diaminopyridine (1.0 g) in 40 ml of 4 M hydrochloric acid. The mixture was stirred in
the ice-bath for 1 hour and then 0.001 M sodium hydroxide solution was added into
the mixture until pH 6 was reached. A red precipitate began to settle immediately. The
solution was filtered and the precipitated was washed with water and air-dried to give
3-(2′-thiazolylazo)-2,6-diaminopyridine (TADAP). The crude product was purified by
recrystallization with a mixture of ethanol-water (1:3) to give red needle-shaped
crystal with melting point of 209-210 °C. The resultant product was characterized by
FTIR, 1H NMR, MS and elemental analysis.
2. Preparation of solutions
2.1 Preparation of universal buffer solutions
Universal buffer solutions used in this work were prepared by mixing of
mixture of 0.20 M boric acid and 0.05 M citric acid (1:1) with 0.10 M Na3PO4 at
various ratio as shown in Table2.

20
Table 2 The preparation of universal buffer solutions at pH 3.0 to 11.0
pH
Mixture of 0.20 M boric acid and 0.05 M citric acid
(1:1) (ml)
0.10 M Na3PO4 (ml)
3.0 176 24
4.0 155 45
5.0 134 66
6.0 118 82
7.0 99 101
8.0 85 115
9.0 69 131
10.0 54 146
11.0 44 156
2.2 Preparation of 1.0 x 10⁻³ M TADAP
For the preparation of 1.0 x 10⁻³ M, 0.0055 g of TADAP was dissolved
and made up to 25.00 ml by 0.10 M HClO4 in volumetric flask.
2.3 Preparation of 1.0 x 10⁻³ M cobalt(II) solutions
For the preparation of 1.0 x 10⁻³ M cobalt(II), 1.47 ml of standard solution
of cobalt nitrate (1000 ppm) was added in a 25.00 ml volumetric flask and diluted to
the marked by deionized water.
3. Complex formation between TADAP and cobalt(II)
TADAP is thiazolylazo dye, which gives color complex with many metals
especially with transition metals. The reaction of TADAP with cobalt(II) at various
pH was investigated in order to determine the suitable pH for studying on the
formation of complex between cobalt(II) and TADAP. The following procedure for

21
formation of complex was used in this work. Pipetted 0.50 ml of 1.0 x 10⁻³ M TADAP
into 25.00 ml volumetric flasks and then 0.50 ml of 1.0 x 10⁻³ M cobalt(II) ions
solution in buffer solution (pH range 3.0 to 11.0) was pipetted into previous
volumetric flasks. After 90 minutes, complex between cobalt(II) and TADAP was
studied by spectrophotometric method. The results are shown in Figures 5 to 7.
4. Stoichiometric determination of complex between TADAP and cobalt(II) by
continuous variation method.
From the studying on the complex formation in the previous section, the
suitable pH for studying on the stoichiometric determination of cobalt(II) complex
was at pH 9.0, 10.0 and 11.0.
Pipetted 0.00, 0.10, 0.20, 0.30, 0.40, 0.50, 0.60, 0.70, 0.80, 0.90 and 1.00 ml
of 1.0 x 10⁻³ M cobalt(II) into each of eleven 25.00 ml volumetric flasks. Then 1.00,
0.90, 0.80, 0.70, 0.60, 0.50, 0.40, 0.30, 0.20 and 0.10 ml of 1.0 x 10⁻³ M TADAP were
pipetted into each volumetric flasks, respectively. The solutions were diluted to mark
with universal buffer solution. After 90 minutes, the absorbance of the solutions were
measured by UV-Vis spectrophotometer at 598 nm. The result at pH 10 is shown in
Figure 10.
5. Stability of complex between TADAP and cobalt(II)
The stability of complex between TADAP and cobalt(II) was observed by
measuring the absorbance at wavelength 598 nm in universal buffer solution of pH
10.0 at every five minutes over a period of 3 hours. The result is shown in Figure 11.
22
6. Determination for stability constant of complexes between TADAP and
cobalt(II)
The Benesi-Hildebrand’s equation used to determine the stability constant of
complex between TADAP and cobalt(II). The cobalt(II) complex solution was
prepared by mixing various amount of TADAP solution into a constant volume of
8 x 10⁻⁶ M cobalt(II) solution. The concentration of TADAP was varied between
4 x 10⁻⁶ M and 2.4 x 10⁻⁵ M. The series of complex solution were prepared in universal
buffer solution of pH 10.0. The absorbances of the complex solutions were measured
by UV-Vis spectrophotometer at the wavelength 598 nm. The calculation of stability
constant between cobalt(II) and TADAP is shown in Appendix A.
7. Structural determination of complex between TADAP and cobalt(II)
The complex was prepared by mixing 1.0 x 10⁻³ M TADAP solution with
1.0 x 10⁻³ M cobalt(II) solution (2:1) at pH 10.0. The precipitate of the complex was
taken at room temperature and then filtered off and washed with distilled water.
Finally, the precipitate of complex was dried at room temperature under low pressure
and studied by using FTIR spectrophotometer, 1H-NMR and elemental analyzer.
8. Determination of linear range and detection limit of complex between TADAP
and cobalt(II)
8.1 Linear range
Pipetted 0.10, 0.20, 0.30, 0.40, 0.50, 0.70, 0.90, 1.10, 1.30 and 1.50 ml of
1.0 x 10⁻³ M TADAP into each ten 25.00 ml volumetric flask and then 0.10 ml of
1.0 x 10⁻³ M cobalt(II) was pipetted into each ten 25.00 ml volumetric flask and made
up to 25.00 ml by universal buffer solution of pH 10.0. After 90 minutes the
absorbance of the solutions were measured by UV-Vis spectrophotometer of 598 nm.
23
Pipetted 0.50 ml of 1.0 x 10⁻³ M TADAP into ten 25.00 ml volumetric
flask. And then, pipetted 0.025, 0.050, 0.075, 0.100, 0.125, 0.150, 0.175, 0.20, 0.225
and 0.250 ml of 1.0 x 10⁻³ M cobalt(II) into each ten 25.00 ml volumetric flask. The
solutions were made up to 25.00 ml by universal buffer solution of pH 10.0. After 90
minutes, the absorbances of the solutions were measured by UV-Vis
spectrophotometer at 598 nm. The result is shown in Figure 14.
8.2 Detection limit
The limit of detection of cobalt(II) as complex between TADAP and
cobalt(II) was examined by linear calibration graph. Series of complex solution were
prepared over a concentration range of 2.0 x 10⁻⁶ M to 1.2 x 10⁻⁵ M of cobalt(II).
Pipetted 0.50 ml of 1.0 x 10⁻³ M TADAP into six 25.00 ml volumetric flasks and
mixed with 0.025, 0.050, 0.075, 0.10, 0.125 and 0.150 ml of 1.0 x 10⁻³ M cobalt(II) ,
respectively. The solutions were made up to 25.00 ml by universal buffer solution of
pH 10.0. After 90 minutes, the absorbance of the solutions were measured by UV-Vis
spectrophotometer at 598 nm. The result is shown in Figure 15.
9. Investigation of interfering cations and anions for complex formation between
TADAP and cobalt(II)
9.1 Cations interference
The degree of interference of five cations (cadmium(II), sodium(I),
nickel(II), calcium(II) and iron(III)) on the complex formation between TADAP and
cobalt(II) were investigated. Series of complex solution were prepared by mixing
0.50 ml of 1.0 x 10⁻³ M TADAP with 0.10 ml of 1.0 x 10⁻³ M cobalt(II) in the
presence of cations at various concentration ratios to cobalt(II) (cobalt(II):interfering
cation was 1:1, 1:25, 1:50, 1:75 and 1:100 respectively). Each solution was made up
to volume with universal buffer solution of pH 10.0 in 25.00 ml volumetric flask.
After 90 minutes, the absorbance of the complex solutions were measured against
reagent blank by UV-Vis spectrophotometer at 598 nm. The presence of cations that

24
caused change of absorbance in range of 95% confidential was accepted as non-
significant interfering effect. The result is shown in Table 6.
9.2 Anions interference
The degree of interference of nine anions (iodide, EDTA, oxalate,
thiocyanate, thiourea, cyanide, phosphate, bromide and acetate ions) on the complex
formation between TADAP and cobalt(II) were investigated. Series of complex
solution were prepared by mixing 0.50 ml of 1.0 x 10⁻³ M TADAP with 0.10 ml of
1.0 x 10⁻³ M cobalt(II) in the presence of anions at various concentration ratios to
cobalt(II) (cobalt(II):interfering anion was 1:1, 1:25, 1:50, 1:75 and 1:100). Each
solution was made up to volume with universal buffer solution of pH 10.0 in 25.00 ml
volumetric flask. After 90 minutes, the absorbance of the complex solutions were
measured against reagent blank by UV-Vis spectrophotometer at 598 nm. The
presence of anions that caused change of absorbance in range of 95% confidential was
accepted as non-significant interfering effect. The results are shown in Table 6.
9.3 Masking of interfering cations
The masking efficiency of several complexing agents such as EDTA,
oxalate, thiourea, thiocyanate and iodide were examined in order to eliminate the
effect from interfering metal ions. Series of complex solution were prepared by
mixing 0.50 ml of 1.0 x 10⁻³ M TADAP with 0.10 ml of 1.0 x 10⁻³ M cobalt(II) in the
presence of interfering metal ions at ratio cobalt(II):metal ion, 1:25. Masking agent
was added to the complex by various ratio to cobalt(II) (cobalt(II):masking agent was
1:25, 1:50 and 1:100). Each solution was made up to volume with universal buffer
solution of pH 10.0 in 25.00 ml volumetric flask. After 90 minutes, the absorbance of
the complex solutions were measured against reagent blank by UV-Vis
spectrophotometer at 598 nm. The presence of masking agent that caused change of
absorbance in range of 95% confidence was accepted as non-significant interfering
effect. The results are shown in Table 7.
25
10. The determination of cobalt(II) in synthetic solutions
TADAP was used as analytical reagent for determination of cobalt(II) by
spectrophotometric method. Synthetic mixture solutions of cobalt(II) and interfering
metal ions were prepared by mixing aliquots of 1.0 x 10⁻³ M of cobalt(II) with various
concentration of each metal ion. The first series, the molar concentration ratio of
cobalt(II): nickel(II) was 100:1, which was prepared by pipetted 0.275 ml of
1.0 x 10⁻³ M cobalt(II) and 0.275 ml of 0.275 ml of 1.0 x 10⁻⁵ M nickel(II) solution.
Then, the 1.50 ml of 1.0 x 10⁻³ M TADAP was added into solution and diluted to
25.00 ml by universal buffer solution of pH 10.0. The second series, the molar
concentration ratio of cobalt(II):cadmium(II) was 100:1. The final concentration of
cobalt(II) in each series was 1.1 x 10⁻⁵ M. The synthetic solutions were determined by
UV-Vis spectrophotometer and the results were compared with the quantity of
cobalt(II) from the complexing solution between 1.1 x 10⁻⁵ M cobalt(II) and TADAP.
11. Preparation of 3-(2΄-thiazolylazo)-2,6-diaminopyridine resin (Si-TADAP)
Silica gel (50g) suspended in 200 ml of dried toluene was refluxed and
mechanically stirred under nitrogen atmosphere for 2 hours. To this suspension, 20 ml
of chloropropyltriethoxysilane was added drop wise and the mixture was under reflux
for 24 hours. The solid was filtered and washed with ethanol. This modified silica gel
was dried in vacuum at room temperature. Seven and half grams of the modified silica
gel was suspended in 100 ml of dried toluene, under reflux while being mechanically
stirred with 1.0 g of TADAP for 12 hours. The immobilized silica gel, namely
Si-TADAP, was filtered off and washed with 0.50 M hydrochloric acid, 0.50 M
sodium hydroxide and distilled deionized water until the filtrate was colorless. The Si-
TADAP was dried at room temperature at low pressure condition. The resultant
product was characterized by FTIR and elemental analysis as shown in Figure 17, 18
and 19 and Table 11 and 12.
26
12. Determination of capacity for the adsorption of cobalt(II) by Si-TADAP
The adsorption of cobalt(II) was studied under static condition. To determined
the capacity of Si-TADAP, the influence of various parameter such as pH, initial
concentration of metal ion and shaking time were optimized under static condition by
using batch equilibrium experiment.
The experiment conditions for studying on the influence of various parameters
on the adsorption of cobalt(II) on Si-TADAP were as follows;
Effect of pH: Capacity of Si-TADAP was determined at the pH from 3.0 to
9.0. The pH of the solution in each experiment was adjusted by universal buffer
solutions. Fifty milligrams of Si-TADAP was equilibrated with 10 ppm cobalt(II)
solution, which were prepared in universal buffer solution at pH 3.0, 4.0, 5.0, 6.0, 7.0,
8.0 and 9.0. Then the mixture was shaken for 3 hours. After the mixture were filtered,
the filtrates were determined for cobalt(II) by atomic absorption spectrophotometer.
The results are shown in Figure 20.
Effect of concentration of cobalt(II): 10, 25, 50, 75, 100, 125 and 150 ppm
cobalt(II) solution were prepared in universal buffer of pH 5.0. Fifty milligrams of
Si-TADAP was equilibrated with 10.0 ml of cobalt(II) solution at various
concentrations. Then the mixture were shaken for 3 hours. After the mixture were
filtered, the filtrates were determined for cobalt(II) by atomic absorption
spectrophotometer. The results are shown in Figure 21.
Effect of shaking time: Fifty milligrams of Si-TADAP was equilibrated with
10.0 ml of 50 ppm cobalt(II) solution in universal buffer of pH 5.0. Then the mixture
were shaken for 15, 30, 45, 60, 120, 180 and 240 minutes, respectively. After the
mixture were filtered, the filtrates were determined for cobalt(II) by atomic absorption
spectrophotometer. The results are shown in Figure 22.

27
13. Desorption of cobalt(II) on Si-TADAP
Fifty milligram of Si-TADAP loaded with 10.0 ml of 50 ppm of cobalt(II)
solution was shaken for 2 hours. Then the loaded resin was filtered off, washed with
double distilled water and air-dried. The loaded resin was shaken individually in
10.0 ml of 7 eluents, namely, sodium acetate, EDTA, hydrochloric acid, thiourea,
nitric acid, oxalate and potassiumhydrogenphosphate. After the shaking period for 2
hours, the mixtures were filtered and the filtrates were analyzed for cobalt(II) by
atomic absorption spectrophotometer. The results are shown in Table 13.
14. Efficiency of Si-TADAP on the adsorption of cobalt(II)
Fifty milligrams of Si-TADAP loaded with 10.0 ml of 50 ppm of cobalt(II)
solution was shaken for 2 hours. Then the loaded resin was filtered off, washed with
distilled water and air-dried. The cobalt(II) on the Si-TADAP was desorped by using
0.30 M KH2PO4 as eluent at the shaking time of 2 hours. Then the desorped
Si-TADAP was reused for the sorption of cobalt(II). The efficiency for sorption of
cobalt(II) was determined by atomic absorption spectrophotometer. The results are
shown in Figure 23.
28
N
S
NH2
NO2-+
N
S
N N
HCl-5 to 0 şC
2-Aminothiazole 2-Thiazolylazo
N
S
N N
+N
NH2
HCl-5 to 0 şC
N
NH2
NN
S
N
2,6-diaminopyridine 3-(2'-thiazolylazo)-2,6-diaminopyridine(TADAP)
2-Thiazolylazo
NH2NH2
RESULTS AND DICUSSION
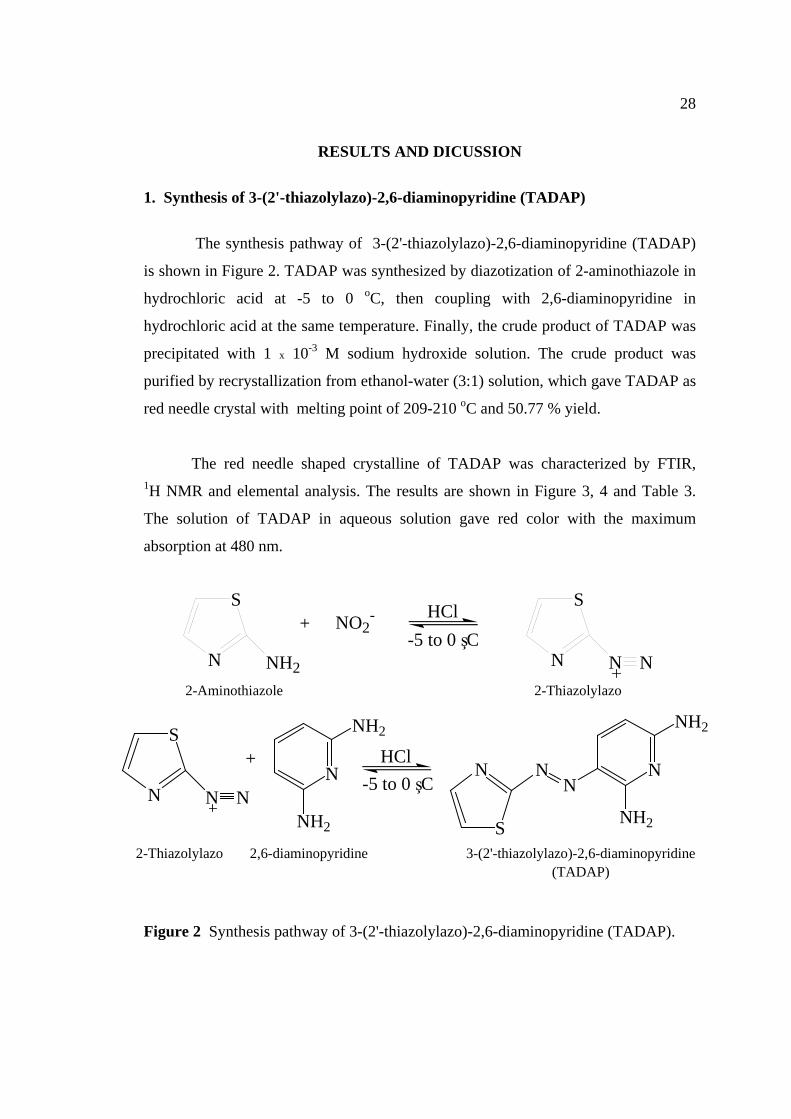
1. Synthesis of 3-(2'-thiazolylazo)-2,6-diaminopyridine (TADAP)
The synthesis pathway of 3-(2'-thiazolylazo)-2,6-diaminopyridine (TADAP)
is shown in Figure 2. TADAP was synthesized by diazotization of 2-aminothiazole in
hydrochloric acid at -5 to 0 oC, then coupling with 2,6-diaminopyridine in
hydrochloric acid at the same temperature. Finally, the crude product of TADAP was
precipitated with 1 x 10⁻³ M sodium hydroxide solution. The crude product was
purified by recrystallization from ethanol-water (3:1) solution, which gave TADAP as
red needle crystal with melting point of 209-210 oC and 50.77 % yield.
The red needle shaped crystalline of TADAP was characterized by FTIR, 1H NMR and elemental analysis. The results are shown in Figure 3, 4 and Table 3.
The solution of TADAP in aqueous solution gave red color with the maximum
absorption at 480 nm.
Figure 2 Synthesis pathway of 3-(2'-thiazolylazo)-2,6-diaminopyridine (TADAP).
29
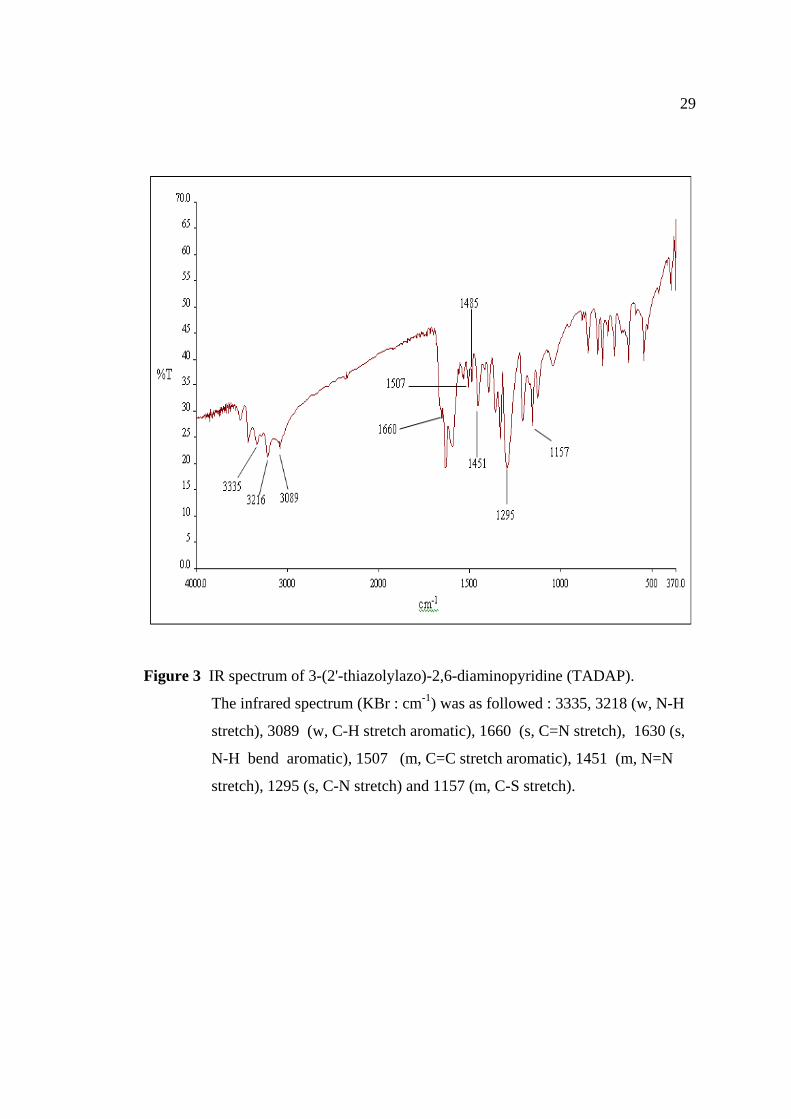
Figure 3 IR spectrum of 3-(2'-thiazolylazo)-2,6-diaminopyridine (TADAP).
The infrared spectrum (KBr : cm-1) was as followed : 3335, 3218 (w, N-H
stretch), 3089 (w, C-H stretch aromatic), 1660 (s, C=N stretch), 1630 (s,
N-H bend aromatic), 1507 (m, C=C stretch aromatic), 1451 (m, N=N
stretch), 1295 (s, C-N stretch) and 1157 (m, C-S stretch).
30
(b)
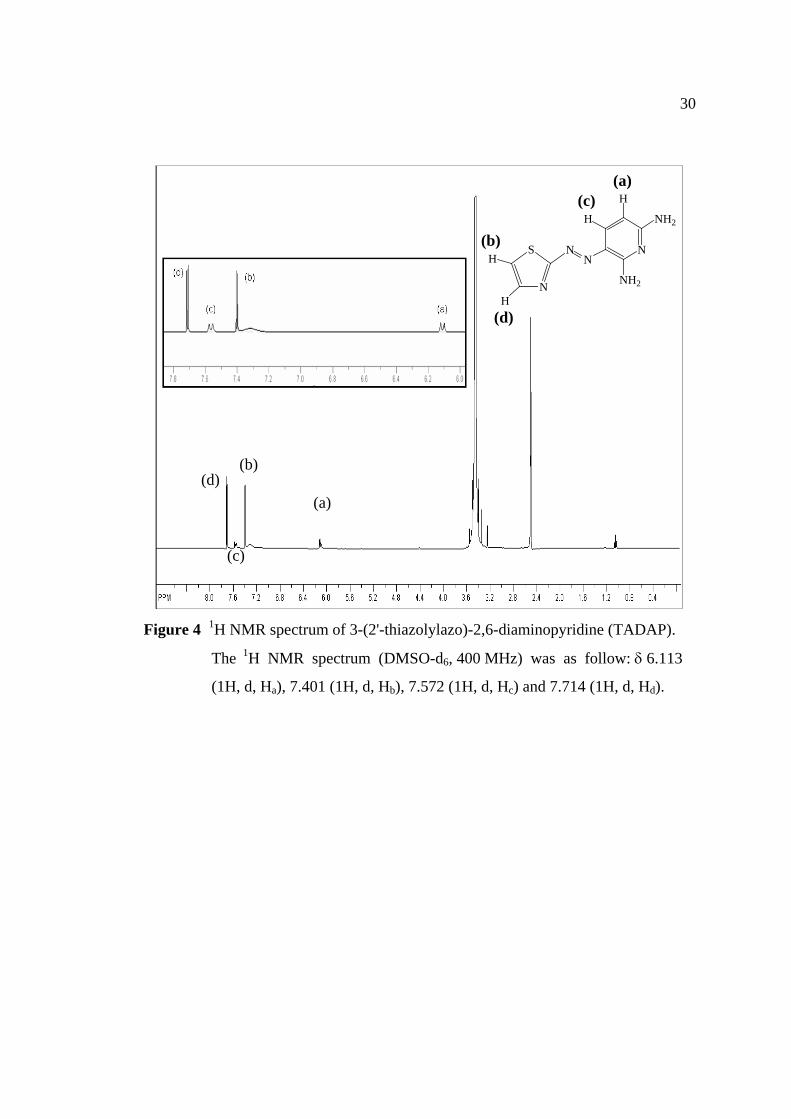
Figure 4 1H NMR spectrum of 3-(2'-thiazolylazo)-2,6-diaminopyridine (TADAP).
The 1H NMR spectrum (DMSO-d6, 400 MHz) was as follow: δ 6.113
(1H, d, Ha), 7.401 (1H, d, Hb), 7.572 (1H, d, Hc) and 7.714 (1H, d, Hd).
(a)
N
NH2
NN
N
S
NH2
H
H
H
H(a)
(b)
(d)
(c)
(c)
(d)
31
Table 3 The elemental analysis of 3-(2'-thiazolylazo)-2,6-diaminopyridine
(TADAP)
Element Theoretical value Experimental value % Error
C
H
N
S
43.64%
3.661%
38.16%
14.56%
43.80%
3.792%
38.45%
14.78%
0.367%
3.578%
0.760%
1.511%
The results of IR spectrum, 1H NMR spectrum and elemental analysis
indicated that the synthesized product was TADAP.
2. Complex formation between TADAP and cobalt(II)
The absorption spectrum of TADAP and cobalt(II)-TADAP complex were
studied in the visible region. The azo compound displays mainly a broad band in the
visible region (λ = 480 nm) which was assigned as n to π* transition within the azo
linkage influenced by intramolecular charge transfer. From the results showed that
TADAP could form complexes with cobalt(II) at ranging from 9.0 to 11.0. The
cobalt(II) complex gave a green color. The results are shown in Figure 5 to 7 and
Table 4.

32
Figure 5 Absorption spectra of TADAP and cobalt(II)-TADAP complex at pH 9.
(a) TADAP
(b) Complex of cobalt(II)-TADAP
Figure 6 Absorption spectra of TADAP and cobalt(II)-TADAP complex at pH 10.
(a) TADAP
(b) Complex of cobalt(II)-TADAP
33
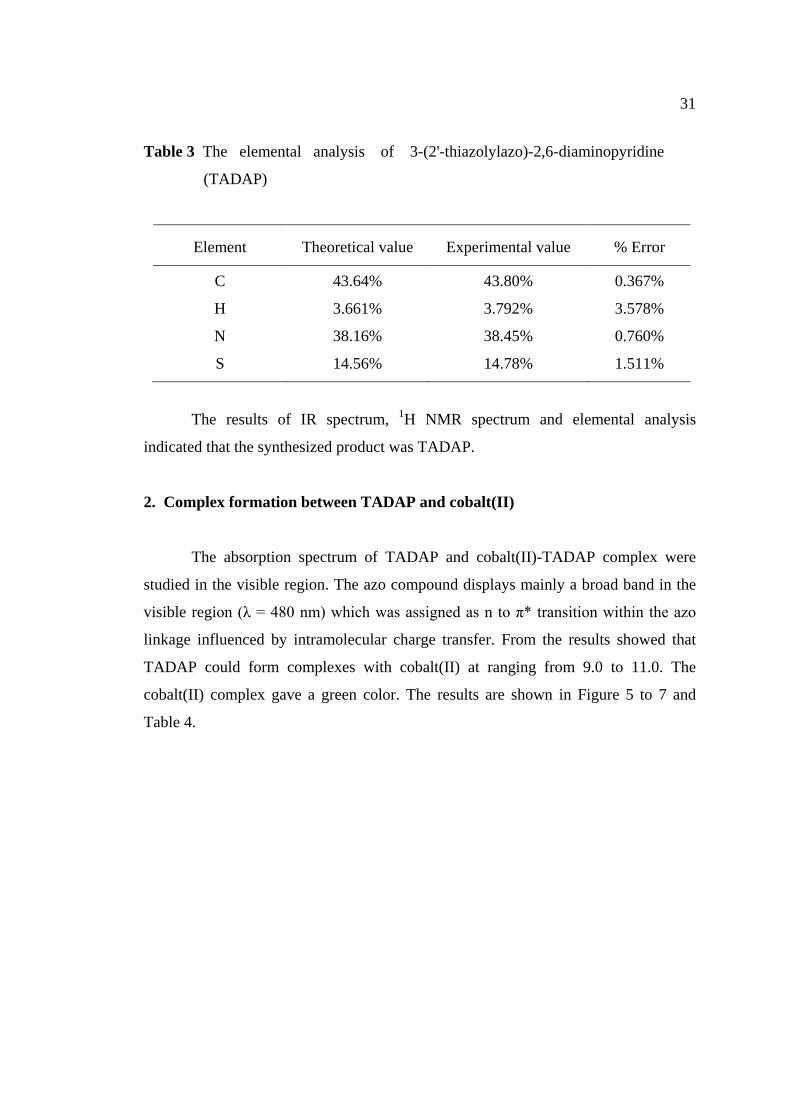
Figure 7 Absorption spectra of TADAP and cobalt(II)-TADAP complex at pH 11.
(a) TADAP
(b) Complex of cobalt(II)-TADAP
Table 4 Complex formation between cobalt(II) and TADAP at pH 9.0-11.0
pH
Color of TADAP solution
Color of cobalt(II)-
TADAP complex
solution
λmax
9.0 Orange Green 598
10.0 Orange Green 598
11.0 Orange Green 598
Tanabe-Sugano diagram was used for the interpretation of electronic spectra
of the complex. Cobalt(II) is metal ion which has d7 configuration, so the Tanabe-
Sugano diagram of d7 configuration as shown in Figure 8 was used for the
interpretation. The following transitions are expected:

34
Spin allowed Spin forbidden
2Eg 2T1g 2Eg 4T1g
2Eg 2T2g 2Eg 4T2g
2Eg 2A1g 2Eg 4T1g (P)
2Eg 2A2g 2Eg 4A2g
Figure 8 Tanabe-Sugano diagram of d7 configuration
Source: Shriver (1999)
The character of the complex’s spectrum was matched to the prediction when
TADAP acted as the strong field ligand. The absorption spectrum for the spin allowed
d-d transition of complex show four band at 660, 603, 445 and 416 nm as shown in
Figure 9. These bands were assigned as 2Eg 2T1g, 2Eg 2T2g, 2Eg 2A1g
and 2Eg 2A2g transition, respectively. For TADAP as the strong field ligand, the
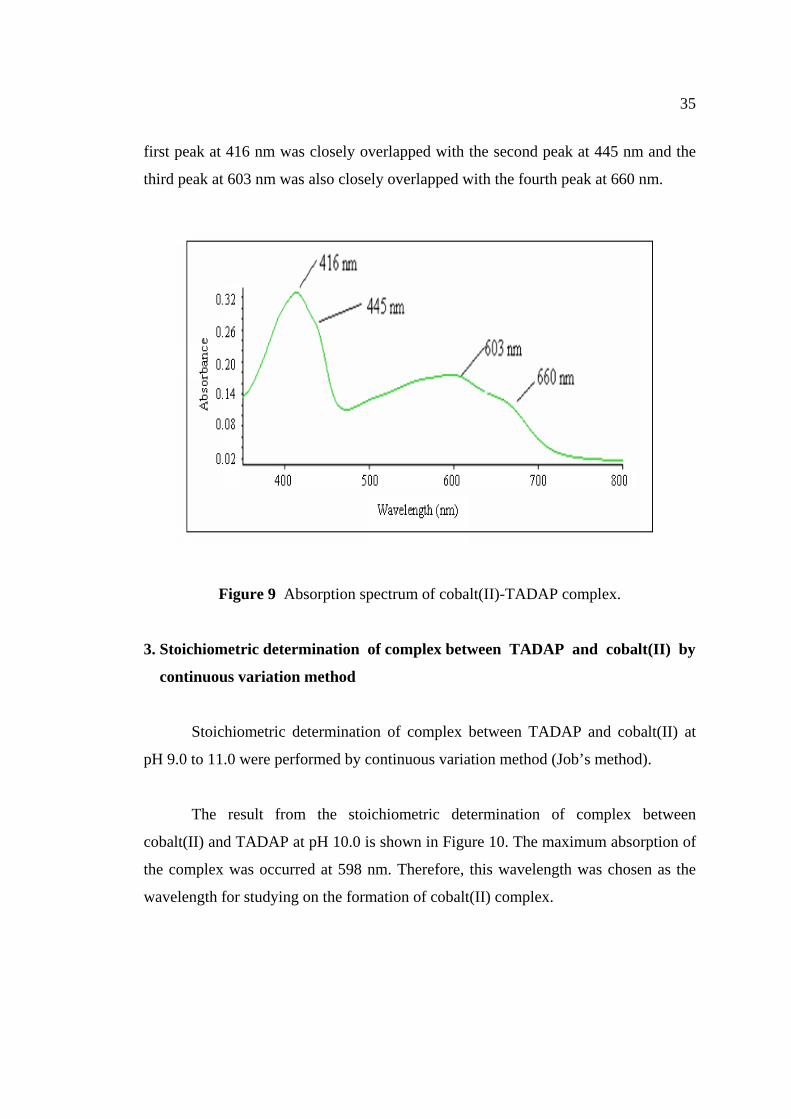
35
first peak at 416 nm was closely overlapped with the second peak at 445 nm and the
third peak at 603 nm was also closely overlapped with the fourth peak at 660 nm.
Figure 9 Absorption spectrum of cobalt(II)-TADAP complex.
3. Stoichiometric determination of complex between TADAP and cobalt(II) by
continuous variation method
Stoichiometric determination of complex between TADAP and cobalt(II) at
pH 9.0 to 11.0 were performed by continuous variation method (Job’s method).
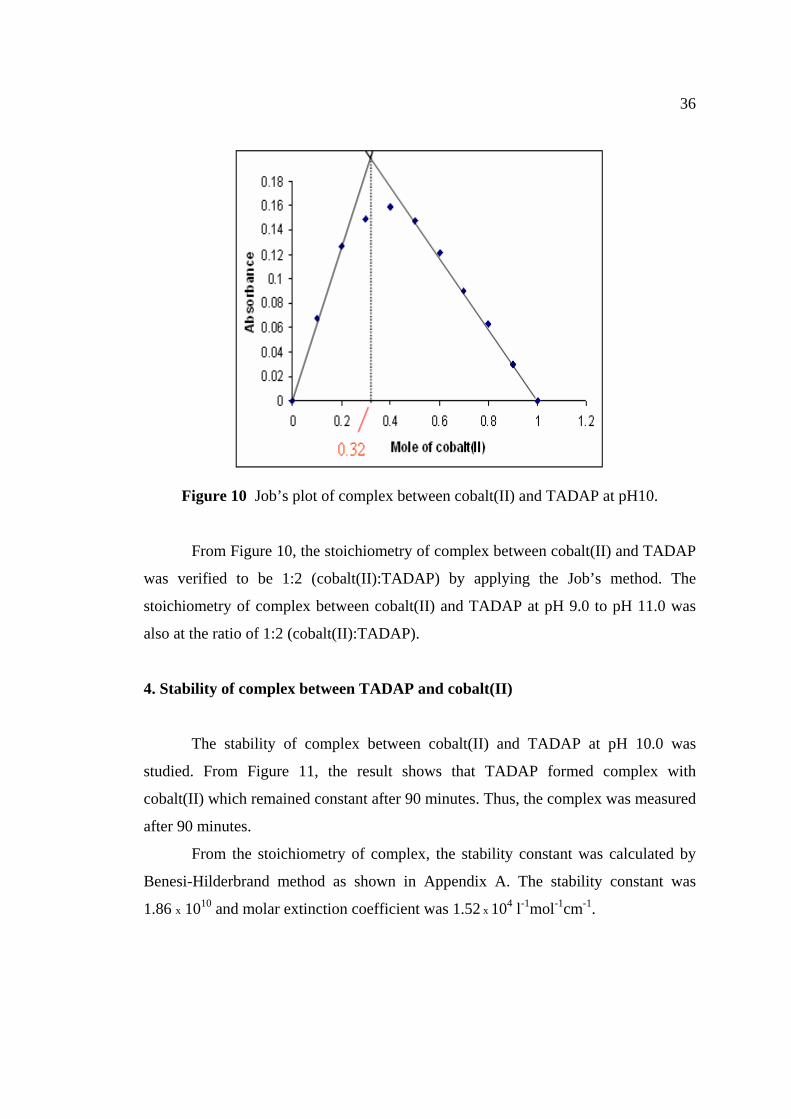
The result from the stoichiometric determination of complex between
cobalt(II) and TADAP at pH 10.0 is shown in Figure 10. The maximum absorption of
the complex was occurred at 598 nm. Therefore, this wavelength was chosen as the
wavelength for studying on the formation of cobalt(II) complex.
36
Figure 10 Job’s plot of complex between cobalt(II) and TADAP at pH10.
From Figure 10, the stoichiometry of complex between cobalt(II) and TADAP
was verified to be 1:2 (cobalt(II):TADAP) by applying the Job’s method. The
stoichiometry of complex between cobalt(II) and TADAP at pH 9.0 to pH 11.0 was
also at the ratio of 1:2 (cobalt(II):TADAP).
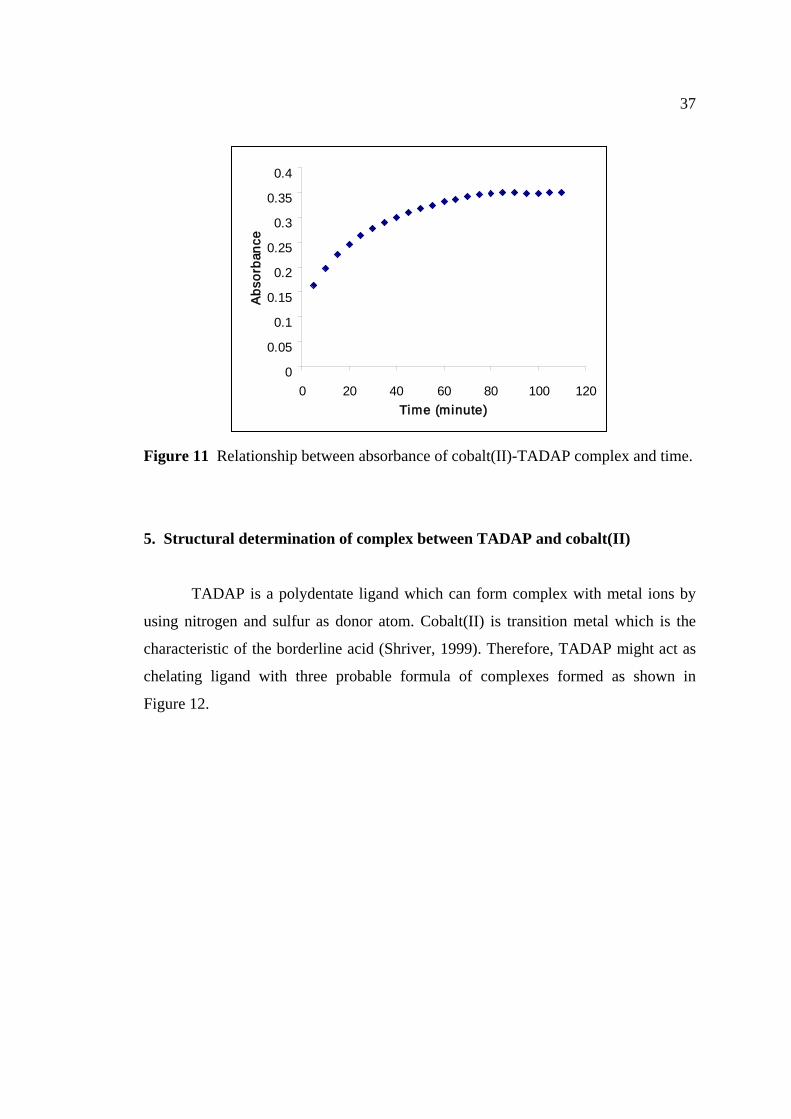
4. Stability of complex between TADAP and cobalt(II)
The stability of complex between cobalt(II) and TADAP at pH 10.0 was
studied. From Figure 11, the result shows that TADAP formed complex with
cobalt(II) which remained constant after 90 minutes. Thus, the complex was measured
after 90 minutes.
From the stoichiometry of complex, the stability constant was calculated by
Benesi-Hilderbrand method as shown in Appendix A. The stability constant was
1.86 x 10¹⁰ and molar extinction coefficient was 1.52 x 10⁴ l-1mol-1cm-1.
37
0
0.05
0.1
0.15
0.2
0.25
0.3
0.35
0.4
0 20 40 60 80 100 120Time (minute)
Abs
orba
nce
Figure 11 Relationship between absorbance of cobalt(II)-TADAP complex and time.
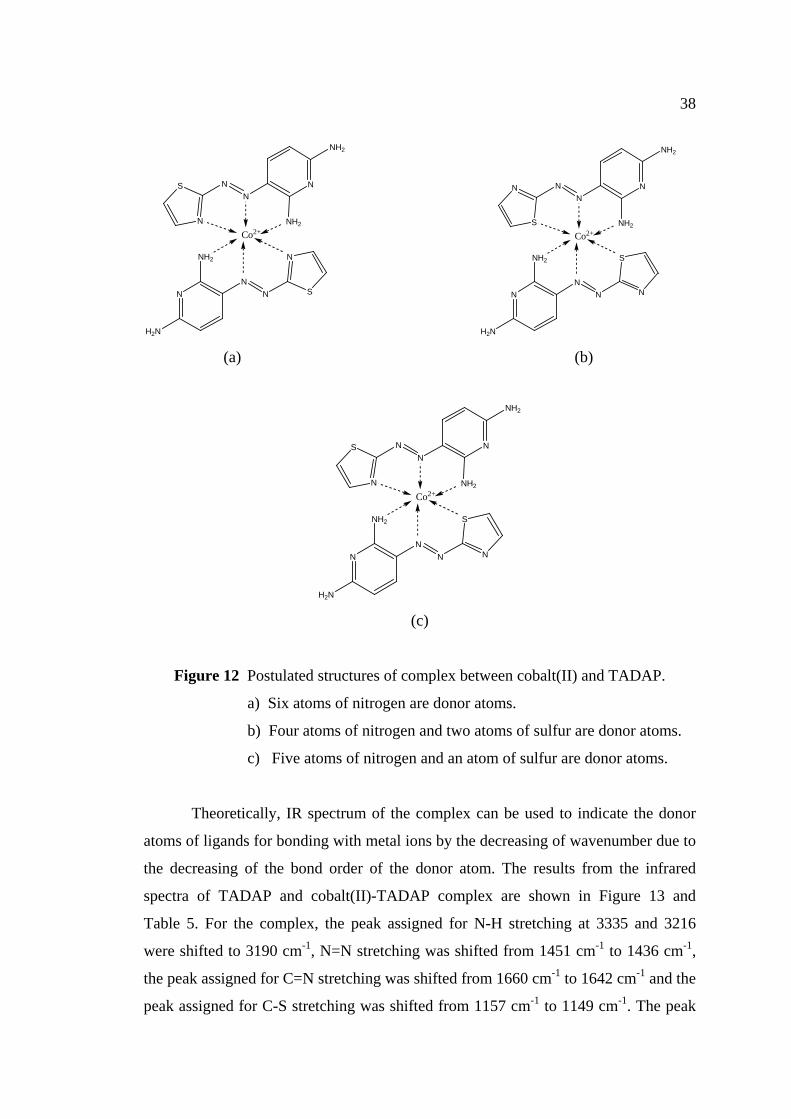
5. Structural determination of complex between TADAP and cobalt(II)
TADAP is a polydentate ligand which can form complex with metal ions by
using nitrogen and sulfur as donor atom. Cobalt(II) is transition metal which is the
characteristic of the borderline acid (Shriver, 1999). Therefore, TADAP might act as
chelating ligand with three probable formula of complexes formed as shown in
Figure 12.
38
S
N
NN
N
NH2
NH2
Co2+
NN
N
N
S
NH2
H2N
N
S
NN
N
NH2
NH2
Co2+
NN
N
S
N
NH2
H2N (a) (b)
S
N
NN
N
NH2
NH2
Co2+
NN
N
S
N
NH2
H2N (c)
Figure 12 Postulated structures of complex between cobalt(II) and TADAP.
a) Six atoms of nitrogen are donor atoms.
b) Four atoms of nitrogen and two atoms of sulfur are donor atoms.
c) Five atoms of nitrogen and an atom of sulfur are donor atoms.
Theoretically, IR spectrum of the complex can be used to indicate the donor
atoms of ligands for bonding with metal ions by the decreasing of wavenumber due to
the decreasing of the bond order of the donor atom. The results from the infrared
spectra of TADAP and cobalt(II)-TADAP complex are shown in Figure 13 and
Table 5. For the complex, the peak assigned for N-H stretching at 3335 and 3216
were shifted to 3190 cm-1, N=N stretching was shifted from 1451 cm-1 to 1436 cm-1,
the peak assigned for C=N stretching was shifted from 1660 cm-1 to 1642 cm-1 and the
peak assigned for C-S stretching was shifted from 1157 cm-1 to 1149 cm-1. The peak
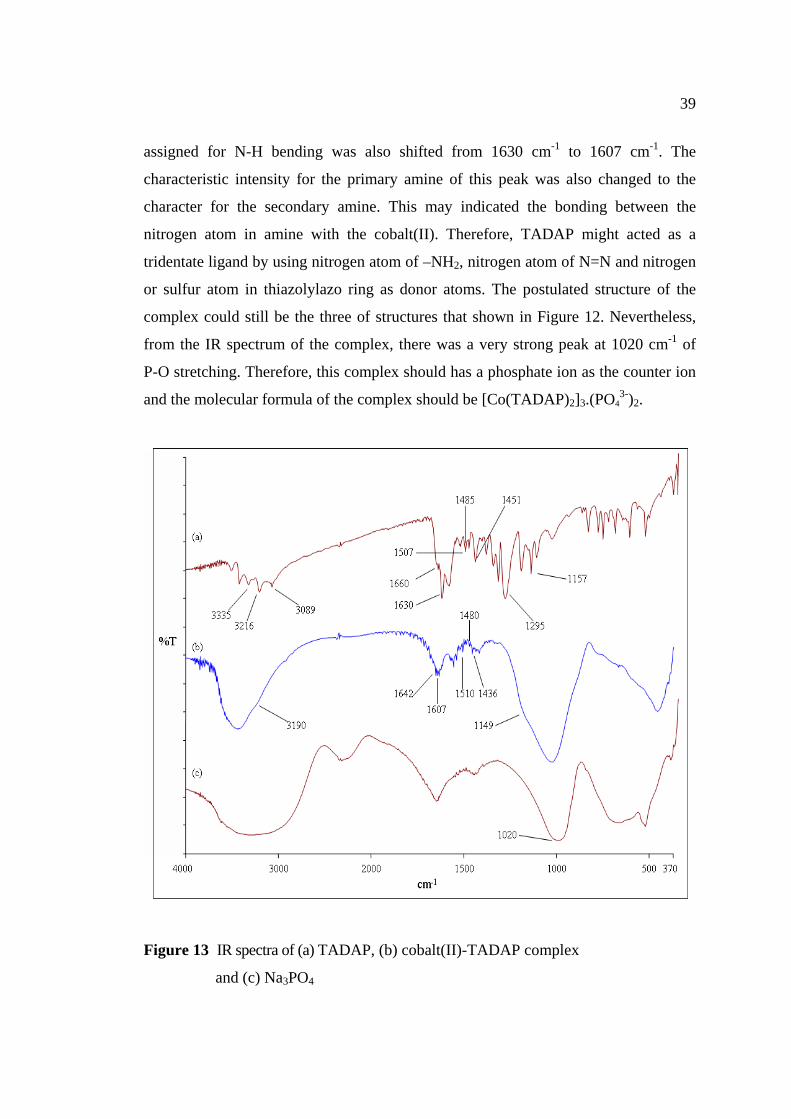
39
assigned for N-H bending was also shifted from 1630 cm-1 to 1607 cm-1. The
characteristic intensity for the primary amine of this peak was also changed to the
character for the secondary amine. This may indicated the bonding between the
nitrogen atom in amine with the cobalt(II). Therefore, TADAP might acted as a
tridentate ligand by using nitrogen atom of –NH2, nitrogen atom of N=N and nitrogen
or sulfur atom in thiazolylazo ring as donor atoms. The postulated structure of the
complex could still be the three of structures that shown in Figure 12. Nevertheless,
from the IR spectrum of the complex, there was a very strong peak at 1020 cm-1 of
P-O stretching. Therefore, this complex should has a phosphate ion as the counter ion
and the molecular formula of the complex should be [Co(TADAP)2]3.(PO43-)2.
Figure 13 IR spectra of (a) TADAP, (b) cobalt(II)-TADAP complex
and (c) Na3PO4
40
Table 5 Data from the IR spectra of TADAP and cobalt(II)-TADAP complex
TADAP Cobalt(II)-TADAP complex
Wavenumber
(cm-1) Functional group Wavenumber
(cm-1) Functional group
3335 and 3216 (w)
3089 (w)
1660 (s)
1630 (s)
1507 and 1485 (m)
1451 (m)
1295 (s)
1157 (m)
N-H stretch
C-H stretch aromatic
C=N stretch
N-H bend aromatic
C=C stretch
N=N stretch
C-N stretch
C-S stretch
3190 (w)
-
1642 (s)
1607 (w)
1510 and 1480 (m)
1436 (m)
1229 (s)
1140 (m)
N-H stretch
C-H stretch aromatic
C=N stretch
N-H bend aromatic
C=C stretch
N=N stretch
C-N stretch
C-S stretch
1020 (s) P-O stretch
1H NMR spectrum of the complex may also use to indicate the donor atoms of
ligand for bonding with metal ions. Generally, the chemical shift of the proton close
to the donor atoms is decreased due to the increasing of electron density (shielded) of
that proton. However, the result from the 1H NMR spectrum of cobalt(II)-TADAP
complex did not show any significant peaks. This may be because the solubility of
cobalt(II)-TADAP complex is very low in solvents such as DMSO-d6 and CDCl3.
However, this should be investigated in the future work.
By using hyperchem 7.5, the formation energy of cobalt(II)-TADAP
complexes in three structures as shown in Figure 12 were calculated. It was found that
the formation energy of structure 12 (a) was 83.04 kcal/mol, structure 12 (b) was
67.79 kcal/mol and structure 12 (c) was 92.72 kcal/mol. From the formation energies
of three complexes this may be conclude that the most possible structure of cobalt(II)-
TADAP complex was structure 12 (b). However, this is a calculation from a basic
program which may not give a very high accurate results. To get higher accurate
results, Gaussian 03 should be used for the calculation in the future work.
41
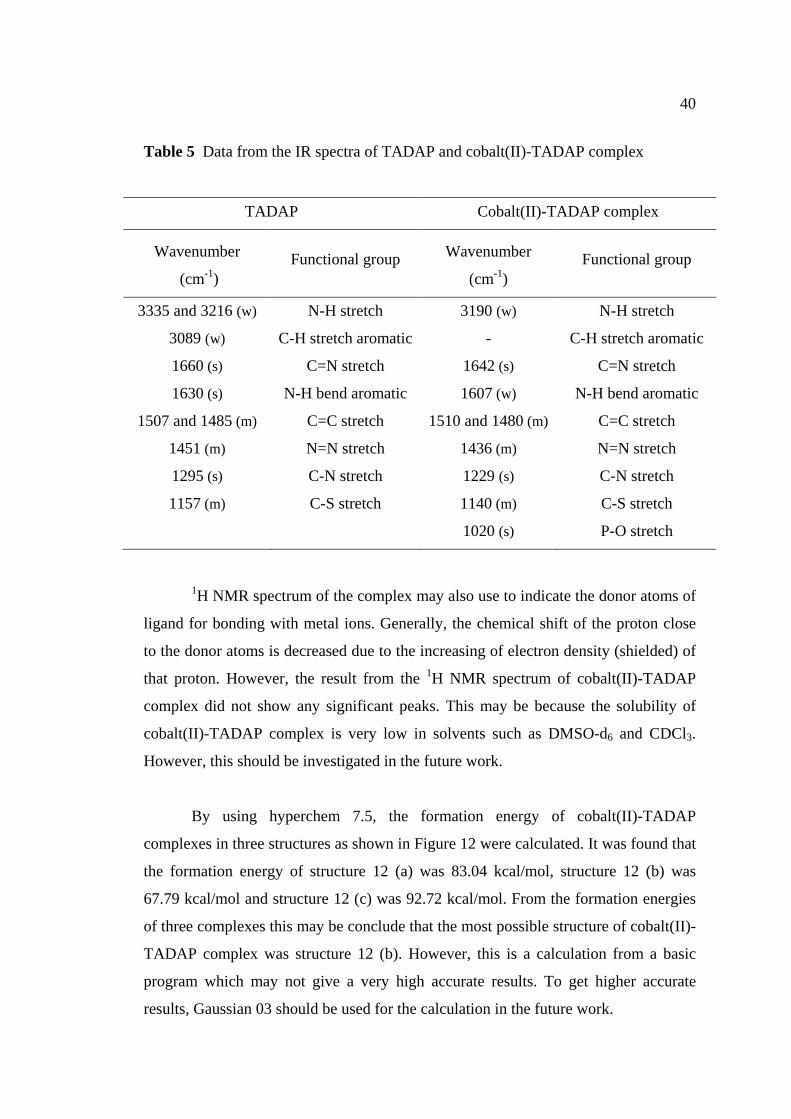
6. Determination of linear range and limit of detection of complex between
TADAP and cobalt(II)
The linear range and limit of detection of complex between cobalt(II) and
TADAP were studied and shown in Figure 14. The increasing in the absorbance of
complex were deviated from Beer’s law when the concentration of cobalt(II) was
higher than 1.2 x 10⁻⁵ M.
Figure 14 Relationship of the absorbance of complex between cobalt(II) and
TADAP by increasing concentration of cobalt(II) in excess TADAP
solution.
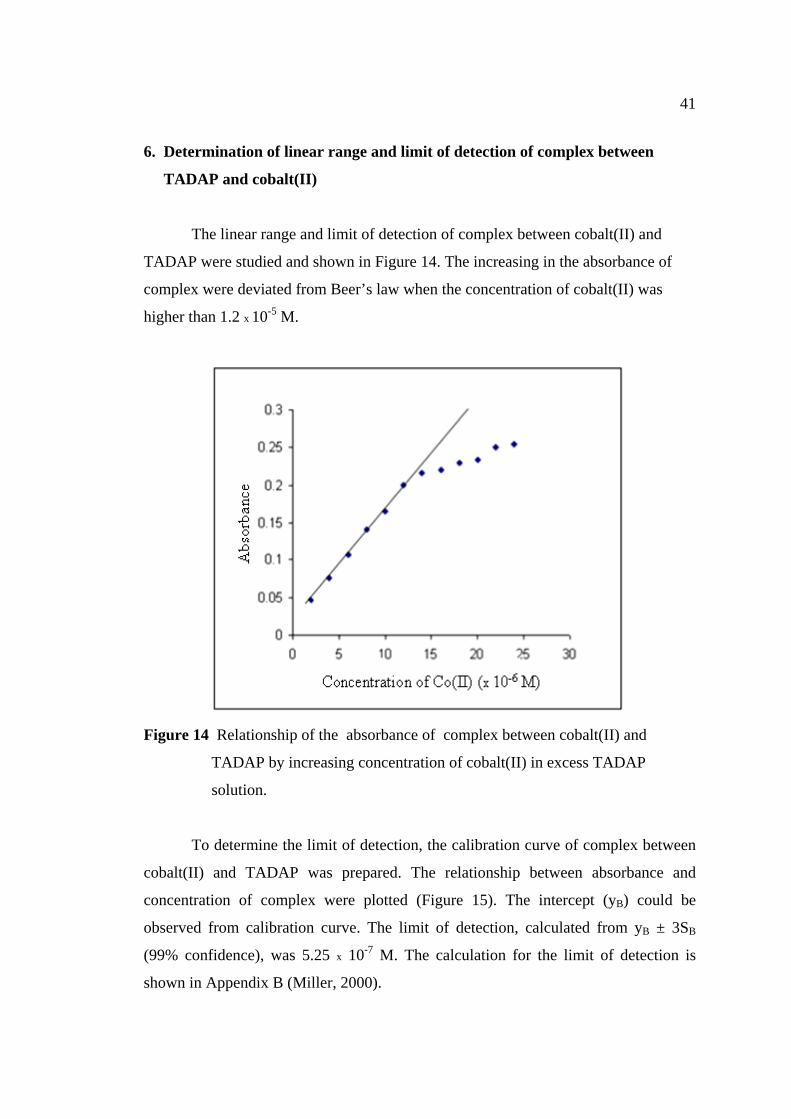
To determine the limit of detection, the calibration curve of complex between
cobalt(II) and TADAP was prepared. The relationship between absorbance and
concentration of complex were plotted (Figure 15). The intercept (yB) could be
observed from calibration curve. The limit of detection, calculated from yB ± 3SB
(99% confidence), was 5.25 x 10⁻⁷ M. The calculation for the limit of detection is
shown in Appendix B (Miller, 2000).
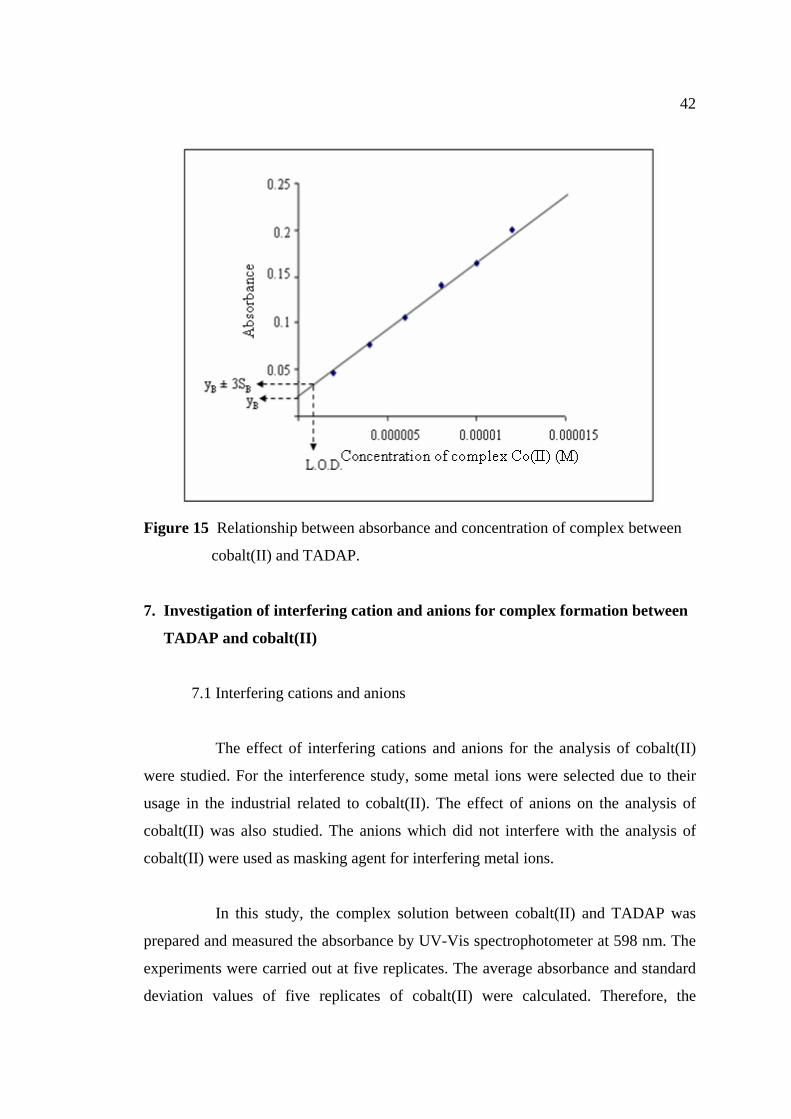
42
Figure 15 Relationship between absorbance and concentration of complex between
cobalt(II) and TADAP.
7. Investigation of interfering cation and anions for complex formation between
TADAP and cobalt(II)
7.1 Interfering cations and anions
The effect of interfering cations and anions for the analysis of cobalt(II)
were studied. For the interference study, some metal ions were selected due to their
usage in the industrial related to cobalt(II). The effect of anions on the analysis of
cobalt(II) was also studied. The anions which did not interfere with the analysis of
cobalt(II) were used as masking agent for interfering metal ions.
In this study, the complex solution between cobalt(II) and TADAP was
prepared and measured the absorbance by UV-Vis spectrophotometer at 598 nm. The
experiments were carried out at five replicates. The average absorbance and standard
deviation values of five replicates of cobalt(II) were calculated. Therefore, the
43
analysis concentration of cobalt(II) could accepted in the range of 5.78 x 10⁻⁷-
1.51 x 10⁻⁶ (95% confidence).
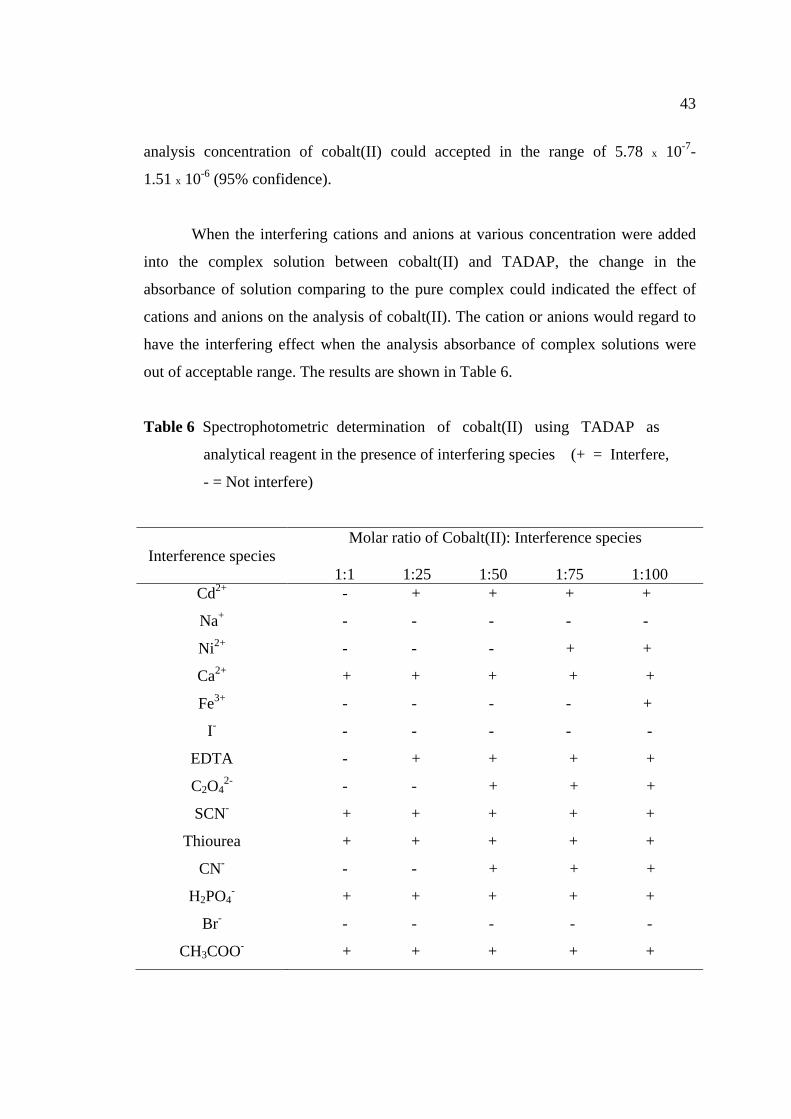
When the interfering cations and anions at various concentration were added
into the complex solution between cobalt(II) and TADAP, the change in the
absorbance of solution comparing to the pure complex could indicated the effect of
cations and anions on the analysis of cobalt(II). The cation or anions would regard to
have the interfering effect when the analysis absorbance of complex solutions were
out of acceptable range. The results are shown in Table 6.
Table 6 Spectrophotometric determination of cobalt(II) using TADAP as
analytical reagent in the presence of interfering species (+ = Interfere,
- = Not interfere)
Interference species
Molar ratio of Cobalt(II): Interference species
1:1 1:25 1:50 1:75 1:100 Cd2+ - + + + +
Na+ - - - - -
Ni2+ - - - + +
Ca2+ + + + + +
Fe3+ - - - - +
I- - - - - -
EDTA - + + + +
C2O42- - - + + +
SCN- + + + + +
Thiourea + + + + +
CN- - - + + +
H2PO4- + + + + +
Br- - - - - -
CH3COO- + + + + +

44
According to the hard and soft acids and bases theory, the interactions of
Lewis acids and bases containing elements drawn from throughout the periodic table
to consider at two main classes of substance (hard and soft). The two classes were
identified by the opposite order of strengths (as measured by the stability constant,
Kstab, for the formation of the complex) which they form complexes with halide ion
bases:
Hard acids bond in the order: I-< Br- < Cl-< F-
Soft acids bond in the order: F-< Cl-< Br-< I-
The classification of Lewis acids and bases was shown in Table 7. Hard and
soft acids and bases were identified by the trends in stabilities of the complexes they
form; hard acids tend to bind to hard bases and soft acids tend to bind to soft bases.
Table 7 The classification of Lewis acids and based
Hard Borderline Soft
Acids H+, Li+, Na+, K+
Be2+, Mg2+, Ca2+
Cr2+, Cr3+, Al3+
Fe2+, Co2+, Ni2+
Cu2+, Zn2+, Pb2+
Cu2+, Ag+, Au3+, Tl+, Hg+
Pd2+, Cd2+, Pt2+, Hg2+
Bases F-, OH-, H2O, NH3
CO32-, NO3
-, O2-
SO42-, PO4
3-, ClO4-
NO2-, SO3
2-, Br-
N3-, N2
C6H5N, SCN-
H-, R-, CN-, CO, I-
SCN-, R3P, C6H6
R2S
Source: Shriver (1999)
From Table 6, Calcium ion was the most interfering for the analysis of
cobalt(II) may be because calcium ion could form ion pair with phosphate ion in
buffur solution. Cadmium(II), nickel(II) and iron(III) interfered the analysis of
cobalt(II) may be because cadmium(II) was characterized as soft acid and nickel(II)
and iron(III) were characterized as borderline acids which could form complex well
with TADAP. Sodium ion did not interfere the analysis because this cation was the
s-block metal ion.
45
For anions, thiocyanide, thiourea and cyanide ion interfered the analysis of
cobalt(II) may be because these anions were characterized as borderline bases which
could form complex with borderline acid such as cobalt(II). EDTA, oxalate ion and
acetate ion also interfered the analysis of cobalt(II) may be because these anions could
form complex with cobalt(II) by chelate effect so the stability constants of complex
were increased (The chelate effect is the greater stability of a complex containing a
coordinated polydentate ligand compared with a complex containing the equivalent
number of similar monodentate ligands.). As iodide and bromide are soft base then
they might not interfere with the analysis of cobalt(II). Thus, they might be used as
masking agent to reduce the interfering metal ions.
7.2 Masking of interfering cations
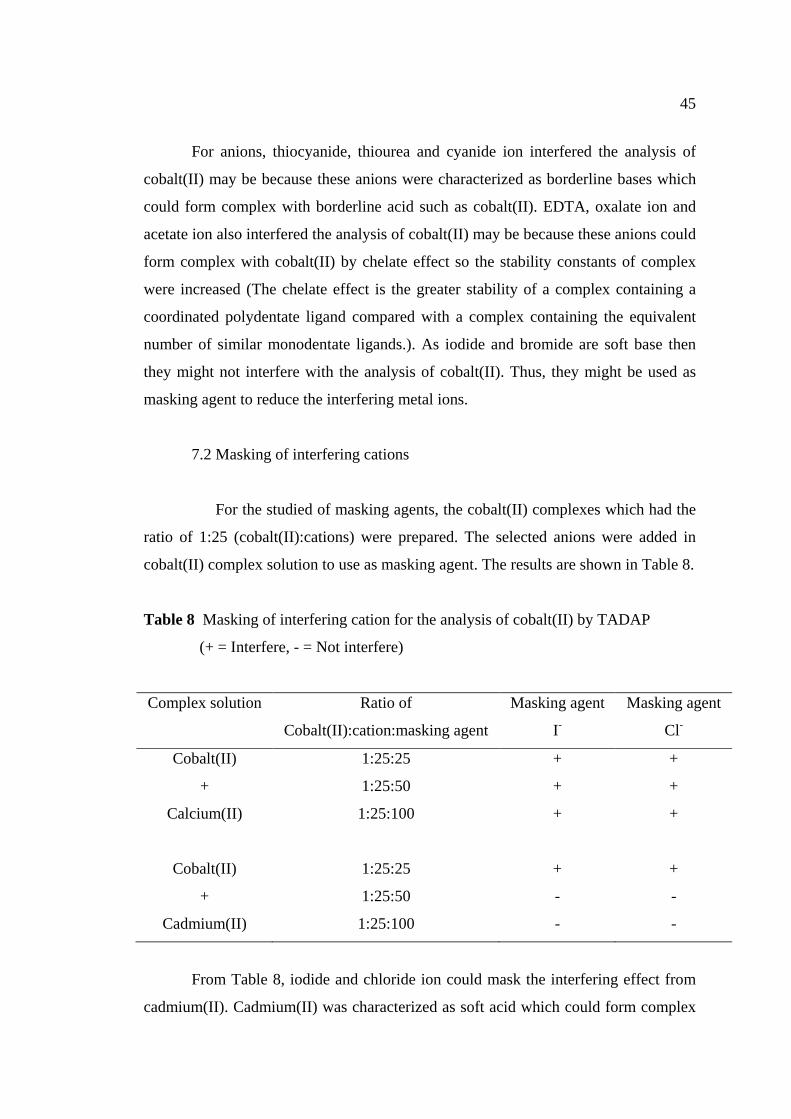
For the studied of masking agents, the cobalt(II) complexes which had the
ratio of 1:25 (cobalt(II):cations) were prepared. The selected anions were added in
cobalt(II) complex solution to use as masking agent. The results are shown in Table 8.
Table 8 Masking of interfering cation for the analysis of cobalt(II) by TADAP
(+ = Interfere, - = Not interfere)
Complex solution Ratio of
Cobalt(II):cation:masking agent
Masking agent
I-
Masking agent
Cl-
Cobalt(II) 1:25:25 + +
+ 1:25:50 + +
Calcium(II) 1:25:100 + +
Cobalt(II) 1:25:25 + +
+ 1:25:50 - -
Cadmium(II) 1:25:100 - -
From Table 8, iodide and chloride ion could mask the interfering effect from
cadmium(II). Cadmium(II) was characterized as soft acid which could form complex

46
with soft bases such as these anions. For others cations, iodide ion could not used as
the masking agent.
8. Determination of cobalt(II) in synthetic solution by TADAP
TADAP was used for the determination of quantity of cobalt(II) by
spectrophotometric method. The results from this method were compared with the
results from atomic absorption spectroscopy. Cobalt(II) in various synthetic solution
were determined in the presence of interfering metal ions (nickel(II) and cadmium(II)
because cobalt(II) is byproduct of nickel(II) production (Shriver, 1999)) by 1% v/v.
Table 9 Determination of cobalt(II) in synthetic solutions
Synthetic
solutions
Concentration
of Cobalt(II)
(M)
Spectrophotometric
method Atomic absorption
spectroscopic method
Cobalt(II)
found
(M)
% Error
Cobalt(II)
found
(M)
% Error
Cobalt(II) 2 x 10⁻⁶
7 x 10⁻⁶
1.1 x 10⁻⁵
2.48 x 10⁻⁶
7.84 x 10⁻⁶
1.07 x 10⁻⁵
24.00
12.00
2.73
2.35 x 10⁻⁶
7.75 x 10⁻⁶
1.12 x 10⁻⁵
17.50
10.71
1.82
Cobalt(II) +
Nickel(II)
2 x 10⁻⁶
7 x 10⁻⁶
1.1 x 10⁻⁵
2.51 x 10⁻⁶
7.75 x 10⁻⁶
1.16 x 10⁻⁵
25.50
10.71
5.45
2.48 x 10⁻⁶
7.59 x 10⁻⁶
1.16 x 10⁻⁵
24.00
8.43
5.45
Cobalt(II) +
Cadmium(II)
2 x 10⁻⁶
7 x 10⁻⁶
1.1 x 10⁻⁵
2.55 x 10⁻⁶
7.90 x 10⁻⁶
1.05 x 10⁻⁵
27.50
12.86
4.54
2.58 x 10⁻⁶
7.79 x 10⁻⁶
1.11 x 10⁻⁵
29.00
11.28
0.91

47
From Table 9, the results of determination of cobalt(II) in both methods were
very similar. It was found that, these interference metal ions effected on the
determination when the concentration of cobalt(II) was lower than 1.1 x 10⁻⁵ M.
Table 10 Comparison of two methods for determination of cobalt(II) in synthetic
solution
Synthetic
solutions
Concentration
(M)
Spectrophotometric
method
Cobalt(II) found (M)
Atomic absorption spectroscopic
method
Cobalt(II) found (M)
│t│
Cobalt(II)
2 x 10⁻⁶
7 x 10⁻⁶
1.1 x 10⁻⁵
2.48 x 10⁻⁶
7.84 x 10⁻⁶
1.07 x 10⁻⁵
2.35 x 10⁻⁶
7.75 x 10⁻⁶
1.12 x 10⁻⁵
1.7
0.95
1.46
Cobalt(II)
+
Nickel(II)
2 x 10⁻⁶
7 x 10⁻⁶
1.1 x 10⁻⁵
2.51 x 10⁻⁶
7.75 x 10⁻⁶
1.16 x 10⁻⁵
2.48 x 10⁻⁶
7.59 x 10⁻⁶
1.16 x 10⁻⁵
0.29
1.56
0
Cobalt(II)
+
Cadmium(II)
2 x 10⁻⁶
7 x 10⁻⁶
1.1 x 10⁻⁵
2.55 x 10⁻⁶
7.90 x 10⁻⁶
1.05 x 10⁻⁵
2.58 x 10⁻⁶
7.79 x 10⁻⁶
1.11 x 10⁻⁵
0.22
1.05
1.44
The Table 10 shows the comparison of two methods at various concentration
of cobalt(II). There were 4 degrees of freedom so the critical value was t4 = 2.78
(P = 0.05). The observed values of │t│ were less than the critical value so the
developing method did not give significantly different results for the determination of

48
cobalt(II) from the atomic absorption spectroscopy which generally used as the
reference method.
9. Preparation of 3-(2'-thiazolylazo)-2,6-diaminopyridine resin (Si-TADAP)
Figure 16 shows the pathway of synthesis Si-TADAP. The resin was
characterized by FTIR and elemental analysis. The results are shown in Figure 17, 18
and 19 and Table 11 and 12.
Figure 16 Synthesis pathway of 3-(2'-thiazolylazo)-2,6-diaminopyridine resin
(Si-TADAP)
Silica gel
Modified silica gel
Si-TADAP
49
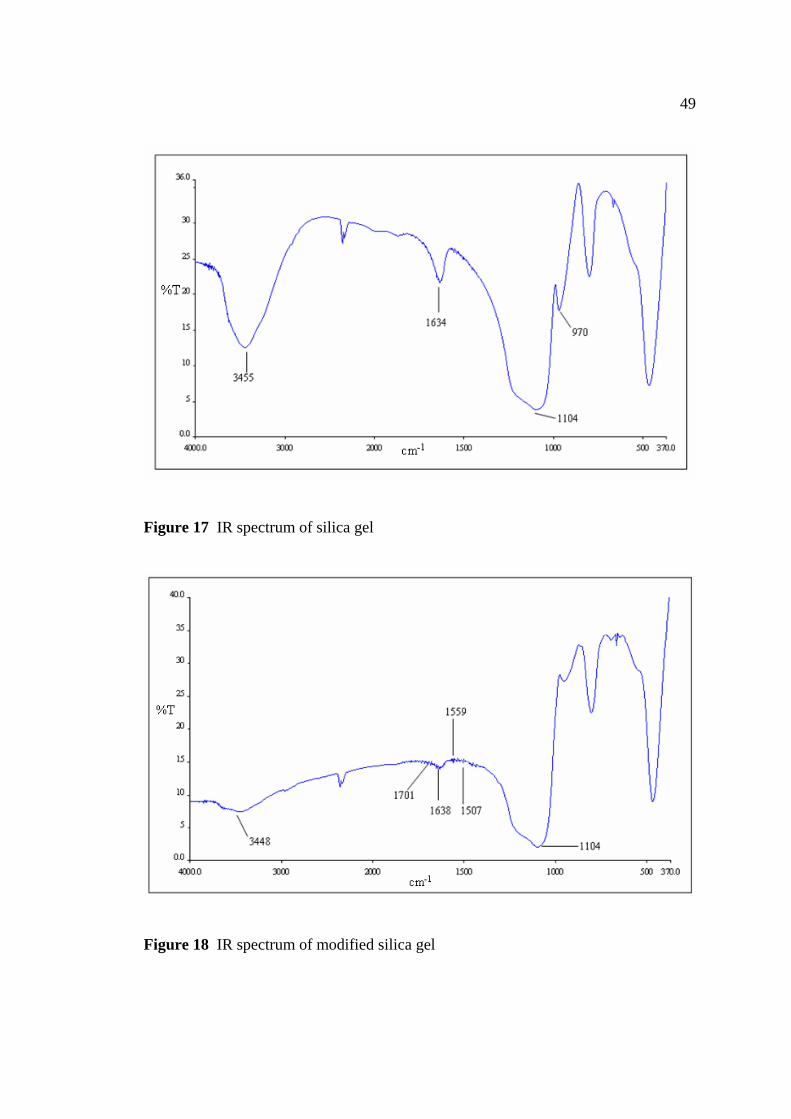
Figure 17 IR spectrum of silica gel
Figure 18 IR spectrum of modified silica gel
50
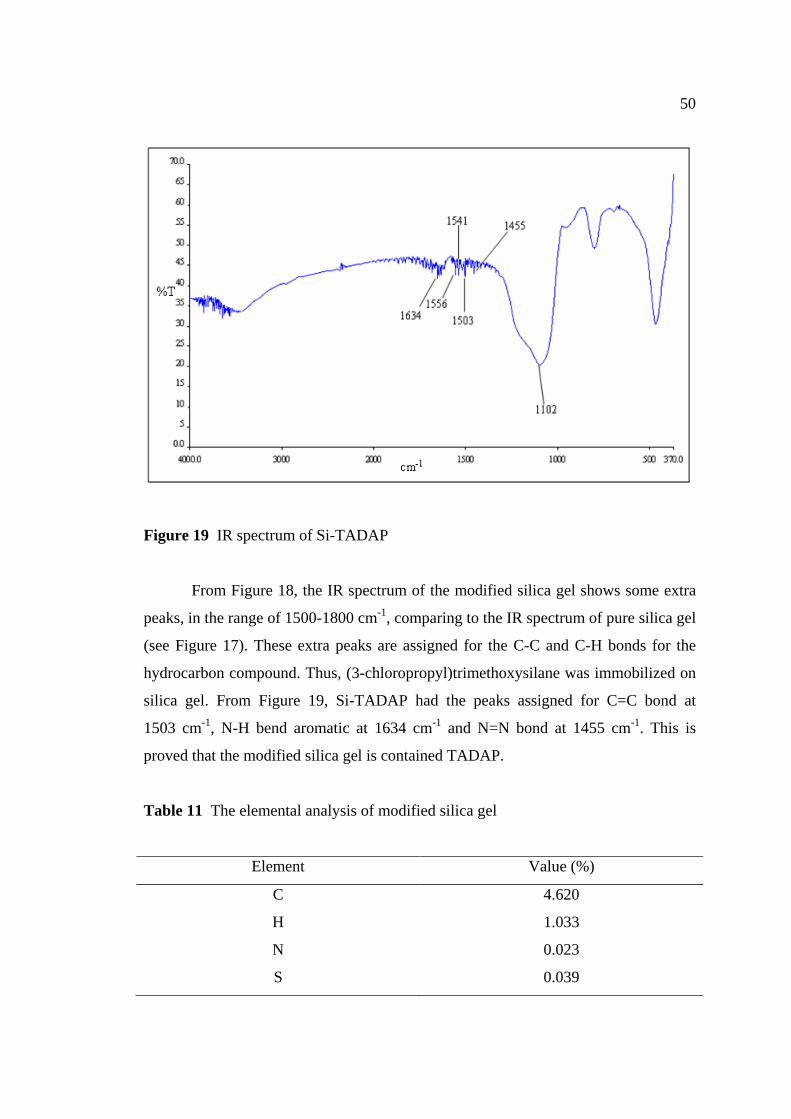
Figure 19 IR spectrum of Si-TADAP
From Figure 18, the IR spectrum of the modified silica gel shows some extra
peaks, in the range of 1500-1800 cm-1, comparing to the IR spectrum of pure silica gel
(see Figure 17). These extra peaks are assigned for the C-C and C-H bonds for the
hydrocarbon compound. Thus, (3-chloropropyl)trimethoxysilane was immobilized on
silica gel. From Figure 19, Si-TADAP had the peaks assigned for C=C bond at
1503 cm-1, N-H bend aromatic at 1634 cm-1 and N=N bond at 1455 cm-1. This is
proved that the modified silica gel is contained TADAP.
Table 11 The elemental analysis of modified silica gel
Element Value (%)
C 4.620
H 1.033
N 0.023
S 0.039
51
Table 12 The elemental analysis of Si-TADAP
Element Value (%)
C 5.043
H 1.067
N 0.272
S 0.122
From Table 11, the percentage of carbon atom was 4.620 %. It proved that (3-
chloropropyl)trimethoxysilane was modified on silica gel with the capacity at
12.71 mg/g. From Table 12, the percentage of nitrogen and sulfur atoms in Si-
TADAP was increase from the immobilized silica gel. Therefore, the modified silica
gel was contained TADAP, namely Si-TADAP. From the elemental analysis,
Si-TADAP contained TADAP at capacity of 0.82 mg/g.
10. Determination of capacity for the adsorption of cobalt(II) by Si-TADAP
To determine the capacity for the adsorption of metal ion on the Si-TADAP,
the influence of various parameter such as pH, initial concentration of metal ion and
shaking time were optimized by using batch equilibrium experiment.
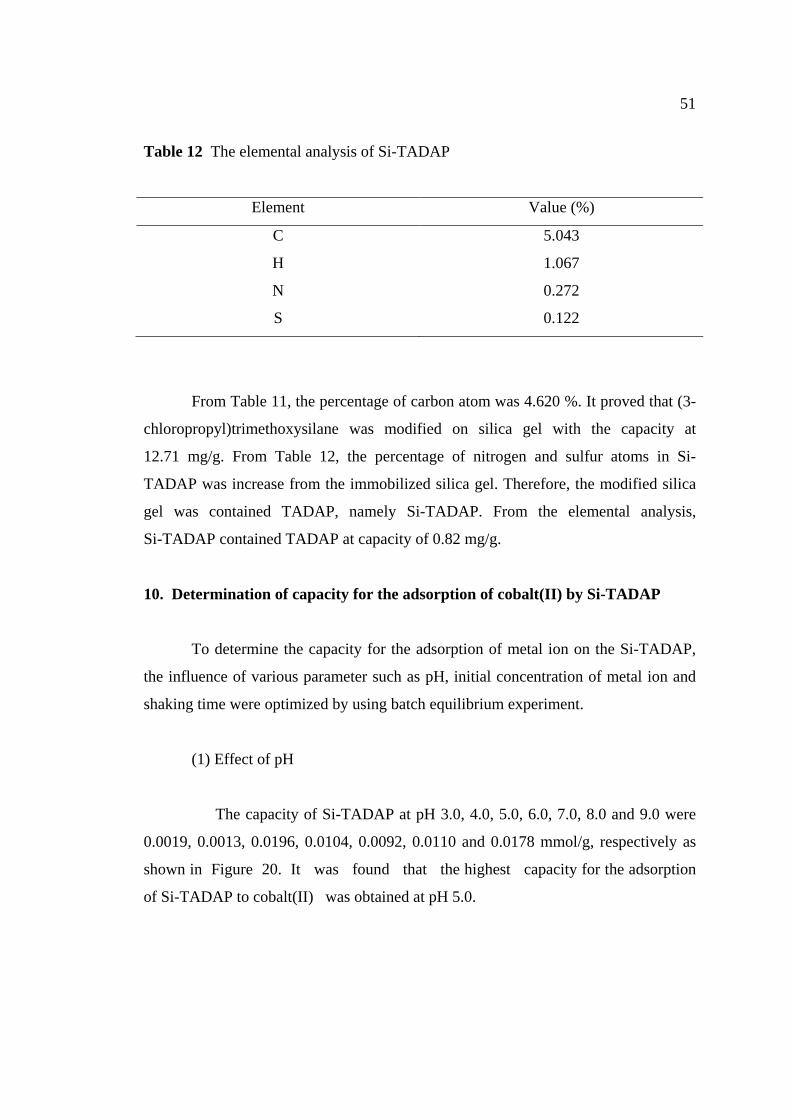
(1) Effect of pH
The capacity of Si-TADAP at pH 3.0, 4.0, 5.0, 6.0, 7.0, 8.0 and 9.0 were
0.0019, 0.0013, 0.0196, 0.0104, 0.0092, 0.0110 and 0.0178 mmol/g, respectively as
shown in Figure 20. It was found that the highest capacity for the adsorption
of Si-TADAP to cobalt(II) was obtained at pH 5.0.
52
0
0.005
0.01
0.015
0.02
0.025
0 2 4 6 8 10pH
Cap
acity
(mm
ol/g
)
Figure 20 Effect of pH on the adsorption of cobalt(II) by Si-TADAP
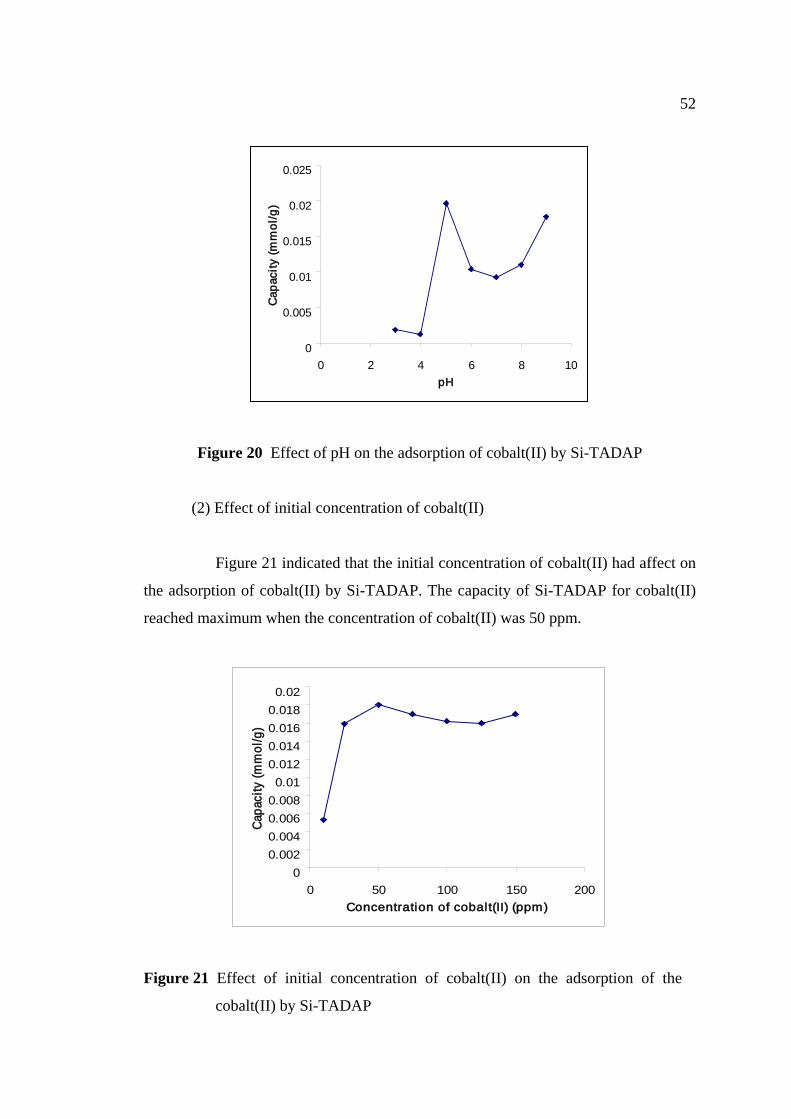
(2) Effect of initial concentration of cobalt(II)
Figure 21 indicated that the initial concentration of cobalt(II) had affect on
the adsorption of cobalt(II) by Si-TADAP. The capacity of Si-TADAP for cobalt(II)
reached maximum when the concentration of cobalt(II) was 50 ppm.
00.0020.0040.0060.0080.01
0.0120.0140.0160.0180.02
0 50 100 150 200Concentration of cobalt(II) (ppm)
Capa
city
(mm
ol/g
)
Figure 21 Effect of initial concentration of cobalt(II) on the adsorption of the
cobalt(II) by Si-TADAP
53
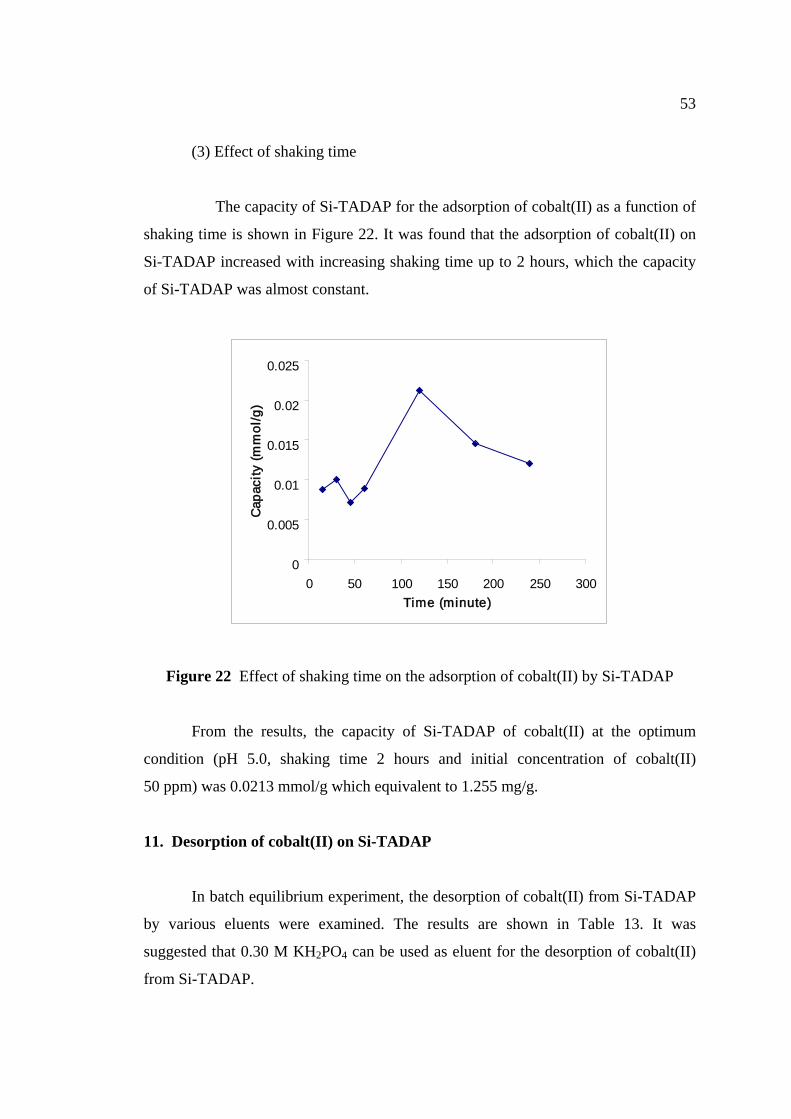
(3) Effect of shaking time
The capacity of Si-TADAP for the adsorption of cobalt(II) as a function of
shaking time is shown in Figure 22. It was found that the adsorption of cobalt(II) on
Si-TADAP increased with increasing shaking time up to 2 hours, which the capacity
of Si-TADAP was almost constant.
0
0.005
0.01
0.015
0.02
0.025
0 50 100 150 200 250 300Time (minute)
Cap
acity
(mm
ol/g
)
Figure 22 Effect of shaking time on the adsorption of cobalt(II) by Si-TADAP
From the results, the capacity of Si-TADAP of cobalt(II) at the optimum
condition (pH 5.0, shaking time 2 hours and initial concentration of cobalt(II)
50 ppm) was 0.0213 mmol/g which equivalent to 1.255 mg/g.
11. Desorption of cobalt(II) on Si-TADAP
In batch equilibrium experiment, the desorption of cobalt(II) from Si-TADAP
by various eluents were examined. The results are shown in Table 13. It was
suggested that 0.30 M KH2PO4 can be used as eluent for the desorption of cobalt(II)
from Si-TADAP.
54
Table 13 % Desorption of cobalt(II) from Si-TADAP by various eluents
Eluent % Desorption of cobalt(II)
0.1 M CH3COONa 49.31
0.5 M CH3COONa 21.28
0.1 M EDTA 2.39
0.2 M EDTA 4.36
0.25 M HCl 1.26
0.5 M HCl 3.15
0.1 M KH2PO4 68.65
0.2 M KH2PO4 74.00
0.3 M KH2PO4 79.50
12. Efficiency of Si-TADAP on the adsorption of cobalt(II)
The efficiency of Si-TADAP for adsorption of cobalt(II) was determined by
batch equilibrium experiment. As shown in figure 23, % Efficiency of first and
second reused of Si-TADAP was 63.58 % and 16.67 %, respectively.
Account for the low adsorption efficiency of the reused Si-TADAP, the used
Si-TADAP was digested with nitric acid and the solution was determined for the
cobalt(II) by atomic absorption spectrophotometer. It was found that some cobalt(II)
still adsorbed on Si-TADAP. Thus, the efficiency of the reused Si-TADAP decreased
due to the undesorpted cobalt(II) in the resin. To increase the efficient of the reused
Si-TADAP, the new eluent need to be investigated for further study.
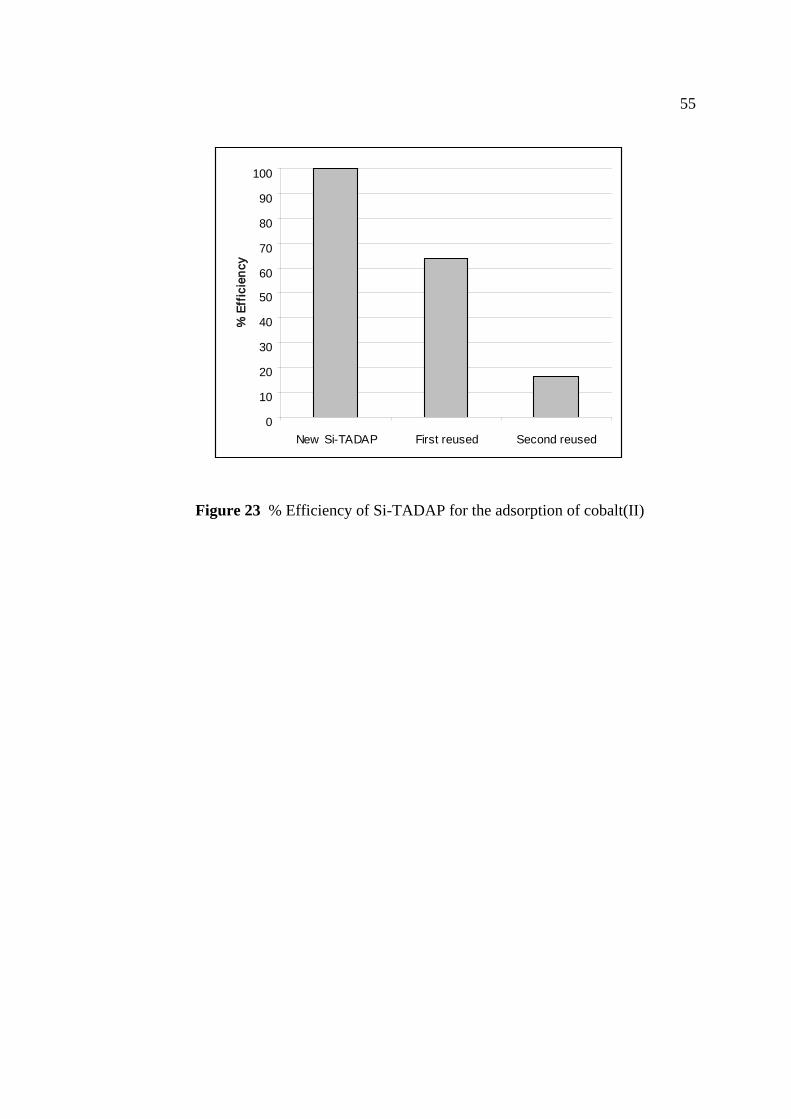
55
0
10
20
30
40
50
60
70
80
90
100
New Si-TADAP First reused Second reused
% E
ffic
ienc
y
Figure 23 % Efficiency of Si-TADAP for the adsorption of cobalt(II)
56
CONCLUSION
3-(2′-thiazolylazo)-2,6-diaminopyridine (TADAP) was synthesized and
characterized. The complex formation between cobalt(II) and TADAP was studied.
Cobalt(II) could form complex with TADAP in universal buffer solution ranging from
pH 9.0 to 11.0. The wavelength which gave the maximum different in absorbance
between cobalt(II) complex and TADAP was 598 nm. The ratio of cobalt(II):TADAP
was 1:2. The structure of complex between cobalt(II) and TADAP was determined by
FT-IR, 1H-NMR and elemental analysis which was proved that TADAP acts as
tridentate ligand. The stability constant of complex between cobalt(II) and TADAP
was determined by Benesi-Hildebrand’s equation. From the optimum condition of
cobalt(II) complex in universal buffer solution of pH 10, the stability constants was
1.86 x 10¹⁰. This may be concluded that the complex between TADAP and cobalt(II)
was fairly stable.
TADAP could be applied as the analytical reagent for the analysis of cobalt(II)
by spectrophotometric method. The linear range of the method was 2.0 x 10⁻⁶ to
1.2 x 10⁻⁵ M with the molar extinction coefficient of 1.52 x 10⁴ l-1mol-1cm-1. The
interfering effect on the analysis of cobalt(II) of various metal ions such as
cadmium(II), iron(III), nickel(II), sodium and calcium(II) were studied. Iodide and
chloride ion were proved to be effective masking reagent for cadmium(II).
A modified silica gel containing 3-(2′-thiazolylazo)-2,6-diaminopyridine (Si-
TADAP) was developed for selective sorption of cobalt(II) from aqueous solutions.
The capacity of Si-TADAP of cobalt(II) at the optimum condition was 0.0213 mmol/g
which equivalent to 1.255 mg/g. Seventy nine percents of cobalt(II) in the loaded Si-
TADAP was successfully eluted by 0.3 M KH2PO4.

57
LITERATURE CITED
Amin, A.S., T.Y. Mohammed and A.A. Mousa. 2003. Spectrophotometric studies and
applications for the determination of yttrium in pure and in nickel base alloys.
Spectrochimica Acta Part A. 59: 2577-2584.
Barbette, F., F. Rascalou, H. Chollet, J.L. Babouhot, F. Denat and R. Guilard. 2004.
Extraction of uranyl ions from aqueous solutions using silica-gel-bound
macrocycles for alpha contaminated waste water treatment. Analytica
Chimica Acta. 502: 179-187.
Bhalotra, A. and B.K. Puri. 1999. Trace determination of zinc in standard alloys,
environmental and pharmaceutical samples by fourth derivative
spectrophotometry using 1-2-(thiazolylazo)-2-naphthol as reagent and
ammonium tetraphenylborate supported on naphthalene as adsorbent.
Talanta. 49: 485-493.
Busev, A.I., V.M. Ivanov and E.D. Usama. 1968. Spectrophotometric investigation of
5-(2-thiazolylazo)-2,6-diaminopyridine. Khimiya. 23(5): 66-69.
Esteves, M.A., A. Cachudo, S. Chaves and M.A. Santos. 2005. New silica-
immobilized hydroxypyrimidinone as sorbent of hard metal ions from aqueous
fluids. Journal of Inorganic Biochemistry. 99: 1762-1768.
Fan, X. and C. Zhu. 1998. Syntheses of three new benzoic acid-type thiazolylazo
reagents and their application to spectrophotometric determination of
microamounts of nickel. Microchemical Journal. 59: 284-293.
Garcia, F.M., V.D. Gonzalez and C.R.G. Tallo. 1982. Analytical application of 3-(2′-
thiazolylazo)-2,6-diaminopyridine. Spectrophotometric determination of
palladium. Microchemical J. 27(2): 194-199.
58
Gonzalez, V.D., C.R.G. Tallo and F.M. Garcia. 1983. Complexation equiilibria in the
system palladium(II)/3-(2′-thiazolylazo)-2,6-diaminopyridine/chloride. Anales
de quimica, Serie B. 79: 83-87.
Gonzalez, V.D., M.J. Sanchez. and F.M. Garcia. 1986. Complexation equilibriums
and spectrophotometric determination of cobalt with 3-(2'-thiazolylazo)-2,6-
diaminobenzene and 3-(2'-thiazolylazo)-2,6-diaminopyridine. Quimica
Analitica (Barcelona, Spain). 5(3): 335-341.
Greenwood, N.N. and A. Earnshaw. 1997. Chemistry of the elements. 2nd ed.
Butterworth-Heinemann, Oxford. 1340p.
Hanna, W.G. 1999. Complexation and determination of palladium (II) ion with para-
Cl-phenylazo-R-acid spectrophotometrically. Talanta. 50: 809–818.
Hashem, E.Y., M.S. Abu-Bakr and S.M. Hussain. 2002. Interaction of nickel with 4-
(2'-benzothiazolylazo) salicylicacid (BTAS) and simultaneous first-derivative
spectrophotometric determination of nickel(II) and iron(III). Spectrochimica
Acta Part A. 59: 761-769.
Hassanien, M.M. and Abou-El-Sherbini. 2005. Synthesis and characterisation of
morin-functionalised silica gel for the enrichment of some precious metal ions.
Talanta.
Jesionowski, T., S. Binkowski and A. Krysztafkiewicz. 2005. Adsorption of the
selected organic dyes on the functionalized surface of precipitated silica via
emulsion route. Dyes and Pigments. 65: 267-279.
Kompany-Zareh, M., A. Massoumi and H. Tavallali. 1999. Simultaneous
spectrophotometric determination of copper(II) and nickel(II) as complexes
with sodium diethyldithiocarbamate in an anionic micellar medium using
partial least-squares regression. Microchemical Journal. 63: 257-265.
59
Krysztafkiewicz, A., S. Binkowski and T. Jesionowski. 2002. Adsorption of dyes on a
silica surface. Applied Surface Science. 199: 31-39.
Kumar, M., D.P.S. Rathore and A.K. Singh. 2000. Amberlite XAD-2 funtionalized
with o-aminophenol: synthesis and applications as extractant for copper(II),
cobalt(II), cadmium(II), nickel(II), zinc(II) and lead(II). Talanta. 51: 1187-
1196.
Lemos, V.A., C.F. de Brito, A.C. Ferreira and M.A. Korn. 1998. Flame atomic
absorption spectrometric determination of cobalt after on-line
preconcentration. Canadian J. Anal. Sci. Spec. 47(2): 49-54.
Madrakian, T., A. Afkhami, M.A. Zolfigol and M. Solgi. 2005. Separation,
preconcentration and determination of silver ion from water samples using
silica gel modified with 2,4,6-trimorpholino-1,3,5-triazin. Journal of
Hazardous Materials B. 128: 67-72.
Mao, X., F. Tang, Y. Chen and M. Zhong. 1986. Synthesis and analytical
characterization of a polystyrene-azo-PAR chelating resin. Huaxue Shiji.
8(5): 269-273.
Miller, J.N. and J.C. Miller. 2000. Statistics and chemometrics for analytical
chemistry. 4th ed. Pearson Prentice Hall, Harlow, England. 271 p.
Nakayama, M., M. Chikuma, H. Tanaka and T. Tanaka. 1982. A chelate-forming
resin bearing mercapto and azo groups and its application to the recovery of
mercury(II). Talanta. 29(6): 503-506.
Ngeontae, W., W. Aeungmaitrepirom and T. Tuntulani. 2006. Chemically modified
silica gel with aminothioamidoanthraquinone for solid phase extraction and
preconcentration of Pb(II), Cu(II), Ni(II), Co(II) and Cd(II). Talanta.
60
Oxspring, D.A., T.J. Maxwell and W.F. Smyth. 1996. UV-visible spectrophotometric,
adsorptive stripping voltammetric and capillary electrophoretic study of 2-(5'-
bromo-2'-pyridylazo)-5-diethylaminophenol and its chelates with selected
metal ions: application to the determination of Co(III) in vitamin B12.
Analytica Chimica Acta. 323: 97-105.
Perez, P., L. Maria, M.J. Sanchez, J.J. Arias, V. Gonzalez and F.M. Garcia. 1987.
Complexes of copper(II) with 3-(2'-thiazolylazo)-2,6-diaminopyridine and 3-
(4'-methyl-2'-thiazolylazo)-2,6-diaminopyridine. Spectrophotometric deter-
mination of copper. Quimica Analitica (Barcelona, Spain). 6(3): 355-361.
Rungrojwittayakul, S. 2004. Separation of Lead and Cobalt ions From Solution by
2-(2'-thiazolylazo)-p-cresol Chelating Resin. M.S. Thesis, Kasetsart
University.
Salazar, C. S. and M.I. Toral. 2004. Study of stability physical chemical of 3-(2'-
thiazolylazo)-2,6-diaminopyridine and the formation of 3-(N,N-ethyl-met-
azo)-2,6-diaminopyridine as a new ligand chromophore. J. Chil. Chem. Soc.
49(2): 169-172.
Shraydeh, B.F., Z.A.Z. Abu and M.A. Hannoun. 1992. Spectrophotometric
determination of trace amounts of cobalt and copper with 3-(2'-thiazolylazo)-
2,6-diaminopyridine. Spectroscopy Letters. 25(7): 1049-1055.
Shriver, D.F. and P.W. Atkins. 1999. Inorganic chemistry. 3rd ed., Oxford University
Press., New York. 763 p.
Saxena, R., A.K. Singh and S.S. Sambi. 1994. Synthesis of a chelating polymer
metrix by immobilizing alizarin red-S Amberlite XAD-2 and its application to
the preconcentration of lead(II), cadmium(II), zinc(II) and nickel(II). Anal.
Chim. Acta. 295: 199-204.

61
Tewari, P.K. and A.K. Singh. 2002. Preconcentration of lead with Amberlite XAD-2
and Amberlite XAD-7 based chelating resins for its determination by flame
atomic absorption spectrometry. Talanta. 56: 735-744.
Thaveema, P. 2005. Complex formation between 3-(2'-thiazolylazo)-2,6-
diaminopyridine with Palladium(II) and Gold(III) and its application as
reagent for determination of Gold(III). M.S. Thesis, Kasetsart University.
Toral, M.I., P. Richter, N. Lara, M.T. Escudero and C. Soto. 2000. Simultaneous
determination of platinum and palladium by second derivative
spectrophotometry using 3-(2'-thiazolylazo)-2,6-diaminopyridine as
chromophore ligand. Analytical Letters. 33(1): 93-109.
Ueda, K., Y. Koshino and Y. Yamamoto. 1985. Preconcentration of uranium in
seawater with heterocyclic azo dyes supported on silica gel. Analytical
Letters. 18(A18): 2345-2359.
Zareba, S. and J. Melke. 1999. Spectrophotometric determination of aluminium in
pharmaceutical preparations by azo dyes of 1,2,4-triazole series.
Pharmaceutica Acta Helvetiae. 74: 361-364.
Zhao, S., X. Xia and Q. Hu. 1999. Complex formation of the new reagent 5-(6-
methoxy-2-benzothiazole-azo)-8-aminoquinoline with cobalt and nickel for
their sensitive spectrophotometric detection. Analytica Chimica Acta. 391:
365-371.

62
APPENDIX

63
[ML2] ([M]-[ML2])([L]-2[ML2])2
[ML2] ([M]-[ML2])[L]2
[M] 1 + 1
K[L]2
0
[ML2] K[L]2
[ML2] + K[L]2[ML2] K[L]2
APPENDIX A
Calculation of stability constant by Benesi-Hildebrand equation
For the example of the determination of stability constant, K, of complex
between cobalt(II) and TADAP in universal buffer solution of pH 10, the Benesi-
Hildebrand equation was applied from equilibrium reaction of complex.
M + 2L ML2 ------ (1)
The equilibrium constant for the above reaction is defined by the equation
K =
=
[M] – [ML2] =
[M] =
[ML2] = ------ (2)
From Beer’s law, the true molar extinction coefficient, ε0, of the complex at
the wavelength of maximum absorption will then be given by the equation
ε0 = A/cb = (logI0/I)/[ML2]b ------ (3)
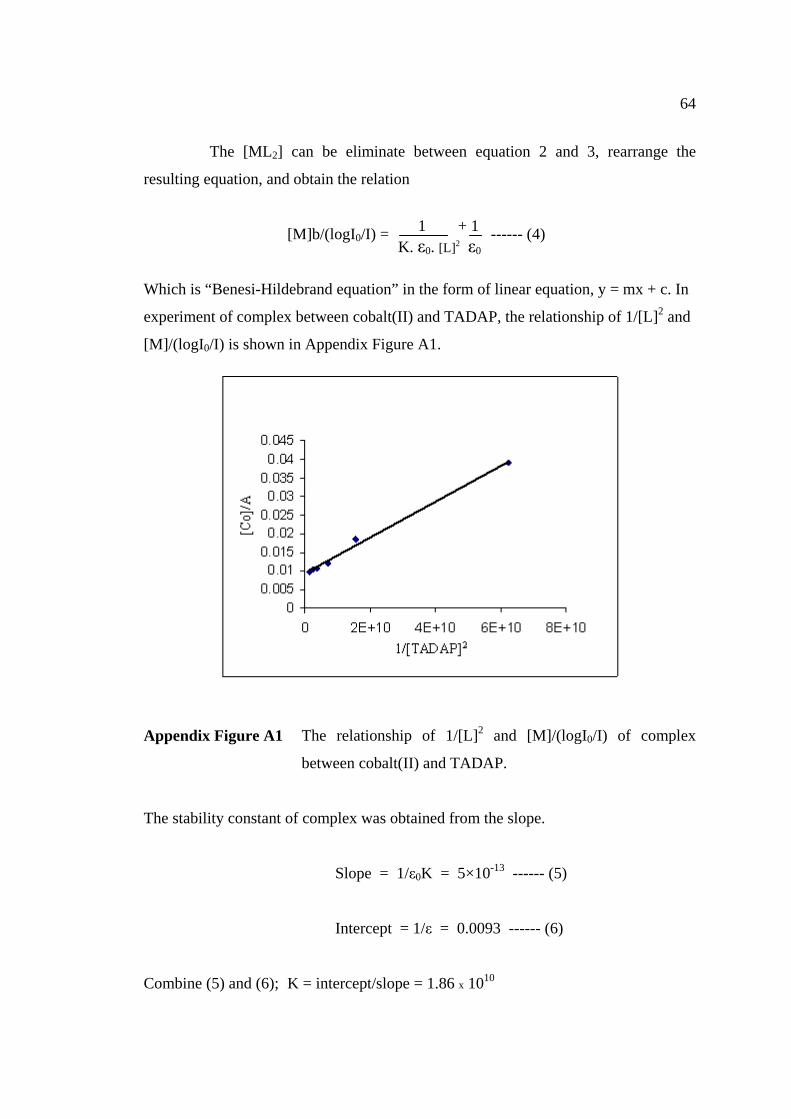
64
1 + 1 K. ε0. [L]2 ε0
The [ML2] can be eliminate between equation 2 and 3, rearrange the
resulting equation, and obtain the relation
[M]b/(logI0/I) = ------ (4)
Which is “Benesi-Hildebrand equation” in the form of linear equation, y = mx + c. In
experiment of complex between cobalt(II) and TADAP, the relationship of 1/[L]2 and
[M]/(logI0/I) is shown in Appendix Figure A1.
Appendix Figure A1 The relationship of 1/[L]2 and [M]/(logI0/I) of complex
between cobalt(II) and TADAP.
The stability constant of complex was obtained from the slope.
Slope = 1/ε0K = 5×10-13 ------ (5)
Intercept = 1/ε = 0.0093 ------ (6)
Combine (5) and (6); K = intercept/slope = 1.86 x 10¹⁰
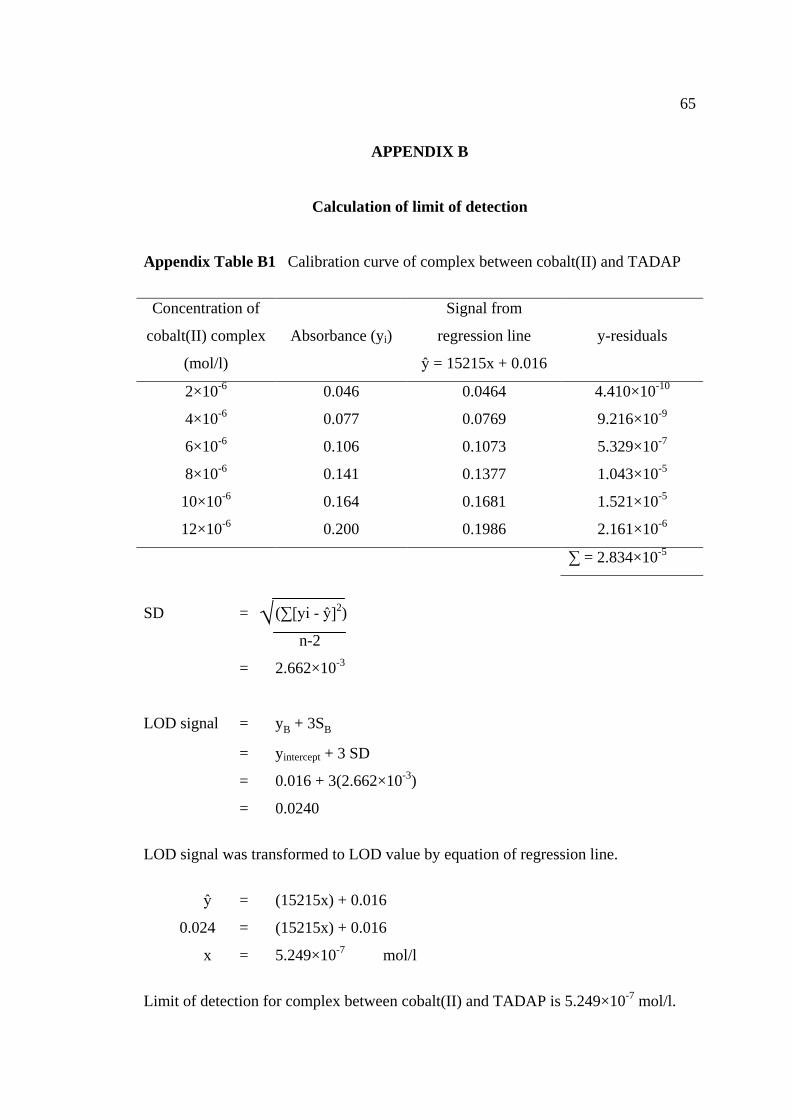
65
√
APPENDIX B
Calculation of limit of detection
Appendix Table B1 Calibration curve of complex between cobalt(II) and TADAP
Concentration of
cobalt(II) complex
(mol/l)
Absorbance (yi)
Signal from
regression line
ŷ = 15215x + 0.016
y-residuals
2×10⁻⁶
4×10⁻⁶
6×10⁻⁶
8×10⁻⁶
10×10-6
12×10-6
0.046
0.077
0.106
0.141
0.164
0.200
0.0464
0.0769
0.1073
0.1377
0.1681
0.1986
4.410×10⁻¹⁰
9.216×10⁻⁹
5.329×10⁻⁷
1.043×10⁻⁵
1.521×10⁻⁵
2.161×10⁻⁶
∑ = 2.834×10⁻⁵
SD = (∑[yi - ŷ]2)
n-2
= 2.662×10⁻³
LOD signal = yB + 3SB
= yintercept + 3 SD
= 0.016 + 3(2.662×10⁻³)
= 0.0240
LOD signal was transformed to LOD value by equation of regression line.
ŷ = (15215x) + 0.016
0.024 = (15215x) + 0.016
x = 5.249×10⁻⁷ mol/l
Limit of detection for complex between cobalt(II) and TADAP is 5.249×10⁻⁷ mol/l.

66
APPENDIX C
Calculation of the percentage of elements of TADAP
Molecular formula of TADAP is C8H8N6S. From molecular weight of TADAP
(220.254 g/mol), the percentage of elements of TADAP can be determined as
followed:
Percentage of carbon = number of carbon × atomic weight of carbon × 100
= 8 × 12.011 × 100
= 43.64%
Percentage of hydrogen = number of hydrogen × atomic weight of hydrogen × 100
= 8 × 1.008 × 100
= 3.66%
Percentage of nitrogen = number of nitrogen × atomic weight of nitrogen × 100
= 6 × 14.007 × 100
= 38.16%
Percentage of sulfur = number of sulfur × atomic weight of sulfur × 100
= 1 × 32.066 × 100
= 14.56%
Molecular weight of TADAP
220.254
Molecular weight of TADAP
220.254
Molecular weight of TADAP
220.254
Molecular weight of TADAP
220.254