Embed Size (px)
Citation preview
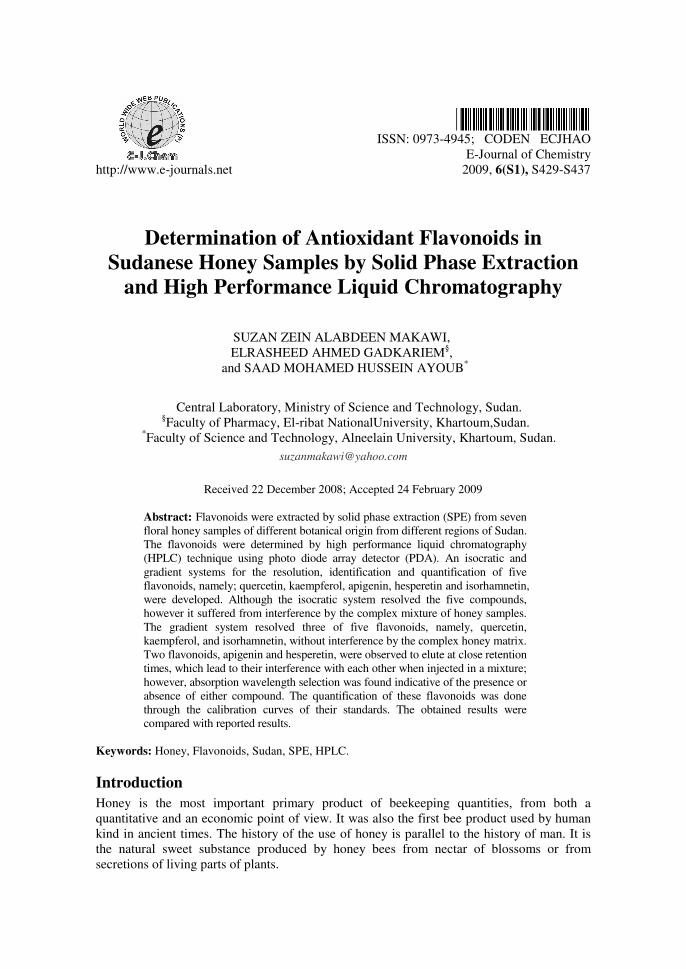
ISSN: 0973-4945; CODEN ECJHAO
E-Journal of Chemistry
http://www.e-journals.net 2009, 6(S1), S429-S437
Determination of Antioxidant Flavonoids in
Sudanese Honey Samples by Solid Phase Extraction
and High Performance Liquid Chromatography
SUZAN ZEIN ALABDEEN MAKAWI,
ELRASHEED AHMED GADKARIEM§,
and SAAD MOHAMED HUSSEIN AYOUB*
Central Laboratory, Ministry of Science and Technology, Sudan. §Faculty of Pharmacy, El-ribat NationalUniversity, Khartoum,Sudan.
*Faculty of Science and Technology, Alneelain University, Khartoum, Sudan.
Received 22 December 2008; Accepted 24 February 2009
Abstract: Flavonoids were extracted by solid phase extraction (SPE) from seven
floral honey samples of different botanical origin from different regions of Sudan.
The flavonoids were determined by high performance liquid chromatography
(HPLC) technique using photo diode array detector (PDA). An isocratic and
gradient systems for the resolution, identification and quantification of five
flavonoids, namely; quercetin, kaempferol, apigenin, hesperetin and isorhamnetin,
were developed. Although the isocratic system resolved the five compounds,
however it suffered from interference by the complex mixture of honey samples.
The gradient system resolved three of five flavonoids, namely, quercetin,
kaempferol, and isorhamnetin, without interference by the complex honey matrix.
Two flavonoids, apigenin and hesperetin, were observed to elute at close retention
times, which lead to their interference with each other when injected in a mixture;
however, absorption wavelength selection was found indicative of the presence or
absence of either compound. The quantification of these flavonoids was done
through the calibration curves of their standards. The obtained results were
compared with reported results.
Keywords: Honey, Flavonoids, Sudan, SPE, HPLC.
Introduction
Honey is the most important primary product of beekeeping quantities, from both a
quantitative and an economic point of view. It was also the first bee product used by human
kind in ancient times. The history of the use of honey is parallel to the history of man. It is
the natural sweet substance produced by honey bees from nectar of blossoms or from
secretions of living parts of plants.
S430 S. H. AYOUB et al.
Honey bees make honey to use and store as food, and humans exploited these trails. It
was probably discovered by humans tasting the sweet substance in honey combs from the
hollows of a tree, log, or cave. Thus, it is one of earliest forms of sweeteners and long
precedes the use of cane and beet sugar1. Beekeeping for the purpose of obtaining honey is
an ancient art, at least as early as the Egyptians (2000-5000 years ago) who used honey in
medicine, and nutrition.
The chemical composition of honey is complex, and according to the earlier report2, it
contains about 181substances, including sugars, proteins moisture, vitamins, minerals,
hydroxymethylfurfural (HMF), enzymes, flavonoids, phenolic acids, volatile compounds etc.,
However, the main constituents of honey are moisture, glucose, fructose, sucrose, minerals, and
proteins3.
Honey has been used since ancient times as a remedy for burns, cataracts, ulcers and
wound healing, because it has a smoothing effect during its initial application to open
wounds. It provides a protective barrier, owing to its high osmolarity, and creates a moist
wound-healing environment in the form of a solution that does not stick to wounded tissues.
This moist wound environment is believed to prevent bacterial colonization, and it is
believed, that honey reduces inflammation and also reduces exudates formation more
promptly than standard treatments1.
The antioxidant properties of honey are well known, because it contains a number of
compounds with antioxidant properties such as, flavonoids, phenolic acids, proteins, amino
acids, ascorbic acid, HMF, and some enzymes4. The most important classes of antioxidant
polyphenols are the flavonoids and phenolic acids; it is these substances in tea, wine, fruits
and vegetables that are most responsible for the antioxidant characteristics, and thus the
healthy image of these foods.
Sudan, the largest country in Africa, with its different climatic conditions ranging from
Sahara and sub-Sahara, savannah and tropical regions possesses a tremendous wealth of
terrestrial plants which contribute to the economy of the country. Medicinal plants represent
an important part of these resources with great potentialities and research in this field is
encouraged by different institutions in public and private sectors. Sudanese floral honey in
the last decades gained a solid ground and interest in the field of commerce and research, but
the available honey products of different origins lack documentation in the literature about
their composition and properties. The present research was undertaken to spot more light on
the composition of floral honeys from different regions in Sudan with emphasis on their
antioxidant polyphenols. While there are various types of antioxidants naturally occurring in
honey as mentioned previously, this study focuses only on the flavonoids.
Honey flavonoids can originate from nectar, pollen or propolis. Propolis, being a natural
constituent of honeycombs, has components that are probably distinguished between the
relatively lipophilic beeswax and the more hydrophilic honey5. As the flavonoids are relatively
lipophilic, their concentration in honey is much lower than that in propolis6. Only flavonoid
aglycones (without sugar moieties) seem to be present in propolis and honey, while honeybee
pollen contains flavonol in herosidic forms7. The flavonoids in honey and propolis have been
identified as flavanones and flavanols7. In general, the flavonoid concentration
8 in honey is
approximately 20 mg/kg. Unlike flavonoids in nectar or pollen, some of the flavonoids found
in honey are aglycones with an unsubstituted B ring9. Scheme 1 shows the general structure of
flavonoids. Compounds in honey that have been identified include flavones such as Apigenin;
flavonols such as kaempferol; flavavones such as hesperetin; and phenolic acids.
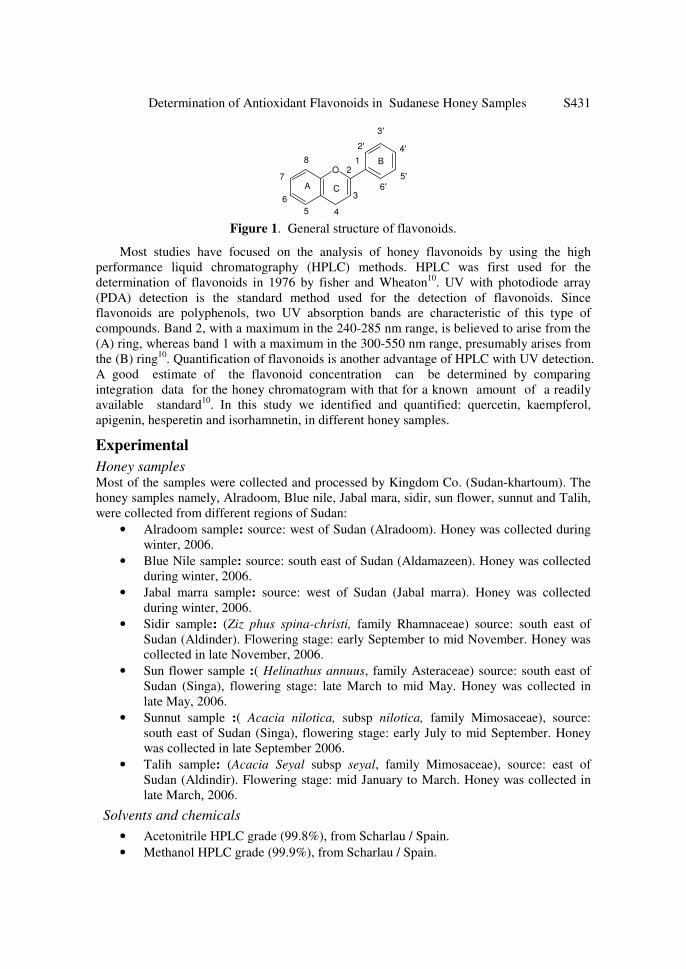
Determination of Antioxidant Flavonoids in Sudanese Honey Samples S431
O
1
2
3
45
6
7
8
2'
3'
4'
5'
6'A
B
C
Figure 1. General structure of flavonoids.
Most studies have focused on the analysis of honey flavonoids by using the high
performance liquid chromatography (HPLC) methods. HPLC was first used for the
determination of flavonoids in 1976 by fisher and Wheaton10
. UV with photodiode array
(PDA) detection is the standard method used for the detection of flavonoids. Since
flavonoids are polyphenols, two UV absorption bands are characteristic of this type of
compounds. Band 2, with a maximum in the 240-285 nm range, is believed to arise from the
(A) ring, whereas band 1 with a maximum in the 300-550 nm range, presumably arises from
the (B) ring10
. Quantification of flavonoids is another advantage of HPLC with UV detection.
A good estimate of the flavonoid concentration can be determined by comparing
integration data for the honey chromatogram with that for a known amount of a readily
available standard10
. In this study we identified and quantified: quercetin, kaempferol,
apigenin, hesperetin and isorhamnetin, in different honey samples.
Experimental
Honey samples Most of the samples were collected and processed by Kingdom Co. (Sudan-khartoum). The
honey samples namely, Alradoom, Blue nile, Jabal mara, sidir, sun flower, sunnut and Talih,
were collected from different regions of Sudan:
• Alradoom sample: source: west of Sudan (Alradoom). Honey was collected during
winter, 2006.
• Blue Nile sample: source: south east of Sudan (Aldamazeen). Honey was collected
during winter, 2006.
• Jabal marra sample: source: west of Sudan (Jabal marra). Honey was collected
during winter, 2006.
• Sidir sample: (Ziz phus spina-christi, family Rhamnaceae) source: south east of
Sudan (Aldinder). Flowering stage: early September to mid November. Honey was
collected in late November, 2006.
• Sun flower sample :( Helinathus annuus, family Asteraceae) source: south east of
Sudan (Singa), flowering stage: late March to mid May. Honey was collected in
late May, 2006.
• Sunnut sample :( Acacia nilotica, subsp nilotica, family Mimosaceae), source:
south east of Sudan (Singa), flowering stage: early July to mid September. Honey
was collected in late September 2006.
• Talih sample: (Acacia Seyal subsp seyal, family Mimosaceae), source: east of
Sudan (Aldindir). Flowering stage: mid January to March. Honey was collected in
late March, 2006.
Solvents and chemicals
• Acetonitrile HPLC grade (99.8%), from Scharlau / Spain.
• Methanol HPLC grade (99.9%), from Scharlau / Spain.
S432 S. H. AYOUB et al.
• Apigenin HPLC grade – from Applichem / Germany
• Hesperetin HPLC grade – from Applichem / Germany.
• Isorhamnetin HPLC grade – from Applichem / Germany.
• Quercetin HPLC grade – from Applichem / Germany.
• All other chemicals used were either of analytical grade or general purpose
reagents.
Preparation of standards
The stock solution (1000 µg/mL) for each standard was prepared by weighing 25 mg of
standard, dissolved in methanol (in acetonitrile for kaempferol) and the volume completed to
25 mL in volumetric flask with methanol. The working standard solutions were prepared by
diluting the stock solution (1000 µg/mL) to contain concentrations 2.5 µg/mL, 50 µg/mL and
100 µg/mL for quercetin, and 5 µg/mL, 25 µg/mL, 50 µg/mL and 100 µg/mL for each of
kaempferol, hesperetin, apigenin and isorhamnetin.
Preparation of honey samples
Five grams of all honey samples were dissolved in 10 mL deionized water, adjusted to pH 2
with HCl (1N), and passed through the solid phase extraction (SPE) Column (C18) - 500 mg.
SPE procedure
Column preparation: The C18 column was rinsed with 3 mL methanol HPLC grade + 3 mL
acetonitrile (HPLC grade) + 3 mL deionized water at a flow rate 1 mL/min (9 mL of this
solvent in 9 min) , the column was then rinsed with 3 mL of deionized water (at pH = 2) +10
mL of deionized water at a flow rate 1 mL/min (13 mL of this solvent in 13 min ).
Sample purification or clean-up process: Samples were applied at top of the column and
the solvents were drawn through the column bed by a syringe. The column was washed with
3 mL deionized water (at pH = 2) + 10 mL deionized water at 1 mL/min flow rate. The
adsorped materials were then collected by 2 mL methanol (HPLC grade) + 1 mL acetonitrile
(HPLC grade) at 1 mL/min flow rate. The samples were filtered through a 0.45 µm
membrane syringe filter, and collected in a 10 mL glass vial, and kept in the refrigerator for
HPLC analysis.
HPLC Conditions
The chromatographic separation was conducted using an isocratic and gradient systems.
The gradient system
The standard mixtures (50 µL from each standard) and the cleaned honey samples, were
analysed using a Waters (600) HPLC linked with a computer-controlled system. Sample
(20 µL) was injected using a manual injector. The flavonoids were detected using a waters
(2996) photodiode array detector (PDA), the column used was a reversed phase C18
column (15 cm х 0.46 cm). For analysis by (PDA) detection, UV spectra were recorded
from 210-400 nm at a resolution 1.2 nm. In particular, the chromatograms were monitored
at 340 nm and 290 nm. The mobile phase was composed of 5% acetic acid in deionized
water (solvent A), and acetonitrile HPLC grade (solvent B), at a constant solvent flow rate
1 mL/min.
• Solvent A = 5% acetic acid in deionized water
• Solvent B = Acetonitrile HPLC grade (99.8%).
The following gradient was used:
Determination of Antioxidant Flavonoids in Sudanese Honey Samples S433
Table 1. The gradient system.
The isocratic system
The mobile phase was composed of 5% acetic acid in deionized water (solvent A), and
methanol HPLC grade (solvent B), at a flow rate 1.5 mL/min.
Solvent (A) = 65%
Solvent (B) = 35%
Identification and quantification of flavonoids in honey samples extracts
The mentioned flavonoids were identified and quantified according to the gradient system.
In order to identify each peak in the chromatograms of honey extracts, retention times of
all peaks were compared with those of flavonoid standards. The flavonoids were
quantified using external standard method (Three to five working standards of quercetin,
hesperetin, kaempferol, apigenin and isorhamnetin). A plot of peak heights against
concentration of each standard was done. Regression analysis data were obtained. The
standards (quercetin, kaempferol, apigenin and isorhamnetin) were recorded at 340 nm,
while hesperetin was recorded at 290 nm. The flavonoids were quantified against their
respective standards
Results and Discussion
Honey samples are expected to be composed of a complex matrix with different uv-
absorbing compounds (flavonoids and phenolic acids), therefore only a separating
method is likely to resolve such complex matrix. This could be done using HPLC
method at an isocratic mode or more probably at a gradient mode. In this study both
isocratic and gradient separations were tried. Out of the studied isocratic systems, the
use of 65% v/v of 5% acetic acid in water and 35% v/v methanol was found to give the
best resolution between these five studied standards; however the eluting peaks were
showing front tailing besides the overlapping observed when honey samples were
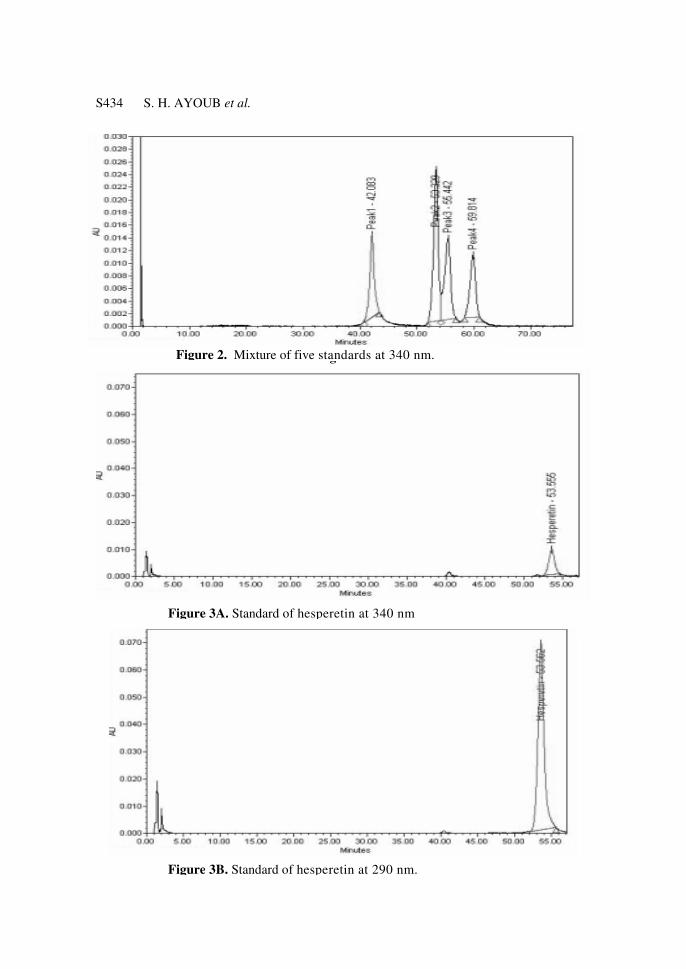
injected. On the other hand the gradient system (Table 1 & Figure 2) showed
reasonable resolution for three of the studied standards (quercetin, kaempferol and
isorhamnetin) and some overlap between apigenin and hesperetin. The problem of the
co-eluting peaks (hesperetin-apigenin) was not possible to solve, although different
gradient systems were tried. However the study of their UV-absorption revealed that
hesperetin has low intensity of absorption at 340 nm (Figure 3A), and high absorption
at 290 nm (Figure 3B). Apigenin and the other standards showed the reversed
phenomena; this was found useful for the assay of hesperetin at 290 nm where the
interfering apigenin has very low absorption, besides this fact, hesperetin is found at
very low concentration in honey samples, and therefore it is expected to have
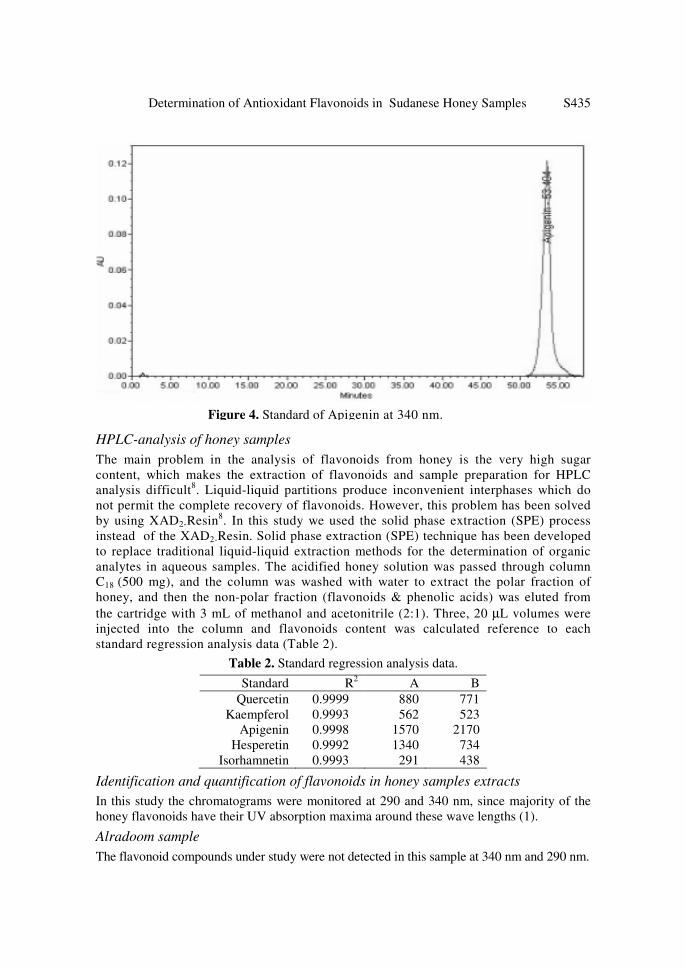
negligible interference in the assay of apigenin at 340 nm (Figure 4).
Time, min Flow, mL/min A, % B, %
Initial 1:00 95 5
15 1:00 85 15
25 1:00 85 15
40 1:00 78 22
70 1:00 78 22
80 1:00 75 25
90 1:00 95 5
S434 S. H. AYOUB et al.
Figure 2.
Figure 2. Mixture of five standards at 340 nm.
Figure 3A. Standard of hesperetin at 340 nm
Figure 3B. Standard of hesperetin at 290 nm.
Determination of Antioxidant Flavonoids in Sudanese Honey Samples S435
HPLC-analysis of honey samples
The main problem in the analysis of flavonoids from honey is the very high sugar
content, which makes the extraction of flavonoids and sample preparation for HPLC
analysis difficult8. Liquid-liquid partitions produce inconvenient interphases which do
not permit the complete recovery of flavonoids. However, this problem has been solved
by using XAD2-Resin8. In this study we used the solid phase extraction (SPE) process
instead of the XAD2-Resin. Solid phase extraction (SPE) technique has been developed
to replace traditional liquid-liquid extraction methods for the determination of organic
analytes in aqueous samples. The acidified honey solution was passed through column
C18 (500 mg), and the column was washed with water to extract the polar fraction of
honey, and then the non-polar fraction (flavonoids & phenolic acids) was eluted from
the cartridge with 3 mL of methanol and acetonitrile (2:1). Three, 20 µL volumes were
injected into the column and flavonoids content was calculated reference to each
standard regression analysis data (Table 2).
Table 2. Standard regression analysis data.
Standard R2
A B
Quercetin 0.9999 880 771
Kaempferol 0.9993 562 523
Apigenin 0.9998 1570 2170
Hesperetin 0.9992 1340 734
Isorhamnetin 0.9993 291 438
Identification and quantification of flavonoids in honey samples extracts
In this study the chromatograms were monitored at 290 and 340 nm, since majority of the
honey flavonoids have their UV absorption maxima around these wave lengths (1).
Alradoom sample
The flavonoid compounds under study were not detected in this sample at 340 nm and 290 nm.
Figure 4. Standard of Apigenin at 340 nm.
S436 S. H. AYOUB et al.
Blue nile sample
The flavonoids identified in Blue nile sample were quercetin, hesperetin, kaempferol,
apigenin. The concentration of quercetin, kaempferol, apigenin were calculated at 340 nm
and hesperetin at 290 nm using the calibration curve of these compounds.
Jabal marra sample
The flavonoids identified in Jabal marra sample were quercetin, isorhamnetin. The
concentration of quercetin and isorhamnetin were calculated at 340 nm using the calibration
data of these compounds.
Sidir sample (Zizphus spina-christi)
The flavonoid identified in Sidir sample was quercetin. The concentration of quercetin was
calculated at 340 nm using the calibration data of quercetin. A comparison was done
between Sidir sample studied flavonoids content and published data on sidir samples studied
in Egypt (Table 3).
Table 3. Comparison of studied flavonoids content and published data.
Flavonoids Present study* Published study
14 Quercetin 154.7 -
Hesperetin - 159.33
Kaempferol - 20.07 *Sidir sample
Sun flower sample (Helinathus annuus) The flavonoids identified in sun flower sample were quercetin, kaempferol, apigenin,
hesperetin and isorhamnetin. Hesperetin absorbs strongly at 290 nm. The concentration of
quercetin, kaempferol, apigenin, and isorhamnetin were calculated at 340 nm and hesperetin
at 290 nm using the calibration data of these compounds. The comparison of results obtained
in this study and Helianthus honey in study of Fast SPE Extraction and LC-ESI-MS-MS
analysis of flavonoids and phenolic acids (Patrizio pulcini, Francesco Allegrini, Norma
Festuccia 2006), is shown in Table 4.
Table 4. The comparison of results.
Flavonoids Present study*
Published study12
Quercetin 69.9 131
Hesperetin 640.6 14
Apigenin 52.6 22
Kaempferol 535.3 167
Isorhamnetin 36.6 - *Sun flower sample
Sunnut sample (Acacia nilotica)
The flavonoid identified in sunnut sample was quercetin. The concentration of quercetin
(Table 5) was calculated at 340 nm using the calibration data of quercetin. The comparison
between sunnut sample and a published study in acacia honey appears in Table 5.
Talih sample (Acacia seyal)
The flavonoid compounds under study were not detected in this sample at 340 nm or 290 nm.
Most of these samples seem to be very rich in different flavonoids and phenolic acids, which
need reference standards or the use of HPLC/MS to identify.
Determination of Antioxidant Flavonoids in Sudanese Honey Samples S437
Table 5. Comparison between sunnut sample and a published study in acacia honey.
*sunnut honey sample
Table 6. Summary of the concentration of some flavonoids (µg/100 g) calculated in the
studied honey samples.
In this study the content of the specific flavonoids studied were compared with some published
results. We are aware of the possible significant differences in the content of these flavonoids with
the compared results due to geographical and climatic differences. Actually there is no previous
study done in this line in Sudan and we are planning to establish reference data for the flavonoids
content in different samples in Sudan; therefore we consider this work as a preliminary study.
Acknowledgements
We are grateful to Prof. Abdel Rhim M AL Hussein for his help and support and to the staff
of the central laboratory –Ministry of Science and Technology.
References
1 Coulston A M, Nutrition Today, 2000, 35(3), 96-100.
2 Al-mamary M, Al-Meeri A and Al-Habori M, Nutrition Research, 2002, 22(9), 1041-1047.
3 Kirk R S and Sawyer R, Sugars and preserves in Pearson’s composition and analysis
of foods, 9th
Edn, Longman Scientific and Technical, Essex, 1991.
4 Gheldof H and Engeseth N J, J Agri Food Chem., 2002, 50(10), 3050-3055.
5 Ferreres F, Ortiz A, Silva C, Garcia-Viguera C, Tomás-Barberán F A and Tomás-Lorente
F, Zeitschrift für Lebensmittel- Unterssuchung und-Forschung, 1992, 194, 139-143.
6 Bogdanov S, J Apic Res., 1989, 28(1), 55-57.
7 Anklam E, Food Chemistry, 1998, 63(4), 549-562.
8 Ferreres F, Tomás-Barberán F A, Soler C, García-Viguera C, Ortiz A and Tomás-
Lorente F, Apidologie, 1994c , 25(1), 21-30.
9 Campos M, Sabatier S, Amiot M J and Aubert S, Planta Med., 1990, 56, 580-581.
10 Sivam G, Analysis of Flavonoids, in W J Hurst (Ed), Methods of analysis for
functional foods and nutraceuticals, CRC Press, Baca Raton, 2002.
11 Bruce R D' Arcy, Antioxidants in Australian floral honey, The Rural Industries
Research and Development Corporation, Australian, 2005.
12. Patrizio Pulcini, Francesco Allegrini and NormaFestuccia, Apiacta, 2006, 41, 21-27.
13. Nele Gheldof, Xiao-Hong Wang and Nicki J Engeseth, J Agric Food Chem., 2002,
50, 5870-5877.
14. Ahmed G Hegazi and Faten K Abd El Hady, Department of Zoontic Diseases of
Natural Product, National Research Center Dokki, Egypt, 2006.
Flavonoid Present study* Published study
13 Published study
14
Quercetin
Kaempferol
Apigenin
67.2
-
-
61
45
-
17.58
2.36
0.12
Flavonoids Alradom
Blue
Nile
Jabal
marra
Sidir
Sun
flower
Sunnut
Talih
Quercetin
Hesperetin
Apigenin
Kaempferol
Isorhamnetin
-
-
-
-
-
320.5
391.4
38.3
39.9
-
1.8
-
-
-
32.4
154.7
-
-
-
-
69.9
640.6
52.6
535.3
36.6
67.2
-
-
-
-
-
-
-
-
-
Submit your manuscripts athttp://www.hindawi.com
Hindawi Publishing Corporationhttp://www.hindawi.com Volume 2014
Inorganic ChemistryInternational Journal of
Hindawi Publishing Corporation http://www.hindawi.com Volume 2014
International Journal ofPhotoenergy
Hindawi Publishing Corporationhttp://www.hindawi.com Volume 2014
Carbohydrate Chemistry
International Journal of
Hindawi Publishing Corporationhttp://www.hindawi.com Volume 2014
Journal of
Chemistry
Hindawi Publishing Corporationhttp://www.hindawi.com Volume 2014
Advances in
Physical Chemistry
Hindawi Publishing Corporationhttp://www.hindawi.com
Analytical Methods in Chemistry
Journal of
Volume 2014
Bioinorganic Chemistry and ApplicationsHindawi Publishing Corporationhttp://www.hindawi.com Volume 2014
SpectroscopyInternational Journal of
Hindawi Publishing Corporationhttp://www.hindawi.com Volume 2014
The Scientific World JournalHindawi Publishing Corporation http://www.hindawi.com Volume 2014
Medicinal ChemistryInternational Journal of
Hindawi Publishing Corporationhttp://www.hindawi.com Volume 2014
Chromatography Research International
Hindawi Publishing Corporationhttp://www.hindawi.com Volume 2014
Applied ChemistryJournal of
Hindawi Publishing Corporationhttp://www.hindawi.com Volume 2014
Hindawi Publishing Corporationhttp://www.hindawi.com Volume 2014
Theoretical ChemistryJournal of
Hindawi Publishing Corporationhttp://www.hindawi.com Volume 2014
Journal of
Spectroscopy
Analytical ChemistryInternational Journal of
Hindawi Publishing Corporationhttp://www.hindawi.com Volume 2014
Journal of
Hindawi Publishing Corporationhttp://www.hindawi.com Volume 2014
Quantum Chemistry
Hindawi Publishing Corporationhttp://www.hindawi.com Volume 2014
Organic Chemistry International
Hindawi Publishing Corporationhttp://www.hindawi.com Volume 2014
CatalystsJournal of
ElectrochemistryInternational Journal of
Hindawi Publishing Corporation http://www.hindawi.com Volume 2014