Embed Size (px)
Citation preview
Determination of Antibody Content in Live Versus Dead Hybridoma Cells: Analysis of Antibody Production in Osmotically Stressed Cultures
Sridhar Reddy, Kenneth D. Bauer,* William M. Miller' Department of Chemical Engineering, Northwestern University, Evanston, lL 60208-3120
Received October 17, 199lIAccepted May 29, 1992
Hybridomas are known to exhibit increased specific anti- body production rates when subjected to environmen- tal stress. Under these conditions, viability is low so that population-average measurements do not properly reflect the state of viable cells. Even for flow cytometry, which gives a population distribution, special techniques must be used to discriminate between viable and nonviable cells. We describe the use of the vital stain ethidium monoazide (EMA) for independent measurement of intracellular anti- body content in live and dead cells via flow cytometry. EMA is shown to be superior to light scattering techniques in identifying dead cells. We apply this technique to show that, in control batch culture, the specific antibody produ- tion rate and antibody content in live cells are constant dur- ing exponential growth, but decrease as cells enter the stationary phase. Antibody is retained in dead cells, but at a lower level than in live cells. We further show that, under hyperosmotic stress, the specific antibody production rate and antibody content in live cells both remain high during death phase. 0 1992 John Wiley & Sons, Inc. Key words: hybridoma cells antibody production flow cytometry
INTRODUCTION
Monoclonal antibodies are a major mammalian cell culture product. Despite recent successes in the pro- duction of antibody fragments in microbial cells (see Pluckthum2' for review), the method of choice for large- scale antibody production remains hybridoma cell culture. Hybridoma research has generally focused on methods to increase antibody production. We and oth- ers16,18,19 have shown that the specific (per cell) antibody production rate increases under stressful environmental conditions (e.g., low pH, hyperosmolarity, low dilution rate). The mechanisms for increased production are not yet understood, but possibilities include leakage from dead cells, increased synthesis by viable cells, and/or in- creased secretion by viable cells.
An increasingly common method for studying anti- body production in hybridomas is measurement of intra- cellular antibody content by flow cytometry. The major advantage of this technique is that the antibody distri- bution of an entire population is obtained, rather than a
* Department of Pathology and Cancer Center, Northwestern University Medical School, Chicago, IL 60611.
To whom all correspondence should be addressed.
Biotechnology and Bioengineering, Vol. 40, Pp. 947-964 (1992) 0 1992 John Wiley & Sons, Inc.
population average as obtained by other techniques. Analysis of the intracellular antibody content can pro- vide information on the magnitude of leakage from dead cells, as well as on changes in relative rates of synthesis and secretion.
When studying stressed cultures, it is important to discriminate between viable and nonviable cells, because such cultures invariably have a significant fraction of dead cells. Others have measured intracellular antibody content by flow c y t ~ m e t r y , ~ ~ ~ ~ ~ , ' ~ but could not simulta- neously measure viability. Propidium iodide and similar DNA stains selectively label nonviable cells,24 and may be used if no further permeabilization or fixing is neces- sary. However, permeabilization for intracellular labeling solubilizes the intercalated DNA stain in dead cells. As a result, all cells become labeled and discrimination between viable and nonviable cells is not possible.
Ethidium monoazide (EMA) has been shown to be an effective fluorescent stain for determining cell viability in fixed samples.23 As with other viability stains, dead cells take up EMA while live cells exclude it. However, unlike other stains, EMA can be made to form covalent linkages with dead-cell DNA by exposure to long wave- length light. This allows for subsequent permeabilization by alcohol without the dye diffusing out of dead cells and into live cells. Consequently, EMA-stained cells can be labeled with an antibody-fluorescein isothiocyanate (FITC) conjugate for simultaneous determination of viability and intracellular antibody content. Here we de- scribe quantitative flow cytometric methods for measure- ment of intracellular antibody in live and dead cells.
In addition to flow cytometric methods, we used gel electrophoresis, Western blotting, and ELISA to deter- mine if leakage from dead cells is likely to be a signifi- cant contributor to higher antibody production rates. These latter methods also provide biochemical con- firmation of immunofluorescence-based flow cytome- try results.
Changes in antibody production rates might conceiv- ably arise from changes in protein content or cell vol- ume. To investigate this, we used flow cytometry to correlate antibody content with total protein content and cell volume. The protein stain sulphorhodamine 101
CCC 0006-3592/92/080947-18
(SR101) is used to determine total intracellular pro- tein content, and can be used in conjunction with an antibody-f luorescein conjugate' for simultaneous deter- mination of total protein and antibody content. Unfor- tunately, EMA and SRlOl both emit red light so 3-color flow cytometry for simultaneous determination of via- bility, antibody, and total protein content is not possible with these dyes. Therefore, we only obtained total pro- tein information on cultures with very high or very low viabilities, for which the viability stain is not needed.
Finally, we applied flow cytometric methods to inves- tigate changes in intracellular antibody concentration in live and dead cells subjected to hyperosmotic stress. Our results indicate that flow cytometry is a useful technique for investigating changes in intracellular antibody con- tent under conditions for which viability is low and changes in dead, as well as live, cells must be considered.
MATERIALS AND METHODS
Cell Culture
All chemicals were from Sigma (St. Louis, MO) unless noted otherwise. Two mouse-mouse hybridoma cell lines were used in this study: AB2-143.2 (Sp2iO-derived; obtained from the University of California, San Fran- cisco"), which produces an IgG2, monoclonal antibody against benzene-arsonate; and INDl (fusion between BALB/c spleen cell and P3 X63-Ag8 myeloma; provided by Xoma Corp., Berkeley, CA), which produces an IgGza monoclonal antibody against melanoma tumor- associated antigens. AB2-143.2 cells were grown in Dulbecco's modified Eagle's medium (DMEM, Sigma #D7777) supplemented with 1.15% vol/vol MEM non- essential amino acid (100X) solution (Irvine Scientific, Santa Ana, CA), 2 mM glutamine (Irvine Scientific), and 10% fetal bovine serum (FBS, Irvine Scientific). INDl cells were grown in a 1 : 1 mixture of DMEM and Ham's F12 (Sigma #N6760) supplemented with 5 pg/ mL bovine insulin, 30 pg/mL bovine transferrin (iron- free), 20 p M ethanolamine, 20 nM sodium selenite, 3.5 mM glutamine, 1.15% vol/vol MEM nonessential amino acid (100X) solution, and 1% FBS. FBS was replaced by 0.1% bovine serum albumin (BSA, Sigma A-6003) for the osmotic-shock studies. No antibiotics were used in any of the stock cultures or experiments. Stock cultures were maintained in 250-mL static culture flasks (Bellco, Vineland, NJ) at 37°C and 5% COz in a humidified incubator. Total cell count was determined with a Coulter multisizer (Coulter Electronics, Hialeah, FL) and viability was determined by the trypan blue exclusion method using a hemacytometer.
Polyacrylamide Gel Electrophoresis and Blotting
Cell pellets (1 million total cells) were disrupted in 50 pL lysis buffer [62.5 mM tris, pH 6.8, 2% SDS, 0.1M DTT (dithiothreitol), 15% glycerol, bromophenol blue to
desired darkness] and run on a 10% SDS-polyacrylamide gel at 25 p L (500,000 total cells) per lane. Samples were run through a 5% stacking gel at 100 V until the dye front penetrated the resolving gel. Electrophoresis con- tinued at 300 V until the dye front approached the end of the gel.
Western blotting onto nitrocellulose was performed for 2 hours at 100 V. The blot was developed using the ProtoBlot AP system (Promega, Madison, WI). Goat antimouse antibody-alkaline phosphatase conju- gate (Sigma #A-5153, diluted 3 :5000 in washing buffer) was used as the probe.
Determination of Cell-Associated and Secreted Antibody
Midexponential AB2-143.2 cells (5 X lo5 cells/mL, 97% viable) were harvested and an initial antibody sample was taken. Cells were concentrated 10 times in either 0.2% Triton Xl00 or PBS. The PBS sample was sonicated using a microtip to assure total disruption. Antibody in supernatant and lysates was assayed by a specific ELISA procedure similar to that described previously," except that the increase in absorbance at 405 nm was monitored as a function of time. A stan- dard curve of concentration versus slope (change in absorbanceitime) was constructed. Concentrations for replicate samples at various dilutions were calculated from the standard curve. Extracellular antibody in the osmotic shock experiment was assayed by protein A affinity chromatography (see below).
Fluorescence Staining
All centrifugation steps were performed for 5 minutes at 700g. All steps were performed in microcentrifuge tubes at room temperature unless otherwise noted. For viabil- ity staining with ethidium monoazideZ3 (EMA) (Molecu- lar Probes, Eugene, OR), cell samples were pelleted and resuspended in 0.1 mL of 10 pg/mL EMA per 2 million cells. The samples were incubated in the dark for 15 minutes to allow dye uptake by dead cells. Incubation continued for 15 minutes under fluorescent light to allow covalent linkage of EMA to DNA of dead cells. We used a revised technique for the osmotic shock re- actor study; no incubation in the dark is necessary, and 10 minutes under light is sufficient. After staining, the cells were spun down, washed once in PBB (PBS with 0.1% BSA), and incubated for 30 minutes in 1% for- maldehyde (EM grade, Polysciences, Inc., Warrington, PA) in PBS. Cells were then spun down again and resus- pended in PBB containing 7% DMSO. These samples were stored at -80°C for later analysis. If EMA stain was not used, then cells were pelleted, directly fixed in 1% formaldehyde, and stored as above. For the reactor study, cells were fixed in 1 mL cold (-20°C) methanol after EMA staining and stored at -20°C.
For labeling of intracellular antibody, the frozen samples (with or without EMA stain) were thawed and
948 BIOTECHNOLOGY AND BIOENGINEERING, VOL. 40, NO. 8, OCTOBER 20. 1992
pelleted. One milliliter cold (-20°C) methanol was added dropwise to the pellets while vortexing to prevent clumping, and the samples were incubated at -20°C for at least 30 minutes to permeabilize the cells. Next, the cells were washed once with cold (4°C) PBB and resus- pended in 300 p L of goat antimouse-IgG antibody-FITC conjugate (Sigma #F-0257, diluted 1:50 in PBB). Cells were incubated 30 minutes at 4°C and washed twice with cold PBB. Because the cells in the reactor samples were already in methanol, they were washed in PBB and stained as described. It must be noted that this method of staining will also label surface antibody so we are actually measuring the total cell-associated antibody. However, because the amount of surface antibody is minimal in both cell lines (unpublished observation), we will henceforth refer to total cell-associated antibody as “intracellular antibody.” For nonspecific staining, the same protocol was used except that the label used was a goat antirabbit-IgG antibody-FITC conjugate (Sigma #F-0511, diluted 1:50 in PBB). If no total protein stain was to be used, then the samples were resuspended in cold PBB.
For total protein staining’ the cell pellets (after FITC labeling) were resuspended in 200 p L SRlOl (Kodak #14318) stock dye (3 pg/mL in tris buffer) plus 800 p L tris buffer (0.1M tris base, 0.1M NaCl, pH 7.4), both at 4°C. Samples were analyzed after at least 15 minutes.
All samples were kept at 4°C until analysis. Analysis was always done on the same day as staining. Immedi- ately before flow cytometry analysis, samples were fil- tered through a 37-pm nylon mesh.
Flow Cytometry Analysis
All fluorescence measurements were performed using an EPICS Profile flow cytometer (Coulter). Laser excita- tion was at 488 nm (15 mW). Green and red fluorescence were simultaneously measured with a 550-nm dichroic long-pass filter. Green fluorescence (FITC) was de- tected through a 530-nm short-pass and 525-nm band- pass filter, while red fluorescence (EMA and SR101) was detected through a 640-nm long-pass filter. A bit- map gate was set based upon the orthogonal and forward light-scattering characteristics of the cells. On a plot of log side scatter versus forward scatter, cells show up in the center, while debris and clumps appear at the ex- tremes of the plot. Data acquisition was stopped when 10,000 cells (or 20,000 cells for osmotic shock studies) were accumulated. Histograms presented here are rep- resentative of 2 or 3 replicate samples. Samples were run in random order to avoid possible time-dependent flow cytometer artifacts.
For quantitative analysis, the flow cytometer must be properly calibrated. This is especially important when samples are stained and analyzed on different days. For this purpose, calibration beads (superbright micro- spheres, lot #5017, Coulter) are run and the photomulti- plier tube volgates are varied to adjust the mean channel
numbers of the red and green histograms to specific values. This will correct for day-to-day variation in the instrument, but it is also necessary to account for varia- tions in the staining procedure. To this end, a biological standard is also run. The biological standard used in this study was INDl cells from a spinner flask culture. Samples of 2 million cells were fixed and frozen as de- scribed above. For each analysis, one vial of these bio- logical control cells was thawed and simultaneously labeled with the cells being analyzed. The variation in the mode of the green fluorescence for standards run on different days was typically less than 215% so no correc- tions were made, especially because we only report rela- tive changes between samples stained and run on the same day.
In addition to calibrating the instrument, one should always consider the contributions of autofluorescence and nonspecific binding to the green fluorescence histo- grams. The magnitude of nonspecific binding in live and dead cells will be discussed below. To test for autofluo- rescence, a biological standard was fixed with methanol, washed, and directly analyzed on the flow cytometer. The photomultiplier voltages were the same as those used for calibrating the machine. There was no detect- able fluorescence in the unstained standard at these voltages (results not shown). Therefore, we may safely ne- glect any artifacts in our results due to autofluorescence.
Exponential Versus Death Phase Cells
To compare live cells to dead cells, samples of AB2- 143.2 and INDl were taken from 100-mL microcarrier spinner flasks (Bellco) at midexponential phase when cells were primarily alive, or late death phase when cells were primarily dead. The midexponential phase samples were taken at 8.9 X lo5 total cells/mL, 95% viable for the AB2-143.2 culture, and at 1.48 X lo6 total cells/mL, 99% viable for the INDl culture. The late death phase samples were taken at 2.75 X lo6 total cells/mL, 17% vi- able for the AB2-143.2 culture, and at 2.20 X lo6 total cells/mL, 16% viable for the INDl culture. Replicate samples of 2 million total cells were fixed and stained as described above. For gel electrophoresis analysis, samples of 1 million total cells each were pelleted and stored at -20°C.
Osmotic Shock Experiments
Two 3-L bioreactors (Applicon), with a working volume of 1 L, were simultaneously inoculated with exponential phase INDl cells. At 102.5 hours, 5 g sodium chloride dissolved in 23 mL fresh medium was added to one re- actor and 23 mL fresh medium was added to the second reactor. Temperature was maintained at 37°C by an elec- tric heating jacket and a cold finger, pH was maintained at 7.2 20.1 by manipulation of the C 0 2 flow rate, and dissolved oxygen was controlled at 40% 22% of air satu- ration by manipulation of the oxygen flow rate to the
REDDY, BAUER, AND MILLER: ANTIBODY CONTENT IN LIVE VERSUS DEAD HYBRIDOMA CELLS 949
reactors. Osmolality measurements were made with an Advanced DigiMatic Model 3D2 osmometer (Advanced Instruments, Needham Heights, MA). The initial osmo- lality for both reactors was 311 mOsm/kg. After the os- motic shock, the osmolality was 493 mOsm/kg.
In a similar experiment, two 250-mL spinner flasks (Bellco), with a working volume of 250 mL, were simul- taneously inoculated with INDl cells at 94% viable and 6.3 X lo4 total cells/mL. At midexponential growth (67.5 hours), 10 mL fresh medium containing 0.685 g so- dium chloride was added to one flask while 10 mL fresh medium was added to the control flask. After 6.25 hours, the viability in the osmotic-shock flask had dropped only 2%, from 99% to 97%. Because the culture did not appear to be significantly stressed, an additional 10 mL fresh medium containing 0.685 g sodium chloride was added (75.75 hours), while 10 mL fresh medium was again added to the control flask. The initial osmolality for both flasks was 319 mOsm/kg. After the first shock, the osmolality was 444 mOsm/kg, and after the second shock it was 575 mOsm/kg.
Cultures were sampled at least twice daily. At each sample point, cell concentration and viability were deter- mined, cell culture supernatant was frozen for later analy- sis of secreted antibody, and 7 (reactors) or 4 (spinners) samples of 2 million cells each were labeled with EMA and fixed and frozen as described above. Flow cytometry samples from both reactors (3 specific and 2 nonspecific for each reactor for each time point) were stained and analyzed on the same day. Spinner-flask samples were stained and analyzed on a different day.
Extracellular antibody was assayed by affinity chroma- tography on a HPLC (Waters, Milford, MA) equipped with an Affi-Prep Protein A column (Bio-Rad #125- 0460). The loading buffer consisted of 0.1M glycine and 0.2M sodium chloride at pH 9. Elution was accom- plished with a 5-minute linear pH gradient from pH 9 to pH 3. Detection of antibody was by absorbance at 280 nm. The sample volume was 1 mL and the flow rate
was kept constant at 1 mL/min. Only freshly made buf- fers were used so no preservatives or biocides were added. Purified INDl antibody (provided by Xoma) was used as a standard for the reactor samples and mouse immu- noglobulin G (Sigma #I-5381) was used as a standard for the spinner-flask samples.
RESULTS AND DISCUSSION
Discrimination of Live From Dead Cells by EMA
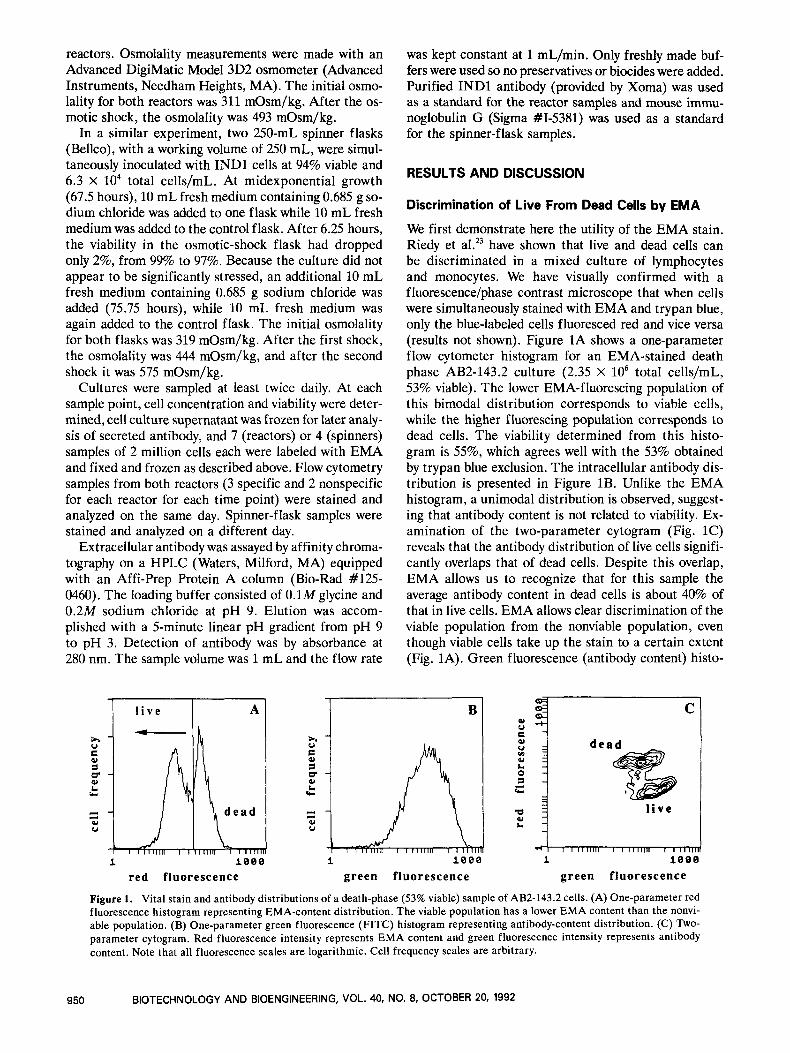
We first demonstrate here the utility of the EMA stain. Riedy et al.23 have shown that live and dead cells can be discriminated in a mixed culture of lymphocytes and monocytes. We have visually confirmed with a fluorescence/phase contrast microscope that when cells were simultaneously stained with EMA and trypan blue, only the blue-labeled cells fluoresced red and vice versa (results not shown). Figure 1A shows a one-parameter flow cytometer histogram for an EMA-stained death phase AB2-143.2 culture (2.35 X lo6 total cells/mL, 53% viable). The lower EMA-fluorescing population of this bimodal distribution corresponds to viable cells, while the higher fluorescing population corresponds to dead cells. The viability determined from this histo- gram is 55%, which agrees well with the 53% obtained by trypan blue exclusion. The intracellular antibody dis- tribution is presented in Figure 1B. Unlike the EMA histogram, a unimodal distribution is observed, suggest- ing that antibody content is not related to viability. Ex- amination of the two-parameter cytogram (Fig. 1C) reveals that the antibody distribution of live cells signifi- cantly overlaps that of dead cells. Despite this overlap, EMA allows us to recognize that for this sample the average antibody content in dead cells is about 40% of that in live cells. EMA allows clear discrimination of the viable population from the nonviable population, even though viable cells take up the stain to a certain extent (Fig. 1A). Green fluorescence (antibody content) histo-
c--
L ir
1 1000
B/
1 1000
d e a d
z l i v e
1 1000
red fluorescence green fluorescence green fluorescence
Figure 1. Vital stain and antibody distributions of a death-phase (53% viable) sample of AB2-143.2 cells. (A) One-parameter red fluorescence histogram representing EMA-content distribution. The viable population has a lower EMA content than the nonvi- able population. (B) One-parameter green fluorescence (FITC) histogram representing antibody-content distribution. (C) Two- parameter cytogram. Red fluorescence intensity represents EMA content and green fluorescence intensity represents antibody content. Note that all fluorescence scales are logarithmic, Cell frequency scales are arbitrary.
950 BIOTECHNOLOGY AND BIOENGINEERING, VOL. 40, NO. 8, OCTOBER 20, 1992
grams of samples stained with and without EMA were essentially identical, which indicates that EMA has no effect on FITC staining (results not shown).
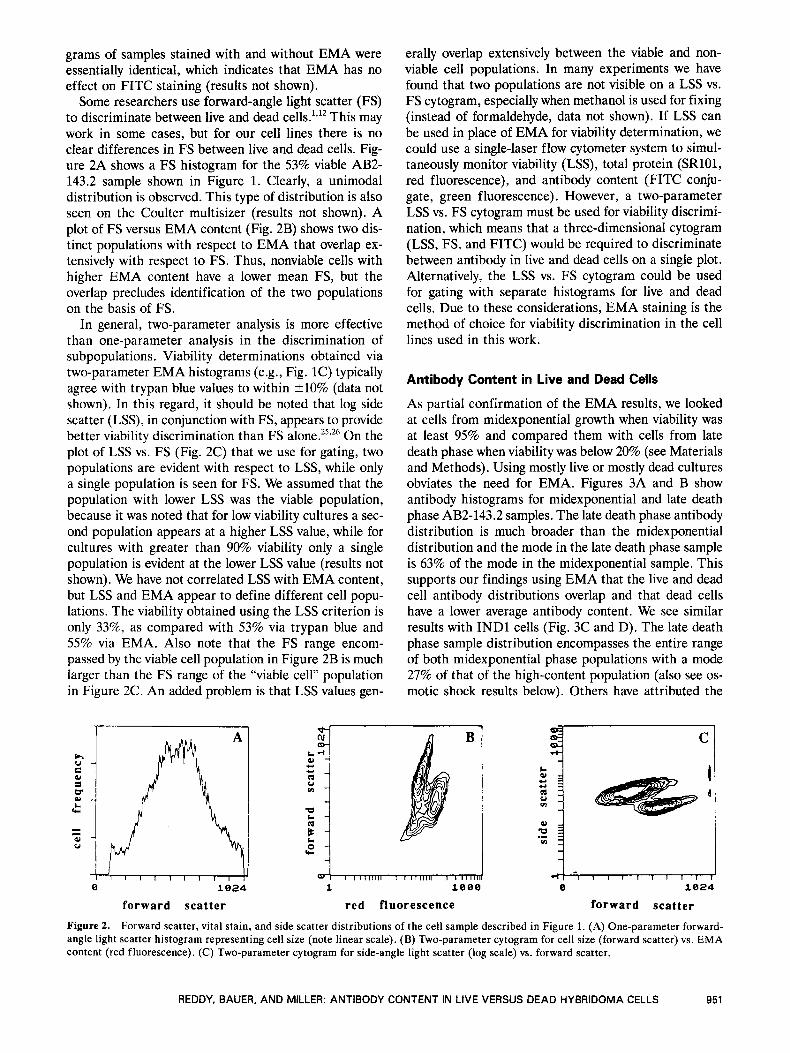
Some researchers use forward-angle light scatter (FS) to discriminate between live and dead This may work in some cases, but for our cell lines there is no clear differences in FS between live and dead cells. Fig- ure 2A shows a FS histogram for the 53% viable AB2- 143.2 sample shown in Figure 1. Clearly, a unimodal distribution is observed. This type of distribution is also seen on the Coulter multisizer (results not shown). A plot of FS versus EMA content (Fig. 2B) shows two dis- tinct populations with respect to EMA that overlap ex- tensively with respect to FS. Thus, nonviable cells with higher EMA content have a lower mean FS, but the overlap precludes identification of the two populations on the basis of FS.
In general, two-parameter analysis is more effective than one-parameter analysis in the discrimination of subpopulations. Viability determinations obtained via two-parameter EMA histograms (e.g., Fig. 1C) typically agree with trypan blue values to within 210% (data not shown). In this regard, it should be noted that log side scatter (LSS), in conjunction with FS, appears to provide better viability discrimination than FS alone.25926 On the plot of LSS vs. FS (Fig. 2C) that we use for gating, two populations are evident with respect to LSS, while only a single population is seen for FS. We assumed that the population with lower LSS was the viable population, because it was noted that for low viability cultures a sec- ond population appears at a higher LSS value, while for cultures with greater than 90% viability only a single population is evident at the lower LSS value (results not shown). We have not correlated LSS with EMA content, but LSS and EMA appear to define different cell popu- lations. The viability obtained using the LSS criterion is only 33%, as compared with 53% via trypan blue and 55% via EMA. Also note that the FS range encom- passed by the viable cell population in Figure 2B is much larger than the FS range of the “viable cell” population in Figure 2C. An added problem is that LSS values gen-
erally overlap extensively between the viable and non- viable cell populations. In many experiments we have found that two populations are not visible on a LSS vs. FS cytogram, especially when methanol is used for fixing (instead of formaldehyde, data not shown). If LSS can be used in place of EMA for viability determination, we could use a single-laser flow cytometer system to simul- taneously monitor viability (LSS), total protein (SR101, red fluorescence), and antibody content (FITC conju- gate, green fluorescence). However, a two-parameter LSS vs. FS cytogram must be used for viability discrimi- nation, which means that a three-dimensional cytogram (LSS, FS, and FITC) would be required to discriminate between antibody in live and dead cells on a single plot. Alternatively, the LSS vs. FS cytogram could be used for gating with separate histograms for live and dead cells. Due to these considerations, EMA staining is the method of choice for viability discrimination in the cell lines used in this work.
Antibody Content in Live and Dead Cells
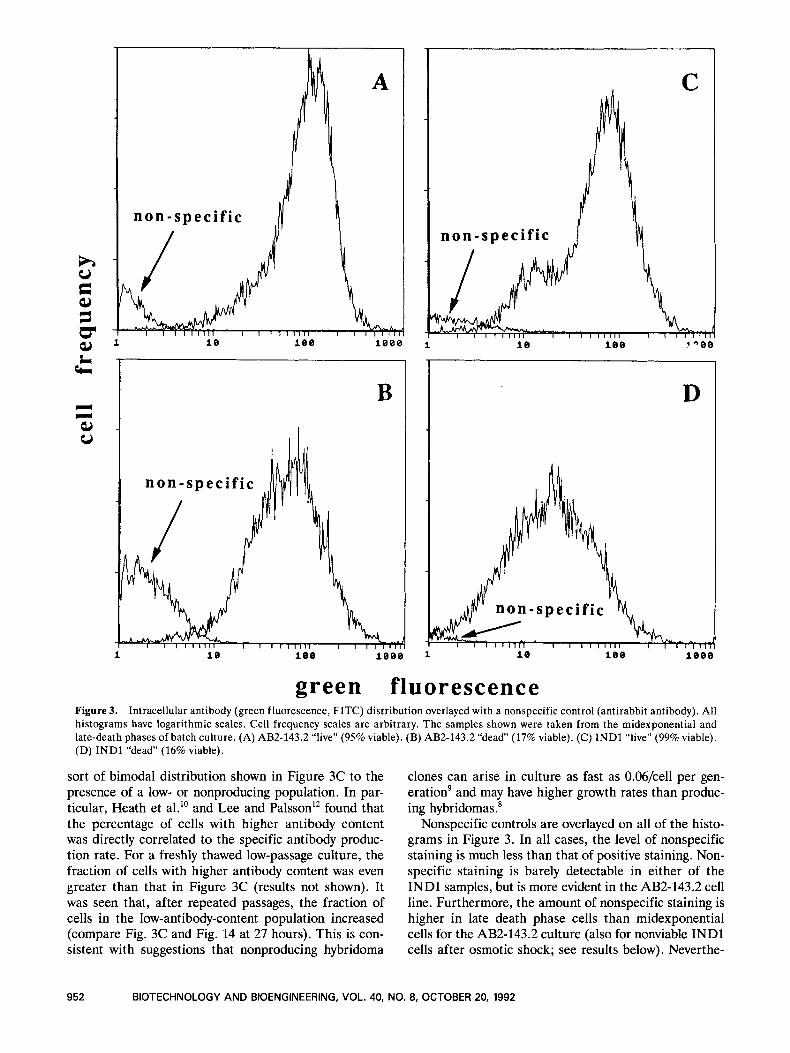
As partial confirmation of the EMA results, we looked at cells from midexponential growth when viability was at least 95% and compared them with cells from late death phase when viability was below 20% (see Materials and Methods). Using mostly live or mostly dead cultures obviates the need for EMA. Figures 3A and B show antibody histograms for midexponential and late death phase AB2-143.2 samples. The late death phase antibody distribution is much broader than the midexponential distribution and the mode in the late death phase sample is 63% of the mode in the midexponential sample. This supports our findings using EMA that the live and dead cell antibody distributions overlap and that dead cells have a lower average antibody content. We see similar results with INDl cells (Fig. 3C and D). The late death phase sample distribution encompasses the entire range of both midexponential phase populations with a mode 27% of that of the high-content population (also see os- motic shock results below). Others have attributed the
r( 1-, i i l I , I 0 1024 1 1008 0 1024
forward scatter red fluorescence forward scatter
Figure 2. Forward scatter, vital stain, and side scatter distributions of the cell sample described in Figure 1. (A) One-parameter forward- angle light scatter histogram representing cell size (note linear scale). (B) Two-parameter cytogram for cell size (forward scatter) vs. EMA content (red fluorescence). (C) Two-parameter cytogram for side-angle light scatter (log scale) vs. forward scatter.
REDDY, BAUER, AND MILLER: ANTIBODY CONTENT IN LIVE VERSUS DEAD HYBRIDOMA CELLS 951
10 100 1000
I I I I I I l l 1
C
1
non-spec i f i c / I I I I I I I I I I I I I I I I
10 100 1 10
green fluorescence Figure 3. Intracellular antibody (green fluorescence, FITC) distribution overlayed with a nonspecific control (antirabbit antibody). All histograms have logarithmic scales. Cell frequency scales are arbitrary. The samples shown were taken from the midexponential and late-death phases of batch culture. (A) AB2-143.2 “live” (95% viable). (B) AB2-143.2 “dead” (17% viable). (C) INDl “live” (99% viable). (D) INDl “dead” (16% viable).
sort of bimodal distribution shown in Figure 3C to the presence of a low- or nonproducing population. In par- ticular, Heath et a1.l’ and Lee and Palsson12 found that the percentage of cells with higher antibody content was directly correlated to the specific antibody produc- tion rate. For a freshly thawed low-passage culture, the fraction of cells with higher antibody content was even greater than that in Figure 3C (results not shown). It was seen that, after repeated passages, the fraction of cells in the low-antibody-content population increased (compare Fig. 3C and Fig. 14 at 27 hours). This is con- sistent with suggestions that nonproducing hybridoma
clones can arise in culture as fast as 0.06/cell per gen- eration’ and may have higher growth rates than produc- ing hybridomas.8
Nonspecific controls are overlayed on all of the histo- grams in Figure 3. In all cases, the level of nonspecific staining is much less than that of positive staining. Non- specific staining is barely detectable in either of the INDl samples, but is more evident in the AB2-143.2 cell line. Furthermore, the amount of nonspecific staining is higher in late death phase cells than midexponential cells for the AB2-143.2 culture (also for nonviable INDl cells after osmotic shock; see results below). Neverthe-
952 BIOTECHNOLOGY AND BIOENGINEERING, VOL. 40, NO. 8, OCTOBER 20, 1992
less, even in the late-death-phase sample, the nonspecific peak only slightly overlaps the positive-stain peak. These results suggest that nonspecific binding is not a major concern with either of our cell lines.
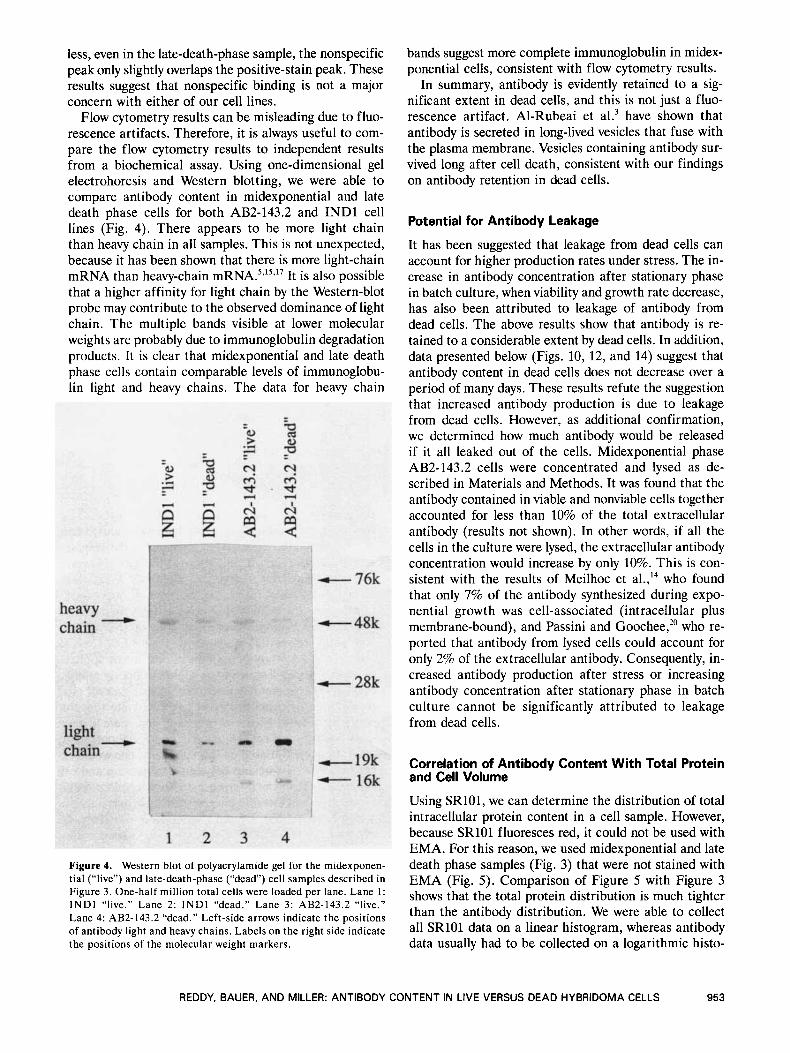
Flow cytometry results can be misleading due to fluo- rescence artifacts. Therefore, it is always useful to com- pare the flow cytometry results to independent results from a biochemical assay. Using one-dimensional gel electrohoresis and Western blotting, we were able to compare antibody content in midexponential and late death phase cells for both AB2-143.2 and INDl cell lines (Fig. 4). There appears to be more light chain than heavy chain in all samples. This is not unexpected, because it has been shown that there is more light-chain mRNA than heavy-chain mRNA.52’53’7 It is also possible that a higher affinity for light chain by the Western-blot probe may contribute to the observed dominance of light chain. The multiple bands visible at lower molecular weights are probably due to immunoglobulin degradation products. It is clear that midexponential and late death phase cells contain comparable levels of immunoglobu- lin light and heavy chains. The data for heavy chain
Figure 4. Western blot of polyacrylamide gel for the midexponen- tial (“live”) and late-death-phase (“dead”) cell samples described in Figure 3. One-half million total cells were loaded per lane. Lane 1: INDl ‘‘live.’’ Lane 2: INDl “dead.” Lane 3: AB2-143.2 “live.” Lane 4: AB2-143.2 “dead.” Left-side arrows indicate the positions of antibody light and heavy chains. Labels on the right side indicate the positions of the molecular weight markers.
bands suggest more complete immunoglobulin in midex- ponential cells, consistent with flow cytometry results.
In summary, antibody is evidently retained to a sig- nificant extent in dead cells, and this is not just a fluo- rescence artifact. Al-Rubeai et aL3 have shown that antibody is secreted in long-lived vesicles that fuse with the plasma membrane. Vesicles containing antibody sur- vived long after cell death, consistent with our findings on antibody retention in dead cells.
Potential for Antibody Leakage
It has been suggested that leakage from dead cells can account for higher production rates under stress. The in- crease in antibody concentration after stationary phase in batch culture, when viability and growth rate decrease, has also been attributed to leakage of antibody from dead cells. The above results show that antibody is re- tained to a considerable extent by dead cells. In addition, data presented below (Figs. 10, 12, and 14) suggest that antibody content in dead cells does not decrease over a period of many days. These results refute the suggestion that increased antibody production is due to leakage from dead cells. However, as additional confirmation, we determined how much antibody would be released if it all leaked out of the cells. Midexponential phase AB2-143.2 cells were concentrated and lysed as de- scribed in Materials and Methods. It was found that the antibody contained in viable and nonviable cells together accounted for less than 10% of the total extracellular antibody (results not shown). In other words, if all the cells in the culture were lysed, the extracellular antibody concentration would increase by only 10%. This is con- sistent with the results of Meilhoc et aI.,l4 who found that only 7% of the antibody synthesized during expo- nential growth was cell-associated (intracellular plus membrane-bound), and Passini and Goochee,*’ who re- ported that antibody from lysed cells could account for only 2% of the extracellular antibody. Consequently, in- creased antibody production after stress or increasing antibody concentration after stationary phase in batch culture cannot be significantly attributed to leakage from dead cells.
Correlation of Antibody Content With Total Protein and Cell Volume
Using SR101, we can determine the distribution of total intracellular protein content in a cell sample. However, because SRlOl fluoresces red, it could not be used with EMA. For this reason, we used midexponential and late death phase samples (Fig. 3) that were not stained with EMA (Fig. 5) . Comparison of Figure 5 with Figure 3 shows that the total protein distribution is much tighter than the antibody distribution. We were able to collect all SRlOl data on a linear histogram, whereas antibody data usually had to be collected on a logarithmic histo-
REDDY, BAUER, AND MILLER: ANTIBODY CONTENT IN LIVE VERSUS DEAD HYBRIDOMA CELLS 953
D
6 0 8 8 8 8 1888 8 28 8 488
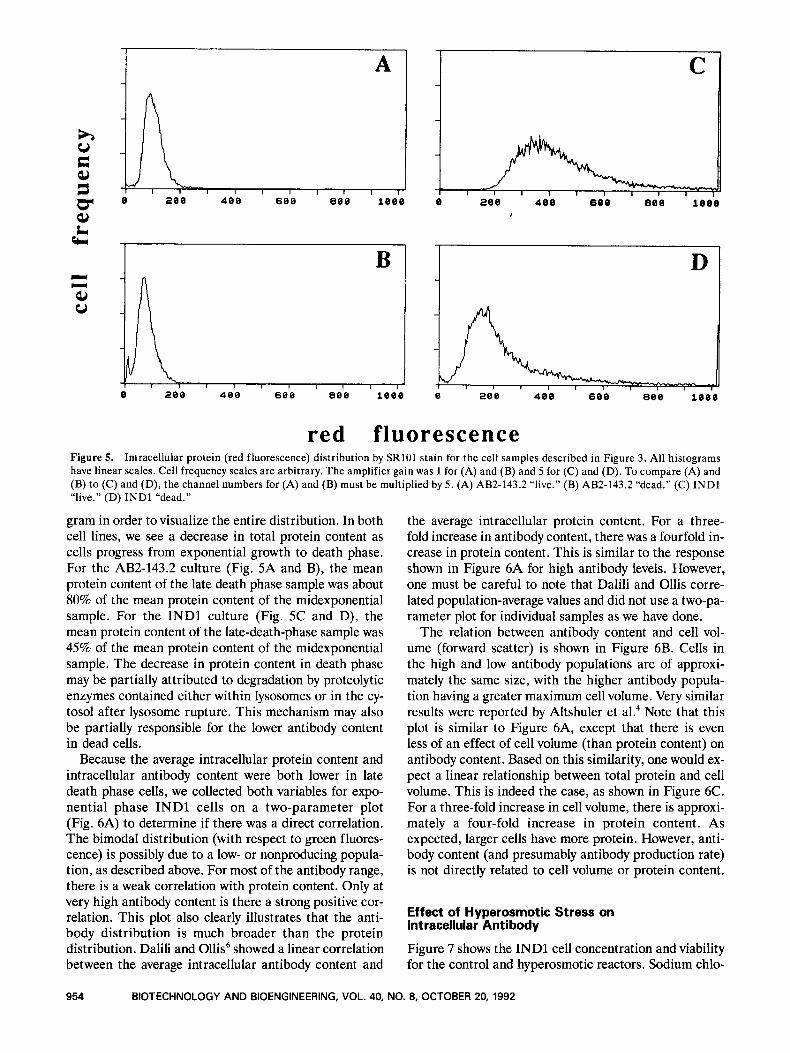
red fluorescence Figure 5. Intracellular protein (red fluorescence) distribution by SRlOl stain for the cell samples described in Figure 3. All histograms have linear scales. Cell frequency scales are arbitrary. The amplifier gain was 1 for (A) and (B) and 5 for (C) and (D). To compare (A) and (B) to (C) and (D), the channel numbers for (A) and (B) must be multiplied by 5. (A) AB2-143.2 “live.” (B) AB2-143.2 “dead.” (C) INDl “live.” (D) INDl “dead.”
gram in order to visualize the entire distribution. In both cell lines, we see a decrease in total protein content as cells progress from exponential growth to death phase. For the AB2-143.2 culture (Fig. 5A and B), the mean protein content of the late death phase sample was about 80% of the mean protein content of the midexponential sample. For the INDl culture (Fig. 5C and D), the mean protein content of the late-death-phase sample was 45% of the mean protein content of the midexponential sample. The decrease in protein content in death phase may be partially attributed to degradation by proteolytic enzymes contained either within lysosomes or in the cy- tosol after lysosome rupture. This mechanism may also be partially responsible for the lower antibody content in dead cells.
Because the average intracellular protein content and intracellular antibody content were both lower in late death phase cells, we collected both variables for expo- nential phase INDl cells on a two-parameter plot (Fig. 6A) to determine if there was a direct correlation. The bimodal distribution (with respect to green fluores- cence) is possibly due to a low- or nonproducing popula- tion, as described above. For most of the antibody range, there is a weak correlation with protein content. Only at very high antibody content is there a strong positive cor- relation. This plot also clearly illustrates that the anti- body distribution is much broader than the protein distribution. Dalili and Ollis6 showed a linear correlation between the average intracellular antibody content and
the average intracellular protein content. For a three- fold increase in antibody content, there was a fourfold in- crease in protein content. This is similar to the response shown in Figure 6A for high antibody levels. However, one must be careful to note that Dalili and Ollis corre- lated population-average values and did not use a two-pa- rameter plot for individual samples as we have done.
The relation between antibody content and cell vol- ume (forward scatter) is shown in Figure 6B. Cells in the high and low antibody populations are of approxi- mately the same size, with the higher antibody popula- tion having a greater maximum cell volume. Very similar results were reported by Altshuler et al.4 Note that this plot is similar to Figure 6A, except that there is even less of an effect of cell volume (than protein content) on antibody content. Based on this similarity, one would ex- pect a linear relationship between total protein and cell volume. This is indeed the case, as shown in Figure 6C. For a three-fold increase in cell volume, there is approxi- mately a four-fold increase in protein content. As expected, larger cells have more protein. However, anti- body content (and presumably antibody production rate) is not directly related to cell volume or protein content.
Effect of Hyperosmotic Stress on lntracellular Antibody
Figure 7 shows the INDl cell concentration and viability for the control and hyperosmotic reactors. Sodium chlo-
954 BIOTECHNOLOGY AND BIOENGINEERING, VOL. 40, NO. 8, OCTOBER 20, 1992
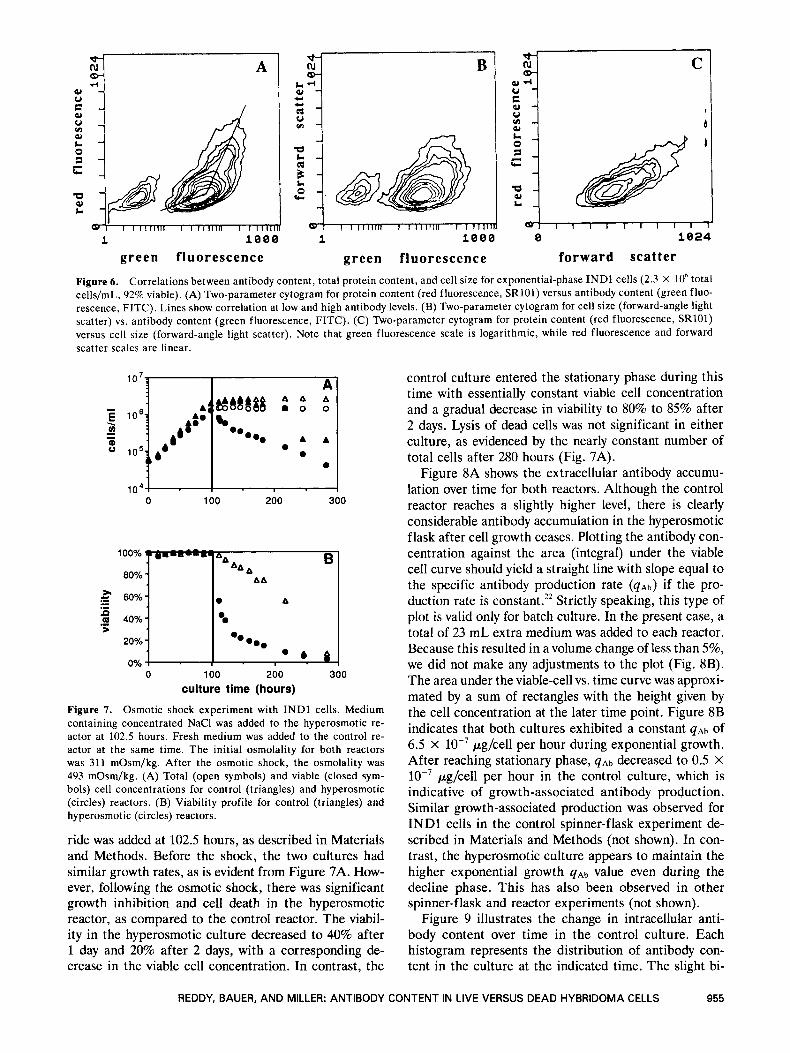
Figure 6. Correlations between antibody content, total protein content, and cell size for exponential-phase INDl cells (2.3 X lo6 total cells/mL, 92% viable). (A) Two-parameter cytogram for protein content (red fluorescence, SR101) versus antibody content (green fluo- rescence, FITC). Lines show correlation at low and high antibody levels. (B) Two-parameter cytogram for cell size (forward-angle light scatter) vs. antibody content (green fluorescence, FITC). (C) Two-parameter cytogram for protein content (red fluorescence, SR101) versus cell size (forward-angle light scatter). Note that green fluorescence scale is logarithmic, while red fluorescence and forward scatter scales are linear.
100% q m w a l l s a
80% - .$ - 60%- .- P m 40%- >
20% - 0% I
-
I" I
0 100 200 300
8 B 88 8
A 8 . 8
@@
.@. 0.
. 6 $ 0 100 200 300
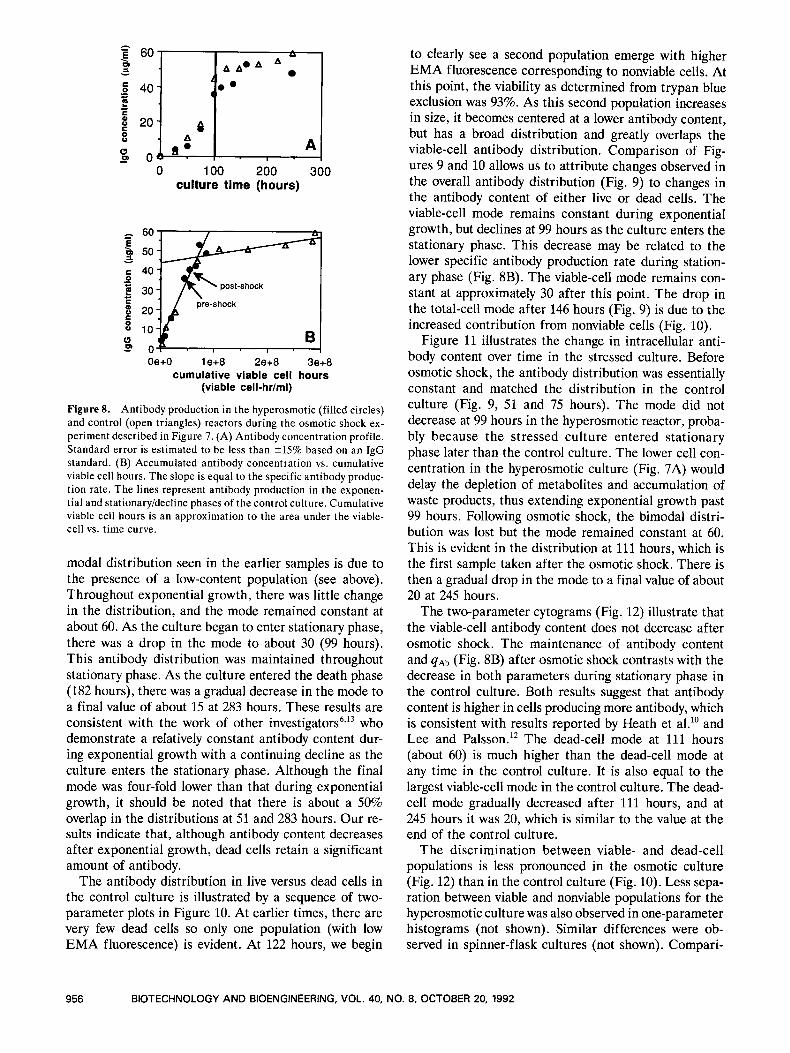
culture time (hours) Figure 7. Osmotic shock experiment with INDl cells. Medium containing concentrated NaCl was added to the hyperosmotic re- actor at 102.5 hours. Fresh medium was added to the control re- actor at the same time. The initial osmolality for both reactors was 311 mOsm/kg. After the osmotic shock, the osmolality was 493 mOsm/kg. (A) Total (open symbols) and viable (closed sym- bols) cell concentrations for control (triangles) and hyperosmotic (circles) reactors. (B) Viability profile for control (triangles) and hyperosmotic (circles) reactors.
ride was added at 102.5 hours, as described in Materials and Methods. Before the shock, the two cultures had similar growth rates, as is evident from Figure 7A. How- ever, following the osmotic shock, there was significant growth inhibition and cell death in the hyperosmotic reactor, as compared to the control reactor. The viabil- ity in the hyperosmotic culture decreased to 40% after 1 day and 20% after 2 days, with a corresponding de- crease in the viable cell concentration. In contrast, the
control culture entered the stationary phase during this time with essentially constant viable cell concentration and a gradual decrease in viability to 80% to 85% after 2 days. Lysis of dead cells was not significant in either culture, as evidenced by the nearly constant number of total cells after 280 hours (Fig. 7A).
Figure 8A shows the extracellular antibody accumu- lation over time for both reactors. Although the control reactor reaches a slightly higher level, there is clearly considerable antibody accumulation in the hyperosmotic flask after cell growth ceases. Plotting the antibody con- centration against the area (integral) under the viable cell curve should yield a straight line with slope equal to the specific antibody production rate (qAb) if the pro- duction rate is constant.22 Strictly speaking, this type of plot is valid only for batch culture. In the present case, a total of 23 mL extra medium was added to each reactor. Because this resulted in a volume change of less than 5%, we did not make any adjustments to the plot (Fig. 8B). The area under the viable-cell vs. time curve was approxi- mated by a sum of rectangles with the height given by the cell concentration at the later time point. Figure 8B indicates that both cultures exhibited a constant q A b of 6.5 X lo-' pg/cell per hour during exponential growth. After reaching stationary phase, q A b decreased to 0.5 X lo-' pg/cell per hour in the control culture, which is indicative of growth-associated antibody production. Similar growth-associated production was observed for INDl cells in the control spinner-flask experiment de- scribed in Materials and Methods (not shown). In con- trast, the hyperosmotic culture appears to maintain the higher exponential growth 4 A b value even during the decline phase. This has also been observed in other spinner-flask and reactor experiments (not shown).
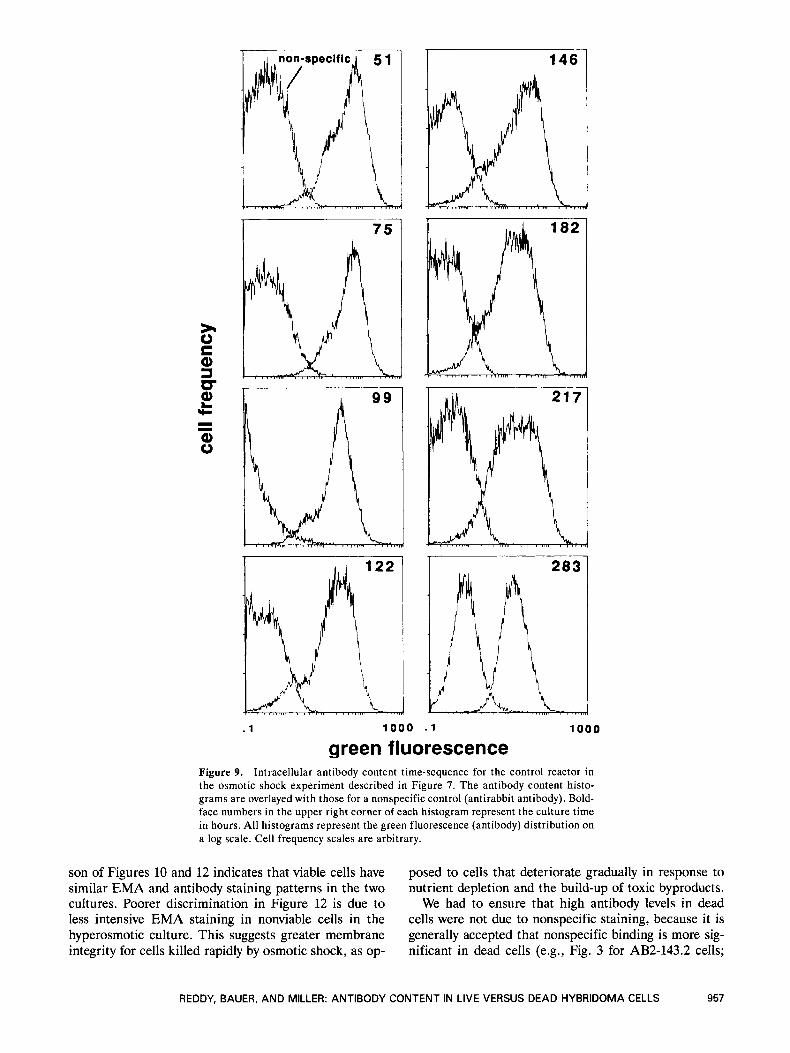
Figure 9 illustrates the change in intracellular anti- body content over time in the control culture. Each histogram represents the distribution of antibody con- tent in the culture at the indicated time. The slight bi-
REDDY, BAUER, AND MILLER: ANTIBODY CONTENT IN LIVE VERSUS DEAD HYBRIDOMA CELLS 955
u A 60 .
A A@ A W 5 -
0 100 200 300 culture time (hours)
POSt-ShoCk
t 20 c
Oe+O le+8 2e+8 3e+8 cumulative viable cell hours
(viable cell-hr/ml)
Figure 8. Antibody production in the hyperosmotic (filled circles) and control (open triangles) reactors during the osmotic shock ex- periment described in Figure 7. (A) Antibody concentration profile. Standard error is estimated to be less than 215% based on an IgG standard. (B) Accumulated antibody concentration vs. cumulative viable cell hours. The slope is equal to the specific antibody produc- tion rate. The lines represent antibody production in the exponen- tial and stationaryidecline phases of the control culture. Cumulative viable cell hours is an approximation to the area under the viable- cell vs. time curve.
modal distribution seen in the earlier samples is due to the presence of a low-content population (see above). Throughout exponential growth, there was little change in the distribution, and the mode remained constant at about 60. As the culture began to enter stationary phase, there was a drop in the mode to about 30 (99 hours). This antibody distribution was maintained throughout stationary phase. As the culture entered the death phase (182 hours), there was a gradual decrease in the mode to a final value of about 15 at 283 hours. These results are consistent with the work of other investigator^^.'^ who demonstrate a relatively constant antibody content dur- ing exponential growth with a continuing decline as the culture enters the stationary phase. Although the final mode was four-fold lower than that during exponential growth, it should be noted that there is about a 50% overlap in the distributions at 51 and 283 hours. Our re- sults indicate that, although antibody content decreases after exponential growth, dead cells retain a significant amount of antibody.
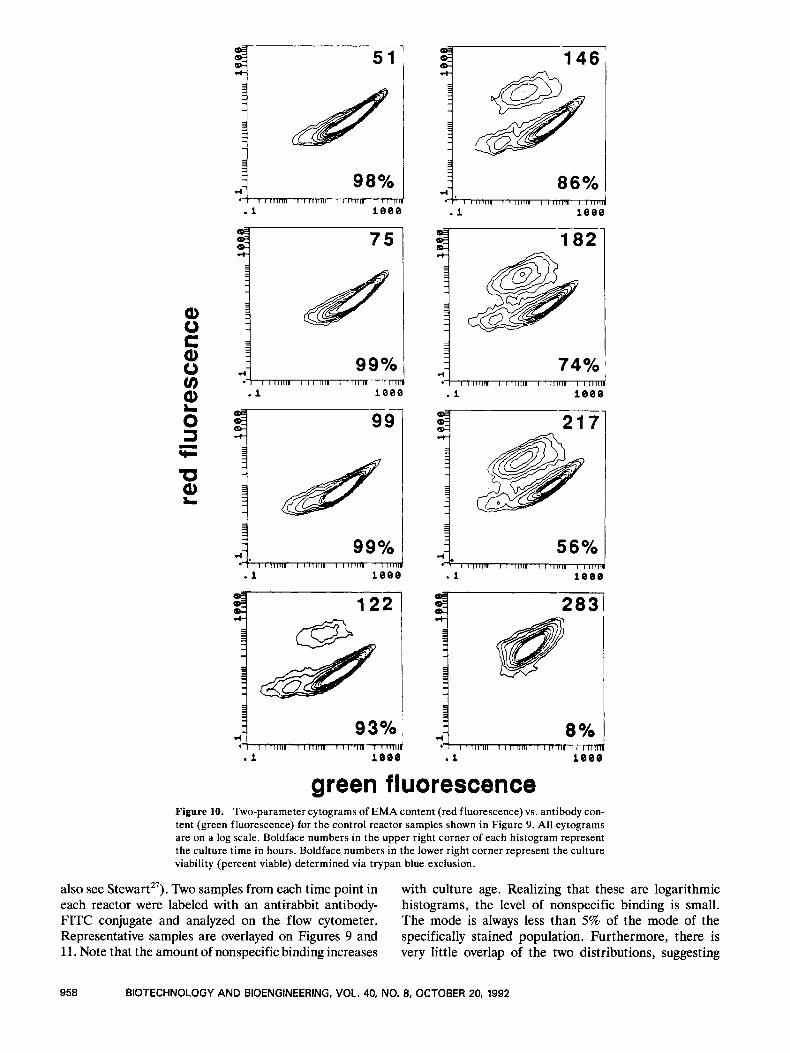
The antibody distribution in live versus dead cells in the control culture is illustrated by a sequence of two- parameter plots in Figure 10. At earlier times, there are very few dead cells so only one population (with low EMA fluorescence) is evident. At 122 hours, we begin
to clearly see a second population emerge with higher EMA fluorescence corresponding to nonviable cells. At this point, the viability as determined from trypan blue exclusion was 93%. As this second population increases in size, it becomes centered at a lower antibody content, but has a broad distribution and greatly overlaps the viable-cell antibody distribution. Comparison of Fig- ures 9 and 10 allows us to attribute changes observed in the overall antibody distribution (Fig. 9) to changes in the antibody content of either live or dead cells. The viable-cell mode remains constant during exponential growth, but declines at 99 hours as the culture enters the stationary phase. This decrease may be related to the lower specific antibody production rate during station- ary phase (Fig. 8B). The viable-cell mode remains con- stant at approximately 30 after this point. The drop in the total-cell mode after 146 hours (Fig. 9) is due to the increased contribution from nonviable cells (Fig. 10).
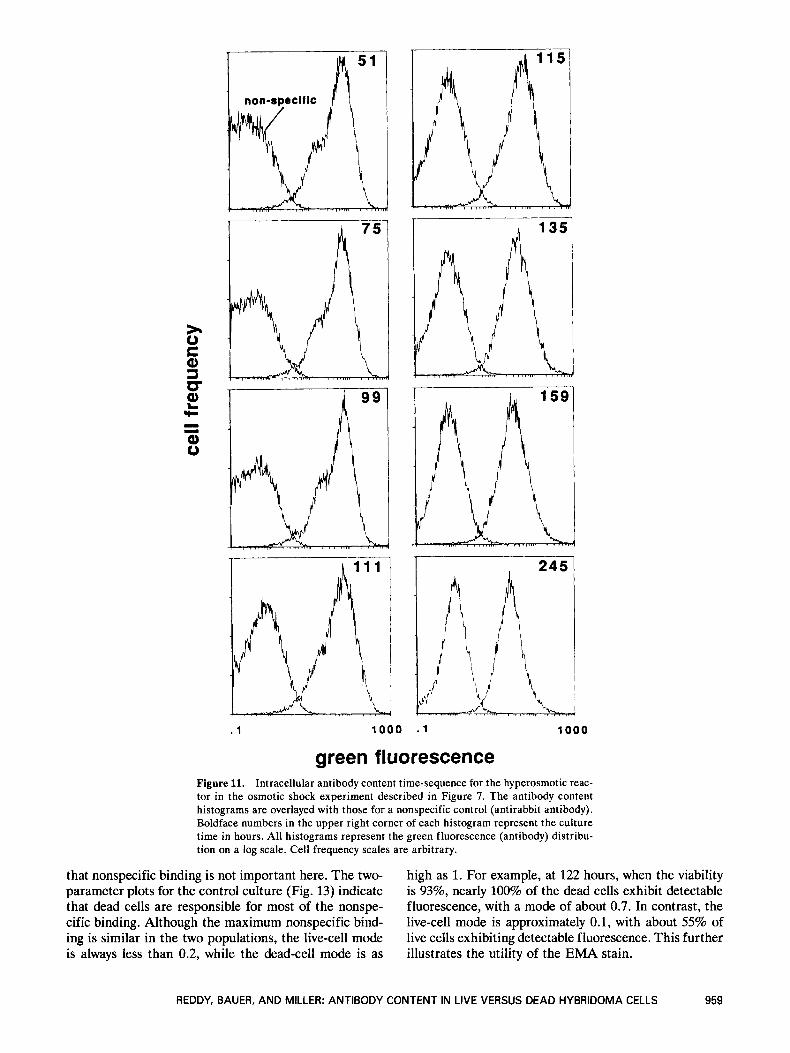
Figure 11 illustrates the change in intracellular anti- body content over time in the stressed culture. Before osmotic shock, the antibody distribution was essentially constant and matched the distribution in the control culture (Fig. 9, 51 and 75 hours). The mode did not decrease at 99 hours in the hyperosmotic reactor, proba- bly because the stressed culture entered stationary phase later than the control culture. The lower cell con- centration in the hyperosmotic culture (Fig. 7A) would delay the depletion of metabolites and accumulation of waste products, thus extending exponential growth past 99 hours. Following osmotic shock, the bimodal distri- bution was lost but the mode remained constant at 60. This is evident in the distribution at 111 hours, which is the first sample taken after the osmotic shock. There is then a gradual drop in the mode to a final value of about 20 at 245 hours.
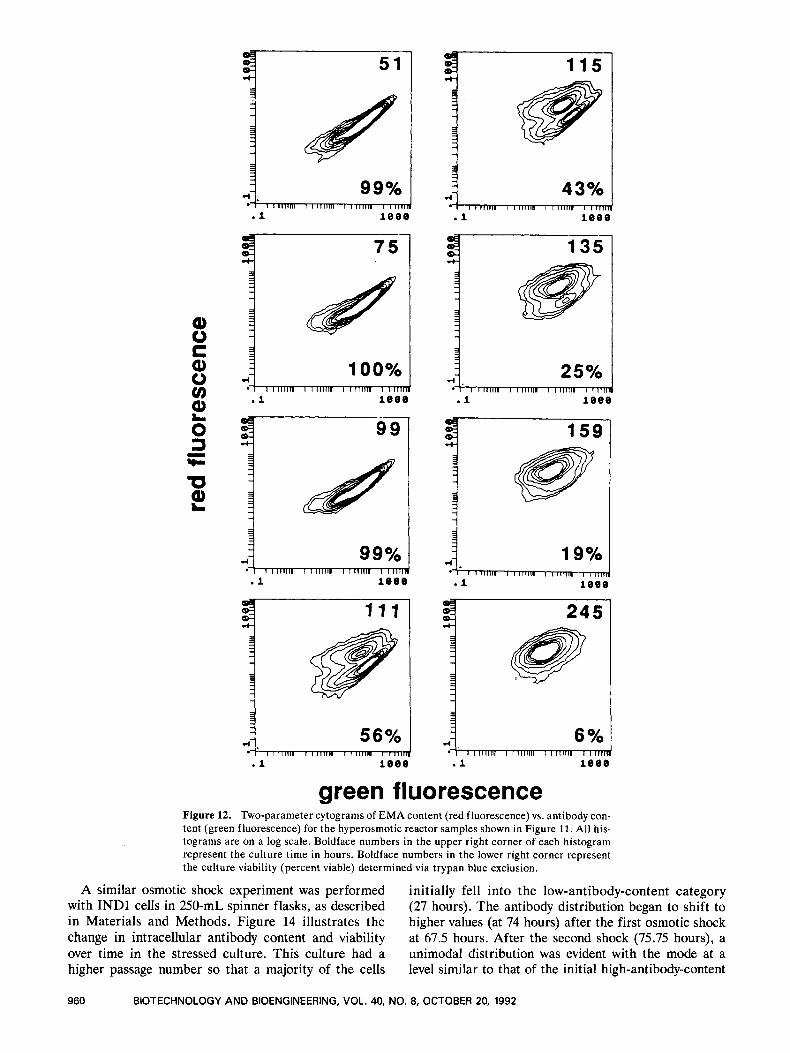
The two-parameter cytograms (Fig. 12) illustrate that the viable-cell antibody content does not decrease after osmotic shock. The maintenance of antibody content and q A b (Fig. 8B) after osmotic shock contrasts with the decrease in both parameters during stationary phase in the control culture. Both results suggest that antibody content is higher in cells producing more antibody, which is consistent with results reported by Heath et a1.l' and Lee and Palsson." The dead-cell mode at 111 hours (about 60) is much higher than the dead-cell mode at any time in the control culture. It is also equal to the largest viable-cell mode in the control culture. The dead- cell mode gradually decreased after 111 hours, and at 245 hours it was 20, which is similar to the value at the end of the control culture.
The discrimination between viable- and dead-cell populations is less pronounced in the osmotic culture (Fig. 12) than in the control culture (Fig. 10). Less sepa- ration between viable and nonviable populations for the hyperosmotic culture was also observed in one-parameter histograms (not shown). Similar differences were ob- served in spinner-flask cultures (not shown). Compari-
956 BIOTECHNOLOGY AND BIOENGINEERING, VOL. 40, NO. 8, OCTOBER 20, 1992
I 146 I
,751
. 1 1000 . 1 1000
green fluorescence Figure 9. Intracellular antibody content time-sequence for the control reactor in the osmotic shock experiment described in Figure 7. The antibody content histo- grams are overlayed with those for a nonspecific control (antirabbit antibody). Bold- face numbers in the upper right corner of each histogram represent the culture time in hours. All histograms represent the green fluorescence (antibody) distribution on a log scale. Cell frequency scales are arbitrary.
son of Figures 10 and 12 indicates that viable cells have similar EMA and antibody staining patterns in the two cultures. Poorer discrimination in Figure 12 is due to less intensive EMA staining in nonviable cells in the hyperosmotic culture. This suggests greater membrane integrity for cells killed rapidly by osmotic shock, as op-
posed to cells that deteriorate gradually in response to nutrient depletion and the build-up of toxic byproducts.
We had to ensure that high antibody levels in dead cells were not due to nonspecific staining, because it is generally accepted that nonspecific binding is more sig- nificant in dead cells (e.g., Fig. 3 for AB2-143.2 cells;
REDDY, BAUER, AND MILLER: ANTIBODY CONTENT IN LIVE VERSUS DEAD HYBRIDOMA CELLS 957
rtl I
86% rl 98% 1
I 11111111 I 11111111 I 1 1 1 1 1 1 1
.1 1 0 0 0 i I i i 1 1 1 i n I I IIIIII I IIIIIII I nn'r .l i e e e
1821 +I I
i d I l 1 1 1 1 1 1 " I ,19d .l i e e e
74%
9 91 "I I
d 1 99% \ I I 11111, I 1 1 1 1 1 1 , , 115 67: rl
I I 1 1 1 1 1 1 1 I 1 1 1 1 1 1 1 I 1 l l T K n - n ? l i
.l i e e e .l 1000
12q
q1 I 11111, , I 11111, l 2 3% ; 4
- l - l T l l f e l i e e e
8 Yo i e e e .t
green fluorescence Figure 10. Two-parameter cytograms of EMA content (red fluorescence) vs. antibody con- tent (green fluorescence) for the control reactor samples shown in Figure 9. All cytograms are on a log scale. Boldface numbers in the upper right corner of each histogram represent the culture time in hours. Boldface numbers in the lower right corner represent the culture viability (percent viable) determined via trypan blue exclusion.
also see Stewart27). Two samples from each time point in each reactor were labeled with an antirabbit antibody- FITC conjugate and analyzed on the flow cytometer. Representative samples are overlayed on Figures 9 and 11. Note that the amount of nonspecific binding increases
with culture age. Realizing that these are logarithmic histograms, the level of nonspecific binding is small. The mode is always less than 5% of the mode of the specifically stained population. Furthermore, there is very little overlap of the two distributions, suggesting
958 BIOTECHNOLOGY AND BIOENGINEERING, VOL. 40, NO. 8, OCTOBER 20, 1992
. 1 1 0 0 0 . 1 1000
green fluorescence Figure 11. Intracellular antibody content time-sequence for the hyperosmotic reac- tor in the osmotic shock experiment described in Figure 7. The antibody content histograms are overlayed with those for a nonspecific control (antirabbit antibody). Boldface numbers in the upper right corner of each histogram represent the culture time in hours. All histograms represent the green fluorescence (antibody) distribu- tion on a log scale. Cell frequency scales are arbitrary.
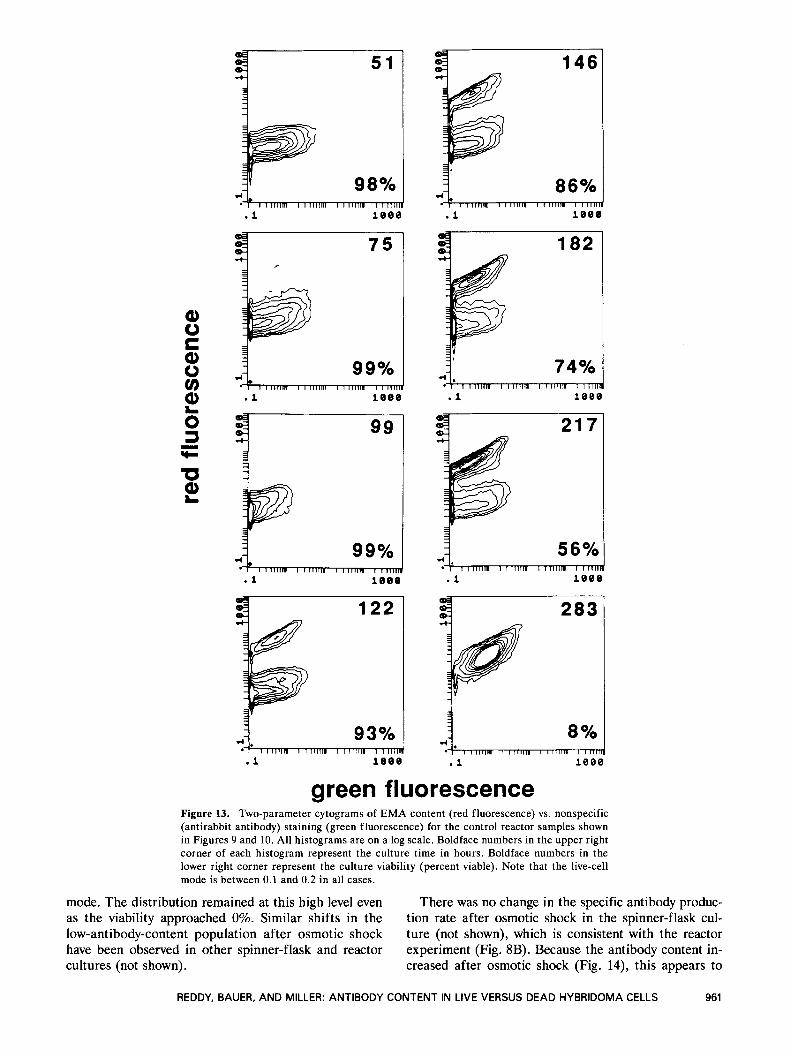
that nonspecific binding is not important here. The two- parameter plots for the control culture (Fig. 13) indicate that dead cells are responsible for most of the nonspe- cific binding. Although the maximum nonspecific bind- ing is similar in the two populations, the live-cell mode is always less than 0.2, while the dead-cell mode is as
high as 1. For example, at 122 hours, when the viability is 93%, nearly 100% of the dead cells exhibit detectable fluorescence, with a mode of about 0.7. In contrast, the live-cell mode is approximately 0.1, with about 55% of live cells exhibiting detectable fluorescence. This further illustrates the utility of the EMA stain.
REDDY, BAUER, AND MILLER: ANTIBODY CONTENT IN LIVE VERSUS DEAD HYBRIDOMA CELLS 959
5 1 1 Y I
4. , 1111111 I ;ll,ll , 9996J 4
.f 1 0 0 0
Y I
115
3 43%
I 1 1 1 1 1 1 1 1 I I 1 1 1 1 1 1 I I 1 1 1 1 1 1 I IIr7 .l 1001
100% I I 1 1 1 1 1 1 1 I 1 1 1 1 1 1 1 I 1111111 1 I l l d
. l 1000
3-94
d 4 99% I I I 111111 1 1 1 1 1 1 1 1 11111111 1 1 1 1
.l i e e e
{; I I 111111 I I 111111 I , ,5604 d
.l 1000
{; I I 111111 I I 111111 I , ,5604 d
.l 1000
.l 1000
1591
19% 4 . *L .1 1000
6 % .l 1000
green fluorescence Figure 12. Two-parameter cytograms of EMA content (red fluorescence) vs. antibody con- tent (green fluorescence) for the hyperosmotic reactor samples shown in Figure 11. All his- tograms are on a log scale. Boldface numbers in the upper right corner of each histogram represent the culture time in hours. Boldface numbers in the lower right corner represent the culture viability (percent viable) determined via trypan blue exclusion.
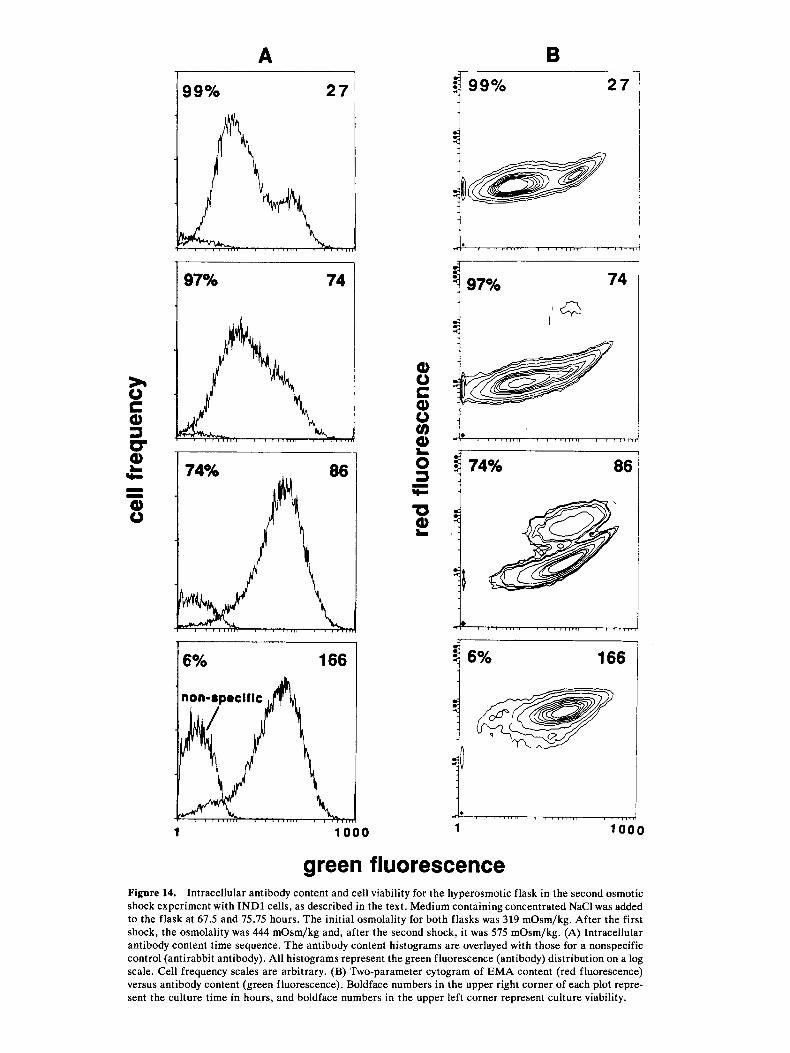
A similar osmotic shock experiment was performed with INDl cells in 250-mL spinner flasks, as described in Materials and Methods. Figure 14 illustrates the change in intracellular antibody content and viability over time in the stressed culture. This culture had a higher passage number so that a majority of the cells
initially fell into the low-antibody-content category (27 hours). The antibody distribution began to shift to higher values (at 74 hours) after the first osmotic shock at 67.5 hours. After the second shock (75.75 hours), a unimodal distribution was evident with the mode at a level similar to that of the initial high-antibody-content
960 BIOTECHNOLOGY AND BIOENGINEERING, VOL. 40, NO. 8, OCTOBER 20, 1992
5 1 I +i I
9 8% :- .l lee@
7 5 I 4 I
99 I
4 *L 99% .1 1000
.l 1090
18* I
217
d ! 5 6% - I.
I I IIIIIII I I IIIIII I i i i i i m I 11111 .l 1009
1
283 1
4 {: I I 11111, , I 11111, I 1,111~81%~ .l 1 0 0 0
green fluorescence Figure 13. Two-parameter cytograms of EMA content (red fluorescence) vs. nonspecific (antirabbit antibody) staining (green fluorescence) for the control reactor samples shown in Figures 9 and 10. All histograms are on a log scale. Boldface numbers in the upper right corner of each histogram represent the culture time in hours. Boldface numbers in the lower right corner represent the culture viability (percent viable). Note that the live-cell mode is between 0.1 and 0.2 in all cases.
mode. The distribution remained at this high level even as the viability approached 0%. Similar shifts in the low-antibody-content population after osmotic shock have been observed in other spinner-flask and reactor cultures (not shown).
There was no change in the specific antibody produc- tion rate after osmotic shock in the spinner-flask cul- ture (not shown), which is consistent with the reactor experiment (Fig. 8B). Because the antibody content in- creased after osmotic shock (Fig. 14), this appears to
REDDY, BAUER, AND MILLER: ANTIBODY CONTENT IN LIVE VERSUS DEAD HYBRIDOMA CELLS 961
A B
199% 2 7 '
197% 1 I
16% 166 I
1 1000
8 9 9 % 27
q 97% 74
1 n
166 4 6%
i' A* , . I , , , , , . , , , , , , , , , , , , , , , II 1 1 0 0 0
green fluorescence Figure 14. Intracellular antibody content and cell viability for the hyperosmotic flask in the second osmotic shock experiment with INDl cells, as described in the text. Medium containing concentrated NaCl was added to the flask at 67.5 and 75.75 hours. The initial osmolality for both flasks was 319 mOsm/kg. After the first shock, the osmolality was 444 mOsm/kg and, after the second shock, it was 575 mOsm/kg. (A) Intracellular antibody content time sequence. The antibody content histograms are overlayed with those for a nonspecific control (antirabbit antibody). All histograms represent the green fluorescence (antibody) distribution on a log scale. Cell frequency scales are arbitrary. (B) Two-parameter cytogram of EMA content (red fluorescence) versus antibody content (green fluorescence). Boldface numbers in the upper right corner of each plot repre- sent the culture time in hours, and boldface numbers in the upper left corner represent culture viability.
contradict the conclusions from the reactor experiments. However, we do not know whether a shift from low- to high-antibody-content populations reflects the same change in antibody productin as an increase in antibody content for a given population. In this regard, it is in- teresting to note that the specific antibody production rate for the spinner-flask osmotic shock culture (4.9 X
pg/cell per hour) is similar to that for the reactor osmotic shock culture (6.5 X pg/cell per hour), even though the initial fraction of low-antibody-content cells was very different [compare Fig. 14 (27 hours) with Fig. 11 (51 hours)]. This contrasts with the results of Heath et a1.I' and Lee and Palsson." However, Salazar- Kish and Heath (AIChE) Annual Meeting, 1991) dem- onstrated that there was no correlation between the percentage of high-antibody-content cells and q A b for a quadroma cell line, as well as for its two parent hybri- doma cell lines. This discrepancy suggests that the effect is likely to be cell-line dependent.
Previous studies have shown that the specific antibody production rate is increased in cells exposed to osmotic ~ t r e s s . ' ~ - ' ~ We have observed a similar response for AB2-143.2 cells (Reddy and Miller, AIChE Annual Meeting, 1990). However, the results presented here and those from other experiments (not shown) demonstrate that INDl cells do not increase q A b in response to os- motic stress. This difference may be due to the fact that antibody production is growth-associated in INDl cells, but not in AB2-143.2 cells. Our results show that, fol- lowing osmotic shock in INDl cells, q A b is maintained at the preshock level, while q A b decreases during station- ary phase in control culture. This difference is reflected in the higher viable-cell antibody content in stressed culture during the stationary and decline phases. The maintenance of q A b and viable-cell antibody content in stressed cultures may be the result of the shock being administered during exponential growth when concen- trations of nutrients are high and toxic byproducts are low. Preshock cells are in a healthy state, so any cells surviving the shock are able to maintain their antibody production rate. Because the cells die (due to hyperos- molarity) before nutrient depletion and toxic byproduct build-up, q A b and the viable-cell antibody content do not drop off as in control cultures. The rapid cell death dur- ing exponential phase in stressed cultures also results in high antibody levels in dead cells. In control cultures, extensive cell death does not occur until the antibody content has decreased in viable cells. Membrane integ- rity may also be lower in dead cells from control cul- tures (see above). Consequently, lower antibody levels are observed in dead cells from control cultures.
Al-Rubeai et al.3 suggest that transport of antibody- containing vesicles to the plasma membrane is the rate- limiting step in antibody secretion. Furthermore, vesicles were observed to survive long after cell death, protecting the antibodies from proteolytic attack. These vesicles eventually deteriorate, allowing degradation of antibody. This explains the significant amount of antibody re-
tention in dead cells, as well as the drop in the dead-cell mode in control and stressed cultures after long times in death phase.
CONCLUSIONS
We have demonstrated that EMA is a superior fluores- cent dye for analysis of viability by flow cytometry. By using it in conjunction with immunofluorescence stain- ing, we were able to demonstrate that in control culture antibody is retained in dead cells, but at a lower level than in live cells. Also, use of EMA allowed us to demonstrate that dead cells have higher levels of non- specific binding. Viable-cell antibody content and q A b re- mained high during the death phase after osmotic shock, but both parameters declined during stationary phase in control culture. It was further shown that undergrowth- inhibitory conditions, the antibody content remains high in dead cells, suggesting that antibody secretion stops before or at the same time as antibody synthesis. These results illustrate that our flow cytometric methods will be useful in further analysis of antibody production in environmentally stressed hybridoma cultures with a sig- nificant fraction of dead cells. These methods are not re- stricted to hybridoma cells, but may be extended to any cell type for which dead cells need to be gated out or must be analyzed independently.
The authors thank Xoma Corporation for providing cell line IND1, and Joseph M. Stevens for technical assistance. Flow cytometry analysis was performed at the Quantitative Cytol- ogy Program at Northwestern University Medical School, which is supported by an ongoing gift from the Coleman Foundation. This research was funded by the National Science Foundation through Grants EET-8809244, BCS- 9058416, and BCS-8906388 (W.M.M.) and by matching funds from Schering Plough Research, Lederle-Praxis Biologicals, and Eli Lilly and Company.
References
1. Aeschbacher, M., Reinhardt, C. A., Zbinden, G. 1986. A rapid cell membrane permeability test using fluorescent dyes and flow cytometry. Cell Biol. Toxicol. 2: 247-255.
2. Al-Rubeai, M., Emery, A. N. 1990. Mechanisms and kinetics of monoclonal antibody synthesis and secretion in synchronous and asynchronous hybridoma cell cultures. J. Biotechnol. 16:
3. Al-Rubeai, M., Mills, D., Emery, A. N. 1990. Electron micros- copy of hybridoma cells with special regard to monoclonal anti- body production. Cytotech. 4: 13-28.
4. Altshuler, G. L., Dilwith, R., Sowek, J., Belfort, G. 1986. Hy- bridoma analysis at cellular level. Biotechnol. Bioeng. Symp.
5. Bibila, T., Flickinger, M. C . 1991. A structured model for mono- clonal antibody synthesis in exponentially growing and station- ary phase hybridoma cells. Biotechnol. Bioeng. 37: 210-226.
6. Dalili, M., Ollis, D. F. 1990. A flow-cytometric analysis of hy- bridoma growth and monoclonal antibody production. Biotech- nol. Bioeng. 36: 64-73.
7. Engelhard, H.H., Krupka, J .L., Bauer, K.D. 1991. Simulta- neous quantification of c-myc oncoprotein, total cellular pro- tein, and DNA content using rnultiparametcr flow cytornetry. Cytometry 12: 68-76.
67-86.
17: 725-736.
REDDY, BAUER, AND MILLER: ANTIBODY CONTENT IN LIVE VERSUS DEAD HYBRIDOMA CELLS 963
8. Frame, K. K., Hu, W. 1990. The loss of antibody productivity in continuous culture of hybridoma cells. Biotechnol. Bioeng.
9. Gardner, J. S., Chiu, A. L. H., Maki, N. E., Harris, J. F. 1985. A quantitative stability analysis of human monoclonal antibody production by heteromyeloma hybridomas, using an immuno- fluorescent technique. J. Immunol. Meth. 85: 335-346.
10. Heath, C., Dilwith, R., Belfort, G. 1990. Methods for increas- ing monoclonal antibody production in suspension and en- trapped cell cultures: Biochemical and flow cytometric analysis as a function of medium serum content. J. Biotechnol. 15: 71-90.
11. Hornbeck, P.V., Lewis, G. K. 1985. Idiotype connectance in the immune system. 11. A heavy chain variable region idiotype that dominates the antibody response to the p-azobenzenearsonate group is a minor idiotope in the response to trinitrophenyl group. J. Exp. Med. 161: 53-71.
12. Lee, G. M., Palsson, B. 0. 1990. Immobilization can improve the stability of hybridoma antibody productivity in serum-free media. Biotechnol. Bioeng. 36: 1049-1055.
13. Leno, M., Merten, O., Vuillier, F., Hache, J. 1991. IgG produc- tion in hybridoma batch culture: Kinetics of IgG mRNA, cyto- plasmic-, secreted-, and membrane-bound antibody levels. J. Biotechnol. 20: 301-312.
14. Meilhoc, E., Wittrup, K. D., Bailey, J. E. 1989. Application of flow cytometric measurement of surface IgG in kinetic analysis of monoclonal antibody synthesis and secretion by murine hy- bridoma cells. J. Immunol. Meth. 121: 167-174.
15. Merten, O.W., Leno, M., Hache, J. 1991. Quantitation of mRNA specific for heavy and light chains of IgG in hybridomas during different phases of batch culture, p. 352-360. In: R. E . Spier, J. B. Griffiths, B. Meignier (eds.), Production of bio- logicals from animal cells in culture (Proceedings of the 1990 ESACT meeting). Butterworth-Heinemann, Oxford, UK.
16. Miller, W.M., Blanch, H.W., Wilke, C.R. 1988. A kinetic analysis of hybridoma growth and metabolism in batch and con- tinuous suspension culture: Effect of nutrient concentration, dilution rate, and pH. Biotechnol. Bioeng. 32: 947-965.
17. Nuss, D. L., Koch, G. 1976. Variation in the relative synthesis of immunoglobulin G and non-immunoglobulin G proteins in cultured MPC-11 cells with changes in the overall rate of
35: 469-476.
polypeptide chain initiation and elongation. J. Mol. Biol. 102:
18. ayaas, K., Berg, T.M., Bakke, O., Levine, D.W. 1989. Hybri- doma growth and antibody production under conditions of hy- perosmotic stress, pp. 212-220. In: R. E. Spier, J. B. Griffiths, J. Stephanne, and P. J. Crooy (eds.), Advances in animal cell biology and technology for bioprocesses (proceedings of the 1988 ESACT meeting). Butterworth, London.
19. Ozturk, S. S. , Palsson, B. 0. 1991. Effect of medium osmolarity on hybridoma growth, metabolism, and antibody production. Biotechnol. Bioeng. 37: 989-993.
20. Passini, C. A, , Goochee, C. F. 1989. Response of a mouse hy- bridoma cell line to heat shock, agitation, and sparging. Bio- technol. Prog. 5: 175-188.
21. Pliickthun, A. 1991. Antibody engineering: Advances from the use of Escherichia coli expression systems. Bio/Technol. 9:
22. Renard, J. M., Spagnoli, R., Mazier, C., Salles, M. F., Mandine, E. 1988. Evidence that monoclonal antibody production kinet- ics is related to the integral of the viable cells curve in batch systems. Biotechnol. Lett. 10: 91-96.
23. Riedy, M.C., Muirhead, K.A., Jensen, C. P., Stewart, C.C. 1991. Use of a photolabeling technique to identify nonviable cells in fixed homologous or heterologous cell populations. Cytometry 12: 133-139.
24. Sasaki, D.T., Dumas, S. E., Engleman, E. G. 1987. Discrimina- tion of viable and non-viable cells using propidium iodide in two color immunofluorescence. Cytometry 8: 413-420.
25. Sen, S. , Srienc, F., Hu, W.-S. 1989. Distinct volume distribution of viable and non-viable hybridoma cells: A flow cytometric study. Cytotech. 2: 85-94.
26. Sen, S., Hu, W.-S., Srienc, F. 1990. Flow cytometric study of hybridoma cell culture: correlation between cell surface fluo- rescence and IgG production rate. Enzyme Microb. Technol.
27. Stewart, C. C. 1990. Multiparameter analysis of leukocytes by flow cytometry. pp. 427-450. In: Z. Darzynkiewicz and H.A. Crissman (eds.), Methods in cell biology, vol. 33. Academic Press, San Diego, CA.
601-612.
545-551.
12: 571-576.
964 BIOTECHNOLOGY AND BIOENGINEERING, VOL. 40, NO. 8, OCTOBER 20, 1992