Embed Size (px)
Citation preview

International Journal of InnovativeComputing, Information and Control ICIC International c©2014 ISSN 1349-4198Volume 10, Number 1, February 2014 pp. 67–80
DETERMINATION OF ANIMAL OIL ADDED IN VEGETABLE OILBY STANDARD CHEMICAL METHOD COUPLED WITH IMAGE
TEXTURE ANALYSIS TECHNOLOGY
Peng He, Xiaoqing Wan, Chenglin Wang and Yingpu Jiao
College of Communication and Electronic EngineeringQiqihar University
No. 42, Wenhua Street, Qiqihar 161006, P. R. [email protected]
Received December 2012; revised April 2013
Abstract. For most vegetable oil adulteration detection research methods it remainsdifficult to popularize due to the fact that the application of experimental facilities needsprofessional to operate; moreover, the used experimental facilities are usually expensive.In order to solve these difficulties, a novel approach has been proposed to determinationof vegetable oil adulteration by coupling standard chemical method and image textureanalysis technology. Analysis of the correlation and establish the mathematical model be-tween texture characteristic parameters and cholesterol content by least squares method.Experimental results show significant correlation between the image texture features pa-rameters and cholesterol content, the most correlation coefficient R2 is 0.9872, using thismethod can detect adulteration level which has reached 6.5%. Compare cholesterol contentof mixed oil samples by this paper method and the standard chemical method, the resultsshow that maximum relative error of cholesterol content is 3.51% by this paper methodcalculated value and the standard chemical method measured value. This can prove thatin the range of allowable error texture analysis techniques can be used to detect vegetableoil adulteration.Keywords: Animal and vegetable oil, Cholesterol, Gas chromatography, Texture anal-ysis, Model building
1. Introduction. Grease is an important material for mankind survival. Therefore, theedible vegetable oil quality and supervision become big problems of the national economyand the people livelihood [1-3]. However, in recent years, many unscrupulous tradersto reap huge profits, add shoddy animal oil to vegetable oil; shoddy animal oil part isextracted from chicken, duck and even the bodies of dead animals, it leads to edibleoil poisoning common occurrence. In addition, some communities very concern aboutthe presence of animal fat, especially lard, which is commonly used as a raw material inconsumer products. The presence of animal oil in food, cosmetics and pharmaceuticals canbe viewed from two perspectives, economy and religion. From an economic perspective,some vegetable oils make good adulterate with animal oil to minimize the production cost;from a religious perspective, Islam and Judaism prohibit using or consuming food or otherproducts containing lard or any pig-derived ingredients [4,5]; it has caused widespreadconcern in society as a whole. Edible blended oil (vegetable oil blended with animaloil) does not conform to <The dietary guidelines 2007 for china> and the provisions ofnational standard file [6]. So determination of vegetable oil blended with animal oils isvery important from the standpoint of commerce and health [7,8].
At present, some analytical techniques have been proposed to detect and quantifyanimal fat in vegetable oils such as Fourier transform infrared spectroscopy [9], electronic
67

68 P. HE, X. WAN, C. WANG AND Y. JIAO
noses method and differential scanning calorimetry. B. Yaakob, C. Man et al. proposedusing Fourier transform infrared (FTIR) spectroscopy to detection of lard in vegetableoils. The result showed that FTIR normal spectra and first derivative give better resultsin terms of high value of coefficient of determination or R2 (>0.99) and low value of errorsfor analysis of lard in vegetable oils [4]. J. M. N. Marikkar, H. M. Ghazali et al. proposeddistinguishing lard from other animal fats in admixtures of some vegetable oils usingliquid chromatographic data coupled with multivariate data analysis. The result shownthat potential of the method is evident, as oil samples that are contaminated with as littleas 2% lard could easily be distinguished [10]. L. Wang, Y. Li et al. proposed using NMRto identify edible vegetable oil mixed with food and beverage industry waste grease. Theresults show that the method can detect more than 1% waste grease [11]. These abovemethods have good performance in detection results and recognition rate, but there couldbe long delay, complex purification measures, experimental equipment expensive and theapplication of equipment need professional operation, so these methods are difficult topopularize and apply. Image texture analysis technologies are used to detection andanalysis vegetable oil adulteration based on the above shortages. The research resultscan be applied to detection of halal and kosher market, judgment whether adulterationanimal oil in vegetable oil.
2. Materials and Methods. The edible vegetable oils are commercially available soy-bean oil, corn germ oil and sunflower seed oil; animal oils are fresh lard, beef tallow andchicken oil.
2.1. Experimental apparatus. Heating stirrer, magnet stirrer, stainless steel sieve,highly sensitive light source, image acquisition card, high-definition CCD camera, PC,cylindrical barrel, DSP board, the image processing analysis device is shown below.
Figure 1. Image processing analysis device
When capture the oil sample, the captured images are great interfered due to lightand other external interference factors, a set of sealing experiment device is designedbased on the above shortcomings and it is a freely movable cylinder kegs. Inside themain lid install two highly sensitive light source and a high-definition CCD camera, thehigh-definition CCD is located vertically over the sample at a distance of 15cm. Thehighly sensitive light source is placed above the sample and the angle is 45◦ with thesample, the internal wall is painted black to avoid the external light reflections. Thismeans forming a closed environment, it can well reduce the interference of the externalenvironment. The oil samples are placed above the heating device, when capture sampleimages, highly sensitive light source and CCD camera are opened at the same time to

DETERMINATION OF ANIMAL OIL ADDED IN VEGETABLE OIL 69
capture sample images. A DSP board is fixed between the image capture apparatus andcomputer processing and analyzing system, the board outside enlarge image compressionmodule, storage module and wireless transmission and receiving module, captured imagesare compressed and storage in memory module of DSP board, and, they are real-timetransmitted to computer processing and analysis system by the wireless transmission andreceiving module of DSP board. The sample images are analyzed by Matlab software forthe platform, processing and analyzing data to calculate the sample cholesterol content bythe least square method, the calculated cholesterol content value is sent back to wirelessreceiving module of the image capture devices by GPRS network. Finally, the receiveddata is shown on the liquid crystal display screen outside of the cylinder barrel.
2.2. Experimental design. When preparation of lard, beef tallow and chicken oil, a75 micron stainless steel screen is used to separate residue remained in the animal oil,ensuring the lard fat globules are not retained. Preparation of test samples are detectionand recognition mixed oil samples (soybean oil, corn oil and sunflower oil adulterate re-spectively with lard, beef tallow and chicken oil). Soybean oil, corn oil and sunflower oilare blended with lard, beef tallow and chicken oil in varying proportions, ranging from 2to 80%, forty mixed oil samples are prepared in each group: 98:2, 95:5, 90:10, 80:20(w/w),etc. Determination of cholesterol content of different oil samples is by standard chemicalmethod [12]. Determination of cholesterol is 721 spectrophotometer, electric heated waterbath, electric oscillator, glass stopper test tube, petroleum ether, ethanol, concentratedsulfuric acid, glacial acetic acid, excellent pure, phosphoric acid, Cholesterol standard so-lution, reagents were all analytical grade, water is distilled water. Preparation of samplesolution: Cholesterol standard stock solution (1 mg/mL): accurately weighed and takencholesterol 100 mg dissolved in glacial acetic acid and constant volume to 100 mL, absorbcholesterol standard stock solution 10 mL, constant volume with glacial acetic acid to100 mL. Iron vitriol chromogenic agent, Jarosite stock solution: 4.463 g ammonium ferricsulfate [FeNH4(SO4)2 • H2O] was dissolved in 100 mL 85% phosphoric acid, the solutionwas stored in desiccator and it is stable at room temperature. Iron vitriol color liquid,absorbs iron vitriol stock solution 10 mL, using concentrated sulfuric acid constant vol-ume to 100 mL, stored in a desiccator to prevent water uptake. 50% potassium hydroxidesolution: weigh 50 g potassium hydroxide, dissolved in distilled water and diluted to 100mL. 5% sodium chloride solution: weigh 5 g sodium chloride, dissolved in distilled waterand diluted to 100 mL; nitrogen: purity 99.99% [13].
Cholesterol standard solution: Absorb cholesterol standard stock solution 0.0, 0.5, 1.0,1.5, 2.0 mL were placed in 10 mL test, glacial acetic acid was added to each test tubeso that the total volume reached 4 mL, added 2 mL iron vitriol color liquid along thewall and blending. Along the wall add 2 mL iron vitriol color liquid, within 15 ∼ 90min, colorimetric analysis under 560 ∼ 575 nm wavelength. Determination of sample:Measuring food cholesterol: 3 to 4 drops extracted grease (about containing cholesterol300 ∼ 500 g) are placed in a 25 mL test tube and recorded accurately its weight. Add 4mL anhydrous ethanol and 0.5 mL 50% potassium hydroxide solution, saponification 1 hin 65◦C thermostatic water bath. Shaking the test tube for every 20 ∼ 30 min in order tosaponify completely; after completing the saponification, remove the tubes and cooling.Add 3 mL 5% sodium chloride solution and 10 mL petroleum ether, tightly closed glassstopper, using electric oscillator shaking for 2 min, still stratification (generally takesabout 1 h). Take the supernatant petroleum ether liquid 2 mL to place in 10 mL glasstube plug, using nitrogen blow dry in a 65◦ water bath, add 4 mL glacial acetic acid and2 mL jarosite color liquid and blending, under 560 ∼ 575 nm wavelength colorimetricanalysis the mixed solution after placing 15 min, measure absorbance, look up cholesterol

70 P. HE, X. WAN, C. WANG AND Y. JIAO
content in the corresponding standard curve, the formula is as follows.
X =m× V × c
V1 ×m1
× 1
1000(1)
In the above formula:X – sample cholesterol content, mg/100g;m – The cholesterol content on the cholesterol standard line based on the measured
absorbance values, g;V – The petroleum ether total volume, mL;V1 – The removed petroleum ether volume, mL;m1 – Weighed grease sample content, g;c – The fat content of food samples, g/100g;1/1000 – Converted into cholesterol milligrams in per 100g food samples.In order to verify the accuracy of the method, choose three different sample additive
amount study sample recovery, results prove the sample recovery percents are more than99.5%.
3. Result Analysis. The images are represented in RGB color space, due to the threecomponents of R, G and B have a high correlation, so that the color images are diffi-cult to digitize adjustment in detail. Therefore, RGB color space model is transformedinto HIS model and the model can eliminate the intensity component influence from thecolor information, so that the model is called good tool based on the color descriptionimage processing method, the color description is natural and intuitive for the people’sperception, it makes digital image retention wide color gamut and rich color [14]. In thispaper, several techniques are used to extract image texture features, mainly includes: tex-ture spectrum method (TSM); fractal dimension (FD); wavelet symbiotic matrix (WSM-atechnology that combined with wavelet, gray level co-occurrence matrix and color featuresextraction technology) and improved Hu moment invariants (IHMI).
3.1. Spectral measures of texture (TSM). Texture spectrum measurement is a kindof global texture pattern and its frequency domain can be easy to identify, spectral mea-sures of texture are based on the Fourier spectrum; these global texture patterns, easilydistinguishable as concentrations of high-energy bursts in the spectrum, generally arequite difficult to detect with spatial methods because of the local nature of these tech-niques. Thus spectral texture is useful for discriminating between periodic and nonperi-odic texture patterns, and, further, for quantifying differences between periodic patterns[15].Interpretation of spectrum features is simplified by expressing the spectrum in polar
coordinates to yield a function S(r, θ), where S is the spectrum function and r and θ arethe bariables in this coordinate system. Analyzing Sθ(r) for a fixed value of θ yields thebehavior of the spectrum (such as the presence of peaks) along a radial direction fromthe origin, whereas analyzing Sr(θ) for a fixed value of r yields the behavior along a circlecentered on the origin. A global description is obtained by integrating these functions:
S(r) =π∑
θ=0
Sθ(r) S(θ) =
R0∑r=0
Sr(θ) (2)
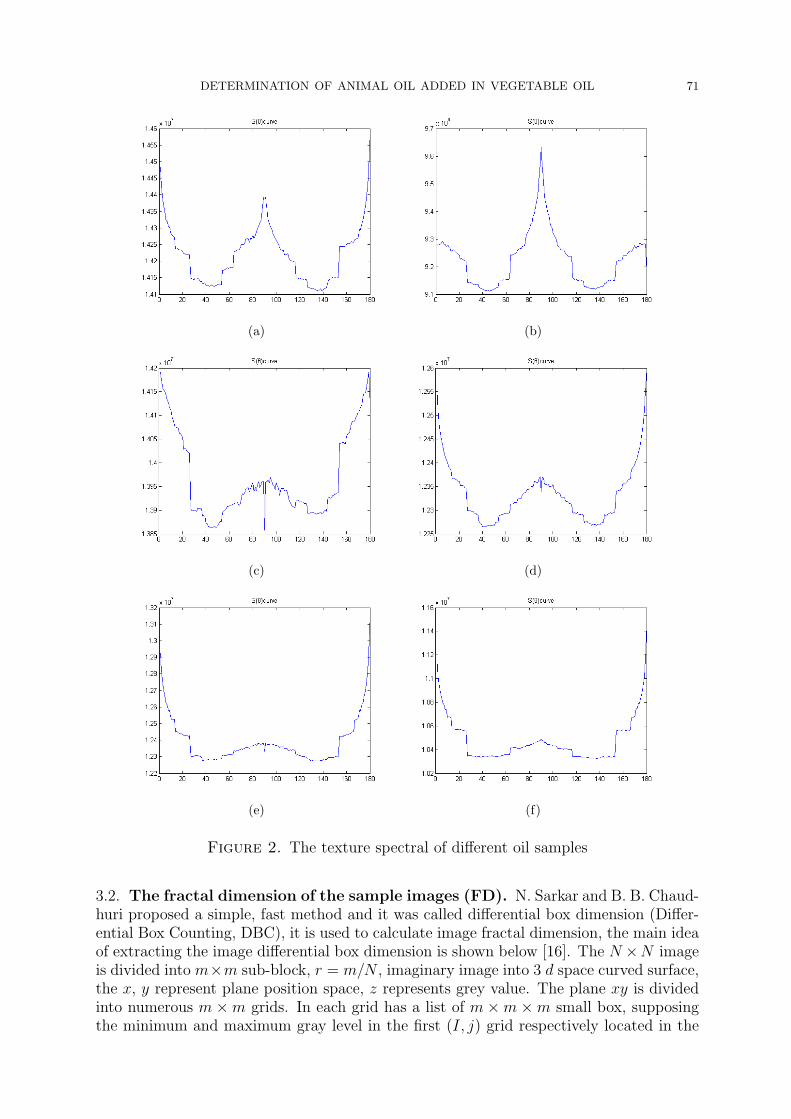
R0 is the radius of a circle and center at the origin. Different oil samples texturespectrum diagram under the same experimental environment are shown below.Figures 2(a)-2(f) represent respectively texture spectral S(θ) of soybean oil, lard and
mixed oil (Soybean oil mixed with 10%, 20%, 30% and 40% lard) sample images.
DETERMINATION OF ANIMAL OIL ADDED IN VEGETABLE OIL 71
(a) (b)
(c) (d)
(e) (f)
Figure 2. The texture spectral of different oil samples
3.2. The fractal dimension of the sample images (FD). N. Sarkar and B. B. Chaud-huri proposed a simple, fast method and it was called differential box dimension (Differ-ential Box Counting, DBC), it is used to calculate image fractal dimension, the main ideaof extracting the image differential box dimension is shown below [16]. The N ×N imageis divided into m×m sub-block, r = m/N , imaginary image into 3 d space curved surface,the x, y represent plane position space, z represents grey value. The plane xy is dividedinto numerous m ×m grids. In each grid has a list of m ×m ×m small box, supposingthe minimum and maximum gray level in the first (I, j) grid respectively located in the

72 P. HE, X. WAN, C. WANG AND Y. JIAO
first k and the first l box [16]. That is:
kr(i, j) = l − k + 1 (3)
Kr (I, j) is the number of boxes that cover (i, j) grid, and suppose the number of boxesthat cover the entire image is Kr. That is:
Kr =∑i,j
nr(i, j) (4)
Fractal dimension is:
D = limlog(Kr)
log(1/r)(5)
Application of least square method for linear least squares fitting, the slope of straightline is the image difference box dimension D. In order to reduce the amount of calcu-lation, the algorithm is improved and the improved ideas are shown below. Calculatingthe average grey value of a certain scale window on the basis of original DBC algorithms,judge each pixel gray level, the result is accumulated of min if the value is less than themean gray level, on the contrary, accumulation of max. Using the max and min insteadof the maximum and the minimum of the original algorithm, image fractal dimension iscalculated by the least squares fitting at last and further to extract a variety of character-istics of sample images, mainly includes texture directionality, roughness and orientationdegree information, combination of image fractal dimension and extracts a variety ofcharacteristics as the texture feature set of classification and recognition sample image.
3.3. Wavelet symbiotic matrix of sample images (WSM). In this paper, the treewavelet transform is used to extract image texture feature, during the process of decom-position iterations, tree wavelet transform has the advantage that it not only can de-composition the low frequency signal but also further decomposition the high frequencysignal, and, it can focus on all the frequency range, the main idea of calculate waveletenergy algorithm is as follows:
I =1
M ×N
M−N−1∑x,y=0
|s(x, y)|2 (6)
M × N – sub-block images size, s (x, y) – sub-block images coefficients. The threelayers tree wavelet decomposition is adopted in this paper and 10 sub-block images areobtained, calculate sub-block image energy of each decomposition level [17]. Image graylevel co-occurrence matrix: Gray level co-occurrence matrix is a kind of common andeffective method of extract image texture features. It reflects gray image comprehensiveinformation about direction, adjacent interval and variation amplitude. The main idea ofgray level co-occurrence matrix algorithm is shown below: supposing f(x, y) is a digitalimage, the image size is M ×N , gray level is Ng, gray level co-occurrence matrix of meetcertain spatial relationship is shown below.
p(i, j) = #{(x1, y1), (x2, y2) ∈ M ×N |f(x1, y1) = i, |f(x2, y2) = j} (7)
# represents the number of elements in set x, p is Ng × Ng matrix. If the distanceof (x1, y1) and (x2, y2) is d, the included angle with the horizontal axis is θ, you canget all kinds of gray level co-occurrence matrix p (i, j, d, θ) about separation distance andangle. Extract the correlation (COR), entropy (ENT), second moment (ASM) and inversematrix (IDM) features of the image gray level co-occurrence matrix, several parametersexpression of gray level co-occurrence matrix is shown below [18].

DETERMINATION OF ANIMAL OIL ADDED IN VEGETABLE OIL 73
(1) Angular second moment (ASM)
ASM =L−1∑i=0
L−1∑j=0
∧p2
σ(i, j) (8)
Angular second moment is a measure means of the image gray distribution uniformity.When the distribution of GLCM elements are more concentrated in the main diagonal,the gray distribution is uniform, when the image texture is coarse, angular second momentis larger, vice versa.
(2) Entropy (ENT)
ENT = −L−1∑i=0
L−1∑j=0
∧pδ(i, j) lg
∧pδ(i, j) (9)
The entropy is a measure means of image amount of information, texture informationalso belongs to image information. If the image does not have any texture, entropy isclose to 0; if the image is full of texture, the entropy is maximum.
(3) Correlation (COR)
COR =
L−1∑i=0
L−1∑j=0
ij∧pδ(i, j)− u1u2
σ21σ
22
u1 =L−1∑i=0
iL−1∑j=0
∧pδ(i, j) u2 =
L−1∑j=0
jL−1∑i=0
∧pδ(i, j) (10)
σ21 =
L−1∑i=0
(i− u1)2
L−1∑j=0
∧pδ(i, j) σ2
2 =L−1∑j=0
(i− u2)2
L−1∑i=0
∧pδ(i, j)
The correlation can be used to measure the GLCM elements similarity degree in rowdirection or column direction.
(4) Inverse matrix (IDM)
ENT =L−1∑i=0
L−1∑j=0
∧pδ(i, j)
1 + (i− j)2(11)
If gray level co-occurrence matrix diagonal elements have bigger value, IDM value islarger, vice versa. Calculate GLCM parameters with the four directions, in order to makethe results more accurate, we take the mean value of GLCM characteristic parameterswith four directions, the calculate formulas are as follows.
ASM =1
4
∑ASM ENT =
1
4
∑ENT COR =
1
4
∑COR IDM =
1
4
∑IDM
(12)The sample images are divided into 8 × 8 sub-block, Haar wavelet is used for tree
wavelet decomposition and obtains 10 sub-block images. The tree wavelet, gray level co-occurrence matrix and color feature extraction technology are combined to extract optimaltexture feature set, the purpose is to get more accurate classification and identificationsample images. Experimental steps are shown below.
(1) Image preprocessing (image segmentation-image enhancement-smoothing filtering),the RGB color model is transformed into HIS model and extracts HIS component ofsamples images.
(2) The sample images are divided into 8 × 8 sub-block images and using three layerstree wavelet to decompose sub-block images.
(3) Gray symbiotic matrix is constructed on low frequency band (four directions: 0◦,45◦, 90◦ and 135◦), calculating four characteristic parameters average value of the co-occurrence matrix.

74 P. HE, X. WAN, C. WANG AND Y. JIAO
(4) Calculate sub-block image energy of the tree wavelet each decomposition level,gray level co-occurrence matrix statistics and color feature value are combined to extractoptimal texture feature set.(5) The optimal texture feature set is normalized processing and the result is the ulti-
mate texture feature set of classification and recognition sample images.(6) The improved nearest neighbor domain classifier is used for classification and recog-
nition sample images at last. Each group of texture feature sets is average value of 160test sample images. The three layers tree wavelet decomposition diagram of differentsample images is shown below.
(a) (b) (c)
Figure 3. Three layers tree wavelet decomposition diagram of sample images
Figures 3(a)-3(c) represent respectively mixed oil (soybean oil adulterate with 20% lard,beef tallow and chicken oil) sample images of three layers tree wavelet decompositiondiagram.
3.4. The improved Hu moment invariants (IHMI). A two-dimensional (p+q) ordermoment of digital image f(x, y) is defined as:
mpq =∑x
∑y
xpyqf(x, y) p, q = 0, 1, 2, · · · (13)
The corresponding central moment is defined as:
upq =∑x
∑y
(x− x)p(y − y)qf(x, y) x = m10/m00 y = m01/m00 (14)
Normalized (p+ q) order central moment is defined as:
ηpq = upq/ur00 p, q = 0, 1, 2, . . ., r = (p+ q)/2 + 1 (15)
Seven two-dimensional invariant moments sets and these parameters are all not sensi-tive about panning, zooming, mirroring and rotation, it can be derived by the followingformulae [19].
φ1 = η20 + η02 φ2 = (η20 − η02)2 + 4η211 (16)
φ3 = (η30 − 3η12)2 + (3η21 − η03)
2 φ4 = (η30 + η12)2 + (η21 + η03)
2 (17)
φ5 =(η30 − 3η12)(η30 + η12)[(η30 + η12)2 − 3(η21 + η03)
2]
+ (3η21 − η03)(η21 + η03)[3(η30 + η12)2 − (η21 + η03)
2](18)
φ6 = (η20 − η02)[(η30 + η12)2 − (η21 + η03)
2] + 4η11(η30 + η12)(η21 + η03) (19)

DETERMINATION OF ANIMAL OIL ADDED IN VEGETABLE OIL 75
φ7 =(3η21 − η03)(η30 + η12)[(η30 + η12)2 − 3(η21 + η03)
2]
+ (3η12 − η30)(η21 + η03)[3(η30 + η12)2 − (η21 + η03)
2](20)
Image matching: the color images are converted to grayscale images. Extracted texturefeatures: image seven moment invariants, correlation, entropy, inverse matrix and angularsecond moment. In the following table shows 11 texture feature parameters of mixed oilsample images. Each set of data in the below table is respectively average value of 160sample images test results, the experimental results are shown below.
Table 1. The texture feature parameters of different mixed oil samples
θ1 θ2 θ3 θ4 θ5 θ6 θ7 COR ENT IDM ASM
a 6.6849 24.8714 30.3629 31.5417 62.8077 43.9942 62.1446 3.5201 0.7295 1.3480 3.0674a1 6.8759 24.1296 29.7910 30.1920 62.1187 43.3883 61.6512 3.1796 0.6845 1.3906 2.9485a2 6.8835 23.6854 29.5807 29.4984 61.6528 43.0785 59.3775 2.9957 0.5643 1.5357 2.7319a3 6.8996 22.9626 28.9844 28.5612 60.8892 42.4603 59.2484 2.8582 0.5506 1.6585 2.5161b 6.9031 26.8954 31.9067 31.8540 62.9723 47.7667 62.8319 3.9196 0.9361 1.0656 4.3247b1 6.9267 26.3352 30.9067 31.3173 62.9407 43.7667 60.8319 3.5196 0.7861 1.3227 3.5647b2 6.9419 25.6528 29.7593 30.9985 62.4543 43.5709 59.9976 3.2217 0.6941 1.3697 3.1849b3 6.9568 25.0061 29.2961 29.7968 60.9915 43.0093 59.7620 3.0246 0.6312 1.3869 3.1215c 6.9091 25.1663 31.1577 30.5185 61.5494 45.8743 62.3215 2.9985 1.4087 1.1562 5.8360c1 6.9179 25.0654 31.0067 29.8507 60.9980 44.3350 62.2437 2.6620 1.1218 1.2325 4.7884c2 6.9454 24.8066 30.6809 29.7264 60.1618 44.2192 60.8849 2.6123 1.1199 1.3398 4.4574c3 6.9857 24.5704 29.8374 29.3758 60.1528 43.7357 59.7453 2.3813 1.0041 1.3722 3.8805
In the table, samples a, a1, a2 and a3; b, b1, b2 and b3; c, c1, c2 and c3 representrespectively mixed oil (soybean oil; corn oil; sunflower seed oil adulterate with 0%, 10%,20% and 30% lard). Normalization processing extracted 11 texture parameters. Thealgorithm is shown below:
sum =√
φ21 + φ2
2 + φ23 + φ2
4 + φ25 + φ2
6 + φ27 + (COR)2 + (ENT )2 + (ASM)2 + (IDM)2
(21)f1 = φ1/sum f2 = φ2/sum f3 = φ3/sum
f4 = φ4/sum f5 = φ5/sum f6 = φ6/sum(22)
f7 = φ7/sum f8 = COR/sum f9 = ENT/sum
f10 = ASM/sum f11 = IDM/sum(23)
The normalized eigenvector is:
W = (f1, f2, f3, f4, f5, f6, f7, f8, f9, f10, f11) (24)
The normalized eigenvector value is as the ultimate texture feature set of classificationand recognition sample images.
Compare of feature extraction time based on different texture analysis technologies, theexperimental results are shown below.
Table 2. Feature extraction time based on different texture analysis technologies
TSM FD WSM IHMIFeature extraction time 290ms 410ms 215ms 258ms
Table 2 shows that wavelet symbiotic technology in terms of feature extraction timeperformance is most prominent under the same experimental environment, followed by theimproved Hu moment invariants technology. The improved method has higher efficiencythan using alone Hu moment invariants, this is due to the improved Hu invariant momenttechnology has strong resistance ability for image gray level change.

76 P. HE, X. WAN, C. WANG AND Y. JIAO
3.5. The classification and recognition of test samples. Respectively comparethe classification and recognition ability of texture spectrum method, fractal dimension,wavelet symbiotic matrix and improved Hu moment invariants technologies. The im-proved nearest neighbor domain classifier is used to classify and identify sample images,improved method main idea is shown below.The basic idea of neighborhood classification is: set R1, R2, . . ., Rm as a set of reference
vector m and corresponding with W1,W2, . . .,Wm, the vector is Rki in Ri, that is: R
ki ⊂ Ri
k = 0, 1, 2, . . . , l, Ri = {R1i , R
2i , . . . , R
li}, the distance between the input feature vectors
X and Ri is represented as follows:
d(X,Ri) = min |X −Ri| k = 0, 1, 2, . . . , li (25)
The distance is the minimum distance of each vector between X and Ri. If the distanceof sample one and sample two satisfy the formula:
Di(X) = XTRi +RTi X −RT
i Ri i = 1, 2, · · · ,m (26)
Discriminant function:
Di(X) = min{XTRk
i + (Rki )
TX − (Rki )
TRki
}k = 0, 1, 2, · · · , l i = 1, 2, · · · ,m (27)
thenDki (X) is a linear combination of the characteristic parameters, the decision boundary
is piecewise linear, the corresponding class Wi is identified class.Improving the above classification method, a large number of sample images are used
as each group sample images. We set 7 feature parameters that are used to identifyand classify the different types of sample images; first read the upper and lower limitsvalues of 7 features control values, the feature vector corresponding to Ri. The obtainedimage feature values subtracted respectively the upper and lower limits values of N classsample images corresponding control values, the smaller difference form N number ofgroups and it corresponds to the formula: d(X,Ri) = min |X − Ri| k = 0, 1, 2, . . . , li,then adds 7 feature control values of each group, 7 feature control values in N groupsand the smallest number of the groups corresponding sample category is the result [20].The experimental results show that the improved nearest neighbor classification methodimproves the detection speed and the recognition effect is also very well. Classificationand recognition results of different mixed oil samples based on different texture analysistechnologies are shown below.
Table 3. Classification and recognition results of different mixed oil sam-ples based on wavelet symbiotic matrix technique
SamplesJudging results
Accuracy ratea0 a1 a2 b0 b1 b2 c0 c1 c2
a0 260 260 0 0 0 0 0 0 0 0 100.00%a1 260 0 258 0 0 2 0 0 0 0 99.23%a2 260 0 0 259 0 0 0 0 0 1 99.62%b0 483 1 0 0 482 0 0 0 0 0 99.79%b1 483 0 0 0 0 482 0 0 1 0 99.79%b2 483 0 0 0 0 0 480 0 0 3 99.38%c0 565 0 0 0 0 0 0 565 0 0 100.00%c1 565 0 2 0 0 1 0 0 562 0 99.47%c2 565 0 0 1 0 0 3 0 0 561 99.29%

DETERMINATION OF ANIMAL OIL ADDED IN VEGETABLE OIL 77
In Table 3, samples a0, a1 and a2; b0, b1 and b2; c0, c1 and c2 represent respectivelymixed oil (soybean oil, corn oil and sunflower seed oil adulterate with 6.5% lard; 6.5%beef tallow; 6.5% chicken oil).
Table 4. Classification and recognition results of different mixed oil sam-ples based on improved Hu moment invariants technique
SamplesJudging results
Accuracy ratea0 a1 a2 b0 b1 b2 c0 c1 c2
a0 260 259 0 0 0 0 0 1 0 0 99.62%a1 260 0 257 0 0 2 0 1 0 0 98.85%a2 260 0 0 254 0 0 4 0 0 2 97.69%b0 483 2 0 0 481 0 0 0 0 0 99.59%b1 483 0 3 0 0 478 0 0 2 0 98.96%b2 483 0 0 3 0 0 473 0 0 7 97.93%c0 565 11 0 0 5 0 0 549 0 0 97.17%c1 565 0 5 0 0 7 0 0 553 0 97.88%c2 565 0 0 2 0 0 5 0 0 558 98.76%
Repeat the above test, in terms of feature extraction time and classification recognitionrate, wavelet symbiotic matrix technology is most prominent performance, followed byimproved Hu moment invariants, fractal dimension and texture spectrum method. Usingwavelet symbiotic matrix technology can detect minimum adulteration level which hasreached 6.5%. When adulterating ratio more than 6.5% in vegetable oil, wavelet symbioticmatrix technology can detect and identify mixed oil samples, and, the recognition rate is100%.
3.6. Model building. In order to detect accurately animal oil doping ratio in vegetableoil, we establish multiple regression analysis equation between image texture featuresparameters and cholesterol content by least squares method. The multiple regressionanalysis results are shown below.
Table 5. Linear correlation between texture feature parameters andcholesterol content in the mixed oil based on wavelet symbiotic matrix tech-nique
Samples Multiple linear regression equation R2 significance levela y = −200.41x1+0.640x2 − 3.016x3+1.254x4 − 7.255x5 + 220.513 0.9759 0.002b y = −38.451x1 − 4.395x2 − 26.023x3 − 11.378x4 − 3.072x5 + 67.695 0.9816 0.002c y = 782.551x1 − 11.079x2 + 13.351x3 − 12.471x4 − 3.996x5 + 46.704 0.9872 0.001
a, b and c represent respectively mixed oil (soybean oil; corn oil; sunflower seed oiladulterate with lard) sample, y represents cholesterol content, x1, x2, x3, x4 and x5
represent respectively S component average weight, correlation, entropy, second momentand inverse matrix, model significance level value less than 0.05 in the above models, sothe model is significant. Because of the cholesterol content in soybean oil, corn oil andsunflower oil is zero, so we can calculate animal oil content in vegetable oil according tocholesterol content.

78 P. HE, X. WAN, C. WANG AND Y. JIAO
3.7. The system test. In order to verify the validity of the proposed method, we com-pare cholesterol contents to different mixed oil samples with this paper method and thestandard chemical method based on wavelet symbiotic matrix technology. Randomly se-lected from the different brand vegetable oil that sells on the local market, choose goldenarowana soybean oil, west king corn germ oil corn germ oil and fook lam moon sunfloweroil in this article. In the above different brand vegetable oil blended with different pro-portions of lard, beef tallow and chicken oil, different mixed oil samples are stirred bymagnet stirrer and rotating speed is 50, 200, 500 and 1000, etc. (RPM), then the testsamples are heated to 95◦ by heating stirrer, capture different mixed oil sample imagesby the homemade experimental apparatus, the captured images are transmitted to imageprocessing and analysis system by the wireless transmission and receiving module of DSPboard, and, timing, the image processing and analysis system return back the cholesterolcontent with the test sample to the LCD screen of homemade experimental apparatus.End of the timing, a large number of experimental results prove that longest consumingtime is 46.9s, calculate and measure cholesterol content of mixed oil samples by the pro-posed method and standard chemical method, compare of the maximum relative error ofthe calculated cholesterol content value and measured cholesterol content value, the resultis shown below.
Table 6. Measured results of cholesterol contents for different mixed oilsamples with this paper method and standard chemical method based onwavelet symbiotic matrix technique
SamplesS component
Cholesterol content (mg/100g) Maximum
average weightThis paper Standard chemical relative errormethod method (%)
a0 0.9752 7.57 7.41 2.16a1 0.0215 7.23 7.41 2.43a2 0.0102 7.15 7.41 3.51b0 0.9935 10.98 10.77 1.95b1 0.1095 10.59 10.77 1.67b2 0.0583 10.43 10.77 3.16c0 0.9937 8.28 8.52 2.82c1 0.1118 8.63 8.52 1.29c2 0.0437 8.34 8.52 2.11
In Table 6, samples a0, a1 and a2; b0, b1 and b2; c0, c1 and c2 represent respectivelymixed oil (soybean oil, corn oil and sunflower seed oil adulterate with lard; beef tallow;chicken oil). As can be seen from above table, the results that maximum relative errorof the calculated cholesterol content and measured cholesterol content is 3.51% with thispaper method and standard chemical method, this can prove that in the range of allowableerror, texture analysis techniques can be used to detect vegetable oil adulteration.
4. Conclusion. In order to obtain easily to popular, nondestructive and low price re-search methods for vegetable oil adulteration detection, this article proposed couplingstandard chemical method and image texture analysis technology for detecting vegetableoil adulteration, and, the proposed method can achieve real-time determination of ex-perimental samples by self-made testing apparatus. Wavelet symbiotic matrix has theadvantages of strong adaptability, robustness and multi-scale representation image tex-ture features, in terms of feature extraction time and classification recognition rate per-formance is most prominent, using this method can detect that minimum adulteration

DETERMINATION OF ANIMAL OIL ADDED IN VEGETABLE OIL 79
level has reached 6.5%. In order to verify the validity of proposed method, determinationof animal oil doping ratio in mixed oil samples by the proposed method and standardchemical method, the maximum relative error is 3.51% between the calculated value andmeasured value. Results show that in the range of allowable error using texture analysistechnology to detect vegetable oil blended with animal oil is feasible. Research results canbe applied in halal and kosher market due to some communities especially Muslims andJews are very concerned about the presence of animal fats; from a religious perspective,Islam and Judaism prohibit using or consuming food or other products containing lardor any pig-derived ingredients. So the research has a great application prospect in theMuslim and Judaism market.
Acknowledgments. Fund project: This investigation is supported by Ministry of sci-ence and technology national international science and technology cooperation project(S2013GR0264); Science and technology project in Heilongjiang province education de-partment (11521331); Young Research Hardcore Supporting Project of Heilongjiang (No. 1155G63) and Natural Science Foundation of Heilongjiang, China (F200804).
REFERENCES
[1] R. Su, D. P. Liang and M. Li, Edible oil quality detection technology progress, Rock and MineralAnalysis, vol.31, no.1, pp.57-63, 2012.
[2] J. K. Fernandes, T. Umebara and M. K. Lenzi, Image analysis for composition monitoring. Com-mercial blends of olive and soybean oil, Acta Scientiarum, vol.35, no.2, pp.317-324, 2013.
[3] E. Christopoulou, M. Lazaraki and M. Komaitis, Effectiveness of determinations of fatty acids andtriglycerides for the detection of adulteration of olive oils with vegetable oils, Food Chemistry, vol.84,pp.463-474, 2004.
[4] B. Yaakob, C. Man and A. Rohman, Detection of lard in vegetable oils, Lipid Technology, vol.23,no.8, pp.180-182, 2011.
[5] Y. Yang, L. Gao and B. Z. Qiao, A study of corroboration analysis for determination of mineral oiladded in vegetable oil with gas chromatography-mass spectrometry, Analytical Laboratory, vol.23,no.5, pp.80-83, 2004.
[6] C. Li, L. Shan and X. G. Wang, Summarization of detection methods for vegetable oil adulteration,Agricultural Engineering Technology·Agricultural Product Processing, vol.5, pp.30-35, 2007.
[7] J. M. N. Marikkar, H. M. Ghazali et al., Distinguishing lard from other animal fats in admixtures ofsome vegetable oils using liquid chromatographic data coupled with multivariate data analysis, FoodChemistry, vol.91, pp.5-14, 2005.
[8] J. M. N. Marikkar, O. M. Lai et al., Detection of lard and randomized lard as adulterants inrefined-bleached-deodorized palm oil by differential scanning calorimetry, Journal of the AmericanOil Chemists’ Society, vol.78, no.11, pp.1113-1119, 2001.
[9] R. M. Maggio, L. Cerretani, E. Chiavaro et al., A novel chemometric strategy for the estimation ofextra virgin olive oil adulteration with edible oils, Food Control, vol.21, pp.890-895, 2010.
[10] J. M. N. Marikkar, H. M. Ghazali et al., Use of gas liquid chromatography in combination withpancreatic lipolysis and multivariate data analysis techniques for identification of lard contaminationin some vegetable oils, Food Chemistry, vol.90, pp.23-30, 2005.
[11] L. Wang, Y. Li and J. H. Hu, Nuclear magnetic resonance spectroscopy identification of ediblevegetable oil mixed with food and beverage industry waste edible fats, China Grease, vol.33, no.10,pp.75-76, 2008.
[12] The national standard of the People’s Republic of China – Method for determination of cholesterolin foods, GB/T 15206-1994.
[13] H. J. Lu, Rapid determination of the cholesterol content in animal fats by gas chromatography, TheUse and Maintenance of Modern Instruments, no.6, pp.33-35, 1998.
[14] R. C. Gonzalez, R. E. Woods and S. L. Eddins, Digital Image Processing Using MATLAB, PearsonPrentice Hall, 2003.
[15] A. L. Wang, M. S. Ye et al., MATLAB R2007 Digital Processing Technology and Applications Beijing,Electronics Industry Publishing House, 2008.

80 P. HE, X. WAN, C. WANG AND Y. JIAO
[16] N. Sarkar and B. B. Chaudhuri, An efficient differential box-counting approach to compute fractaldimension of image, IEEE Transactions on System Man and Cybernet, vol.24, no.1, pp.115-120,1994.
[17] T. Chang and C. C. J. Kuo, Texture analysis and classification with tree structured wavelet trans-form, IEEE Trans. on Image Processing, vol.3, no.4, pp.429-441, 1993.
[18] S. Z. Wang, J. H. Zhang and Q. Feng, Defect detection of muskmelon based on texture featuresand color features, Transactions of the Chinese Society for Agricultural Machinery, vol.42, no.3,pp.175-179, 2011.
[19] D. F. Zhang, MATLAB Digital Image Processing, Mechanical Industry Press, Beijing, 2012.[20] M. Yao et al., Digital Image Processing, Machinery Industry Press, Beijing, 2006.