Embed Size (px)
Citation preview

Journal of Chromatography A, 1120 (2006) 260–267
Determination of alkylphenols and alkylphenol carboxylates inwastewater and river samples by hemimicelle-based extraction
and liquid chromatography–ion trap mass spectrometry
Manuel Cantero, Soledad Rubio, Dolores Perez-Bendito ∗Department of Analytical Chemistry, Facultad de Ciencias, Edificio Anexo Marie Curie,
Campus de Rabanales, 14071-Cordoba, Spain
Available online 18 January 2006
Abstract
Sodium dodecyl sulfate (SDS)-coated alumina and cetylpyridinium chloride (CPC)-coated silica were investigated as new sorbents for the con-centration of alkylphenol polyethoxylate (APE) biodegradation products from wastewater and river water samples. Octylphenol (OP), nonylphenol(NP), octylphenol carboxylic acid (OPC) and nonylphenol carboxylic acid (NPC) were quantitatively retained on both supramolecular sorbents onthe basis of the formation of mixed hemimicelles and admicelles. SDS hemimicelles-based SPE was proposed for the extraction/concentration oftsb1a©
KR
1
uttctatx(
air
0d
he target compounds prior to their separation and quantitation by liquid chromatography/electrospray ionization in negative mode, ion trap masspectrometry. No clean-up steps or evaporation of the eluent were required. The recovery of APE metabolites from sewage and river water rangedetween 87 and 100%. Concentration factors of about 500, using sample volumes of 1 l, were achieved. Detection limits were between 75 and93 ng/l. The approach developed was applied to the determination of alklylphenols and alkylphenol carboxylic acids in raw and treated sewagend river samples. The concentrations of APE metabolites found ranged between 0.8 and 78 �g/l.
2005 Elsevier B.V. All rights reserved.
eywords: Supramolecular systems; Hemimicelles; Admicelles; Solid-phase extraction; LC/MS; Alkylphenols; Alkylphenol carboxylic acids; Sewage samples;iver samples
. Introduction
Alkylphenol polyethoxylates (APEx, x = 1–20) have beensed in cleaning products and industrial processing for morehan 40 years. Nonylphenol polyethoxyates (NPE) account forhe 80% of the APE produced, while the remaining 20% is basi-ally octylphenol polyethoxylates (OPE). It has been estimatedhat about 60% of the 300,000 tonnes of APEs produced annu-lly worldwide ends up in the aquatic environment, after sewagereatment, as short chain alkylphenol polyethoxylates (APEx,=1–3), alkylphenol carboxylic acids (APC), and alkylphenols
AP) [1–3].Different investigations have reported that APE metabolites
re more toxic than the parent compounds and have the abil-ty to mimic natural hormones by interacting with the estrogeneceptor [4–7]. Domestic sewage effluents can contain up to hun-
∗ Corresponding author. Tel.: +34 957 218644; fax: +34 957 218644.E-mail address: [email protected] (D. Perez-Bendito).
dreds of �g/l of alkylphenolic compounds but industrial effluentsmay contain significantly higher concentrations [1,8–13]. So, thelevels of APE metabolites in the environment may surpass thethreshold necessary to induce endocrine disruption in wildlife.These findings have raised public concern over their environ-mental and human health effects and demand for rapid, simpleand robust methods for the control of AP and APC in complexenvironmental matrixes.
Few methods have been developed to determine AP and APCin the aquatic environment and most of them invariably com-prise three steps, namely, extraction/clean-up/extract evapora-tion, chromatographic separation and mass detection. Extractionof APE metabolites has been carried out by organic solvents[14,15], but today, solid-phase extraction is the preferred method[16–22]. Graphitized carbon black [16,17], hydrophobic poly-mers [18,19] and C18-bonded silica [20–22] have been the mostused sorbents, the former giving the best extraction recoveriesfor AP and APC. Hydrophobic polymers have been describedto give low recoveries for nonylphenol (e.g. about 20–25%)and matrix interferences that cause signal suppression during
021-9673/$ – see front matter © 2005 Elsevier B.V. All rights reserved.oi:10.1016/j.chroma.2005.12.048

M. Cantero et al. / J. Chromatogr. A 1120 (2006) 260–267 261
electrospray ionization [19]. A common characteristic of the dif-ferent packing materials is the high volume of organic solventrequired for elution (e.g. between 6 and 8 ml), which demandsthe evaporation of the eluate to reach suitable preconcentrationfactors.
Gas chromatography/mass spectrometry (GC/MS) has beenused to separate and quantify AP and APC [16,23,24]. Derivati-zation is necessary to make the molecules volatile but the tech-nique still lacks of sensitivity and selectivity [17]. Liquid chro-matography/mass spectrometry (LC/MS), using atmosphericpressure chemical ionization (APCI) [22,25] and electrospray[19–22,26–28], have been reported for different authors for thedetermination of APE metabolites. LC with ESI/MS detectionoffers the best sensitivity and it is today the technique moreused.
This paper deals with the study of the capability of hemimi-celles and admicelles of anionic and cationic surfactants for theconcentration of APE metabolites from aquatic environmentalsamples with the aim of reducing sample treatment to the min-imal steps. Hemimicelles and admicelles have recently used assorbent materials for the SPE of organic compounds [29–32].These sorbents form when ionic surfactants are adsorbed on thesurface of mineral oxides oppositely charged [33–35]. They pro-vide very different mechanisms for retention of organics, whichmakes them widely applicable. High yields and breakthroughvolumes have been obtained for the extraction of ionics [30]ac
ssnnwmrsaifi(
2
2
adkHaSa4(
The internal standard heptylphenol (HP) was purchased fromAcros Organics (Geel, Belgium). All standards were dissolvedin methanol, preserved from light and stored at 4 ◦C. Alumina (�-form, for column chromatography) and Silica gel (Davisil 646)were supplied by Sigma (St. Louis, MO). The physical proper-ties of these mineral oxides were as follows, Alumina: surfacearea (155 m2/g), point of zero charge (pzc, 8.5), particle diameterrange (50–200 �m, mean value 100 �m), mean pore size (58 A),density (3.97 g/cm3). Silica gel: surface area (300 m2/g), point ofzero charge (pzc, 2.8–3), particle diameter range (250–500 �m),mean pore size (150 A), pore volume (1.15 cm3/g). Bond Elut Jr.cartridge columns filled with 500 mg of alumina were obtainedfrom Varian (Victoria, Australia). Cartridge columns filled with500 mg of silica were supplied by Analisis Vınicos (Tomelloso,Spain).
2.2. Sample collection and preservation
Influent and effluent water samples were collected fromdifferent municipal WWTPs (Linares, Mengibar, Andujar andBailen) in the south of Spain in December 2004. Most ofthese WWTPs receive a mixture of domestic and industrialwastewater. The following inputs of industrial effluents wereestimated from the data supplied by the personnel workingin the WWTPs: ∼30–50% for Linares (mainly from the carand engineering industries); ∼60–70% for Andujar (mainlyffWtrglgtsaa
2
2
1wt2twfTa
2
ft
nd amphiphilics [31,32] from environmental samples, with nolean-up steps required.
In this work, hemimicelles/admicelles of sodium dodecylulphate (SDS)-alumina and cetylpyridinium chloride (CPC)-ilica were assessed for the concentration of octylphenol (OP),onylphenol (NP), octylphenol carboxylic acid (OPC) andonylphenol carboxylic acid (NPC) from sewage and riverater on the basis of the formation of analyte:extractantixed adsorbed aggregates. Reversed-phase liquid chromatog-
aphy/electrospray ionization in the negative mode/ion trap masspectrometry (LC/(ESI−–IT)–MS) was used for the separationnd quantitation of the target compounds. Predominant factorsnfluencing the retention of these analytes were investigated. Theeasibility of the method was proven by analysis of AP and APCn samples collected from various wastewater treatment plantsWWTPs) and rivers in the south of Spain.
. Experimental
.1. Chemicals and materials
All reagents were of analytical reagent-grade and were useds supplied. Sodium dodecyl sulfate (SDS), and cetylpyri-inium chloride (CPC) were obtained from Aldrich (Milwau-ee, WI, USA) and Serva (Heidelberg, Germany), respectively.ydrochloric, acetic and nitric acids and HPLC-grade acetone,
cetonitrile and methanol were supplied by Panreac (Sevilla,pain). Alkylphenols [octylphenol (OP), nonylphenol (NP)] andlkylphenol carboxylic acids [4-octylphenol acetic acid (OPC),-nonylphenol acetic acid (NPC)] were obtained from AldrichMilwaukee, WI) and Scharlab (Barcelona, Spain), respectively.
rom olive oil industries) and ∼20–40% for Bailen (mainlyrom brickworks, ceramic and olive oil industries). Mengibar
WTP receives mainly domestic effluents. River samples wereaken from two rivers flowing by Jaen province (Guadalquiviriver, about 1 km downstream of a paper industry, near Men-ibar) and Sevilla province (Guadiana river, near Moron dea Frontera) in January 2005. Samples were collected in darklass containers. They were immediately through 0.45 �m fil-ers (Whatman GF/F, Osmonics, France) in order to removeuspended solids and then they were adjusted to pH 2 by theddition of concentrated nitric acid. Finally, they were storedt 4 ◦C.
.3. Procedure for the determination of AP and APC
.3.1. SDS hemimicelles-based SPEThe Bond Elut Jr. cartridge columns were conditioned with
0 ml of 10−2 M nitric acid solution. Afterward, hemimicellesere formed on the alumina by passing 8 ml of a solution con-
aining 1.25 mg/ml of SDS at pH 2. Samples (100 ml of influent,00 ml of effluent and 500 ml of river water) were preconcen-rated on the hemimicelles and the target compounds were elutedith 2 ml of methanol. Solutions and samples loading was per-
ormed by using a vacuum pump (Eyela A35, Rikakikai Co.,okyo) at a flow rate of 20 ml/min. Aliquots of the eluate werenalyzed by LC/MS.
.3.2. Liquid chromatography/mass spectrometrySeparation and quantification of AP and APC was per-
ormed by using a liquid chromatography/ion trap mass spec-rometry system (1100 Series LC/MSD, Agilent Technologies,

262 M. Cantero et al. / J. Chromatogr. A 1120 (2006) 260–267
Waldbronn, Germany), which can be configured for APCI andESI, and it is equipped with an automatic injector. The injec-tion volume was set at 25 �l. The stationary phase column wasa 15 cm Hypersil AV-1634 C18 column (5 �m particle diame-ter and 4.6 mm i.d.) supplied by Analisis Vınicos (Tomelloso,Spain). The mobile phase consisted of methanol and water.The percentage of methanol varied during the chromatographicrun to give the following values at the specified times: 50%at time zero, 70% at 15 min, 90% at 30 min, 95% at 35 minand 100% at 45 min. The flow rate of the mobile phase was1 ml/min. The diver valve was programmed to send the mobilephase containing SDS and the most polar matrix compounds towaste. So, only 10 min after the beginning of the elution gradi-ent program, the eluted components were sent to the ionizationsource.
Mass analysis was performed with an ESI source in the neg-ative ion mode. To optimize the ESI–MS parameters, a mixtureof the target analytes (5 mg/l of each standard compound) inmethanol was directly analyzed using a KD Scientific, model100, syringe pump (New Hope, Minnesota) at 800 �l/h. the setof parameters selected was as follows: capillary voltage 3.5 kV;capillary exit voltage −99.3 V, skimmer 100 V, trap drive 30.4,drying gas flow 11 l/min, nebulizer gas 50 psi, source tempera-ture 325 ◦C, ion charge control 20,000, maximal accumulationtime 100 ms.
Quantification was carried out under full-scan conditions(eimfc(otr
2
2A
�oaasvs5dmdEt8r
and mass scan range 200–300 m/z. Quantification was carriedout using the extracted molecular ion chromatogram, and thecorresponding peak areas were measured. Correlation betweenpeak areas and SDS concentration was obtained in the range25–500 ng (absolute amount injected) with a correlation coeffi-cient of about 0.998.
2.4.2. Adsolubilization of AP and APCAdsolubilization of the target compounds in SDS-coated
alumina and CPC-coated silica was studied as a function ofsurfactant concentration. Aqueous solutions (25 ml) containing1 mg/l of each analyte and SDS (0–150 mg) at pH 2 or CPC(0–75 mg) at pH 6 were added to 500 mg of alumina or silica,respectively. Then, the mixture was stirred for 5 min and cen-trifuged at 5000 rpm for 10 min. The concentrations of OP, NP,OCP, and NPC in supernatants were determined by LC/MS asspecified above.
3. Results and discussion
3.1. General considerations
Alkylphenols and alkylphenol carboxylic acids areamphiphilic molecules and therefore are expected to undergocooperative self association with SDS adsorbed on alumina andCPC on silica, the two sorbents selected for this study, to yieldm
ooitsacscaFya
CbrtFptgd
aFodt
m/z scan range 175–290) by measuring the peak areas of thextracted molecular ion chromatogram for each analyte and thenternal standard (HP, 25 ng absolute amount injected), at the/z values corresponding to the [M–H]− ions (191 for HP, 205
or OP, 219 for NP, 263 for OPC and 277 for NPC). Smoothhromatograms were obtained by using the Gauss functionwidth = 3 points, cycles = 1). External calibration was carriedut. Correlation between peak areas and homologue concentra-ions (1.25–125 ng absolute amounts) were determined by linearegression and were in the range 0.990–0.992.
.4. Adsorption studies
.4.1. SDS adsorption isotherms in the presence of AP andPC
The influence of AP and APC on the adsorption of SDS on-alumina was investigated. For this purpose, variable amountsf SDS (0–300 mg) and a constant amount of AP/APC (totalmount 0.25 or 7.5 mg; 0.0625 or 1.875 mg of each analyte) weredded to an aqueous suspension of 1 g �-alumina. The pH of theolution was adjusted to 2.0 with nitric acid. The final aqueousolume of the solution was 25 ml. After vigorous stirring of theolution for 5 min, the mixture was centrifuged at 5000 rpm formin and the concentrations of SDS in the supernatants wereetermined by LC/(ESI–IT)–MS in the ESI negative mode. Theobile phase was methanol: water 80:20. Under isocratic con-
itions SDS eluted at 3.2 min. The operational conditions of theSI interface were: capillary voltage 5.0 kV; source tempera-
ure 350 ◦C; drying gas flow 10 l/min; nebulizer gas pressure0 psi; capillary exit and skimmer voltage −100 and −40 V,espectively; trap drive 38; maximal accumulation time, 150 ms,
ixed hemimicelles and admicelles.Fig. 1a and b shows the experimental adsorption isotherms
btained for the adsorption of SDS on alumina at pH 2 and CPCn silica at pH 6, respectively. The knowledge of these isothermss essential for understanding the mechanisms of adsolubiliza-ion of analytes and for method development. The three regionsuitable for SPE (hemimicelles, hemimicelles + admicelles anddmicelles below the critical micelle concentration, cmc) arelearly distinguished in both isotherms. Above the cmc, aqueousurfactant micelles are in equilibrium with admicelles, whichauses partition of analytes between both types of surfactantggregates and prevent this isotherm span to be used for SPE.ig. 1d depicts, as an example, the structure of the aggregatesielded from a positively charged oxide (e.g. alumina) and annionic surfactant (e.g. SDS).
Retention of AP and APC on hemimicelles of both SDS andPC should be primarily governed by hydrophobic interactionsetween hydrocarbon chains. In SDS admicelles, the incorpo-ation of non-ionic analytes should be favored since the elec-rostatic repulsion between the SDS head groups will decrease.ormation of mixed admicelles of AP:CPC will be governed byi-cation and hydrophobic interactions, whereas ionic interac-ions between the carboxylate group of APC and the pyridiniumroup of CPC, in addition to hydrophobic interactions, willetermine the formation of APC:CPC mixed aggregates.
An important factor to consider in this study is the differentmount of surfactant adsorbed on alumina and silica (compareig. 1a and b), which can greatly influence the adsolubilizationf analytes. This difference results from the different chargeensity of the mineral oxide at the working pH. Considering thathe point of zero charge (pzc) for alumina and silica is about 8.5
M. Cantero et al. / J. Chromatogr. A 1120 (2006) 260–267 263
Fig. 1. Experimental adsorption isotherms for: (a) SDS on alumina at pH 2; (b) CPC on silica at pH 6; and (c) SDS on alumina at pH 2 in the presence of 7.5 mg ofAPE metabolites. (d) Typical structure of the surfactant aggregates formed on the surface of mineral oxides.
and 2.9, respectively, the surface of alumina is strongly chargedat pH 2, whereas the surface of silica presents low charge densityat pH 6. High charge density can be achieved for silica at basicpH (e.g. 10) but these pH values are not recommended for theSPE of aqueous environmental samples.
3.2. Sorbent selection
The adsolubilization of APE metabolites on SDS-coated alu-mina and CPC-coated silica as a function of surfactant concen-
tration was investigated at pH 2 and 6, respectively, accordingto the procedure specified in Section 2.4.2. The aim was todetermine the influence of the type (hemimicelles, hemimi-celles + admicelles or admicelles), nature (positively or nega-tively charged surfactant) and amount of the aggregates formedon the oxide surface in order to select the best conditions forextraction of the target compounds. Fig. 2 shows the resultsobtained.
APE metabolites did not absorb at all on the alumina or sil-ica in the absence of SDS or CPC, respectively. The start of

264 M. Cantero et al. / J. Chromatogr. A 1120 (2006) 260–267
Fig. 2. Effect of the amount of (a) SDS at pH 2; and (b) CPC at pH 6 on theadsorption of 1 mg/l of (�) NP; (�) OP; (�) OPC; and (�) NPC.
adsolubilization was detected to about equimolecular amountsof SDS or CPC and the target compounds. At such low sur-factant, concentrations both sorbents behaved similarly and theretention order for analytes agreed with their hydrophobicity(OPC < NPC < OP < NP, log P 4.27, 4.70, 5.02 and 5.45, respec-tively). As an example, the percentages of adsolubilization foundfor OPC, NPC, OP and NP were 21, 25, 34 and 39% at aSDS/total analytes molar ratio of 2. Retentions of APE metabo-lites above 90 and 80% were, respectively, achieved for SDSand CPC/total analytes molar ratios of about 150, which corre-sponded to the hemimicellar region for SDS and the hemimicel-lar + admicellar region for CPC.
Hydrophobic interactions of analytes with SDS hemimicelleswere strong enough to provide quantitative retention of analytesby the formation of surfactant:analyte mixed aggregates. Theformation of admicelles on the alumina surface did not con-tribute to an additional retention of the target compounds andtheir adsolubilization decreased when the amount of admicellesincreased (Fig. 2a). For CPC-silica, the amount of hemimi-celles was not sufficient to achieve quantitative adsolubiliza-tion of analytes, and the additional load of surfactant formingadmicelles, which interact with analytes through hydrophobicand pi-cation interactions, considerably increased their reten-
tion (Fig. 2b). Surfactant concentrations above the cmc causeddecreased adsolubilization (Fig. 2a and b) as a result of the par-tition of analytes between admicelles and aqueous micelles.
According to the above results, both SDS-alumina and CPC-silica could be successfully used for the SPE of APE metabolites.SDS-alumina was selected on the basis that the amount of sur-factant aqueous monomers in equilibrium with the adsorbedsurfactant was about 1000-fold higher in the CPC hemimicel-lar + admicellar region that in the SDS hemimicellar one (com-pare Fig. 1a and b). So, CPC-based SPE needs a continuoussupply of CPC during percolation of the sample in order toensure that the concentration of CPC hemimicelles/admicellesin the mineral oxide remains constant, which decreases the flowrate at which the sample can be percolated.
3.3. Influence of APE metabolites adsolubilization on SDSadsorption
The influence of the formation of SDS:analytes mixed aggre-gates on the adsorption of SDS onto alumina was investigated.For this purpose, SDS adsorption isotherms were constructedin the presence of AP and APC at the levels typically found inwastewaters (e.g. total amount below 400 �g/l) and at concen-trations unusually found in some untreated highly contaminatedwastewaters (e.g. total amount between 3000 and 10,000 �g/l)[1]. The procedure followed is specified in Section 2.4.1. andt
io71spiiec
aolbhua
ccfat
3
u
he total amount of analytes investigated were 0.25 and 7.5 mg.No changes in the adsorption isotherm of SDS were observed
n the presence of 0.25 mg of AP and APC. The isothermbtained in the presence of 7.5 mg of the target analytes (i.e.500 �g/l in samples, considering a sample volume for SPE ofl) is depicted in Fig. 1c. Coadsorption of APE metabolites atuch amount caused different effects on the SDS isotherm (com-are Fig. 1a and c). Thus, the maximal amount of SDS adsorbedn the hemimicellar and admicellar region decreased, and thencorporation of SDS on the alumina occurred at two differ-nt rates in the region where both hemimicelles and admicellesoexisted (e.g. subregions I and II).
In the subregion I, the presence of APE metabolites on thelumina had a negative synergistic effect on the incorporationf SDS, and the slope of the isotherm decreased as the metabo-ites concentration increased. However, adsorption competitionetween analytes and SDS was established for amounts of SDSigh enough (subregion II), and as a result, the amount of adsol-bilized AP and APC in this region decreased (Fig. 2a, for SDSdded between 105 and 210 mg/g alumina).
Both hemimicelles and the subregion I, where some admi-elles have been produced, could be used as sorbents for con-entrating AP and APC (Fig. 2a). Hemimicelles were selectedor the same reasons argued for the selection of SDS-aluminagainst CPC-silica. 20 mg SDS/g alumina was selected for fur-her studies.
.4. Desorption solution
Desorption of AP and APC from the SDS-coated alumina col-mn was studied using different volumes (0.5–5 ml) of MeOH.

M. Cantero et al. / J. Chromatogr. A 1120 (2006) 260–267 265
Table 1Breakthrough study with different volumes of samples and various total amounts of AP and APC
Sample volume (ml) Total amount of analytes (�g) Preconcentration factora Recoveryb (%)
OPC (%) NPC (%) OP (%) NP (%)
100 10 50 95 93 96 97500 50 250 99 98 100 104750 75 375 89 101 95 98
1000 100 500 94 99 97 101
a Elution volume: 2 ml of methanol.b Based on three replicates, range of RSD values 2–4%.
Organic solvents are well known to disrupt hemimicelles andadmicelles thus making easy elution of analytes. Quantitativerecovery of the target compounds was observed from 2 ml ofmethanol, so this volume was recommended for their elution.APE metabolites recoveries using 1 ml of methanol decreasedto about 82, 83, 78 and 70% for OPC, NPC, OP and NP, respec-tively.
3.5. Sample loading
Experiments to determine the sample loading volume werecarried out by passing increasing volumes (0.1–1 l) of an aque-ous solution at pH 2, containing 100 �g/l of APE metabolites,through a SPE cartridge filled with 0.5 g of alumina and 10 mgof SDS. The loading of APE metabolites ranged between 10and 100 �g. Quantitative recovery of analytes was obtained inthe interval investigated (Table 1).
3.6. Analytical performance
Calibration curves were run for each target compound in therange 0.05–5 mg/l under full scan conditions (m/z 195–290).No gain in sensitivity was achieved by reducing the m/z rangeto 10 (termed SIM mode in the operation of the Agilent sys-tem), which is logical considering how an ion trap works[36]. Heptylphenol (HP) was used as internal standard inoi((tsATNwtmwad11rp
treated sewage and river water samples and analyzing the con-tent of the target compounds. The relative standard deviationranged from 3 to 6% for analytes concentration between 30 and50 �g/l and from 6 to 16% for concentrations varying between5 and 15 �g/l.
It is known that matrix components coeluting with analytescan cause ion suppression or space-charge effects on the ion trap.The possible effect of matrix components on APE metabolitesdetermination was evaluated by comparison of the calibrationcurves obtained from standards and those obtained from wastew-ater influent and effluent and river water samples, fortified withknown amounts of the target compounds. Matrix componentsdid not interfere in the recovery of target analytes or massquantitation, so, external calibration is recommended for deter-mination of APE metabolites in sewage/river waters. However,it is advisable to check for matrix effects when the compositionof samples is expected to be very different from those analyzedhere.
Table 2Concentrations ((g/l) ± standard deviationa and recoveries (%) of target analytesfound in wastewater influent and effluent samples and river water samples
Sample location OPC NPC OP NP
WWTP influentb
Linares 3.8 ± 0.2 23 ± 2 6 ± 1 78 ± 5
W
R
Sample volume: 500 ml.
rder to remove the between-day fluctuations in the sensitiv-ty of the detector. The slope of the calibration curves were4.95 ± 0.04)10−2, (8.05 ± 0.06)10−2, (11.27 ± 0.03)10−2 and10.55 ± 0.07)10−2 ng−1 for OPC, NPC, OP and NP, respec-ively. Instrumental detection limits were calculated by using aignal-to-noise of 3 (the ratio between the peak area for eachPE metabolite and internal standard and peak area of noise).hey were estimated to be 0.1, 0.07, 0.08 and 0.03 ng for OPC,PC, OP and NP, respectively. The practical detection limits [37]ere also estimated from six independent complete determina-
ions of analyte concentrations. Since no typical matrix low-levelaterial could be obtained, an estimate of the background signalas made at a representative part of the readout, adjacent to the
nalyte signal, in the analyte-containing sample. The practicaletection limits for OPC, NPC, OP and NP were, respectively,37, 234, 144, and 193 ng/l for raw sewage, 117, 165, 105 and08 ng/l for sewage effluent and 99, 147, 75 and 101 ng/l foriver water. The overall performance of the method in terms ofrecision was evaluated by extracting six consecutive raw and
Andujar 5.3 ± 0.4 18 ± 3 14 ± 2 25 ± 4Mengibar 2.1 ± 0.2 42 ± 3 16 ± 3 54 ± 8Bailen 3.4 ± 0.3 38 ± 4 13 ± 1 38 ± 4Spiked Linares sample
(50 �g/l)c95 95 100 97
WTP effluentd
Linares 15 ± 2 43 ± 5 4.1 ± 0.6 41 ± 6Andujar 10 ± 3 41 ± 5 8 ± 1 23 ± 4Mengibar 8.6 ± 0.4 47 ± 4 8.3 ± 0.4 24 ± 5Bailen 11 ± 2 49 ± 4 8 ± 1 20 ± 4Spiked Linares
(20 �g/l)c97 93 96 99
iver watere
Guadalquivir 7 ± 1 4 ± 1 9 ± 1 1.1 ± 0.2Guadiana <LOD 1.8 ± 0.4 0.8 ± 0.1 0.9 ± 0.3Spiked Guadalquivir
sample (10 �g/l)c90 87 95 93
a Based on three replicates.b Sample volume:100 ml.c (n = 4), range of RSD values 2–5%; <LOD: lower than the detection limit.d Sample volume: 200 ml.e
266 M. Cantero et al. / J. Chromatogr. A 1120 (2006) 260–267
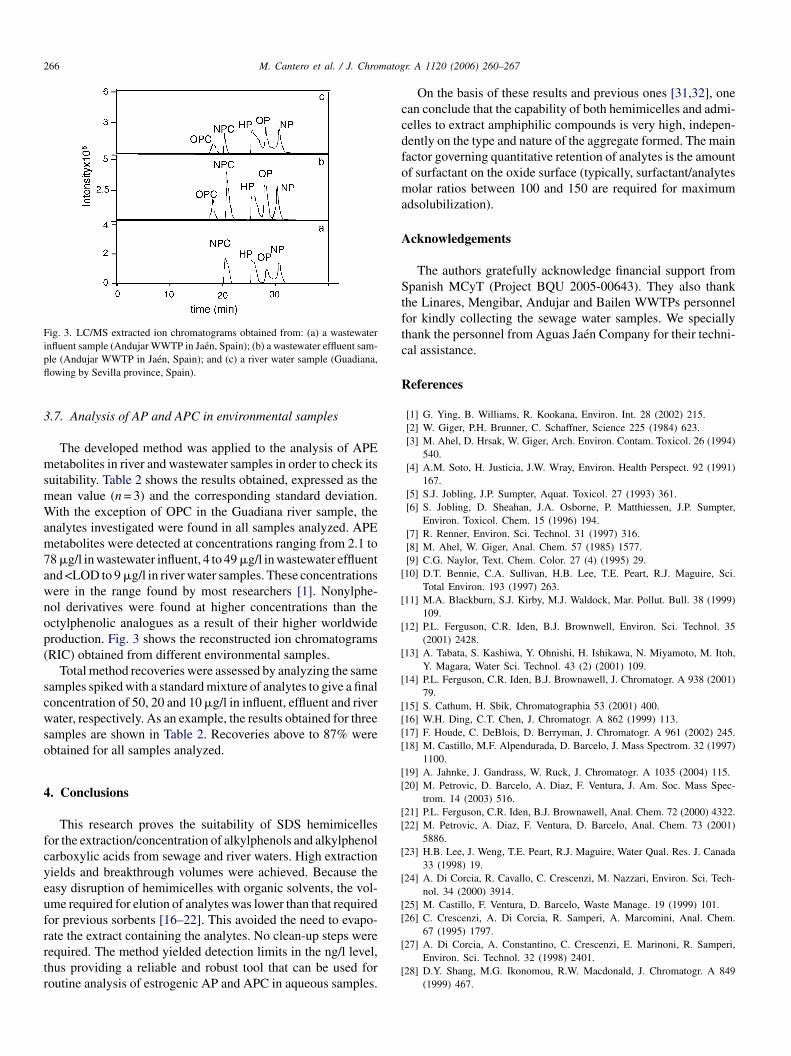
Fig. 3. LC/MS extracted ion chromatograms obtained from: (a) a wastewaterinfluent sample (Andujar WWTP in Jaen, Spain); (b) a wastewater effluent sam-ple (Andujar WWTP in Jaen, Spain); and (c) a river water sample (Guadiana,flowing by Sevilla province, Spain).
3.7. Analysis of AP and APC in environmental samples
The developed method was applied to the analysis of APEmetabolites in river and wastewater samples in order to check itssuitability. Table 2 shows the results obtained, expressed as themean value (n = 3) and the corresponding standard deviation.With the exception of OPC in the Guadiana river sample, theanalytes investigated were found in all samples analyzed. APEmetabolites were detected at concentrations ranging from 2.1 to78 �g/l in wastewater influent, 4 to 49 �g/l in wastewater effluentand <LOD to 9 �g/l in river water samples. These concentrationswere in the range found by most researchers [1]. Nonylphe-nol derivatives were found at higher concentrations than theoctylphenolic analogues as a result of their higher worldwideproduction. Fig. 3 shows the reconstructed ion chromatograms(RIC) obtained from different environmental samples.
Total method recoveries were assessed by analyzing the samesamples spiked with a standard mixture of analytes to give a finalconcentration of 50, 20 and 10 �g/l in influent, effluent and riverwater, respectively. As an example, the results obtained for threesamples are shown in Table 2. Recoveries above to 87% wereobtained for all samples analyzed.
4. Conclusions
fcyeufrrtr
On the basis of these results and previous ones [31,32], onecan conclude that the capability of both hemimicelles and admi-celles to extract amphiphilic compounds is very high, indepen-dently on the type and nature of the aggregate formed. The mainfactor governing quantitative retention of analytes is the amountof surfactant on the oxide surface (typically, surfactant/analytesmolar ratios between 100 and 150 are required for maximumadsolubilization).
Acknowledgements
The authors gratefully acknowledge financial support fromSpanish MCyT (Project BQU 2005-00643). They also thankthe Linares, Mengibar, Andujar and Bailen WWTPs personnelfor kindly collecting the sewage water samples. We speciallythank the personnel from Aguas Jaen Company for their techni-cal assistance.
References
[1] G. Ying, B. Williams, R. Kookana, Environ. Int. 28 (2002) 215.[2] W. Giger, P.H. Brunner, C. Schaffner, Science 225 (1984) 623.[3] M. Ahel, D. Hrsak, W. Giger, Arch. Environ. Contam. Toxicol. 26 (1994)
540.[4] A.M. Soto, H. Justicia, J.W. Wray, Environ. Health Perspect. 92 (1991)
167.
[
[
[
[
[
[[[[
[[
[[
[
[
[[
[
[
This research proves the suitability of SDS hemimicellesor the extraction/concentration of alkylphenols and alkylphenolarboxylic acids from sewage and river waters. High extractionields and breakthrough volumes were achieved. Because theasy disruption of hemimicelles with organic solvents, the vol-me required for elution of analytes was lower than that requiredor previous sorbents [16–22]. This avoided the need to evapo-ate the extract containing the analytes. No clean-up steps wereequired. The method yielded detection limits in the ng/l level,hus providing a reliable and robust tool that can be used foroutine analysis of estrogenic AP and APC in aqueous samples.
[5] S.J. Jobling, J.P. Sumpter, Aquat. Toxicol. 27 (1993) 361.[6] S. Jobling, D. Sheahan, J.A. Osborne, P. Matthiessen, J.P. Sumpter,
Environ. Toxicol. Chem. 15 (1996) 194.[7] R. Renner, Environ. Sci. Technol. 31 (1997) 316.[8] M. Ahel, W. Giger, Anal. Chem. 57 (1985) 1577.[9] C.G. Naylor, Text. Chem. Color. 27 (4) (1995) 29.10] D.T. Bennie, C.A. Sullivan, H.B. Lee, T.E. Peart, R.J. Maguire, Sci.
Total Environ. 193 (1997) 263.11] M.A. Blackburn, S.J. Kirby, M.J. Waldock, Mar. Pollut. Bull. 38 (1999)
109.12] P.L. Ferguson, C.R. Iden, B.J. Brownwell, Environ. Sci. Technol. 35
(2001) 2428.13] A. Tabata, S. Kashiwa, Y. Ohnishi, H. Ishikawa, N. Miyamoto, M. Itoh,
Y. Magara, Water Sci. Technol. 43 (2) (2001) 109.14] P.L. Ferguson, C.R. Iden, B.J. Brownawell, J. Chromatogr. A 938 (2001)
79.15] S. Cathum, H. Sbik, Chromatographia 53 (2001) 400.16] W.H. Ding, C.T. Chen, J. Chromatogr. A 862 (1999) 113.17] F. Houde, C. DeBlois, D. Berryman, J. Chromatogr. A 961 (2002) 245.18] M. Castillo, M.F. Alpendurada, D. Barcelo, J. Mass Spectrom. 32 (1997)
1100.19] A. Jahnke, J. Gandrass, W. Ruck, J. Chromatogr. A 1035 (2004) 115.20] M. Petrovic, D. Barcelo, A. Diaz, F. Ventura, J. Am. Soc. Mass Spec-
trom. 14 (2003) 516.21] P.L. Ferguson, C.R. Iden, B.J. Brownawell, Anal. Chem. 72 (2000) 4322.22] M. Petrovic, A. Diaz, F. Ventura, D. Barcelo, Anal. Chem. 73 (2001)
5886.23] H.B. Lee, J. Weng, T.E. Peart, R.J. Maguire, Water Qual. Res. J. Canada
33 (1998) 19.24] A. Di Corcia, R. Cavallo, C. Crescenzi, M. Nazzari, Environ. Sci. Tech-
nol. 34 (2000) 3914.25] M. Castillo, F. Ventura, D. Barcelo, Waste Manage. 19 (1999) 101.26] C. Crescenzi, A. Di Corcia, R. Samperi, A. Marcomini, Anal. Chem.
67 (1995) 1797.27] A. Di Corcia, A. Constantino, C. Crescenzi, E. Marinoni, R. Samperi,
Environ. Sci. Technol. 32 (1998) 2401.28] D.Y. Shang, M.G. Ikonomou, R.W. Macdonald, J. Chromatogr. A 849
(1999) 467.

M. Cantero et al. / J. Chromatogr. A 1120 (2006) 260–267 267
[29] T. Saitoh, Y. Nakayama, M. Hiralde, J. Chromatogr. A 972 (2002) 205.[30] F. Merino, S. Rubio, D. Perez-Bendito, Anal. Chem. 76 (2004) 3878.[31] F. Merino, S. Rubio, D. Perez-Bendito, Anal. Chem. 75 (2003) 6799.[32] M. Cantero, S. Rubio, D. Perez-Bendito, J. Chromatogr. A 1067 (2005)
161.[33] J.H. O’Haver, J.H. Harwell, L.L. Loaban, E.A. O’Rear, in: S.D. Chris-
tian, J.F. Scamehorn (Eds.), Solubilization in Surfactant Aggregates,Dekker, New York, 1995 (Chapter 8).
[34] K.T. Valsaraj, Sep. Sci. Technol. 27 (1992) 1633.[35] R. Atkin, V.S.J. Craig, E.J. Wanless, S. Biggs, Adv. Colloid Interface
Sci. 103 (2003) 219.[36] N.A. Yates, M.M. Booth, J.L. Stephenson, R.A. Yost, in: E.M. Raymon,
J.F.J. Todd (Eds.), Practical Aspects of Ion Trap Mass Spectrometry,CRC Press, New York, 1995 (Chapter 4).
[37] M. Thompson, S.L.R. Ellison, R. Wood, Pure Appl. Chem. 74 (2002)835.

![Determination of Alkylphenols and Alkylphenol Mono- and ... › cs › library › applications › 5989-1152EN.pdfextracted using methanol (Mathijs, et al., 1987) [13]. In order to](https://img.pdfslide.us/doc/110x75/60db829dc32116100e5361fc/determination-of-alkylphenols-and-alkylphenol-mono-and-a-cs-a-library-a.jpg)


![Synthesis and Ring-opening of NH-aziridine-2-carboxylates ......1 Synthesis and Ring-opening of NH-aziridine-2-carboxylates, and Preparation of Novel Pyrazolo[3,4-d]pyrimidines for](https://img.pdfslide.us/doc/110x75/60f7f4bfb3da1879890b4ff1/synthesis-and-ring-opening-of-nh-aziridine-2-carboxylates-1-synthesis-and.jpg)