Embed Size (px)
Citation preview
Determination of Additives in Polymers
and Rubbers
Roy Crompton
Rapra Technology
Shawbury, Shrewsbury, Shropshire, SY4 4NR, United KingdomTelephone: +44 (0)1939 250383 Fax: +44 (0)1939 251118
http://www.rapra.net
First Published in 2007 by
Rapra Technology Shawbury, Shrewsbury, Shropshire, SY4 4NR, UK
©2007, Rapra Technology
All rights reserved. Except as permitted under current legislation no partof this publication may be photocopied, reproduced or distributed in anyform or by any means or stored in a database or retrieval system, without
the prior permission from the copyright holder.
A catalogue record for this book is available from the British Library.
Every effort has been made to contact copyright holders of any material reproduced within the text and the authors and publishers apologise if any have been overlooked.
Typeset, printed and bound by Rapra TechnologyCover printed by Livesey Ltd, Shropshire, UK
ISBN: 978-1-84735-000-8
iii
Contents
Contents
Preface .................................................................................................................. xi
1 Direct Determination of Additives in Polymers and Rubbers .......................... 1
1.1 Infrared Spectroscopic Methods ............................................................. 2
1.2 Ultraviolet Spectroscopy ....................................................................... 11
1.3 Raman Spectroscopy ............................................................................ 16
1.4 Mass Spectrometry ............................................................................... 17
1.5 X-ray Photoelectron Spectroscopy (XPS) .............................................. 49
1.6 Thermal Methods of Analysis ............................................................... 49
1.6.1 Differential Scanning Calorimetry ............................................ 49
1.6.2 Differential Thermal Analysis ................................................... 54
1.6.3 Thermogravimetric Analyses .................................................... 58
1.7 Vapour Phase Ultraviolet Spectroscopy ................................................ 58
1.8 X-Ray Fluorescence Analysis ................................................................ 58
1.9 Nuclear Magnetic Resonance Spectroscopy ......................................... 58
References ..................................................................................................... 61
2 Extraction Techniques for Additives in Polymers .......................................... 69
2.1 Introduction ......................................................................................... 69
2.2 Solvent Extraction ................................................................................ 71
2.2.1 Polyolefi ns ................................................................................ 71
2.2.2 Polystyrene ............................................................................... 75
2.2.3 Acrylic Polymers ....................................................................... 76
2.2.4 PVC ......................................................................................... 76
Determination of Additives in Polymers and Rubbers
iv
2.2.5 Rubbers .................................................................................... 82
2.2.6 Polyacrylamide ......................................................................... 82
2.2.7 Polyurethane ............................................................................ 82
2.2.8 Vinyl Chloride, Butadiene, Acrylonitrile, Styrene, 2 Ethylhexyl Acrylate Copolymers ........................................... 82
2.2.9 Other Polymers ........................................................................ 83
2.3 Fractional Precipitation ........................................................................ 83
2.4 Fractional Extraction ............................................................................ 84
2.5 Separation by Diffusion Methods ......................................................... 85
2.6 Dialysis or Electrodialysis ..................................................................... 85
2.7 Vacuum Thermal Displacement Extraction Method ............................. 85
2.7.1 Effects of Polymer Milling on Extraction .................................. 87
2.8 Solvent Extraction – Infrared Spectrometry .......................................... 90
2.9 Solvent Extraction – Ultraviolet Spectroscopy ...................................... 96
2.9.1 Ionol in Polyolefi ns ................................................................... 96
2.9.2 Santonox R In Polyolefi ns ........................................................ 96
2.9.3 Styrene Monomer ................................................................... 101
2.10 Solvent Extraction – Visible Spectroscopy .......................................... 104
2.10.1 Phenol Antioxidants ............................................................... 104
2.10.2 Amine Antioxidants ............................................................... 107
2.10.3 Tris Nonyl (Phenylated Phenyl) Phosphite .............................. 109
2.11 Solvent Extraction Spectrofl uorimetry ................................................ 110
2.11.1 Perkin-Elmer LS-2B Microfi lter Fluorimeter ........................... 110
2.11.2 Antioxidants ........................................................................... 111
2.12 Solvent Extraction – Mass Spectrometry ............................................ 114
2.12.1 Ultraviolet Absorbers ............................................................. 115
2.13 Solvent Extracts – Electrochemical Methods ...................................... 116
2.13.1 Acrylamide ............................................................................. 116
v
Contents
2.13.2 Antioxidants ........................................................................... 117
2.13.3 Organic Peroxides .................................................................. 118
2.13.4 Acrylonitrile ........................................................................... 124
2.13.5 Determination of Styrene ........................................................ 126
2.13.6 Determination of Acrylonitrile ............................................... 126
2.13.7 Organometallic Stabilisers ...................................................... 126
2.14 Chronopotentiometry ......................................................................... 127
2.15 Anodic Voltammetry .......................................................................... 129
2.16 Solvent Extraction – Nuclear Magnetic Resonance Spectroscopy (NMR) .......................................................................... 130
References ................................................................................................... 131
3 Liquid Chromatography ............................................................................. 139
3.1 Introduction ....................................................................................... 139
3.1.1 The Isocratic System ............................................................... 145
3.1.2 Basic Gradient System ............................................................ 146
3.1.3 Advanced Gradient System ..................................................... 146
3.1.4 The Inert System ..................................................................... 146
3.2 Chromatographic Detectors ............................................................... 147
3.2.1 Post-Column Derivatisation - Fluorescence Detectors ............. 147
3.2.2 Diode Array Detectors ............................................................ 150
3.2.3 Electrochemical Detectors ...................................................... 150
3.3 Antioxidants ....................................................................................... 151
3.3.1 Instrumentation ...................................................................... 152
3.3.2 Applications ........................................................................... 153
3.4 Oligomers ........................................................................................... 154
3.5 Acrylic Acid Monomer ....................................................................... 156
3.6 Acrylamide Monomer ........................................................................ 157
3.7 Amines ............................................................................................... 157
Determination of Additives in Polymers and Rubbers
vi
3.8 Plasticisers .......................................................................................... 157
3.9 Additive Mixtures .............................................................................. 158
3.10 High Performance Liquid Chromatography – Infrared Spectroscopy .. 158
3.11 Gel Permeation Chromatography ....................................................... 159
References ................................................................................................... 160
4 Gas Chromatography ................................................................................. 165
4.1 Antioxidants ....................................................................................... 165
4.1.1 Secondary Antioxidants .......................................................... 172
4.2 Volatile Compounds ........................................................................... 175
4.3 Monomers .......................................................................................... 179
4.4 Oligomers ........................................................................................... 183
4.5 Hindered Amine Light Stabilisers (HALS) .......................................... 184
4.6 Plasticisers .......................................................................................... 185
4.7 Organic Peroxides .............................................................................. 197
4.8 Rubber Antidegradants ...................................................................... 199
4.9 Miscellaneous Polymer Additives ....................................................... 199
4.10 Identifi cation of Additives by a Combination of GC and Infrared Spectroscopy ......................................................................... 201
4.11 Identifi cation of Additives by a Combination of GC and Mass Spectrometry ............................................................................. 213
4.12 Pyrolysis GC ....................................................................................... 215
References ................................................................................................... 216
5 Thin-Layer Chromatography ...................................................................... 225
5.1 Experimental ...................................................................................... 228
5.1.1 Preparation of Thin-layer Plates for Analysis .......................... 228
5.1.2 Application of Polymer Extract to Plate ................................. 229
vii
Contents
5.1.3 Selection of Chromatographic Solvent .................................... 230
5.1.4 Detection of Separated Compounds on the Plate .................... 232
5.1.5 Evaluation of Developed Plates .............................................. 236
5.1.6 Spectroscopic Methods ........................................................... 236
5.1.7 Optical Densiometric Analysis ................................................ 238
5.1.8 Methods Based on Spot Size ................................................... 239
5.2 Antioxidants ....................................................................................... 243
5.2.1 Determination of Santonox R ................................................. 243
5.3 Ultraviolet Stabilisers .......................................................................... 248
5.4 Plasticisers .......................................................................................... 249
5.5 Organotin Stabilisers .......................................................................... 252
5.6 Epoxy and Other Heat Stabilisers ....................................................... 254
5.7 Optical Whiteners .............................................................................. 256
5.8 Amine and Phenolic Antioxidants and Antidegradants, Guanidines and Accelerators in Rubber .............................................. 258
5.9 Miscellaneous Additives ..................................................................... 259
5.10 Combination of Thin-Layer Chromatography with Infrared Spectroscopy ......................................................................... 262
5.10.1 Premigration of Plates ............................................................ 263
5.10.2 Removal of Separated Compounds from the Plate .................. 265
5.10.3 Extraction of Pure Polymer Additives from Separated Adsorbent Bands .................................................................... 266
5.10.4 Preparation of Infrared Spectra Separated Additives ............... 268
5.10.5 Preparation of UV Spectra of Separated Additives .................. 274
References ................................................................................................... 275
6 Paper Chromatography .............................................................................. 283
References ................................................................................................... 287
7 Supercritical Fluid Chromatography ........................................................... 289
Determination of Additives in Polymers and Rubbers
viii
7.1 Antioxidants ....................................................................................... 291
7.2 Oligomers ........................................................................................... 298
7.3 Supercritical Fluid Chromatography-Mass Spectrometry (SFC-MS) ... 300
References ................................................................................................... 300
8 Headspace Analysis - Volatiles .................................................................... 305
8.1 Volatiles ............................................................................................. 305
8.2 Monomers .......................................................................................... 313
8.3 Oligomers ........................................................................................... 314
8.4 Miscellaneous ..................................................................................... 314
References ................................................................................................... 314
9 Thermal Methods ....................................................................................... 317
9.1 Pyrolysis-Gas Chromatography-Mass Spectrometry ........................... 317
9.2 Evolved Gas Analysis ......................................................................... 320
References ................................................................................................... 330
10 Determination of Water .............................................................................. 333
References ................................................................................................... 335
11 Determination of Metals ............................................................................. 337
11.1 Destructive Techniques ....................................................................... 337
11.1.1 Atomic Absorption Spectrometry ........................................... 337
11.1.2 Graphite Furnace Atomic Absorption Spectrometry ............... 343
11.1.3 Atom Trapping Technique ...................................................... 345
11.1.4 Vapour Generation Atomic Absorption Spectrometry ............ 345
11.1.5 Zeeman Atomic Absorption Spectrometry .............................. 346
11.1.6 Inductively Coupled Plasma Atomic Emission Spectrometry .......................................................................... 350
11.1.7 Hybrid Inductively Coupled Plasma Techniques ..................... 353
ix
Contents
11.1.8 Inductively Coupled Plasma Optical Emission Spectrometry-Mass Spectrometry ........................................... 355
11.1.9 Pre-concentration Atomic Absorption Spectrometry Techniques ............................................................................. 357
11.1.10 Microprocessors .................................................................... 358
11.1.11 Autosamplers ........................................................................ 358
11.1.12 Applications: Atomic Absorption Spectrometric Determination of Metals ........................................................ 359
11.1.13 Visible and UV Spectroscopy ................................................. 366
11.1.14 Polarography and Voltammetry ............................................. 366
11.2 Non-destructive Methods ................................................................... 375
11.2.1 X-ray Fluorescence Spectrometry ........................................... 375
11.2.2 Neutron Activation Analysis .................................................. 381
11.2.3 Metal Stearate Stabilisers ........................................................ 384
References ................................................................................................... 385
12 Non-metallic Elements ................................................................................ 391
12.1 Instrumentation .................................................................................. 392
12.1.1 Furnace Combustion Methods ............................................... 392
12.1.2 Oxygen Flask Combustion Methods ...................................... 396
12.2 Acid Digestions of Polymers ............................................................... 398
12.2.1 Chlorine ................................................................................. 398
12.2.2 Nitrogen ................................................................................. 401
12.2.3 Phosphorus ............................................................................ 401
12.2.4 Silica ...................................................................................... 401
12.3 X-ray Fluorescence Spectroscopy ........................................................ 402
12.4 Antec 9000 Nitrogen/Sulfur Analyser ................................................. 403
References ................................................................................................... 403
Appendix 1 ....................................................................................................... 407

Determination of Additives in Polymers and Rubbers
x
Abbreviations .....................................................................................................423
Index .................................................................................................................429
xi
Preface
Preface
This book is designed as a practical text for use in the laboratories of the plastic producer and user industries and by others such as universities and other institutions who are concerned with problems associated with additives and adventitious impurities in polymers, their breakdown mechanisms and their analysis.
It is now about 30 years since the author wrote his fi rst book on this subject and much has happened in the fi eld since then.
For example powerful new analytical tools have been made available to the chemist by a combination of various chromatographic techniques with methods of identifying separated additives and their degradation products by techniques based on infrared and mass spectrometry. In particular supercritical fl uid chromatography combined with mass spectrometry has come to the fore. Combinations of polymer pyrolysis with gas chromatography with mass spectrometric identifi cation of the pyrolysis products is throwing new light on what happens to antioxidants and other polymer additives during polymer processing and products life. Similarly evolved gas analysis and thermogravimetry and dynamic scanning calorimetry are proving very useful in studies of antioxidant loss during polymer processing and service life.
The book is an up-to-date coverage of the present state of knowledge on the subject of polymer additive systems and as such should be extremely useful to workers in the fi eld.
T Roy CromptonMarch 2007

xii
Determination of Additives in Polymers and Rubbers
1
Direct Determination of Additives in Polymers and Rubbers
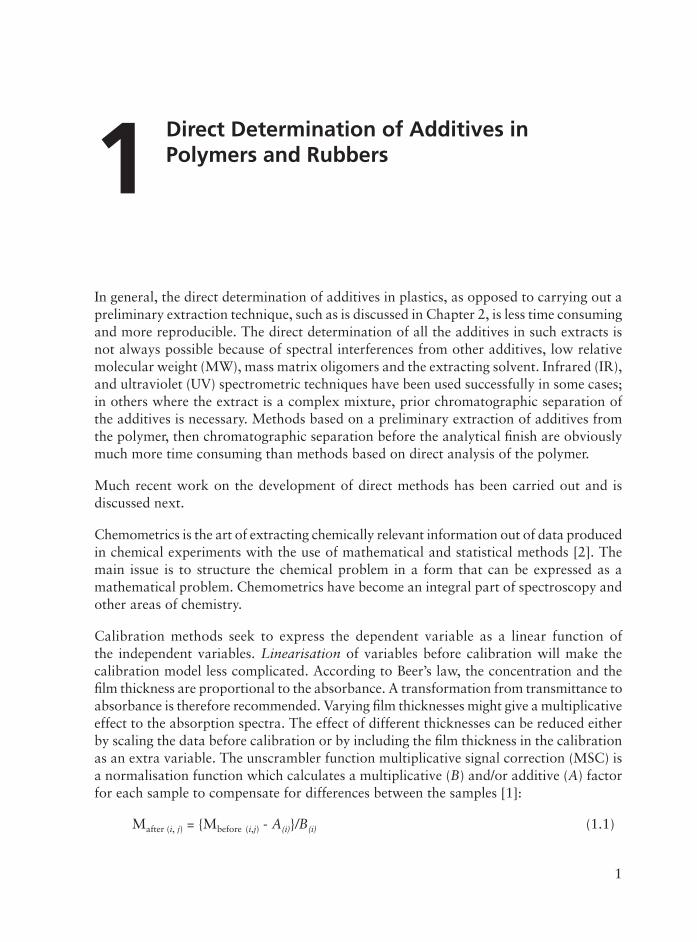
In general, the direct determination of additives in plastics, as opposed to carrying out a preliminary extraction technique, such as is discussed in Chapter 2, is less time consuming and more reproducible. The direct determination of all the additives in such extracts is not always possible because of spectral interferences from other additives, low relative molecular weight (MW), mass matrix oligomers and the extracting solvent. Infrared (IR), and ultraviolet (UV) spectrometric techniques have been used successfully in some cases; in others where the extract is a complex mixture, prior chromatographic separation of the additives is necessary. Methods based on a preliminary extraction of additives from the polymer, then chromatographic separation before the analytical fi nish are obviously much more time consuming than methods based on direct analysis of the polymer.
Much recent work on the development of direct methods has been carried out and is discussed next.
Chemometrics is the art of extracting chemically relevant information out of data produced in chemical experiments with the use of mathematical and statistical methods [2]. The main issue is to structure the chemical problem in a form that can be expressed as a mathematical problem. Chemometrics have become an integral part of spectroscopy and other areas of chemistry.
Calibration methods seek to express the dependent variable as a linear function of the independent variables. Linearisation of variables before calibration will make the calibration model less complicated. According to Beer’s law, the concentration and the fi lm thickness are proportional to the absorbance. A transformation from transmittance to absorbance is therefore recommended. Varying fi lm thicknesses might give a multiplicative effect to the absorption spectra. The effect of different thicknesses can be reduced either by scaling the data before calibration or by including the fi lm thickness in the calibration as an extra variable. The unscrambler function multiplicative signal correction (MSC) is a normalisation function which calculates a multiplicative (B) and/or additive (A) factorfor each sample to compensate for differences between the samples [1]:
Mafter (i, j) = {Mbefore (i,j) - A(i)}/B(i) (1.1)
Direct Determination of Additives in Polymers and Rubbers
Author1
2
Determination of Additives in Polymers and Rubbers
where M(i,j) is the absorbance for sample i at wavenumber j before and after scaling. The scaling factors for each sample are calculated from the spectra in regions where spectra based on different concentrations of additives are believed to be approximately equal.
Principal component analysis (PCA) is a statistical technique which, over the last decade, has become a regular tool for analysing chemical data [3-6]. If there is a relationship among any samples in a data set, the PCA will separate the samples into groups.
Partial least squares (PLS) regression is often used for multivariate calibration [7-9]. PLS differs from other regression methods by using the dependent variable (concentrations) actively during the decomposition of the spectra. By balancing the information in the spectra and the related concentrations, the method reduces the impact of large, but irrelevant, variations in the spectra. For each variable, the calibration gives a linear regression equation of the form:
[concs] = B0 + B1 A( 1) + B2 A( 2)
+ ... + Bn A( n) (1.2)
where A( n) is the absorbance at wavenumber n, where n may represent a single wavenumber or an average.
To discuss the prediction error, one must validate the calibration model [2]. There are two sorts of validation. One method is based on a new set of objects (external prediction). It requires a large and representative set of objects which have to be kept apart from the calibration for testing purposes only. The other validation method is based on the calibration data themselves (internal validation). In most cases, internal validation methods such as cross-validation and leverage correction [2] give sensible results with valuable information about the prediction ability. Cross-validation seeks to validate the calibration model with independent test data, but contrary to external validation it does not use data for testing only. The cross-validation is performed a number of times, each time with the use of only a few calibration samples as a test set. From the validation set it is possible to compare the prediction ability for the models, expressed by the estimated prediction mean square error.
1.1 Infrared Spectroscopic Methods
Vigerust and co-workers [1] used multivariate calibration methods to establish a new method for measurement of three additives in low-density polyethylene (LDPE). The determination of the concentrations of silica, erucamide and butylated hydroxyl toluene (BHT) is based on infrared spectroscopy and a calibration model compared to traditional methods - this method is both time- and cost-effective and is more precise.
3
Direct Determination of Additives in Polymers and Rubbers
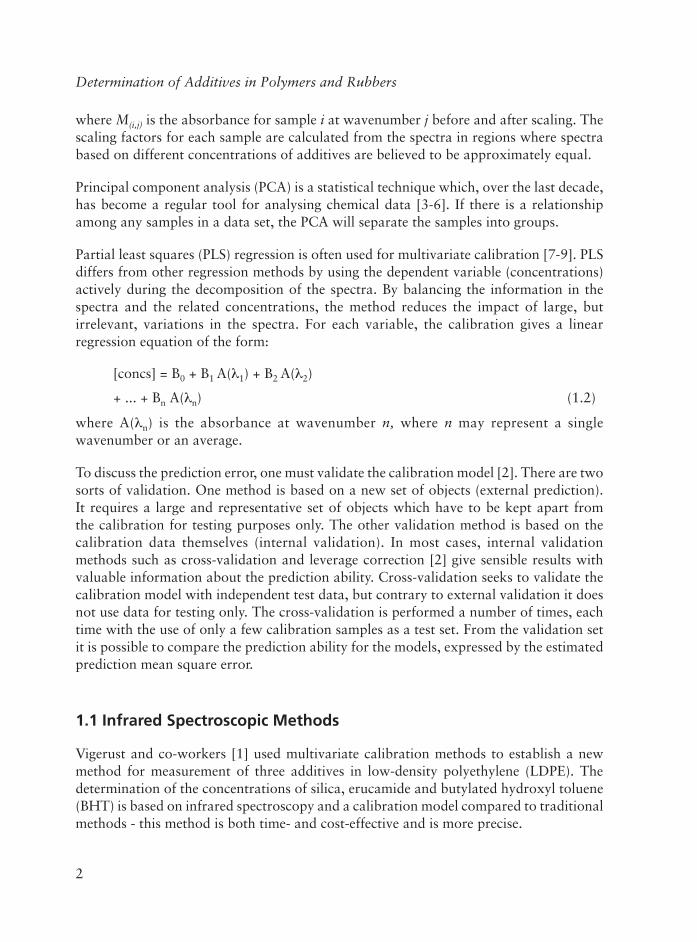
A Perkin Elmer FTIR model 1710 was used to record spectra in the region 4000-400 cm-1.As shown in Figures 1.1-1.3, silica has intense broad bands in the region 650 to 450 and 1500 to 750 cm-1 with little interference or overlap from the polymer itself. BHT, which
Figure 1.1 Absorbance infrared spectra of pure polymer (A) and polymer 10,000 wt/ppm silica content (B)
Reproduced with permission from B. Vigerust, K. Kolset, S. Nordenson, A. Henricsen and K. Kleveland, Applied Spectroscopy, 45, 173. ©1991, Society for Applied Spectroscopy, MD, USA [1],
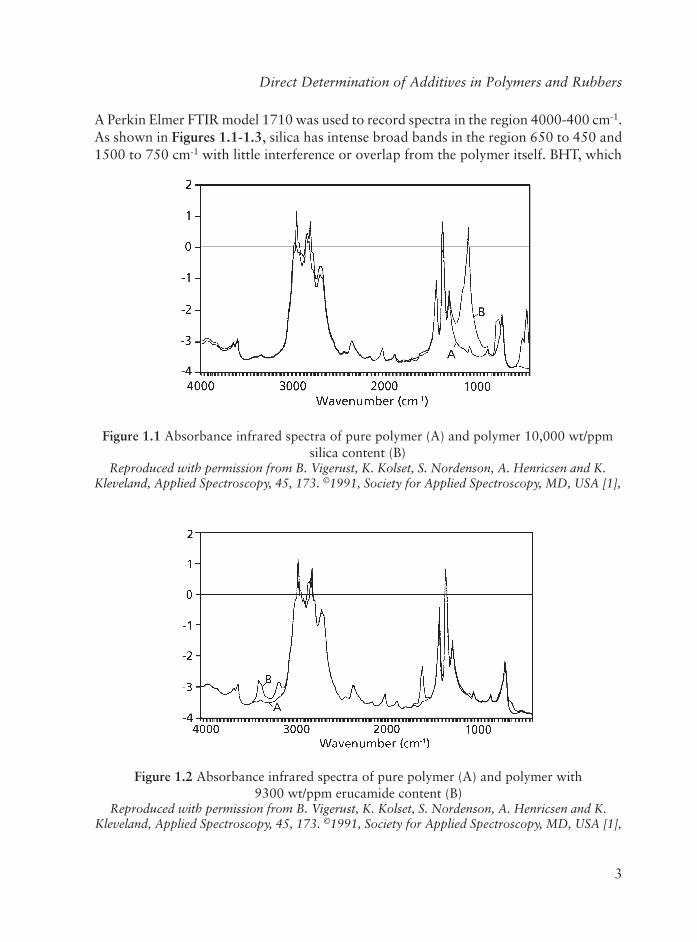
Figure 1.2 Absorbance infrared spectra of pure polymer (A) and polymer with 9300 wt/ppm erucamide content (B)
Reproduced with permission from B. Vigerust, K. Kolset, S. Nordenson, A. Henricsen and K. Kleveland, Applied Spectroscopy, 45, 173. ©1991, Society for Applied Spectroscopy, MD, USA [1],
4
Determination of Additives in Polymers and Rubbers
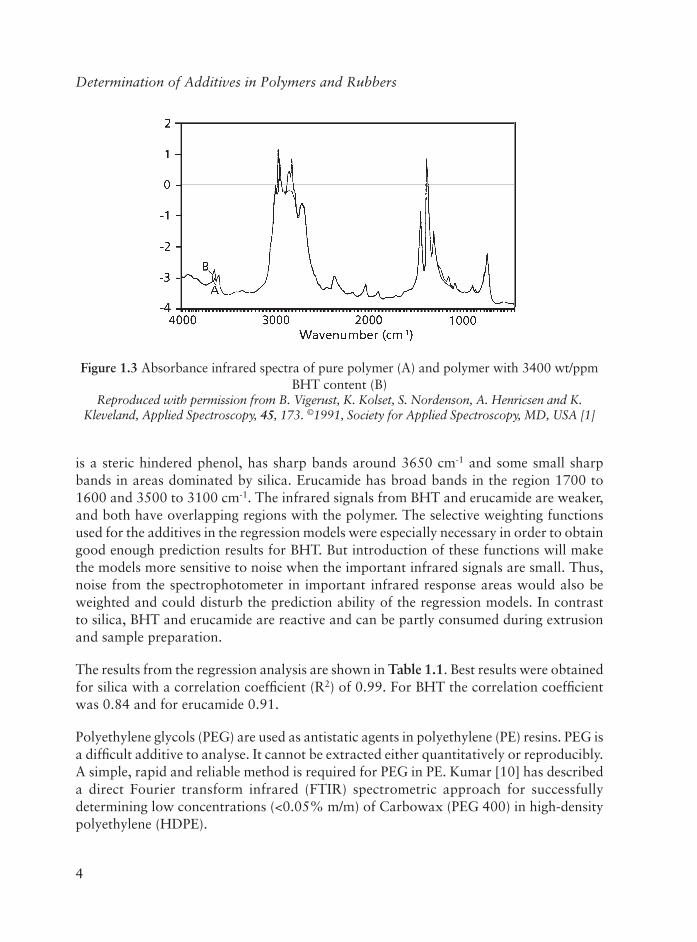
is a steric hindered phenol, has sharp bands around 3650 cm-1 and some small sharp bands in areas dominated by silica. Erucamide has broad bands in the region 1700 to 1600 and 3500 to 3100 cm-1. The infrared signals from BHT and erucamide are weaker, and both have overlapping regions with the polymer. The selective weighting functions used for the additives in the regression models were especially necessary in order to obtain good enough prediction results for BHT. But introduction of these functions will make the models more sensitive to noise when the important infrared signals are small. Thus, noise from the spectrophotometer in important infrared response areas would also be weighted and could disturb the prediction ability of the regression models. In contrast to silica, BHT and erucamide are reactive and can be partly consumed during extrusion and sample preparation.
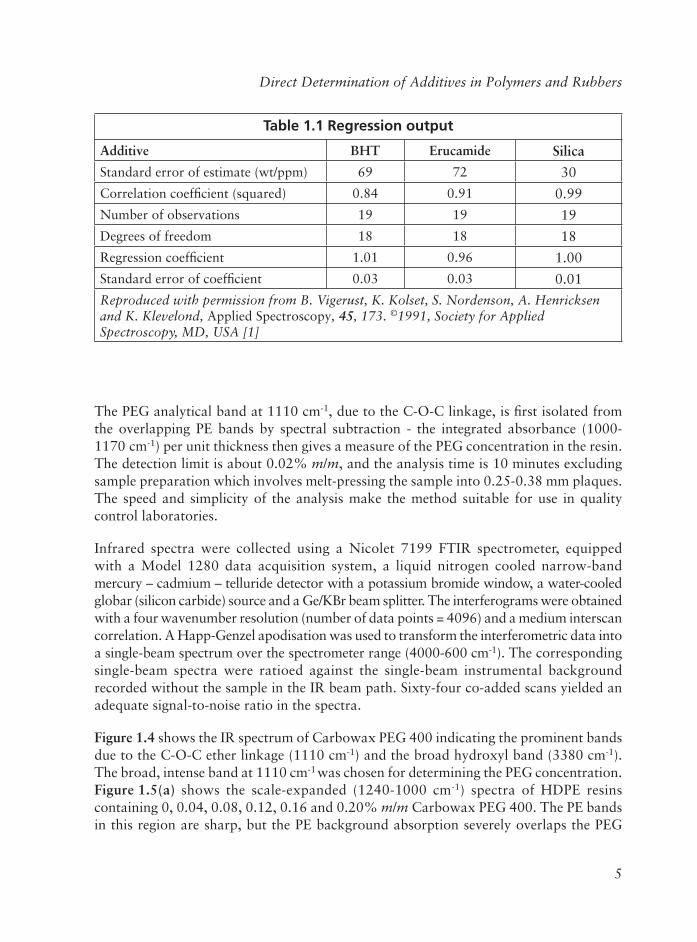
The results from the regression analysis are shown in Table 1.1. Best results were obtained for silica with a correlation coeffi cient (R2) of 0.99. For BHT the correlation coeffi cient was 0.84 and for erucamide 0.91.
Polyethylene glycols (PEG) are used as antistatic agents in polyethylene (PE) resins. PEG is a diffi cult additive to analyse. It cannot be extracted either quantitatively or reproducibly. A simple, rapid and reliable method is required for PEG in PE. Kumar [10] has described a direct Fourier transform infrared (FTIR) spectrometric approach for successfully determining low concentrations (<0.05% m/m) of Carbowax (PEG 400) in high-density polyethylene (HDPE).
Figure 1.3 Absorbance infrared spectra of pure polymer (A) and polymer with 3400 wt/ppm BHT content (B)
Reproduced with permission from B. Vigerust, K. Kolset, S. Nordenson, A. Henricsen and K. Kleveland, Applied Spectroscopy, 45, 173. ©1991, Society for Applied Spectroscopy, MD, USA [1]
5
Direct Determination of Additives in Polymers and Rubbers
The PEG analytical band at 1110 cm-1, due to the C-O-C linkage, is fi rst isolated from the overlapping PE bands by spectral subtraction - the integrated absorbance (1000-1170 cm-1) per unit thickness then gives a measure of the PEG concentration in the resin. The detection limit is about 0.02% m/m, and the analysis time is 10 minutes excluding sample preparation which involves melt-pressing the sample into 0.25-0.38 mm plaques. The speed and simplicity of the analysis make the method suitable for use in quality control laboratories.
Infrared spectra were collected using a Nicolet 7199 FTIR spectrometer, equipped with a Model 1280 data acquisition system, a liquid nitrogen cooled narrow-band mercury – cadmium – telluride detector with a potassium bromide window, a water-cooled globar (silicon carbide) source and a Ge/KBr beam splitter. The interferograms were obtained with a four wavenumber resolution (number of data points = 4096) and a medium interscan correlation. A Happ-Genzel apodisation was used to transform the interferometric data into a single-beam spectrum over the spectrometer range (4000-600 cm-1). The corresponding single-beam spectra were ratioed against the single-beam instrumental background recorded without the sample in the IR beam path. Sixty-four co-added scans yielded an adequate signal-to-noise ratio in the spectra.
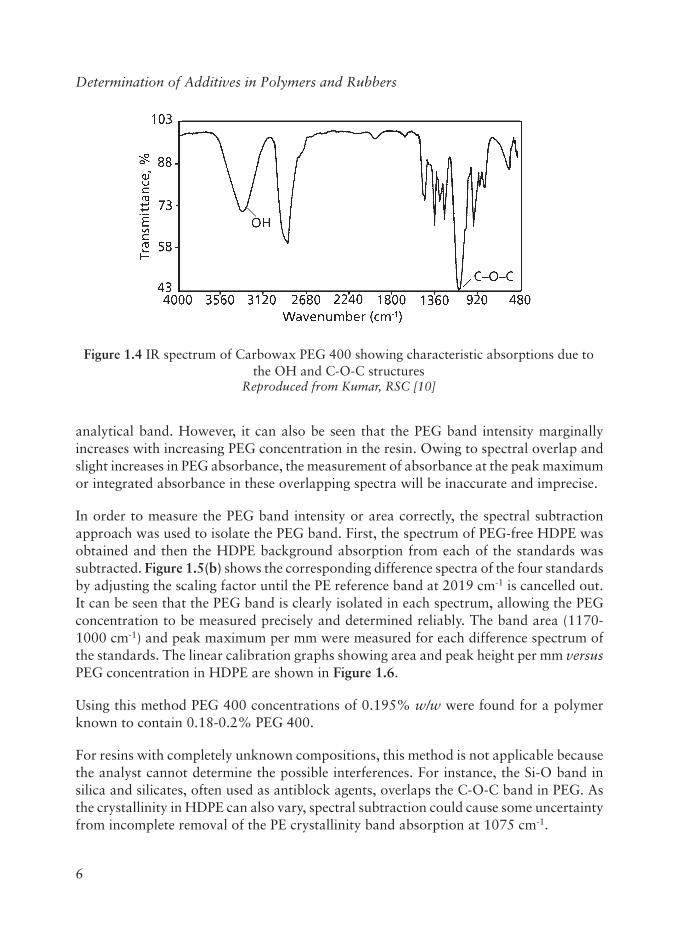
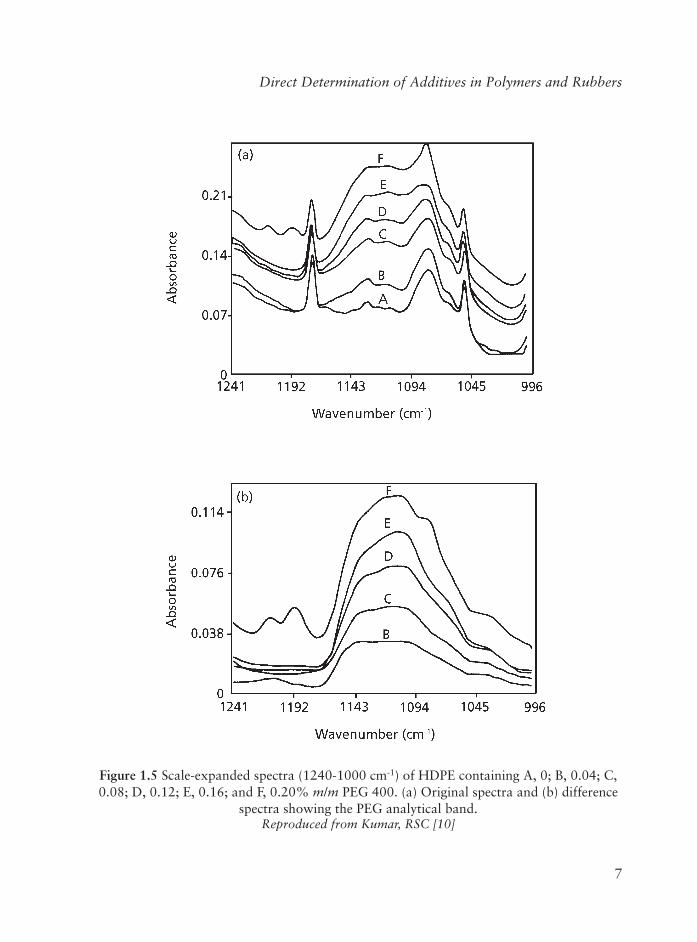
Figure 1.4 shows the IR spectrum of Carbowax PEG 400 indicating the prominent bands due to the C-O-C ether linkage (1110 cm-1) and the broad hydroxyl band (3380 cm-1).The broad, intense band at 1110 cm-1 was chosen for determining the PEG concentration. Figure 1.5(a) shows the scale-expanded (1240-1000 cm-1) spectra of HDPE resins containing 0, 0.04, 0.08, 0.12, 0.16 and 0.20% m/m Carbowax PEG 400. The PE bands in this region are sharp, but the PE background absorption severely overlaps the PEG
Table 1.1 Regression output
Additive BHT Erucamide SilicaStandard error of estimate (wt/ppm) 69 72 30
Correlation coeffi cient (squared) 0.84 0.91 0.99
Number of observations 19 19 19
Degrees of freedom 18 18 18
Regression coeffi cient 1.01 0.96 1.00
Standard error of coeffi cient 0.03 0.03 0.01
Reproduced with permission from B. Vigerust, K. Kolset, S. Nordenson, A. Henricksen and K. Klevelond, Applied Spectroscopy, 45, 173. ©1991, Society for Applied Spectroscopy, MD, USA [1]
6
Determination of Additives in Polymers and Rubbers
analytical band. However, it can also be seen that the PEG band intensity marginally increases with increasing PEG concentration in the resin. Owing to spectral overlap and slight increases in PEG absorbance, the measurement of absorbance at the peak maximum or integrated absorbance in these overlapping spectra will be inaccurate and imprecise.
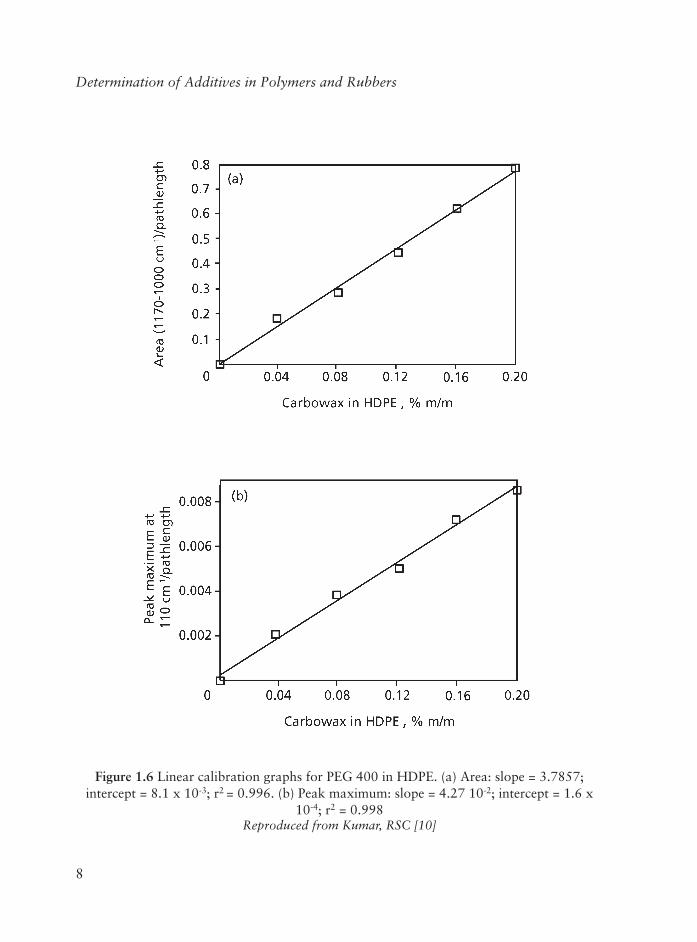
In order to measure the PEG band intensity or area correctly, the spectral subtraction approach was used to isolate the PEG band. First, the spectrum of PEG-free HDPE was obtained and then the HDPE background absorption from each of the standards was subtracted. Figure 1.5(b) shows the corresponding difference spectra of the four standards by adjusting the scaling factor until the PE reference band at 2019 cm-1 is cancelled out. It can be seen that the PEG band is clearly isolated in each spectrum, allowing the PEG concentration to be measured precisely and determined reliably. The band area (1170-1000 cm-1) and peak maximum per mm were measured for each difference spectrum of the standards. The linear calibration graphs showing area and peak height per mm versusPEG concentration in HDPE are shown in Figure 1.6.
Using this method PEG 400 concentrations of 0.195% w/w were found for a polymer known to contain 0.18-0.2% PEG 400.
For resins with completely unknown compositions, this method is not applicable because the analyst cannot determine the possible interferences. For instance, the Si-O band in silica and silicates, often used as antiblock agents, overlaps the C-O-C band in PEG. As the crystallinity in HDPE can also vary, spectral subtraction could cause some uncertainty from incomplete removal of the PE crystallinity band absorption at 1075 cm-1.
Figure 1.4 IR spectrum of Carbowax PEG 400 showing characteristic absorptions due to the OH and C-O-C structures
Reproduced from Kumar, RSC [10]
7
Direct Determination of Additives in Polymers and Rubbers
Figure 1.5 Scale-expanded spectra (1240-1000 cm-1) of HDPE contain ing A, 0; B, 0.04; C, 0.08; D, 0.12; E, 0.16; and F, 0.20% m/m PEG 400. (a) Original spectra and (b) difference
spectra showing the PEG analytical band. Reproduced from Kumar, RSC [10]
8
Determination of Additives in Polymers and Rubbers
Figure 1.6 Linear calibration graphs for PEG 400 in HDPE. (a) Area: slope = 3.7857; intercept = 8.1 x 10⁻³; r2 = 0.996. (b) Peak maximum: slope = 4.27 10-2; intercept = 1.6 x
10-4; r2 = 0.998Reproduced from Kumar, RSC [10]
9
Direct Determination of Additives in Polymers and Rubbers
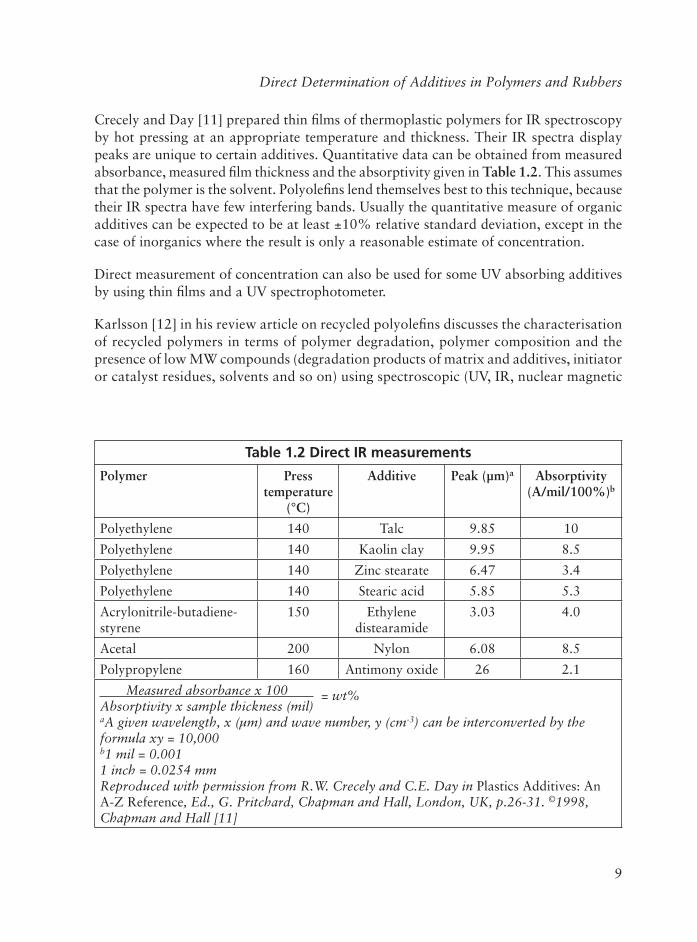
Crecely and Day [11] prepared thin fi lms of thermoplastic polymers for IR spectroscopy by hot pressing at an appropriate temperature and thickness. Their IR spectra display peaks are unique to certain additives. Quantitative data can be obtained from measured absorbance, measured fi lm thickness and the absorptivity given in Table 1.2. This assumes that the polymer is the solvent. Polyolefi ns lend themselves best to this technique, because their IR spectra have few interfering bands. Usually the quantitative measure of organic additives can be expected to be at least ±10% relative standard deviation, except in the case of inorganics where the result is only a reasonable estimate of concentration.
Direct measurement of concentration can also be used for some UV absorbing additives by using thin fi lms and a UV spectrophotometer.
Karlsson [12] in his review article on recycled polyolefi ns discusses the characterisation of recycled polymers in terms of polymer degradation, polymer composition and the presence of low MW compounds (degradation products of matrix and additives, initiator or catalyst residues, solvents and so on) using spectroscopic (UV, IR, nuclear magnetic
Table 1.2 Direct IR measurements
Polymer Press temperature
(°C)
Additive Peak (µm)a Absorptivity(A/mil/100%)b
Polyethylene 140 Talc 9.85 10
Polyethylene 140 Kaolin clay 9.95 8.5
Polyethylene 140 Zinc stearate 6.47 3.4
Polyethylene 140 Stearic acid 5.85 5.3
Acrylonitrile-butadiene-styrene
150 Ethylene distearamide
3.03 4.0
Acetal 200 Nylon 6.08 8.5
Polypropylene 160 Antimony oxide 26 2.1
Measured absorbance x 100 = wt%Absorptivity x sample thickness (mil)aA given wavelength, x (µm) and wave number, y (cm-3) can be interconverted by the formula xy = 10,000b1 mil = 0.0011 inch = 0.0254 mmReproduced with permission from R.W. Crecely and C.E. Day in Plastics Additives: An A-Z Reference, Ed., G. Pritchard, Chapman and Hall, London, UK, p.26-31. ©1998,Chapman and Hall [11]
10
Determination of Additives in Polymers and Rubbers
resonance (NMR)), chromatographic (high performance liquid chromatography, gas chromatography (GC), gel permeation chromatography (GPC)) and thermal dynamic scanning calorimetry (DSC) analytical techniques and examples of their applications are described.
Near IR spectroscopy of PE powder was carried out before compounding with Irganox 1010 and Irgafos 168. It was observed that the identifi cation and selection of specifi c bands or unique spectral features in the spectra is diffi cult. The variation in baselines is due to differences in scattering properties of the analytes. Multiplicative scattering correction orderivation can eliminate these variations [13, 14].
A certain relationship between the samples that contain antioxidants exists, since they are gathered in two clusters, whereas the non-stabilised sample differs from the rest. By PCA the cluster on the left side is built by samples that contain a total amount of antioxidants lower or equal to 2,200 ppm and the cluster on the right side is made up of samples having total antioxidant concentrations above 2,500 ppm. The difference between virgin HDPE and stabilised samples may also be explained by the degradation of the virgin sample during extrusion, which has been confi rmed by the presence of carbonyl groups and changes in crystallinity as measured by FTIR and DSC, respectively. The virgin sample showed a carbonyl index (CI) equal to 0.29 whereas the samples containing Irgafos 168 above 300 ppm did not show carbonyl groups at all. Samples with concentrations of Irgafos 168 below 300 ppm were slightly degraded, the CI was in the range 0-0.09. Small differences in the DSC crystallinity were observed among the stabilised samples, their values were in the 62-65% interval. However, a lower crystallinity value, 57% was obtained for the virgin specimen. The root mean square errors of prediction for Irganox 1010 and Irgafos 168 were 45 and 95 ppm, respectively. The models were obtained using a PLS regression with four factors over the 5000-9000 cm-1 spectral segment.
Nishikawa and co-workers [15] developed dynamic compression modulation attenuated total refl ection - Fourier transform infrared (ATR-FTIR) spectroscopic methods for characterising polymer fi lms. To obtain dynamic compression polarised ATR spectra, internal refl ection element (IRE) secure assemblies made of tungsten carbide with very high hardness (Knoop hardness of >1000 kgf/mm2) were designed. These assemblies are mounted on the Harrick Seagull ATR attachment and measured by step-scan FTIR spectroscopy. The effect of static compression, air gaps, and refractive index changes were examined. Experimental and simulated results showed that the effect of air gaps between the sample and IRE and refractive index changes of the sample and IRE are negligible at values larger than a static torque of 40 cN-m and good signal-to-noise ratios and reproducible data can be obtained. Uniaxially and biaxially drawn polyethylene terephthalate (PET) fi lms were measured by this method. Both bipolar and unipolar bands were observed in the dynamic in-phase ATR spectra, which can be associated with their micro-structural environmental changes. This technique shows promise in evaluating
11
Direct Determination of Additives in Polymers and Rubbers
various polymer fi lm materials, including biaxially oriented fi lms, multilayer coated fi lm surfaces, and molecular interactions between polymer-polymer and polymer-additives at the fi lm surface.
Various workers have reviewed the application of IR spectroscopy to the determination of additives [16, 17, 18]. Other recent applications of IR spectroscopy include the determination of slip agents in PE [19], ethyl acetate and ethanol in HDPE [20], stearic acid in polystyrene (PS) [21], talc, antimony trioxide and decabromophenylether fl ame retardants in polyvinyl chloride (PVC) [22-24], mould release agents [25] and binders in aged paint fi lm [26].
1.2 Ultraviolet Spectroscopy
This technique has found very limited applications in the direct analysis of additives in polymers.
Soucek and Jelinkova [27] have also used this differential principle to determine in polypropylene (PP) two antioxidants (2,6-di-tert-butyl 4 methylphenol and 4-substituted 2,6-xylenol) which have virtually identical UV absorption spectra in the absence of alkali. The antioxidants can be distinguished in alkaline medium, where 4-substituted 2,6-xylenol forms phosphonate readily, thus allowing the utilisation of the bathochromic shift for its determination. The use of derivative spectroscopy reduces light scattering and matrix interferences when extracts from PP samples are measured.
Lutzen and co-workers [28] describe an in-line monitoring, UV method for the determination of polymer additives such as thermal and UV stabilisers and antioxidants in polymers.
Thermal UV spectroscopy has been used to identify and determine organic and inorganic pigments in polymers.
Organic and inorganic pigments are used for coloration of polymers, polymer fi lms and polymer coatings on metal containers. Vapour phase UV absorption spectrometry at 200 nm has been used to identify such pigments [29]. In this method powdered samples are directly vapourised in the heated graphite atomiser. Thermal UV profi les of organic pigments show absorption bands between 300 and 900 °C, while profi les of inorganic pigments are characterised by absorption bands at temperatures above 900 °C. Temperature, relative intensity, and width of the bands allow the identifi cation of the pigments. The technique shows fast acquisition of thermal UV profi les (2-3 minutes for each run), good repeatability and wide thermal range (from 150 to 2300 °C). The method has been applied to a variety of polymers.
12
Determination of Additives in Polymers and Rubbers
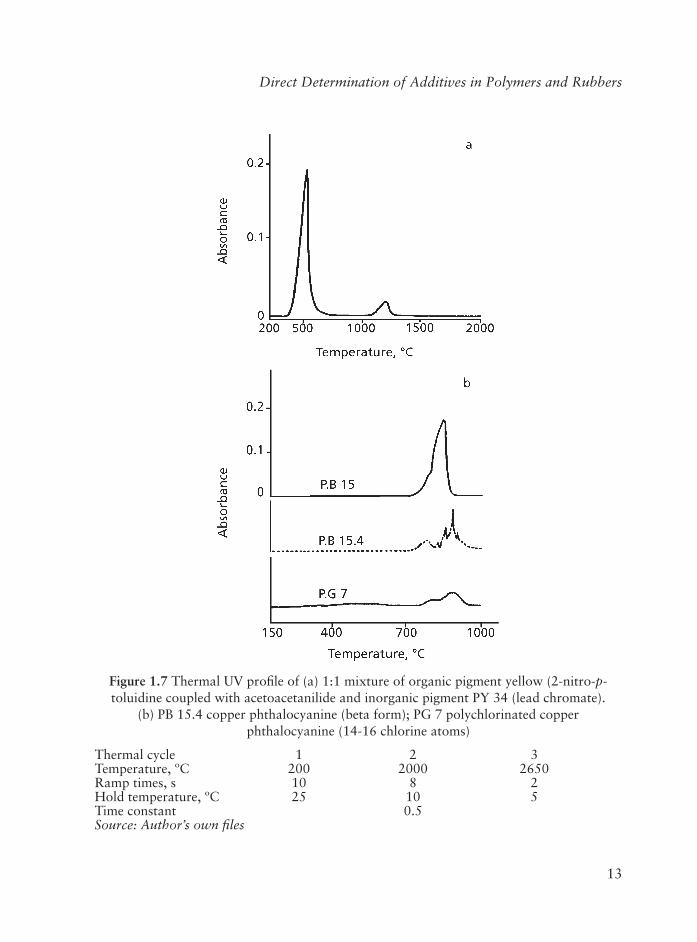
A practical example of the identifi cation of pigments is given in Figure 1.7. A 1:1 mixture of organic pigment yellow (2-nitro-p-toluidine coupled with acetoacetanilide) and inorganic PY 34 (lead chromate) was vapourised using the conditions quoted in Figure 1.1(a). The thermal UV profi le clearly shows two absorption bands at about 500 °C and 1250 °C. The fi rst band is attributable to the vapours which originate from the decomposition and pyrolysis of the organic pigment, the second band corresponds to the decomposition and vapourisation of lead chromate at high temperature (mp = 844 °C). It is possible therefore to determine by a rapid run whether the pigment is a mixture or belongs to the organic or inorganic group.
Blue and green organic pigments are commonly derivatives of copper phthalocyanine, which is characterised by remarkable resistance to thermal treatments. In fact these pigments show UV absorption at temperatures higher (about 800-900 °C) than those observed for yellow and red pigments Figure 1.7(b).
Albarino [30] has stated that analysis of PE additives by means of UV spectroscopy is limited by excessive beam dispersion due to light scattering from the polymer crystalline regions. Additives at low concentrations (0.1%) require sample thicknesses which mean that analysis must be performed in the presence of a high level of scattering which may change unpredictably with wavelength. At lower levels of concentration and correspondingly greater sample thicknesses, unacceptable signal-to-noise ratios exist. Nevertheless, UV spectroscopy remains an attractive method for analysis of many additives. Principal advantages over IR analysis include greater sensitivity arising from higher extinction coeffi cients and a lack of interfering absorptions from the PE matrix. These advantages can be realised, however, only if background scattering from the polymer can be reduced.
Albarino [30] demonstrated the feasibility of quantitative UV analysis of additives in PE at temperatures above the polymer melting point where the crystallites, which account for much of the scattering, are eliminated. Greater sample thickness and analytical sensitivity are possible compared to analysis of solid samples at room temperature. In this work, sample thickness was controlled by brass shims held between Suprasil grade silica windows (Heraeus Amersil, Inc.) by a faceplate bolted to the cell body.
PE samples were prepared for analysis by calculating the weight required to fi ll the shim opening in the melt. Samples were inserted into the shim opening as pressed fi lms cut to size; several layers were required for greater thicknesses. After gently tightening the faceplate, the cell was rapidly heated to 120 to 125 °C by supplying about 65 W to the heater. By proper tightening of the faceplate, the shim space was uniformly fi lled with PE, after which the cell was transferred to the sample compartment of a spectrometer. Upon warmup to the melt, an input power of 29 W maintained cell temperature within the limits given in Table 1.3 during scanning. Cell temperature was regulated only to the extent of maintaining the melt between 121 to 135 °C. A small temperature increase, given
13
Direct Determination of Additives in Polymers and Rubbers
Figure 1.7 Thermal UV profi le of (a) 1:1 mixture of organic pigment yellow (2-nitro-p-toluidine coupled with acetoacetanilide and inorganic pigment PY 34 (lead chromate).
(b) PB 15.4 copper phthalocyanine (beta form); PG 7 polychlorinated copper phthalocyanine (14-16 chlorine atoms)
Thermal cycle 1 2 3Temperature, ºC 200 2000 2650Ramp times, s 10 8 2Hold temperature, ºC 25 10 5Time constant 0.5Source: Author’s own fi les
14
Determination of Additives in Polymers and Rubbers
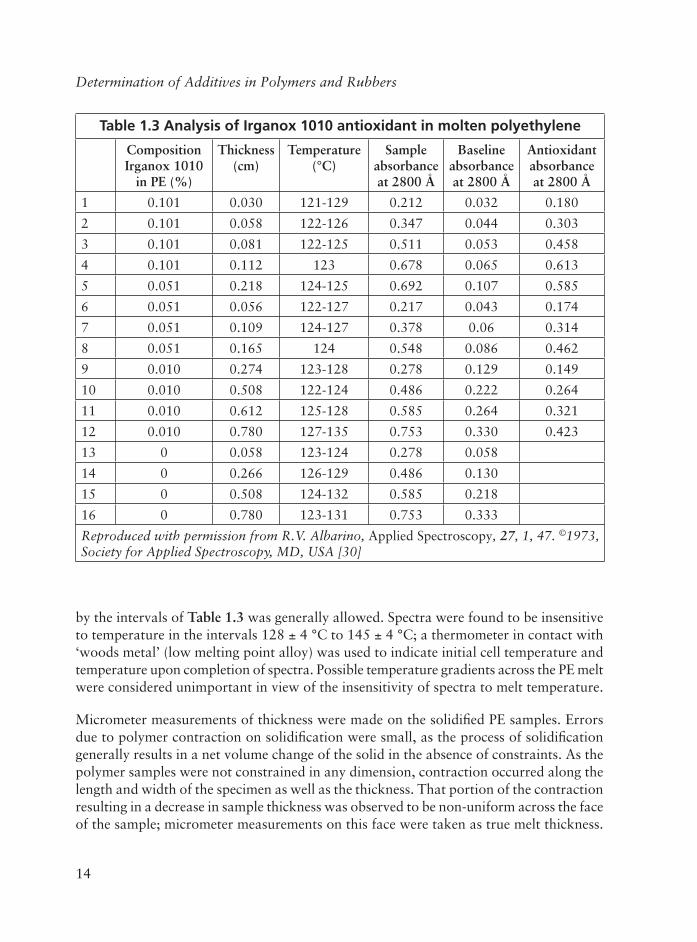
by the intervals of Table 1.3 was generally allowed. Spectra were found to be insensitive to temperature in the intervals 128 ± 4 °C to 145 ± 4 °C; a thermometer in contact with ‘woods metal’ (low melting point alloy) was used to indicate initial cell temperature and temperature upon completion of spectra. Possible temperature gradients across the PE melt were considered unimportant in view of the insensitivity of spectra to melt temperature.
Micrometer measurements of thickness were made on the solidifi ed PE samples. Errors due to polymer contraction on solidifi cation were small, as the process of solidifi cation generally results in a net volume change of the solid in the absence of constraints. As the polymer samples were not constrained in any dimension, contraction occurred along the length and width of the specimen as well as the thickness. That portion of the contraction resulting in a decrease in sample thickness was observed to be non-uniform across the face of the sample; micrometer measurements on this face were taken as true melt thickness.
Table 1.3 Analysis of Irganox 1010 antioxidant in molten polyethylene
CompositionIrganox 1010
in PE (%)
Thickness(cm)
Temperature (°C)
Sampleabsorbanceat 2800 Å
Baselineabsorbanceat 2800 Å
Antioxidantabsorbanceat 2800 Å
1 0.101 0.030 121-129 0.212 0.032 0.180
2 0.101 0.058 122-126 0.347 0.044 0.303
3 0.101 0.081 122-125 0.511 0.053 0.458
4 0.101 0.112 123 0.678 0.065 0.613
5 0.051 0.218 124-125 0.692 0.107 0.585
6 0.051 0.056 122-127 0.217 0.043 0.174
7 0.051 0.109 124-127 0.378 0.06 0.314
8 0.051 0.165 124 0.548 0.086 0.462
9 0.010 0.274 123-128 0.278 0.129 0.149
10 0.010 0.508 122-124 0.486 0.222 0.264
11 0.010 0.612 125-128 0.585 0.264 0.321
12 0.010 0.780 127-135 0.753 0.330 0.423
13 0 0.058 123-124 0.278 0.058
14 0 0.266 126-129 0.486 0.130
15 0 0.508 124-132 0.585 0.218
16 0 0.780 123-131 0.753 0.333
Reproduced with permission from R.V. Albarino, Applied Spectroscopy, 27, 1, 47. ©1973,Society for Applied Spectroscopy, MD, USA [30]
15
Direct Determination of Additives in Polymers and Rubbers
Shims designed to allow an outfl ow of excess molten polyethylene would facilitate thickness measurements as melt thickness would correspond to shim thickness.
Albarino [30] used standards consisting of PE and Irganox 1010. These were made by milling at temperatures of about 127 °C. Samples containing 0.051 and 0.010% Irganox 1010 were made from a masterbatch containing 0.101% Irganox 1010. These standards and an unstabilised control were moulded into sheets 0.064 to 0.076 cm thick for use in the analysis.
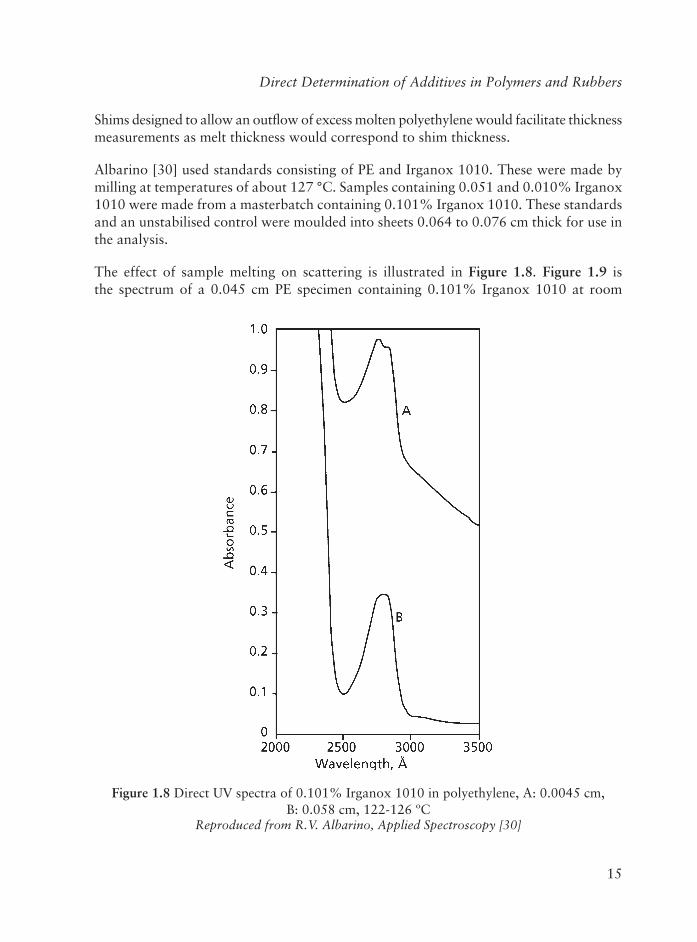
The effect of sample melting on scattering is illustrated in Figure 1.8. Figure 1.9 is the spectrum of a 0.045 cm PE specimen containing 0.101% Irganox 1010 at room
Figure 1.8 Direct UV spectra of 0.101% Irganox 1010 in polyethylene, A: 0.0045 cm, B: 0.058 cm, 122-126 ºC
Reproduced from R.V. Albarino, Applied Spectroscopy [30]
16
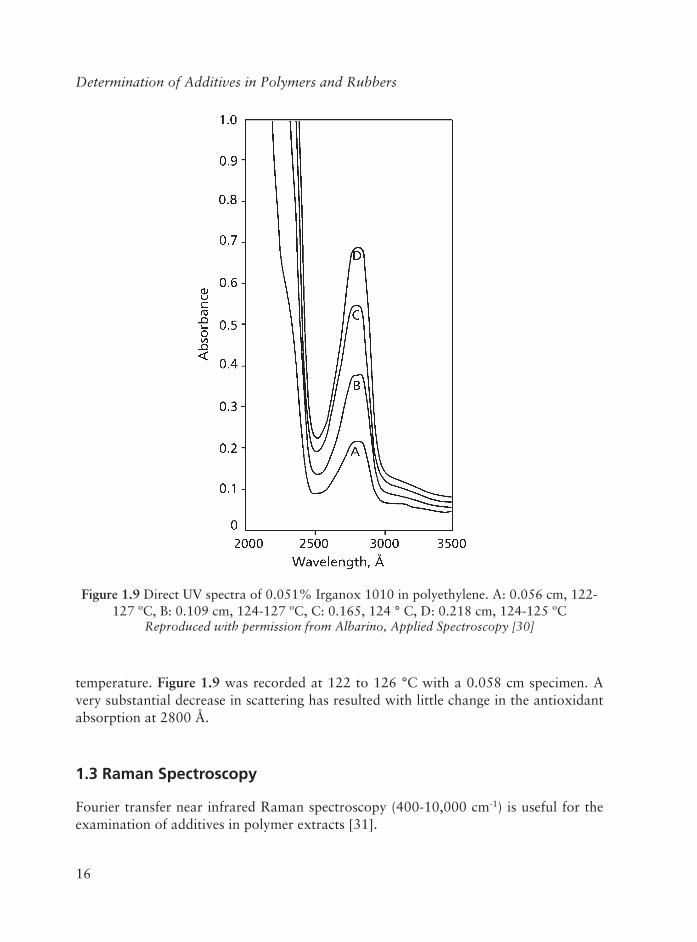
Determination of Additives in Polymers and Rubbers
temperature. Figure 1.9 was recorded at 122 to 126 °C with a 0.058 cm specimen. A very substantial decrease in scattering has resulted with little change in the antioxidant absorption at 2800 Å.
1.3 Raman Spectroscopy
Fourier transfer near infrared Raman spectroscopy (400-10,000 cm-1) is useful for the examination of additives in polymer extracts [31].
Figure 1.9 Direct UV spectra of 0.051% Irganox 1010 in polyethylene. A: 0.056 cm, 122-127 ºC, B: 0.109 cm, 124-127 ºC, C: 0.165, 124 ° C, D: 0.218 cm, 124-125 ºC
Reproduced with permission from Albarino, Applied Spectroscopy [30]
17
Direct Determination of Additives in Polymers and Rubbers
An example of the application of Raman spectroscopy is the identifi cation of additives in fi re retardant PP. When a sample of PP was examined by IR spectroscopy the strongest bands (9.8 and 14.9 µm) were due to a talc-type material and bands of medium intensity were assigned to PP and possibly antimony trioxide (13.4 µm). Additional weak bands in the 7.3-7.7 µm region were possibly due to decabromodiphenyl ether. In the Raman spectrum, however, the strongest bands (250 and 185 cm-1 shift) confi rmed the presence of antimony trioxide and some bands of medium intensity confi rmed the presence of decabromodiphenyl ether (doublet at 140, triplet at 220 cm-1 shift) and PP (800, 835, 1150, 1325, 1450 and 2900 cm-1 shift). The silicate bands that obscured the regions of the IR spectrum were not observed in the Raman spectrum.
Although both of these spectroscopic methods have a wide use in their own right, this example demonstrates well the complementary value of the two methods, taking advantage of the fact that elements of high atomic number, e.g., antimony and bromine, have relatively more intense Raman spectra but the lighter elements show up clearly in the IR spectra.
Other applications of Raman spectroscopy include monomers in polymethylmethacrylate [32] and additives in PVC [33].
1.4 Mass Spectrometry
Mass spectrometry (MS) involves the study of ions in the vapour phase. This analytical method has a number of features and advantages that make it an extremely valuable tool for the identifi cation and structural elucidation of organic molecules - including synthetic polymers: (a) the amount of sample needed is small (microgram level or less); (b) the molar mass of the material can be obtained directly by measuring the mass of the molecular (or quasimolecular) ion; (c) molecular structures can be elucidated by examining molar masses, ion fragmentation patterns, and atomic compositions determined by mass spectrometry; and (d) mixtures can be analysed by using ‘soft’ ionisation methods and hyphenated techniques (such as GC-MS, liquid chromatography-mass spectrometry (LC-MS), and MS/MS).
Mass spectrometric methods are routinely used to characterise a wide variety of biopolymers, such as proteins, polysaccharides, and nucleic acids. Nevertheless, despite its advantages, MS has been under utilised in the past for studying synthetic polymer systems. It is fair to say that, until recently, polymer scientists have been rather unfamiliar with the advances made in the fi eld of MS.
However, MS in recent years has rapidly become an indispensable tool in polymer analysis, and modern MS today complements in many ways the structural data provided by NMR and IR methods. Contemporary MS of polymers is capable of changing the
18
Determination of Additives in Polymers and Rubbers
protocols which have been established for years, for the molecular and structural analysis of macromolecules.
Some of the most signifi cant applications of modern MS to synthetic polymers are (a) chemical structure and end-group analysis, (b) direct measurement of molar mass and molar mass distribution, (c) copolymer composition and sequence distribution, and (d) detection and identifi cation of impurities and additives in polymeric materials.
In order to analyse any material by MS, the sample must fi rst be vapourised (or desorbed) and ionised into the instrument’s vacuum system. Since polymers are generally nonvolatile, many mass spectral methods have involved degradation of the polymeric material before analysis of the more volatile fragments.
Two traditional methods to examine polymers have been fl ash-pyrolysis GC-MS and direct pyrolysis in the ion source of the instrument.
In recent years, however, there has been a marked tendency toward the use of directMS techniques. While a continued effort to introduce MS as a major technique for the structural analysis of polymers has been made over the past three decades, MS analysts did not have a great impact upon the polymer community until the past fi ve years or so. During this period outstanding progress has been made in the application of MS to some crucial problems involving the characterisation of synthetic polymers.
Developments in two general areas have spurred this progress. Sector and quadrupole mass analysers, the traditional methods of separation of ions in MS, have recently been complemented by the development of powerful Fourier transform (FT-MS) and time-of-fl ight (TOF-MS) instruments. The TOF analysers are particularly well-suited for detecting higher molar-mass species present in polymers.
Parallel to this, new ionisation methods have been developed that are based on the direct desorption of ions from polymer surfaces. With the introduction of ‘desorption/ionisation’ techniques, it has become possible to eject large molecules into the gas phase directly from the sample surface, and thereby mass spectra of intact polymer molecules have been produced. The term ‘desorption/ionisation’ refers to a method in which the desorption/vapourisation and ionisation steps essentially occur simultaneously.
Fortunately, the use of MS for polymer analysis took on a new dimension at the turn of the century. Up until the mid-1990s there was a steady - but not dramatic - increase in the number of journal publications on polymer mass spectrometry. Starting in 1995, however, there has been a marked increase in the number of polymer mass spectrometry reports in the literature. Also the number of symposia and conferences devoted to the subject has grown considerably in the last few years.
19
Direct Determination of Additives in Polymers and Rubbers
The major reason for this increase has been the use of matrix-assisted laser desorption/ionisation-MS (MALDI-MS) for numerous polymer applications. MALDI is by no means the only mass spectral method that is useful for polymer analysis, but it has provided the impetus to get polymer people interested in what mass spectrometry can do.
Hayes and Altenau [34] were the fi rst to report the use of MS to directly characterise antioxidants and processing oil additives in synthetic rubbers. Since then, various MS techniques have been applied to the analysis of rubber and polymer additives either as extracts or on the sample surface by laser techniques as reviewed by Lattimer and Harris [35]. Lattimer reviewed the present situation regarding MS in polymer analysis [36]. Analysis of polymer extracts by MS has proved challenging. Electron impact mass spectra (EI-MS) are often diffi cult to interpret due to the high concentration of processing oils and the additives in the extract, and excessive fragmentation of the molecular ions. Desorption/ionisation techniques such as fi eld desorption (FD) and fast atom bombardment (FAB) have been found to be the most effective means for analysing polymer and rubber extracts [37, 38].
FD-MS has proved to be a particularly useful technique, since molecular ion abundances are high with respect to fragmented ions [39]. Electrospray ionisation MS (ESI-MS and ESI-MS-MS) has also been used for the analysis of polymer additive mixtures [40].
Extraction and separation procedures are time consuming, rendering additive characterisation a slow and laborious process, there is the possibility that the extraction process may compromise the integrity of the additive mixture, leading to an inaccurate picture of polymer composition.
Attempts at direct MS characterisation of additives in bulk polymer samples have centred on direct thermal adsorption of additives for the bulk polymer, followed by EI-MS, chemical ionisation (CI-MS) or fi eld ionisation (FI-MS). However, this approach is linked to polymer additives that are stable or can provide meaningful fragment ions at elevated temperatures. Desorption/ionisation methods such as fast ion bombardment (FAB) [41], laser desorption [42, 43] and secondary ion MS (SIMS) have also been applied to the analysis of additives in bulk polymer samples. However, these single step techniques suffer to varying degrees from matrix interferences in the resulting mass spectra.
Laser desorption/laser photoionisation time-of-fl ight MS (LPToFMS) is a technique that has great potential for the direct analysis of molecular species from complex host matrices. This two-step approach circumvents many of the problems, discussed previously, that have been encountered with other techniques.
These various experimental techniques are discussed further next.
20
Determination of Additives in Polymers and Rubbers
Earlier Experimental Techniques
In 1986, Peltonen [44] applied MS to the identifi cation of volatile breakdown products of heated PS. The early work includes that of Rudewicz and Munson [45] who vaporised Ionox 330 and Irganox 168 and UV 531 additives from PP in a heatable glass probe under chemical ionisation conditions using 1.4% ammonia in methane reagent gas. The dominant species in this mixture, NH4
+, is a low energy reagent ion that reacts with the additives to give very simple spectra of (M + H)+ or (M + NH4)+ ions with little fragmentation.
Lattimer and co-workers [46] have applied MS to the determination of organic additives (antioxidants and antiozonants) in rubber vulcanisates. Direct thermal desorption was used with three different ionisation methods (EI, CI, FI). The vulcanisates were also examined by direct FAB-MS as a means for surface desorption/ionisation.
Rubber extracts were examined directly by the four ionisation methods. Of the vaporisation/ionisation methods, it appears that fi eld ionisation is the most effi cient for identifying typical organic additives in rubber vulcanisates.
Other earlier applications include those of Bletsos and co-workers [47] who produced time-of-fl ight ion MS of additives in polydimethylsiloxane and polytetrafl uoroethylene, MS of organic additives in carbon black fi lled styrene-butadiene rubber [48] and oxidative ageing of antioxidants present on polymer surfaces [49, 36].
In principle, the most straightforward way to identify organic additives in a compounded polymer is to heat the material to thermally desorb the volatile components. The evolved chemicals may then be directed into a MS ion source for analysis. EI is the traditional method of ionisation in MS, and in the early years of MS, it was the only method that was readily available. Several studies from the 1970s and the early 1980s describe heating rubber compounds (or their extracts) in vacuo to vapourise the components into an EI ion source [34, 50-52]. These studies were in general hampered by (a) extensive EI fragmentation and (b) intense signals from the processing oil that is contained in most rubber recipes.
Later systemic studies by Lattimer described the use of ‘soft’ ionisation methods (CI and FI) in the direct analysis of model vulcanisates [46] as well as uncured compounds [48]. The resulting ‘survey’ spectra were much simpler in nature – and thus easier to interpret – than those obtained via EI-MS. All of these studies, which used single-stage MS methods, describe the identifi cation of various organic ingredients in the elastomers [50-53]. In later work, tandem mass spectrometry (MS-MS) was shown to be effective for increasing the specifi city and sensitivity of detection and identifi cation of additives in direct rubber compound [54, 55]. Pyrolysis fi eld ionisation (Py-FI-MS) was shown to be a good technique for analysis of both organic additives and rubber components in the
21
Direct Determination of Additives in Polymers and Rubbers
same experiment [56]. Results of literature reports through 1989 were summarised in a review article on rubber-compound analysis [57].
Relatively few descriptions of direct mass spectral analysis of plastics compounds have appeared in the literature. In a rather early report, additives in PP compounds were thermally desorbed into a heated reservoir inlet for mass spectral analysis [58]. It was found that numerous stabilisers could be identifi ed via 80 eV EI-MS. Thermal, desorption of additives via direct probe introduction of PP compounds was described in a later report [59]. A more recent paper considered the mass spectral analysis of both rubber and plastic compounds. This report was an overview, without much detail. Analysis of additives in PP compounds via direct thermal desorption CI-MS has also been described [45].
Ammonia as a reagent gas was found to yield very simple CI mass spectra. Finally, a recent report analysed a number of additives (antioxidants and light stabilisers) in PP compounds. Three ionisation methods (El, CI, FI) were used, and supplemental MS-MS and atomic composition (AC-MS) results were used for chemical structure elucidation/confi rmation of various ingredients.
Soft Ionisation, Tandem (MS-MS) and High Resolution (Atomic Composition-MS) Mass Spectrometry
Lattimer [60] has recently reported a method of the mass spectral identifi cation of components (particularly residual volatile chemicals, organic additives, and degradation products) in a number of commercial elastomer compounds of unknown composition. Programmed direct probe heating of the compounded elastomer was used with three different methods of ionisation: 70 eV EI-MS, isobutane CI-MS, and FI-MS. It should be understood that both thermal desorption and pyrolysis are taking place. That is, residual volatile chemicals and most organic additives are thermally desorbed at lower temperatures (less than ~250 °C), while polymeric components are thermally decomposed (pyrolysed) at higher temperatures (greater than ~250 °C). In some cases, tandem mass spectrometry (MS-MS) and or high resolution mass analysis (for atomic compositions, AC-MS) was carried out to improve the specifi city of the analysis. Lattimer gives examples to illustrate the various modern MS approaches that may be used in practical problem-solving applications.
The fi rst step in the analysis of an unknown elastomer compound is to obtain and examine low-resolution ‘survey’ MS from the material. These spectra cover a wide mass range (typically ~ 50-1000 Da) and give an ‘overview’ of the sample composition. The most useful ionisation method for this is generally fi eld ionisation, since the simplest possible spectrum is obtained. In the FI spectrum molecular ions are dominant, which facilitates the characterisation of the complex organic additive mixtures that are present in typical elastomer compounds.
22
Determination of Additives in Polymers and Rubbers
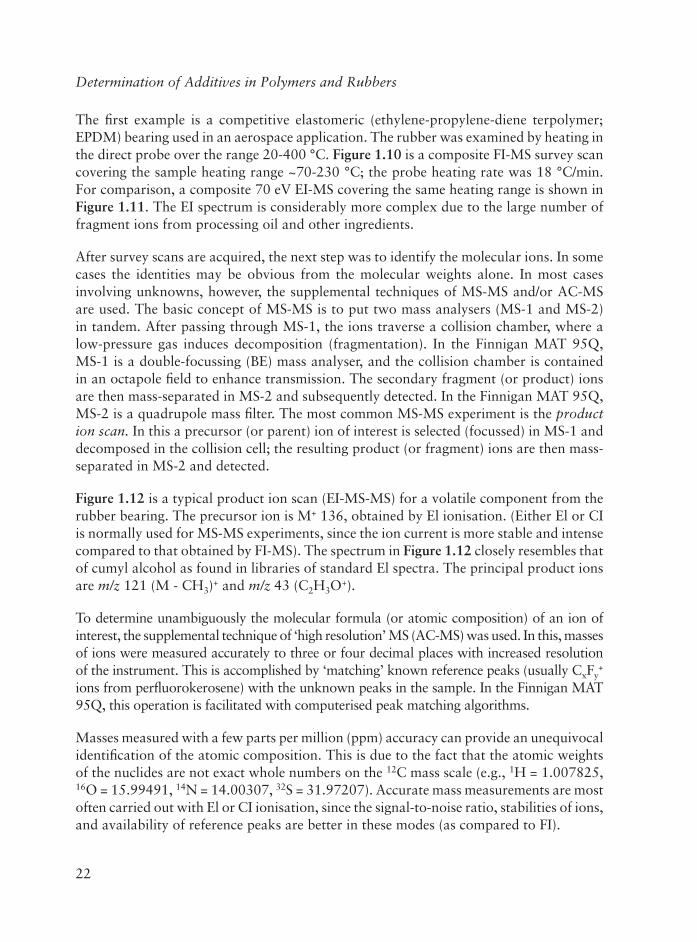
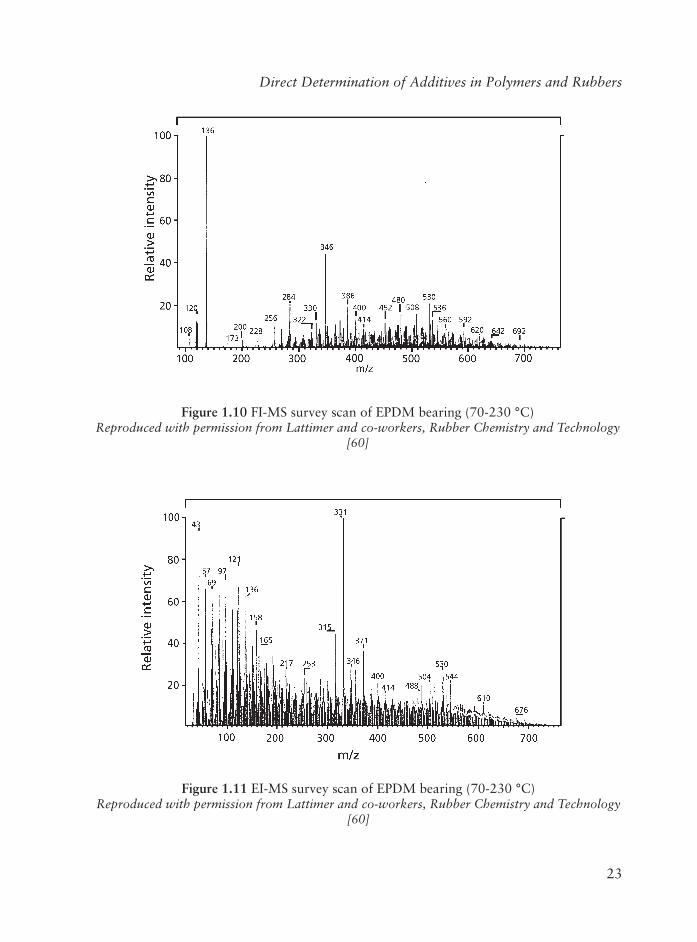
The fi rst example is a competitive elastomeric (ethylene-propylene-diene terpolymer; EPDM) bearing used in an aerospace application. The rubber was examined by heating in the direct probe over the range 20-400 °C. Figure 1.10 is a composite FI-MS survey scan covering the sample heating range ~70-230 °C; the probe heating rate was 18 °C/min. For comparison, a composite 70 eV EI-MS covering the same heating range is shown in Figure 1.11. The EI spectrum is considerably more complex due to the large number of fragment ions from processing oil and other ingredients.
After survey scans are acquired, the next step was to identify the molecular ions. In some cases the identities may be obvious from the molecular weights alone. In most cases involving unknowns, however, the supplemental techniques of MS-MS and/or AC-MS are used. The basic concept of MS-MS is to put two mass analysers (MS-1 and MS-2) in tandem. After passing through MS-1, the ions traverse a collision chamber, where a low-pressure gas induces decomposition (fragmentation). In the Finnigan MAT 95Q, MS-1 is a double-focussing (BE) mass analyser, and the collision chamber is contained in an octapole fi eld to enhance transmission. The secondary fragment (or product) ions are then mass-separated in MS-2 and subsequently detected. In the Finnigan MAT 95Q, MS-2 is a quadrupole mass fi lter. The most common MS-MS experiment is the production scan. In this a precursor (or parent) ion of interest is selected (focussed) in MS-1 and decomposed in the collision cell; the resulting product (or fragment) ions are then mass-separated in MS-2 and detected.
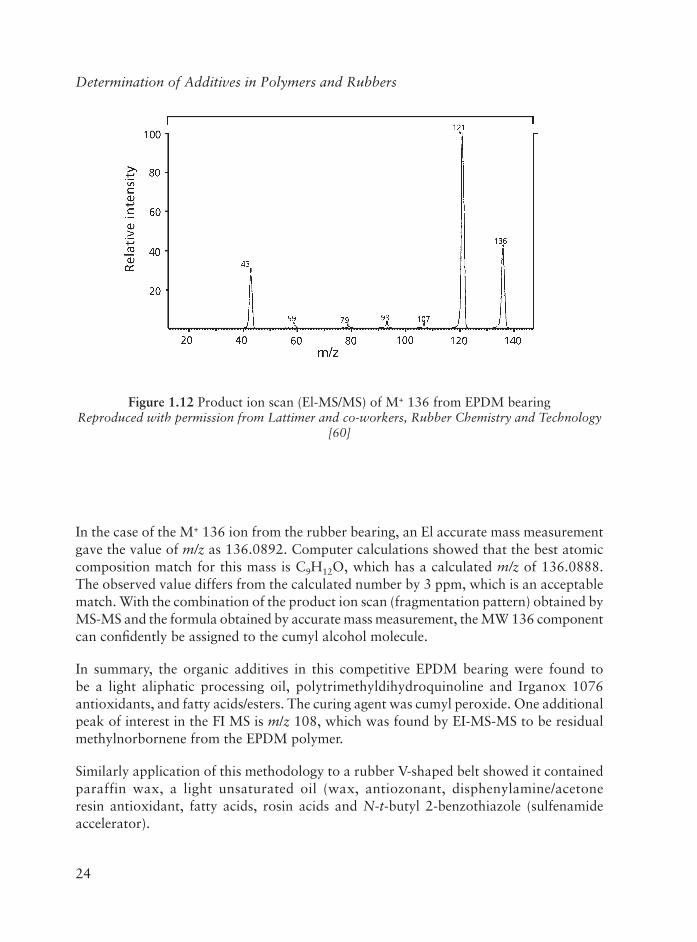
Figure 1.12 is a typical product ion scan (EI-MS-MS) for a volatile component from the rubber bearing. The precursor ion is M+ 136, obtained by El ionisation. (Either El or CI is normally used for MS-MS experiments, since the ion current is more stable and intense compared to that obtained by FI-MS). The spectrum in Figure 1.12 closely resembles that of cumyl alcohol as found in libraries of standard El spectra. The principal product ions are m/z 121 (M - CH3)+ and m/z 43 (C2H3O+).
To determine unambiguously the molecular formula (or atomic composition) of an ion of interest, the supplemental technique of ‘high resolution’ MS (AC-MS) was used. In this, masses of ions were measured accurately to three or four decimal places with increased resolution of the instrument. This is accomplished by ‘matching’ known reference peaks (usually CxFy
+
ions from perfl uorokerosene) with the unknown peaks in the sample. In the Finnigan MAT 95Q, this operation is facilitated with computerised peak matching algorithms.
Masses measured with a few parts per million (ppm) accuracy can provide an unequivocal identifi cation of the atomic composition. This is due to the fact that the atomic weights of the nuclides are not exact whole numbers on the 12C mass scale (e.g., 1H = 1.007825, 16O = 15.99491, 14N = 14.00307, 32S = 31.97207). Accurate mass measurements are most often carried out with El or CI ionisation, since the signal-to-noise ratio, stabilities of ions, and availability of reference peaks are better in these modes (as compared to FI).
23
Direct Determination of Additives in Polymers and Rubbers
Figure 1.10 FI-MS survey scan of EPDM bearing (70-230 °C)Reproduced with permission from Lattimer and co-workers, Rubber Chemistry and Technology
[60]
Figure 1.11 EI-MS survey scan of EPDM bearing (70-230 °C)Reproduced with permission from Lattimer and co-workers, Rubber Chemistry and Technology
[60]
24
Determination of Additives in Polymers and Rubbers
In the case of the M+ 136 ion from the rubber bearing, an El accurate mass measurement gave the value of m/z as 136.0892. Computer calculations showed that the best atomic composition match for this mass is C9H12O, which has a calculated m/z of 136.0888. The observed value differs from the calculated number by 3 ppm, which is an acceptable match. With the combination of the product ion scan (fragmentation pattern) obtained by MS-MS and the formula obtained by accurate mass measurement, the MW 136 component can confi dently be assigned to the cumyl alcohol molecule.
In summary, the organic additives in this competitive EPDM bearing were found to be a light aliphatic processing oil, polytrimethyldihydroquinoline and Irganox 1076 antioxidants, and fatty acids/esters. The curing agent was cumyl peroxide. One additional peak of interest in the FI MS is m/z 108, which was found by EI-MS-MS to be residual methylnorbornene from the EPDM polymer.
Similarly application of this methodology to a rubber V-shaped belt showed it contained paraffin wax, a light unsaturated oil (wax, antiozonant, disphenylamine/acetone resin antioxidant, fatty acids, rosin acids and N-t-butyl 2-benzothiazole (sulfenamide accelerator).
Figure 1.12 Product ion scan (El-MS/MS) of M+ 136 from EPDM bearingReproduced with permission from Lattimer and co-workers, Rubber Chemistry and Technology
[60]
25
Direct Determination of Additives in Polymers and Rubbers
Sulfenamide Accelerators
Other applications of the tandem MS-MS technique include, determination in rubbers of general additives [55, 60] and the determination in polymers of antioxidants [61] and acrylate, methylmethacrylate and butyl acrylate monomers in acrylic thermoplastics [62].
Laser Mass Desorption/Electron Ionisation MS
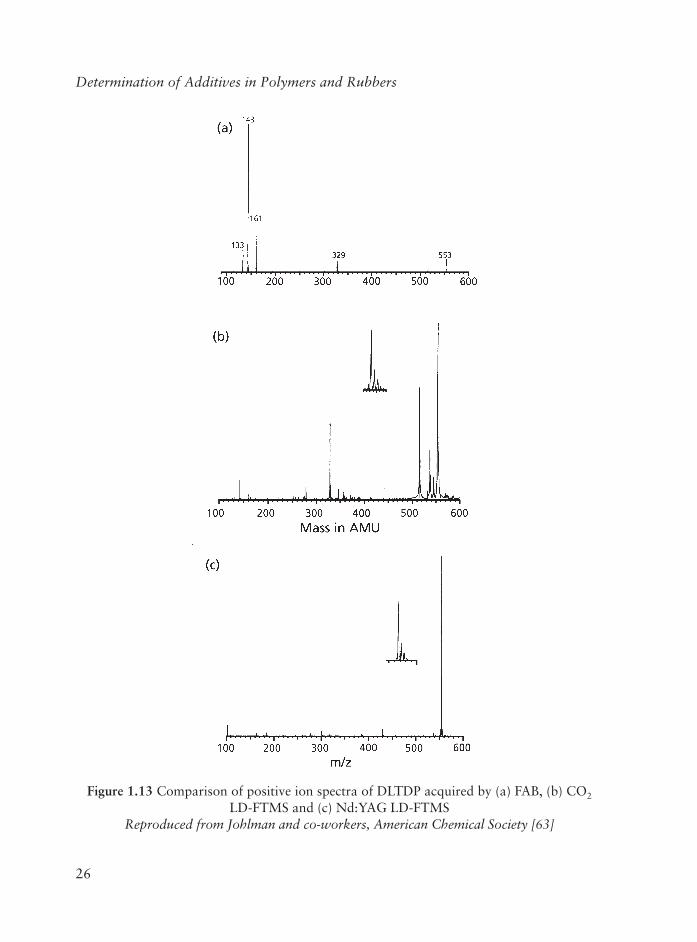
Johlman and co-workers [63] compared laser desorption/ionisation FT-MS (LD-FT-MS) with FAB spectra of the same materials in the analysis of non volatile polymer additives.
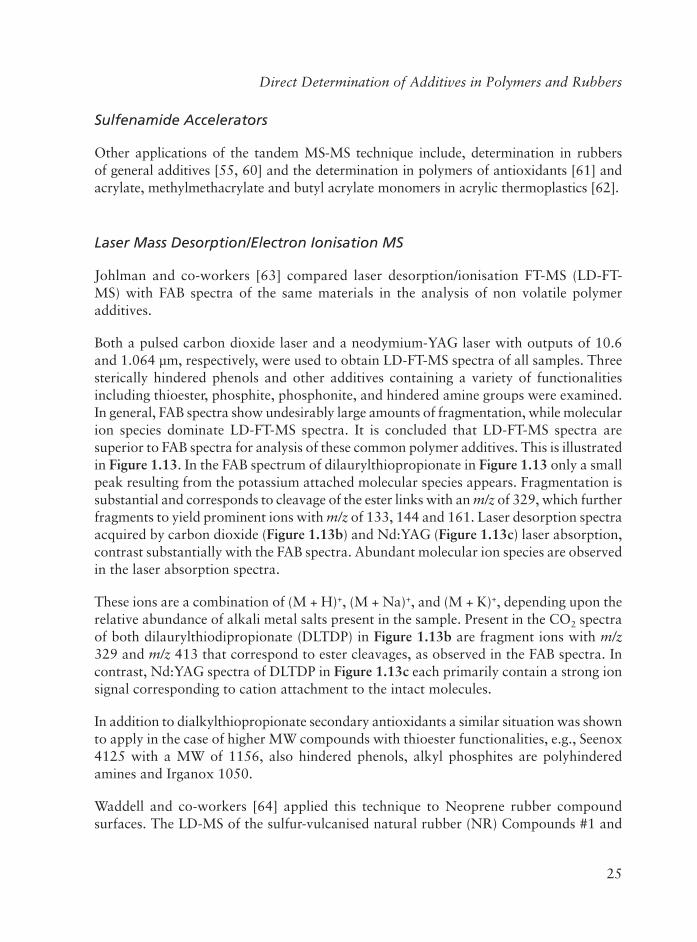
Both a pulsed carbon dioxide laser and a neodymium-YAG laser with outputs of 10.6 and 1.064 µm, respectively, were used to obtain LD-FT-MS spectra of all samples. Three sterically hindered phenols and other additives containing a variety of functionalities including thioester, phosphite, phosphonite, and hindered amine groups were examined. In general, FAB spectra show undesirably large amounts of fragmentation, while molecular ion species dominate LD-FT-MS spectra. It is concluded that LD-FT-MS spectra are superior to FAB spectra for analysis of these common polymer additives. This is illustrated in Figure 1.13. In the FAB spectrum of dilaurylthiopropionate in Figure 1.13 only a small peak resulting from the potassium attached molecular species appears. Fragmentation is substantial and corresponds to cleavage of the ester links with an m/z of 329, which further fragments to yield prominent ions with m/z of 133, 144 and 161. Laser desorption spectra acquired by carbon dioxide (Figure 1.13b) and Nd:YAG (Figure 1.13c) laser absorption, contrast substantially with the FAB spectra. Abundant molecular ion species are observed in the laser absorption spectra.
These ions are a combination of (M + H)+, (M + Na)+, and (M + K)+, depending upon the relative abundance of alkali metal salts present in the sample. Present in the CO2 spectra of both dilaurylthiodipropionate (DLTDP) in Figure 1.13b are fragment ions with m/z329 and m/z 413 that correspond to ester cleavages, as observed in the FAB spectra. In contrast, Nd:YAG spectra of DLTDP in Figure 1.13c each primarily contain a strong ion signal corresponding to cation attachment to the intact molecules.
In addition to dialkylthiopropionate secondary antioxidants a similar situation was shown to apply in the case of higher MW compounds with thioester functionalities, e.g., Seenox 4125 with a MW of 1156, also hindered phenols, alkyl phosphites are polyhindered amines and Irganox 1050.
Waddell and co-workers [64] applied this technique to Neoprene rubber compound surfaces. The LD-MS of the sulfur-vulcanised natural rubber (NR) Compounds #1 and
26
Determination of Additives in Polymers and Rubbers
Figure 1.13 Comparison of positive ion spectra of DLTDP acquired by (a) FAB, (b) CO2
LD-FTMS and (c) Nd:YAG LD-FTMSReproduced from Johlman and co-workers, American Chemical Society [63]
27
Direct Determination of Additives in Polymers and Rubbers
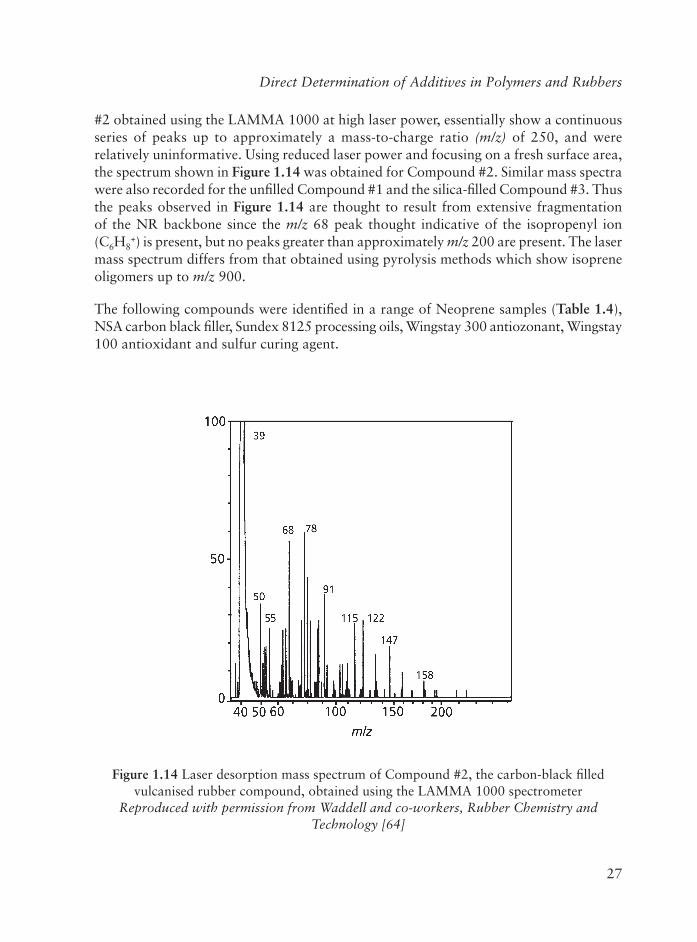
#2 obtained using the LAMMA 1000 at high laser power, essentially show a continuous series of peaks up to approximately a mass-to-charge ratio (m/z) of 250, and were relatively uninformative. Using reduced laser power and focusing on a fresh surface area, the spectrum shown in Figure 1.14 was obtained for Compound #2. Similar mass spectra were also recorded for the unfi lled Compound #1 and the silica-fi lled Compound #3. Thus the peaks observed in Figure 1.14 are thought to result from extensive fragmentation of the NR backbone since the m/z 68 peak thought indicative of the isopropenyl ion (C6H8
+) is present, but no peaks greater than approximately m/z 200 are present. The laser mass spectrum differs from that obtained using pyrolysis methods which show isoprene oligomers up to m/z 900.
The following compounds were identifi ed in a range of Neoprene samples (Table 1.4),NSA carbon black fi ller, Sundex 8125 processing oils, Wingstay 300 antiozonant, Wingstay 100 antioxidant and sulfur curing agent.
Figure 1.14 Laser desorption mass spectrum of Compound #2, the carbon-black fi lled vulcanised rubber compound, obtained using the LAMMA 1000 spectrometer
Reproduced with permission from Waddell and co-workers, Rubber Chemistry and Technology [64]
28
Determination of Additives in Polymers and Rubbers
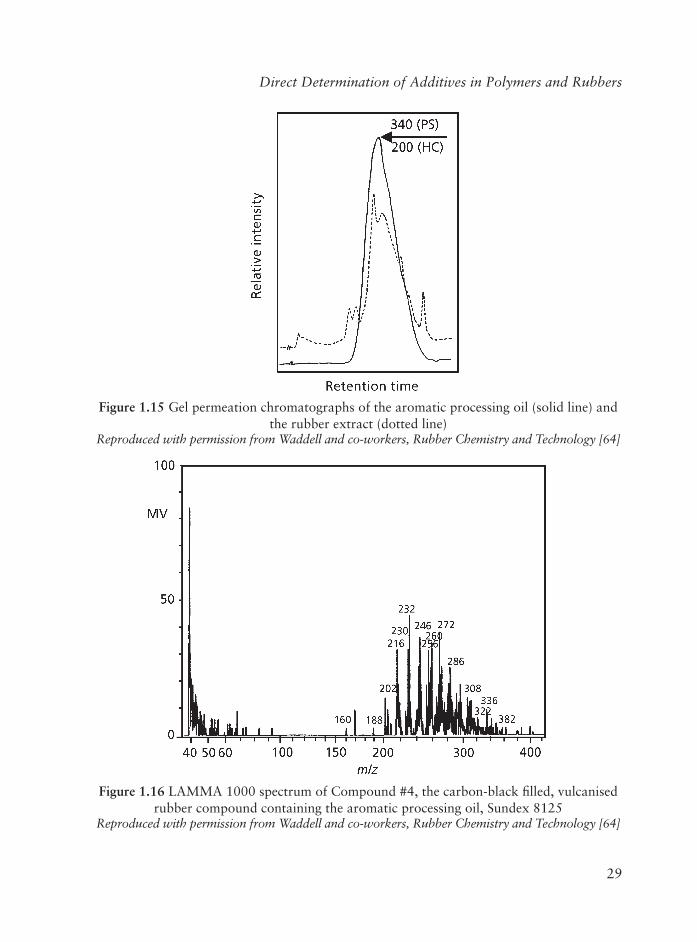
Regarding the processing oil, GPC of an authentic sample of Sundex 8125 aromatic processing oil and of an extract of cured Neoprene rubber containing this oil (Figure 1.15)shows that the processing oil is a mixture having components with a broad distribution of MW. Using a hydrocarbon as the GPC standard, the average MW of the processing oil is assigned a value of 200, however, using PS as a standard, affords a MW of 340. The MW reported by the manufacturer is 395. The direct surface analysis of Compound #4 by LD-MS (Figure 1.16) gives a spectrum having a series of mass peaks with values ranging from m/z of about 200 to 360, centred around an m/z value of approximately 260. These peaks are thought to be due to the molecular ions (M+) of the various components comprising the aromatic processing oil created by loss of an electron from the aromatic ring.
The discrepancy in MW distribution of the oil from that reported might be due to the relative diffusion characteristics of the lower MW and more volatile components in the oil which can be expected to result in their higher rubber surface concentrations as determined by direct analysis of the compound by LD-MS.
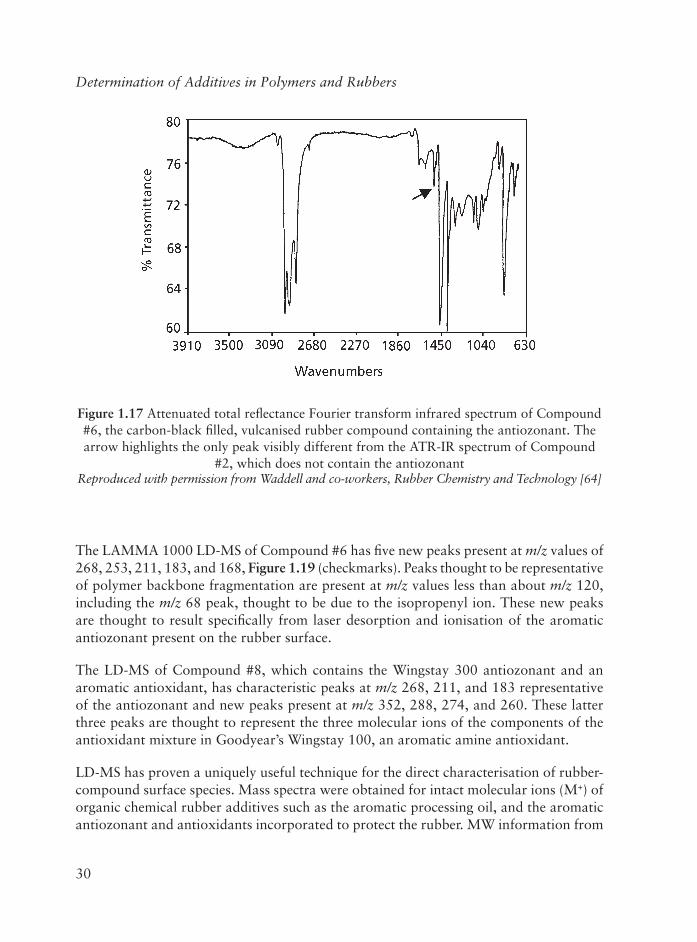
The ATR-IR spectrum of rubber Compound #6 that contains the antiozonant has one clearly visible additional peak at 1470 cm-1, Figure 1.17 (arrow). The IR difference spectrum (Compound #6 - Compound #2), in Figure 1.18 reveals approximately six peaks (checkmarks) thought to be characteristic of the added antiozonant that might be used for its identifi cation in a cured rubber compound since these peaks are present in the IR of the antiozonant, Figure 1.18b (checkmarks).
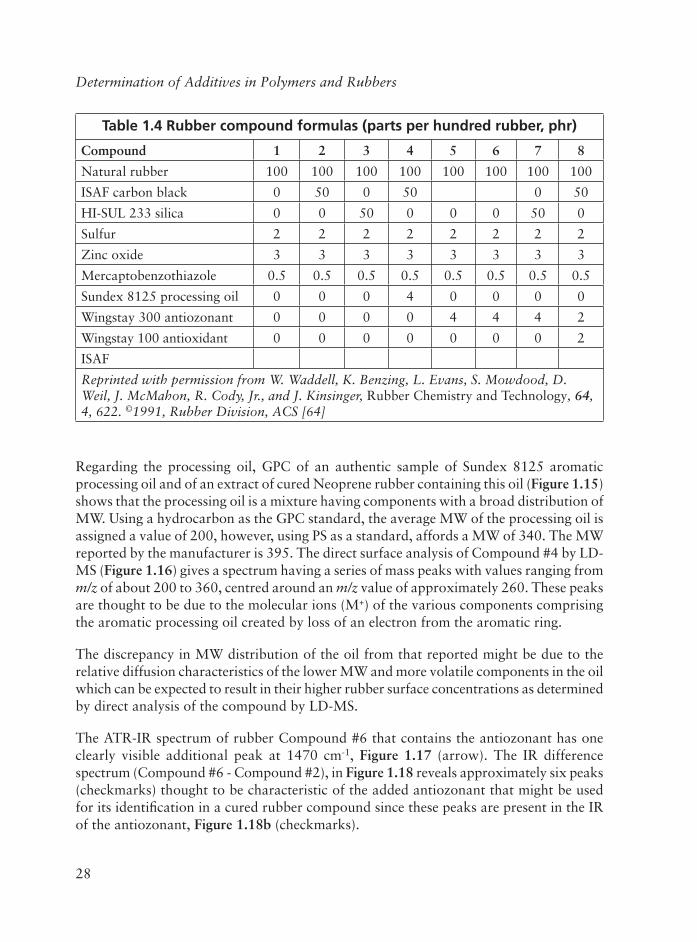
Table 1.4 Rubber compound formulas (parts per hundred rubber, phr)
Compound 1 2 3 4 5 6 7 8
Natural rubber 100 100 100 100 100 100 100 100
ISAF carbon black 0 50 0 50 0 50
HI-SUL 233 silica 0 0 50 0 0 0 50 0
Sulfur 2 2 2 2 2 2 2 2
Zinc oxide 3 3 3 3 3 3 3 3
Mercaptobenzothiazole 0.5 0.5 0.5 0.5 0.5 0.5 0.5 0.5
Sundex 8125 processing oil 0 0 0 4 0 0 0 0
Wingstay 300 antiozonant 0 0 0 0 4 4 4 2
Wingstay 100 antioxidant 0 0 0 0 0 0 0 2
ISAF
Reprinted with permission from W. Waddell, K. Benzing, L. Evans, S. Mowdood, D. Weil, J. McMahon, R. Cody, Jr., and J. Kinsinger, Rubber Chemistry and Technology, 64,4, 622. ©1991, Rubber Division, ACS [64]
29
Direct Determination of Additives in Polymers and Rubbers
Figure 1.15 Gel permeation chromatographs of the aromatic processing oil (solid line) and the rubber extract (dotted line)
Reproduced with permission from Waddell and co-workers, Rubber Chemistry and Technology [64]
Figure 1.16 LAMMA 1000 spectrum of Compound #4, the carbon-black fi lled, vulcanised rubber compound containing the aromatic processing oil, Sundex 8125
Reproduced with permission from Waddell and co-workers, Rubber Chemistry and Technology [64]
30
Determination of Additives in Polymers and Rubbers
The LAMMA 1000 LD-MS of Compound #6 has fi ve new peaks present at m/z values of 268, 253, 211, 183, and 168, Figure 1.19 (checkmarks). Peaks thought to be representative of polymer backbone fragmentation are present at m/z values less than about m/z 120,including the m/z 68 peak, thought to be due to the isopropenyl ion. These new peaks are thought to result specifi cally from laser desorption and ionisation of the aromatic antiozonant present on the rubber surface.
The LD-MS of Compound #8, which contains the Wingstay 300 antiozonant and an aromatic antioxidant, has characteristic peaks at m/z 268, 211, and 183 representative of the antiozonant and new peaks present at m/z 352, 288, 274, and 260. These latter three peaks are thought to represent the three molecular ions of the components of the antioxidant mixture in Goodyear’s Wingstay 100, an aromatic amine antioxidant.
LD-MS has proven a uniquely useful technique for the direct characterisation of rubber-compound surface species. Mass spectra were obtained for intact molecular ions (M+) of organic chemical rubber additives such as the aromatic processing oil, and the aromatic antiozonant and antioxidants incorporated to protect the rubber. MW information from
Figure 1.17 Attenuated total refl ectance Fourier transform infrared spectrum of Compound #6, the carbon-black fi lled, vulcanised rubber compound containing the antiozonant. The arrow highlights the only peak visibly different from the ATR-IR spectrum of Compound
#2, which does not contain the antiozonantReproduced with permission from Waddell and co-workers, Rubber Chemistry and Technology [64]
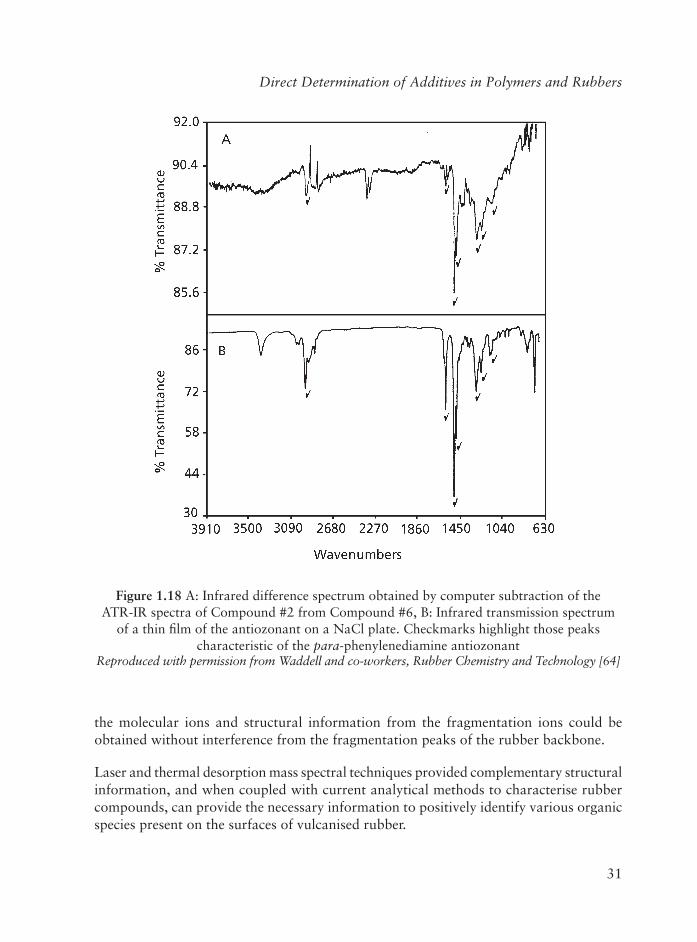
31
Direct Determination of Additives in Polymers and Rubbers
the molecular ions and structural information from the fragmentation ions could be obtained without interference from the fragmentation peaks of the rubber backbone.
Laser and thermal desorption mass spectral techniques provided complementary structural information, and when coupled with current analytical methods to characterise rubber compounds, can provide the necessary information to positively identify various organic species present on the surfaces of vulcanised rubber.
Figure 1.18 A: Infrared difference spectrum obtained by computer subtraction of the ATR-IR spectra of Compound #2 from Compound #6, B: Infrared transmission spectrum
of a thin fi lm of the antiozonant on a NaCl plate. Checkmarks highlight those peaks characteristic of the para-phenylenediamine antiozonant
Reproduced with permission from Waddell and co-workers, Rubber Chemistry and Technology [64]
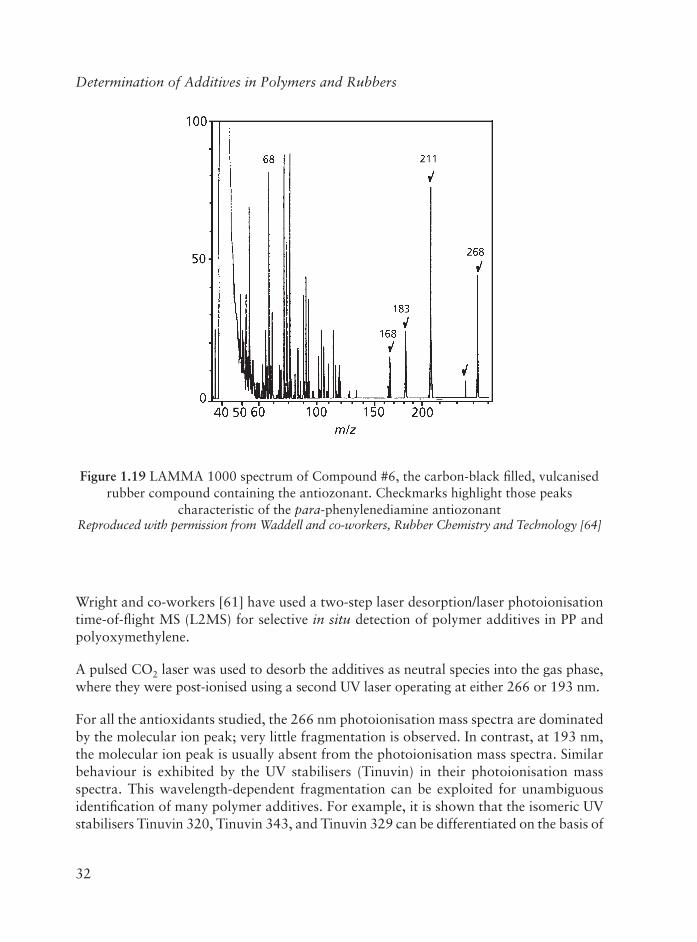
32
Determination of Additives in Polymers and Rubbers
Wright and co-workers [61] have used a two-step laser desorption/laser photoionisation time-of-fl ight MS (L2MS) for selective in situ detection of polymer additives in PP and polyoxymethylene.
A pulsed CO2 laser was used to desorb the additives as neutral species into the gas phase, where they were post-ionised using a second UV laser operating at either 266 or 193 nm.
For all the antioxidants studied, the 266 nm photoionisation mass spectra are dominated by the molecular ion peak; very little fragmentation is observed. In contrast, at 193 nm, the molecular ion peak is usually absent from the photoionisation mass spectra. Similar behaviour is exhibited by the UV stabilisers (Tinuvin) in their photoionisation mass spectra. This wavelength-dependent fragmentation can be exploited for unambiguous identifi cation of many polymer additives. For example, it is shown that the isomeric UV stabilisers Tinuvin 320, Tinuvin 343, and Tinuvin 329 can be differentiated on the basis of
Figure 1.19 LAMMA 1000 spectrum of Compound #6, the carbon-black fi lled, vulcanised rubber compound containing the antiozonant. Checkmarks highlight those peaks
characteristic of the para-phenylenediamine antiozonantReproduced with permission from Waddell and co-workers, Rubber Chemistry and Technology [64]
33
Direct Determination of Additives in Polymers and Rubbers
the extent or nature of the observed fragmentation in their photoionisation mass spectra. Several commercial polymer formulations containing these types of additives have also been analysed using this experimental approach: the samples were interrogated directly without any pretreatment or extraction. It is shown that UV laser post-ionisation enables selective detection of the additives in preference to the polymer, providing unambiguous insitu identifi cation. The potential of this technique for surface analysis and depth profi ling is also discussed.
There are many advantages to be gained in being able to chemically speciate additives directly from the polymer matrix as opposed to methods involving a preliminary solvent extraction of the additives from the polymer prior to MS (see Chapter 3) [43, 61, 65-73].
Laser desorption/laser photoionisation time-of-fl ight mass spectrometry is a technique that has great potential for the direct analysis of molecular species from complex host matrices. This two-step approach circumvents many of the problems that have been encountered with other techniques. In this method, a pulsed CO2 laser is used to desorb the analyte into the gas phase as a neutral species, directly from the sample of interest. A second pulse from a UV laser is then used to post-ionise these gas phase neutral species, generally using a resonance-enhanced multiphoton ionisation (REMPI) scheme. The benefi ts of this two-step approach lie in the spatial and temporal separation of the desorption and ionisation events, thereby enabling the independent optimisation of each process. This provides a number of advantages for the in situ analysis of bulk polymer samples: (i) desorption of neutral target molecules from the host polymer matrix with minimal decomposition, (ii) soft ionisation of the desorbed neutral species, resulting in readily interpretable mass spectra, (iii) selective ionisation of polymer additives which have a signifi cant one-photon absorption cross section at the chosen ionisation wavelength, and (iv) highly sensitive detection of many polymer additive species.
The two different ionisation laser wavelengths result in markedly different mass spectra. These mass spectral differences are a valuable aid in the unambiguous identifi cation of the additives. Wright and co-workers [61] also reported that the spectra obtained show not only that it is possible to directly detect these additives in the polymer formulations, but also that chemical changes undergone by antioxidants, due to either processing or ageing, can also be observed.
The additives included in this study are shown in Table 1.5.
Antioxidants. The mass spectra obtained for Irganox 1330, Irgafos 168, and Santowhite using 266 and 193 nm photoionisation are shown in Figure 1.20. In the case of Irganox 1330, the spectra at both these wavelengths are dominated by the molecular ion peak at m/z = 774. However, it is evident that 266 nm photoionisation results in the production of fragment ions different than those observed at 193 nm. At 266 nm, a fragment is observed
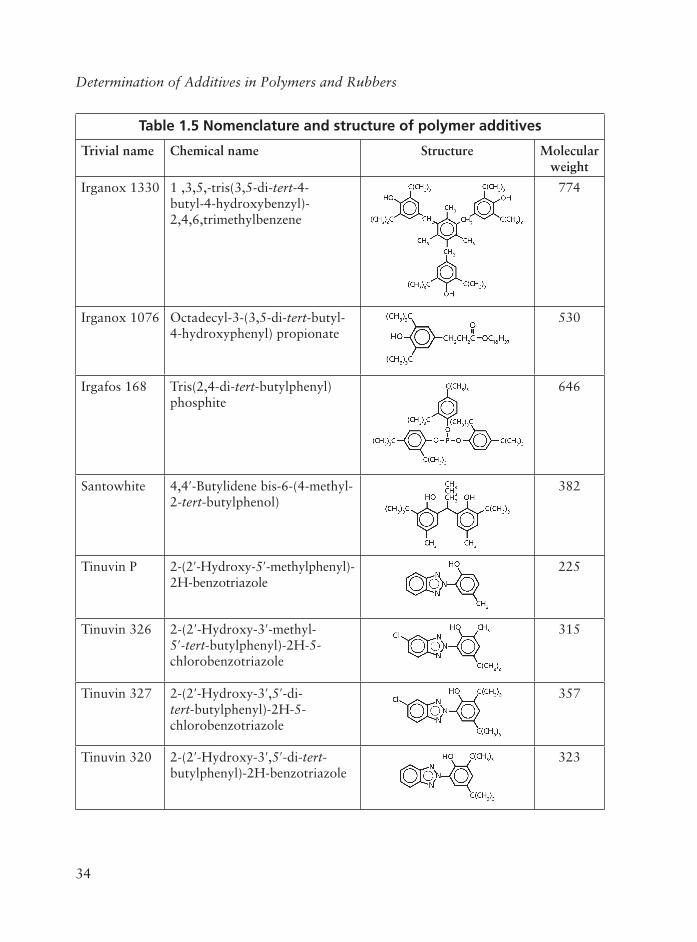
34
Determination of Additives in Polymers and Rubbers
Table 1.5 Nomenclature and structure of polymer additives
Trivial name Chemical name Structure Molecular weight
Irganox 1330 1 ,3,5,-tris(3,5-di-tert-4-butyl-4-hydroxybenzyl)-2,4,6,trimethylbenzene
774
Irganox 1076 Octadecyl-3-(3,5-di-tert-butyl-4-hydroxyphenyl) propionate
530
Irgafos 168 Tris(2,4-di-tert-butylphenyl)phosphite
646
Santowhite 4,4 -Butylidene bis-6-(4-methyl-2-tert-butylphenol)
382
Tinuvin P 2-(2 -Hydroxy-5 -methylphenyl)-2H-benzotriazole
225
Tinuvin 326 2-(2 -Hydroxy-3 -methyl-5 -tert-butylphenyl)-2H-5-chlorobenzotriazole
315
Tinuvin 327 2-(2 -Hydroxy-3 ,5 -di-tert-butylphenyl)-2H-5-chlorobenzotriazole
357
Tinuvin 320 2-(2 -Hydroxy-3 ,5 -di-tert-butylphenyl)-2H-benzotriazole
323
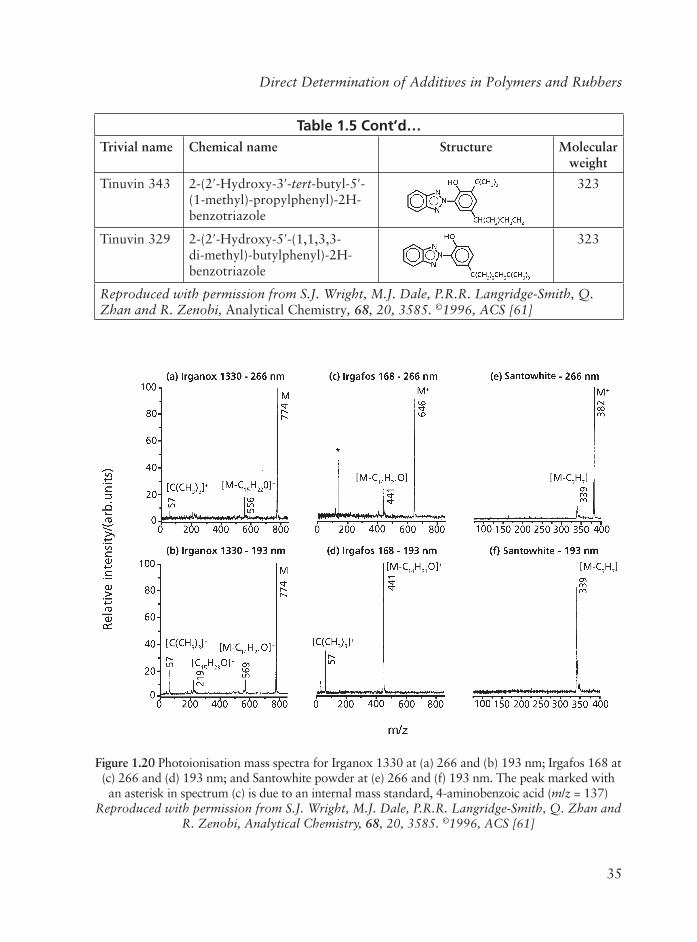
35
Direct Determination of Additives in Polymers and Rubbers
Figure 1.20 Photoionisation mass spectra for Irganox 1330 at (a) 266 and (b) 193 nm; Irgafos 168 at (c) 266 and (d) 193 nm; and Santowhite powder at (e) 266 and (f) 193 nm. The peak marked with an asterisk in spectrum (c) is due to an internal mass standard, 4-aminobenzoic acid (m/z = 137)
Reproduced with permission from S.J. Wright, M.J. Dale, P.R.R. Langridge-Smith, Q. Zhan and R. Zenobi, Analytical Chemistry, 68, 20, 3585. ©1996, ACS [61]
Table 1.5 Cont’d…Trivial name Chemical name Structure Molecular
weight
Tinuvin 343 2-(2 -Hydroxy-3 -tert-butyl-5 -(1-methyl)-propylphenyl)-2H-benzotriazole
323
Tinuvin 329 2-(2 -Hydroxy-5 -(1,1,3,3-di-methyl)-butylphenyl)-2H-benzotriazole
323
Reproduced with permission from S.J. Wright, M.J. Dale, P.R.R. Langridge-Smith, Q. Zhan and R. Zenobi, Analytical Chemistry, 68, 20, 3585. ©1996, ACS [61]
36
Determination of Additives in Polymers and Rubbers
at m/z = 556. This is thought to result from loss of a 3,5-di-tert-butyl-4-hydroxybenzyl side group, with a concomitant hydrogen rearrangement. A weaker fragment peak at m/z = 57,due to the tert-butyl ion, can also be seen.
Photoionisation of Irganox 1330 at 193 nm produces fragments at m/z = 57, 219, and 569. The fragment at m/z = 569 corresponds to the loss of a 3,5-di-tert-butyl-4-phenol side group via direct cleavage rather than rearrangement. The peak at m/z = 219 is characteristic of positive ion mass spectra of dibutyl phenols and corresponds to the 3,5-di-tert-butyl-4-hydroxybenzyl ion. The peak at m/z = 57 corresponds to the tert-butyl ion.
Similar characteristics were observed in the mass spectra for Irganox 1076 (not shown). When 266 nm radiation is used, the molecular ion can be clearly identifi ed at m/z = 530. At 193 nm, no molecular ion peak is seen. Instead, the base peak of the mass spectrum is at m/z = 515, corresponding to the loss of a methyl radical from the molecular ion.
In summary, for all the antioxidants studied, the mass spectra obtained using photoionisation at 266 nm are dominated by molecular ion signals, with very little fragmentation. With the exception of Irganox 1330, photoionisation using 193 nm radiation generated little or no molecular ion signal. There are two possible explanations for this apparent wavelength dependence. Most organic molecules have ionisation potentials (IP) in the range 7-10 eV. The energy of 266 nm photons is ~4.66 eV, whereas a 193 nm photon has an associated energy of 6.42 eV. In both cases, therefore, absorption of two photons is required in order to achieve ionisation. However, absorption of the fi rst 193 nm photon can result in different intermediate electronic states being accessed compared to excitation at 266 nm, such as Rydberg states. It is possible that this may lead to different ionisation pathways being promoted, resulting in differing mass spectra at 193 versus 266 nm. Alternatively, the difference may simply be due to the difference in excess energy deposited initially in the molecular ion. Assuming an ionisation potential of 8 eV, photoionisation at 266 nm will produce a molecular ion with up to 1.32 eV of excess energy. This is small compared to the excess energy of up to 4.84 eV possible following photoionisation at 193 nm. This larger excess energy may be suffi cient to exceed the appearance potential for the production of the most facile fragment ions. Therefore, at 193 nm, ionisation would be accompanied by facile fragmentation. The data available do not permit identifi cation of which of these two mechanisms may be responsible for the different fragmentation patterns observed.
UV Stabilisers
Similarly 266 and 193 nm photoionisation mass spectral data showed that in general the photoionisation mass spectra of the Tinuvin UV stabilisers examined differ markedly at 266 and 193 nm. At 266 nm, the mass spectra are dominated by molecular ion signals,
37
Direct Determination of Additives in Polymers and Rubbers
with very little associated fragmentation. This nicely illustrates the advantage of L2MS as a soft ionisation technique, enabling readily interpretable mass spectra to be generated. Photoionisation at 193 nm, however, results in mass spectra in which the base peaks are fragment ions. This difference in behaviour may be due either to the difference in excess energy deposited in the molecular ion or to excitation via different intermediate states, as discussed earlier.
Clearly, any technique that can provide chemical analysis of target analytes at trace levels directly from their host matrix represents an attractive and rapid methodology. The feature of the technique that allows this to be achieved is the selectivity provided by the photoionisation process. Most organic molecules have ionisation potentials between 7 and 10 eV. To achieve ionisation, absorption of two or more UV photons is required. For effi cient photoionisation, a molecule must have a signifi cant absorption cross section at the wavelength of the ionising radiation used. Molecules that do not possess a suitable chromophore will not be effi ciently ionised. Therefore, by careful choice of the ionisation laser wavelength, the target analyte of interest may be selectively detected in preference to other components present in the mixture, including the host matrix. Wright and co-workers [61] showed that polymer additives with an appreciable absorption in the UV region of the spectrum can be selectively ionised in preference to the non-UV-absorbing host polymer.
They examined a sample of PP containing 0.15 wt% of Irganox 1330 and 0.05 wt% of Irgafos 168. The mass spectra obtained using 266 and 193 nm photoionisation following direct desorption from the PP matrix are shown in Figure 1.21. To obtain an appreciable signal from this sample, it was necessary to increase the desorption laser power density 4-fold, to ~38 MW/cm2, compared to the value used to desorb the pure polymer additives. The need for increased laser desorption power densities is due to the PP matrix having a very low absorbance at the desorption laser wavelength of 10.6 nm. In the spectrum obtained at 266 nm, the molecular ions for both Irganox 1330 (m/z = 774) and Irgafos 168 (m/z = 646) are present. For ionisation at 193 nm, the molecular ion signals are very much weaker. However, a strong characteristic fragment signal at m/z = 441, anticipated from the 193 nm photoionisation mass spectrum of pure Irgafos 168 (see Figure 1.20d),can be seen. This peak is due to the loss of a 2,4-di-tert-butylphenyl—O group from the molecular ion, as is seen in the corresponding spectrum for the pure compound. These spectra demonstrate that, by use of two readily available ionisation wavelengths, and with reference to the corresponding spectra for the pure additives, it is possible to unambiguously determine the presence of Irganox 1330 and Irgafos 168 directly from the host PP matrix.
An apparently anomalous peak at m/z = 662 is observed in the 266 nm photoionisation MS (see Figure 1.21a) which is due to a phosphate antioxidant which is generally due to an oxidation product of the Irgafl ox 168 phosphite secondary antioxidant, i.e., it is possible to determine not only the active phosphate level in the polymer but also the
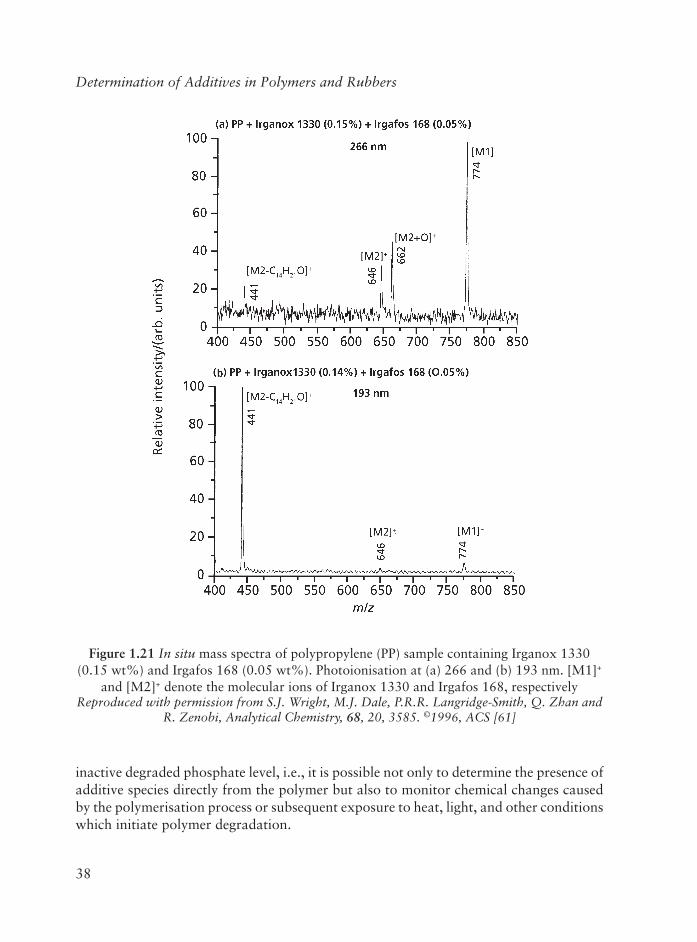
38
Determination of Additives in Polymers and Rubbers
inactive degraded phosphate level, i.e., it is possible not only to determine the presence of additive species directly from the polymer but also to monitor chemical changes caused by the polymerisation process or subsequent exposure to heat, light, and other conditions which initiate polymer degradation.
Figure 1.21 In situ mass spectra of polypropylene (PP) sample containing Irganox 1330 (0.15 wt%) and Irgafos 168 (0.05 wt%). Photoionisation at (a) 266 and (b) 193 nm. [M1]+
and [M2]+ denote the molecular ions of Irganox 1330 and Irgafos 168, respectivelyReproduced with permission from S.J. Wright, M.J. Dale, P.R.R. Langridge-Smith, Q. Zhan and
R. Zenobi, Analytical Chemistry, 68, 20, 3585. ©1996, ACS [61]
39
Direct Determination of Additives in Polymers and Rubbers
In conclusion, Wright and co-workers [61] have shown that marked differences in the photofragmentation behaviour at 266 and 193 nm, allow unambiguous identifi cation of these additives, even including differentiation between isomeric species. It has also proved possible to detect antioxidants and UV stabilisers in PP and polyoxymethylene polymers at concentrations consistent with commercial polymer formulations. In the case of the PP polymer formulation, it has been possible to detect an oxidation product of the antioxidant Irgafos 168 formed during either processing or natural ageing of the polymer. Such measurements could be extended to allow monitoring of additive degradation levels in aged polymer samples.
This study has also demonstrated the potential of L2MS as a surface analytical technique. It has been shown that it is possible to detect species on the surfaces of polymers which are not present in the bulk of the sample. It should prove possible to extend this work using spatially resolved desorption to probe for additive migration and aggregation.
Zhan and co-workers [65] have also reported on the application of two-step laser MS to the determination of surface antioxidants and the UV stablisers on PE and PET. They showed that laser melting-depth profi ling could be achieved in polyoxymethylene, which enabled the determination of the special distribution of an antioxidant in an injection moulded test bar.
Laser Desorption EI-FT Ion Cyclotron MS (LD-EI-FT-ICR-MS)
As industrial thermoplastics are melt processed, they undergo oxidation reactions leading to changes in molecular weight and colour. Phosphite antioxidants [66-69] are generally considered to be secondary antioxidants, and their function is to control polymer molecular weight and colour. Phosphite stabilisers are used in most common thermoplastics at levels from 250 ppm to 2%. Typical phosphite loadings are often less than 1000 ppm. Phosphite stabilisers react with hydroperoxides, peroxy radicals, alkoxy radicals, and olefi nic and carbonyl moieties; in addition, phosphites form co-ordination complexes with metals, changing their potential activity [70, 71].
Since the additive level in the polymer affects its stability, the analysis of polymer additives immediately poses two basic analytical questions: fi rst, how much of the additive gets into the polymer during compounding, and second, how much of the additive that was added remains as the original phosphite form? Conventional methods for isolation and detection of phosphite additives are generally unsatisfactory.
Phosphite antioxidant tends to fragment extensively in mass spectrometric analysis. Xiang and co-workers [72] analysed Ultranox 626 diphosphite [bis(2,4-di-tert-butylphenyl)pentaerythritol diphosphite] and its corresponding diphosphate oxidation product, XR-2502, as well as the phosphate additive, WESTON 618 diphosphite (distearyl pentaerythritol diphosphate) by Nd:YAG laser desorption 1.064 nm) electron ionisation Fourier transform
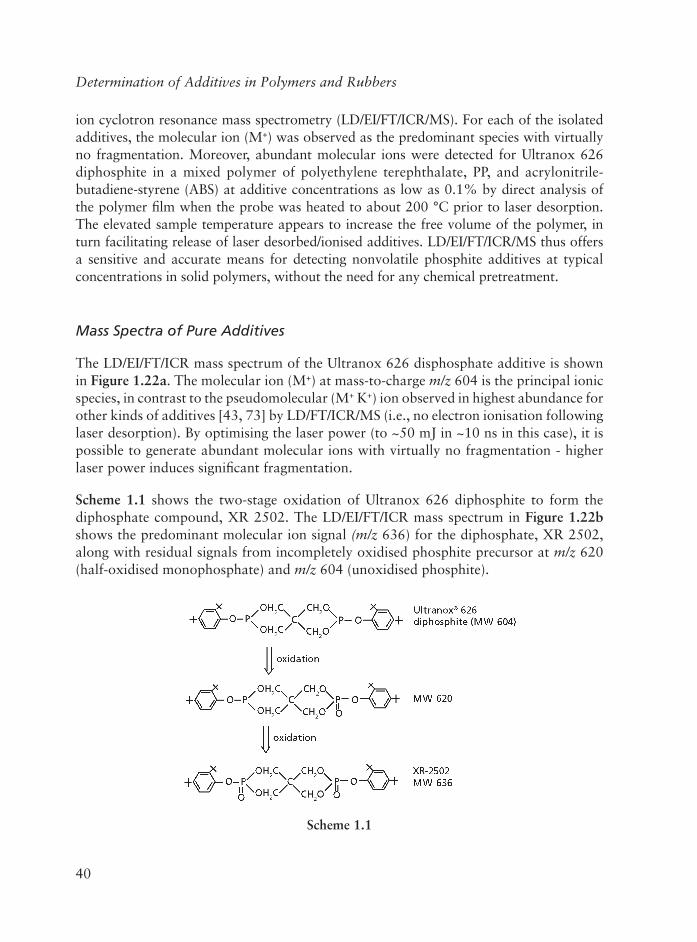
40
Determination of Additives in Polymers and Rubbers
ion cyclotron resonance mass spectrometry (LD/EI/FT/ICR/MS). For each of the isolated additives, the molecular ion (M+) was observed as the predominant species with virtually no fragmentation. Moreover, abundant molecular ions were detected for Ultranox 626 diphosphite in a mixed polymer of polyethylene terephthalate, PP, and acrylonitrile-butadiene-styrene (ABS) at additive concentrations as low as 0.1% by direct analysis of the polymer fi lm when the probe was heated to about 200 °C prior to laser desorption. The elevated sample temperature appears to increase the free volume of the polymer, in turn facilitating release of laser desorbed/ionised additives. LD/EI/FT/ICR/MS thus offers a sensitive and accurate means for detecting nonvolatile phosphite additives at typical concentrations in solid polymers, without the need for any chemical pretreatment.
Mass Spectra of Pure Additives
The LD/EI/FT/ICR mass spectrum of the Ultranox 626 disphosphate additive is shown in Figure 1.22a. The molecular ion (M+) at mass-to-charge m/z 604 is the principal ionic species, in contrast to the pseudomolecular (M+ K+) ion observed in highest abundance for other kinds of additives [43, 73] by LD/FT/ICR/MS (i.e., no electron ionisation following laser desorption). By optimising the laser power (to ~50 mJ in ~10 ns in this case), it is possible to generate abundant molecular ions with virtually no fragmentation - higher laser power induces signifi cant fragmentation.
Scheme 1.1 shows the two-stage oxidation of Ultranox 626 diphosphite to form the diphosphate compound, XR 2502. The LD/EI/FT/ICR mass spectrum in Figure 1.22bshows the predominant molecular ion signal (m/z 636) for the diphosphate, XR 2502, along with residual signals from incompletely oxidised phosphite precursor at m/z 620(half-oxidised monophosphate) and m/z 604 (unoxidised phosphite).
Scheme 1.1
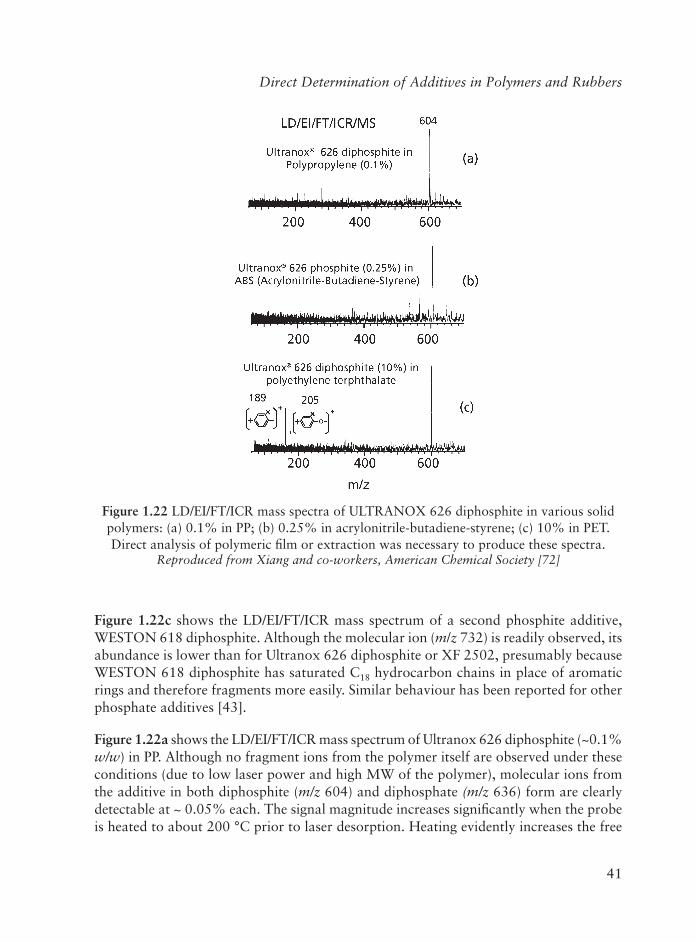
41
Direct Determination of Additives in Polymers and Rubbers
Figure 1.22 LD/EI/FT/ICR mass spectra of ULTRANOX 626 diphosphite in various solid polymers: (a) 0.1% in PP; (b) 0.25% in acrylonitrile-butadiene-styrene; (c) 10% in PET. Direct analysis of polymeric fi lm or extraction was necessary to produce these spectra.
Reproduced from Xiang and co-workers, American Chemical Society [72]
Figure 1.22c shows the LD/EI/FT/ICR mass spectrum of a second phosphite additive, WESTON 618 diphosphite. Although the molecular ion (m/z 732) is readily observed, its abundance is lower than for Ultranox 626 diphosphite or XF 2502, presumably because WESTON 618 diphosphite has saturated C18 hydrocarbon chains in place of aromatic rings and therefore fragments more easily. Similar behaviour has been reported for other phosphate additives [43].
Figure 1.22a shows the LD/EI/FT/ICR mass spectrum of Ultranox 626 diphosphite (~0.1% w/w) in PP. Although no fragment ions from the polymer itself are observed under these conditions (due to low laser power and high MW of the polymer), molecular ions from the additive in both diphosphite (m/z 604) and diphosphate (m/z 636) form are clearly detectable at ~ 0.05% each. The signal magnitude increases signifi cantly when the probe is heated to about 200 °C prior to laser desorption. Heating evidently increases the free
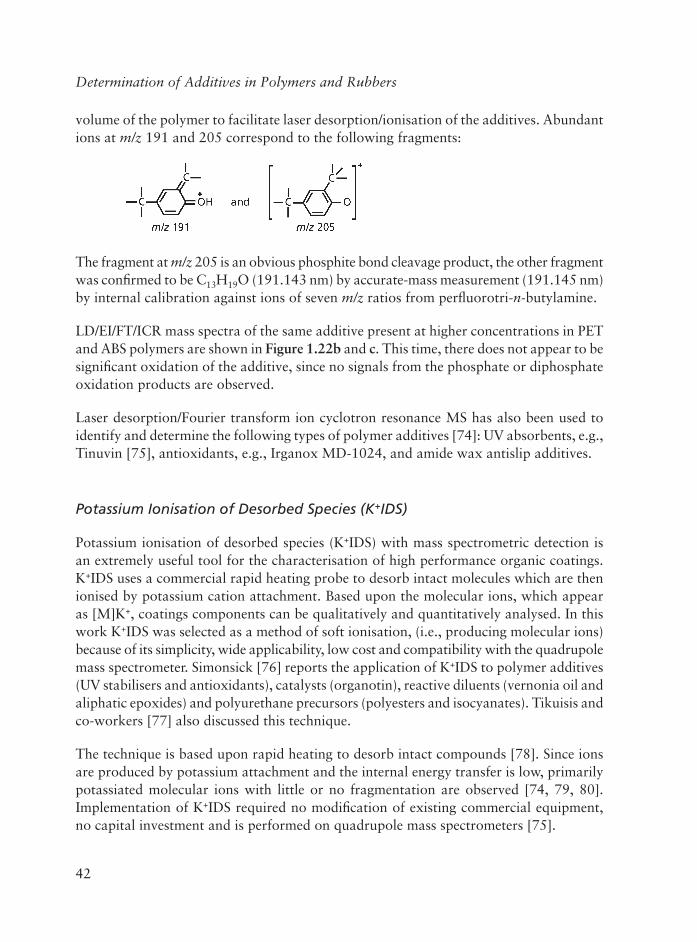
42
Determination of Additives in Polymers and Rubbers
volume of the polymer to facilitate laser desorption/ionisation of the additives. Abundant ions at m/z 191 and 205 correspond to the following fragments:
The fragment at m/z 205 is an obvious phosphite bond cleavage product, the other fragment was confi rmed to be C13H19O (191.143 nm) by accurate-mass measurement (191.145 nm) by internal calibration against ions of seven m/z ratios from perfl uorotri-n-butylamine.
LD/EI/FT/ICR mass spectra of the same additive present at higher concentrations in PET and ABS polymers are shown in Figure 1.22b and c. This time, there does not appear to be signifi cant oxidation of the additive, since no signals from the phosphate or diphosphate oxidation products are observed.
Laser desorption/Fourier transform ion cyclotron resonance MS has also been used to identify and determine the following types of polymer additives [74]: UV absorbents, e.g., Tinuvin [75], antioxidants, e.g., Irganox MD-1024, and amide wax antislip additives.
Potassium Ionisation of Desorbed Species (K+IDS)
Potassium ionisation of desorbed species (K+IDS) with mass spectrometric detection is an extremely useful tool for the characterisation of high performance organic coatings. K+IDS uses a commercial rapid heating probe to desorb intact molecules which are then ionised by potassium cation attachment. Based upon the molecular ions, which appear as [M]K+, coatings components can be qualitatively and quantitatively analysed. In this work K+IDS was selected as a method of soft ionisation, (i.e., producing molecular ions) because of its simplicity, wide applicability, low cost and compatibility with the quadrupole mass spectrometer. Simonsick [76] reports the application of K+IDS to polymer additives (UV stabilisers and antioxidants), catalysts (organotin), reactive diluents (vernonia oil and aliphatic epoxides) and polyurethane precursors (polyesters and isocyanates). Tikuisis and co-workers [77] also discussed this technique.
The technique is based upon rapid heating to desorb intact compounds [78]. Since ions are produced by potassium attachment and the internal energy transfer is low, primarily potassiated molecular ions with little or no fragmentation are observed [74, 79, 80]. Implementation of K+IDS required no modifi cation of existing commercial equipment, no capital investment and is performed on quadrupole mass spectrometers [75].
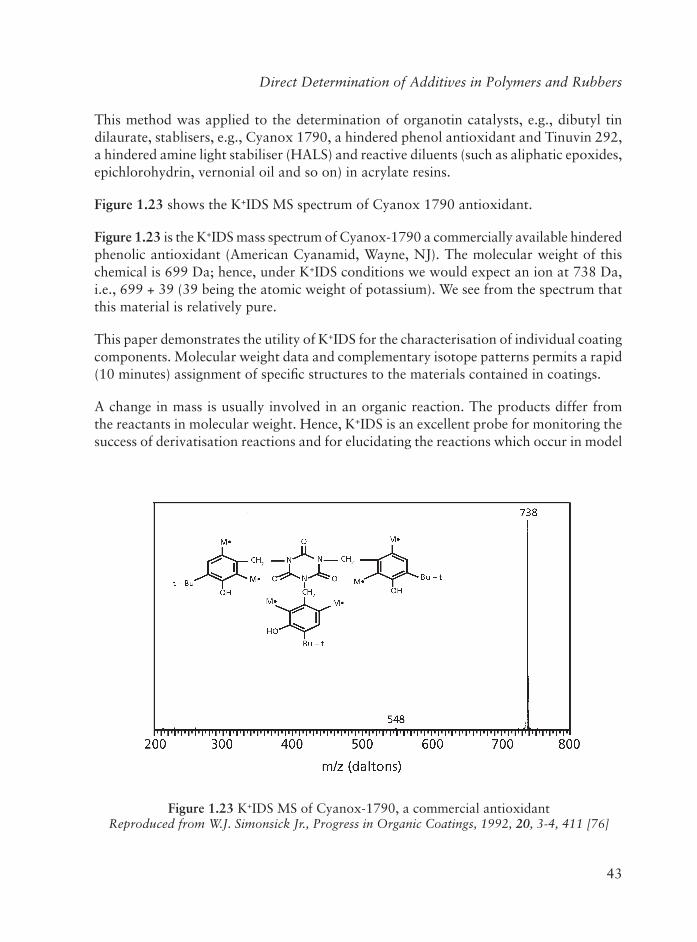
43
Direct Determination of Additives in Polymers and Rubbers
This method was applied to the determination of organotin catalysts, e.g., dibutyl tin dilaurate, stablisers, e.g., Cyanox 1790, a hindered phenol antioxidant and Tinuvin 292, a hindered amine light stabiliser (HALS) and reactive diluents (such as aliphatic epoxides, epichlorohydrin, vernonial oil and so on) in acrylate resins.
Figure 1.23 shows the K+IDS MS spectrum of Cyanox 1790 antioxidant.
Figure 1.23 is the K+IDS mass spectrum of Cyanox-1790 a commercially available hindered phenolic antioxidant (American Cyanamid, Wayne, NJ). The molecular weight of this chemical is 699 Da; hence, under K+IDS conditions we would expect an ion at 738 Da, i.e., 699 + 39 (39 being the atomic weight of potassium). We see from the spectrum that this material is relatively pure.
This paper demonstrates the utility of K+IDS for the characterisation of individual coating components. Molecular weight data and complementary isotope patterns permits a rapid (10 minutes) assignment of specifi c structures to the materials contained in coatings.
A change in mass is usually involved in an organic reaction. The products differ from the reactants in molecular weight. Hence, K+IDS is an excellent probe for monitoring the success of derivatisation reactions and for elucidating the reactions which occur in model
Figure 1.23 K+IDS MS of Cyanox-1790, a commercial antioxidantReproduced from W.J. Simonsick Jr., Progress in Organic Coatings, 1992, 20, 3-4, 411 [76]
44
Determination of Additives in Polymers and Rubbers
crosslinking chemistries. Finally, using selective chemical degradation coupled with K+IDSanalysis of the products, one is able to assemble the original network structure.
Fast Atom Bombardment (FAB)
Sterically hindered phenols and other additives containing thioesters, phosphonites and hindered amine moieties were analysed by LD-FT-MS and FAB-MS [81]. The LD technique was preferred for analysis of polymer additives because of undesirable fragmentation from FAB techniques.
Chang and co-workers applied FAB-MS to the measurement of HALS in polymers. The technique has also been applied to the measurement of oligomers up to decamer in polymers [82].
High Frequency Collision Induced Dissociation (CID)
This technique has been used to analyse the effect of internal energy deposition on the collision induced dissociation (CID) fragmentation spectra of Irganox 1076. Four different ionisation techniques were compared. The variation in the relative yields of the different fragmentation ions was attributed to differences in the amount of internal energy transferred to the precursor ions during the ionisation process. A fi ve component mixture of antioxidants and UV stabilisers has been analysed by high energy MS and high energy CID using a four sector instrument and a time-of-fl ight MS [83] and by electrospray ionisation with high energy CID [84].
Secondary Ion Mass Spectrometry (SIMS)
The principles of this technique have been discussed by Shick and co-workers [85] and O’Toole and co-workers [86]. Time-of-fl ight SIMS with either gallium or indium primary beams has been evaluated as a method for measuring the homogeneity of distribution of a hindered amine antioxidant in low-density polyethylene. The parent ion for the oligomer at m/z 599 was so weak that it could not be used to map the distribution of the additive throughout its most commonly used concentration range (0.1 to 0.5% w/w) in polyethylene. Instead a mass fragment at m/z 58 was found to be suffi ciently clear of interferences for use as a surrogate for the parent ion. As a result, imaging of the antioxidant distribution was possible to concentrations as low as 0.1% and a linear concentration calibration curve was obtained. The use of an indium primary beam improved the correlation of the antioxidant. Furthermore, indium reduced the contribution from the polyethylene background at m/z 58 in relation to the total counts acquired.
45
Direct Determination of Additives in Polymers and Rubbers
Rudewicz and Munson [45] used this technique for the direct determination of additives in PP. The technique has also been used to determine oligomers in polyacrylates, PEG, siloxanes and polycarbonates [87], polyglycols [88] and adhesion promoters, primers and additives in the surface of PET fi lm [89], volatile antioxidants in styrene-butadiene rubbers [34, 50], mercaptobenzothiazole sulfenamide accelerator in rubber vulcanisates [90] and divinyl benzene in styrene-divinyl benzene copolymer [91].
Maldi Mass Spectrometry
Hanton [92] applied MALDI spectroscopy and electrospray ionisation MS to the characterisation of polymers used in coatings. Taguchi and co-workers [93] have developed a novel method for the direct analysis of small amounts of an oligomeric HALS occluded in PP material to study its photostabilising action on the basis of matrix-assisted laser desorption/ionisation mass spectrometry (MALDI-MS) using a solid sampling technique while avoiding troublesome solvent extraction. In this sampling protocol, the powdered mixture of PP composite sample containing trace amounts of an oligomeric HALS, Adekastab LA-68LD (MW = 1900), and the matrix reagent (dithranol) was spotted on the sample plate, then ion exchanged water was deposited onto the mixture to make a suspension, and fi nally, the dried mixture adhered on the plate was subjected to MALDI-MS measurement. On the mass spectrum thus obtained by the solid sampling MALDI, the molecular ions of the HALS desorbed from the PP composite were clearly observed as three major series of the HALS components in the range up to about m/z 7000 with little interference by the PP substrate and the other additives. Moreover, in the MALDI-MS spectra for the UV-exposed sample, the satellite peaks around the major HALS components proved were enhanced signifi cantly, refl ecting the ability of the oxidised HALS species at the tetramethylpiperidine units to cause the photostabilising action. In addition, hydrolysed HALS species were also observed for the irradiated sample. These results suggest that not only the oxidation reaction but also the hydrolysis or decomposition of the oligomeric HALS components competitively proceeds in the PP composites during UV exposure.
Figure 1.24 shows a typical MALDI mass spectrum of intact Adekastab LA-68LD measured by the conventional dried droplet method in linear mode along with the assigned structures of the major components. Table 1.6 summarises the calculated molar mass for the assigned structures and the observed peak top m/z values of the major components. Three series of the HALS components are mainly observed as the molecular ions (M+) on the mass spectrum in the range up to about m/z 8000. Here, the precise m/z values of b1 used as an internal standard for mass calibration were determined by an additional MALDI-MS measurement in refl ector mode, confi rming that the observed ions are mostly M+. Among these, the constituents designated with bn, which are the HALS molecules completely end capped with tetramethylpiperidyl groups, show the most intense peaks. In addition, the
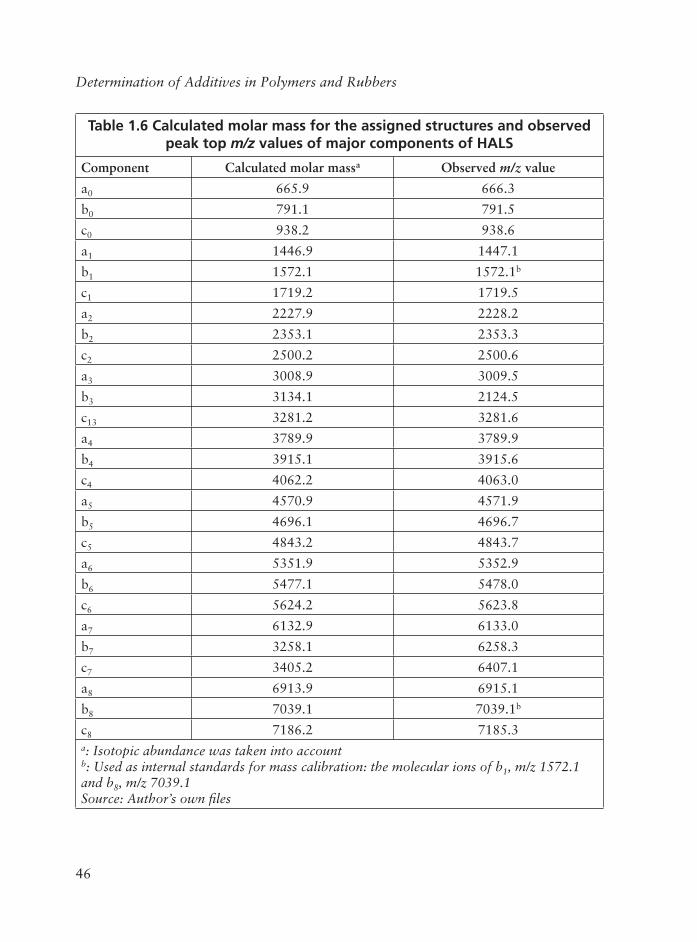
46
Determination of Additives in Polymers and Rubbers
Table 1.6 Calculated molar mass for the assigned structures and observed peak top m/z values of major components of HALS
Component Calculated molar massa Observed m/z value
a0 665.9 666.3
b0 791.1 791.5
c0 938.2 938.6
a1 1446.9 1447.1
b1 1572.1 1572.1b
c1 1719.2 1719.5
a2 2227.9 2228.2
b2 2353.1 2353.3
c2 2500.2 2500.6
a3 3008.9 3009.5
b3 3134.1 2124.5
c13 3281.2 3281.6
a4 3789.9 3789.9
b4 3915.1 3915.6
c4 4062.2 4063.0
a5 4570.9 4571.9
b5 4696.1 4696.7
c5 4843.2 4843.7
a6 5351.9 5352.9
b6 5477.1 5478.0
c6 5624.2 5623.8
a7 6132.9 6133.0
b7 3258.1 6258.3
c7 3405.2 6407.1
a8 6913.9 6915.1
b8 7039.1 7039.1b
c8 7186.2 7185.3a: Isotopic abundance was taken into accountb: Used as internal standards for mass calibration: the molecular ions of b1, m/z 1572.1 and b8, m/z 7039.1Source: Author’s own fi les
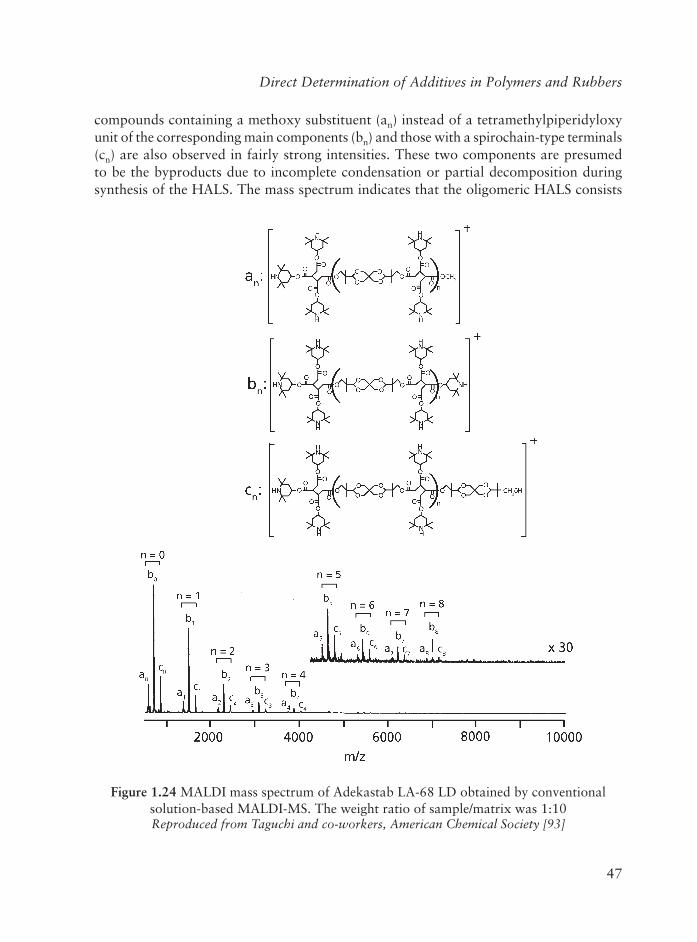
47
Direct Determination of Additives in Polymers and Rubbers
compounds containing a methoxy substituent (an) instead of a tetramethylpiperidyloxy unit of the corresponding main components (bn) and those with a spirochain-type terminals (cn) are also observed in fairly strong intensities. These two components are presumed to be the byproducts due to incomplete condensation or partial decomposition during synthesis of the HALS. The mass spectrum indicates that the oligomeric HALS consists
Figure 1.24 MALDI mass spectrum of Adekastab LA-68 LD obtained by conventional solution-based MALDI-MS. The weight ratio of sample/matrix was 1:10Reproduced from Taguchi and co-workers, American Chemical Society [93]
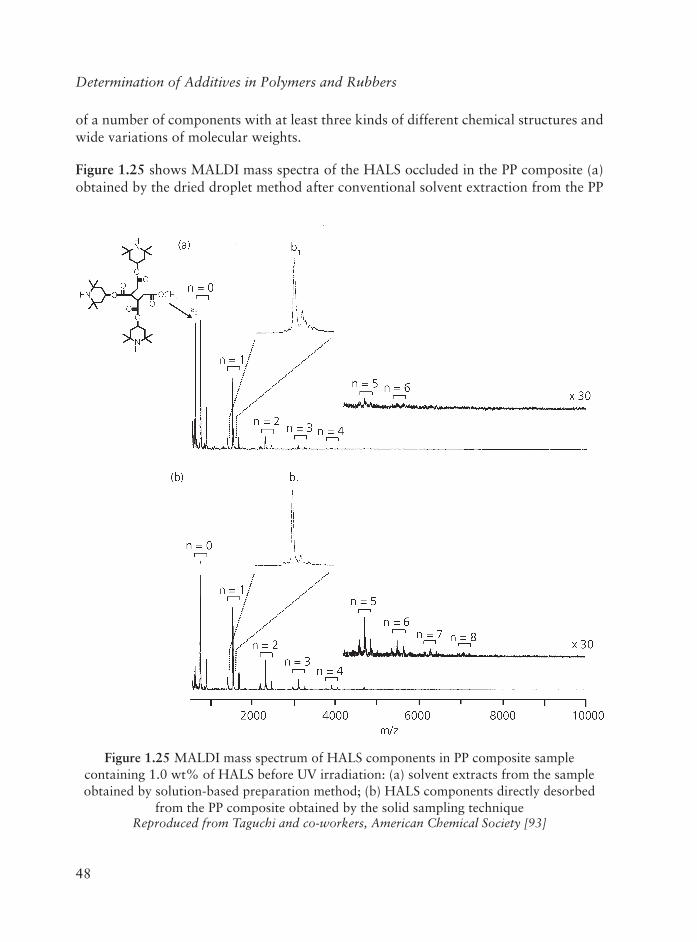
48
Determination of Additives in Polymers and Rubbers
of a number of components with at least three kinds of different chemical structures and wide variations of molecular weights.
Figure 1.25 shows MALDI mass spectra of the HALS occluded in the PP composite (a) obtained by the dried droplet method after conventional solvent extraction from the PP
Figure 1.25 MALDI mass spectrum of HALS components in PP composite sample containing 1.0 wt% of HALS before UV irradiation: (a) solvent extracts from the sample obtained by solution-based preparation method; (b) HALS components directly desorbed
from the PP composite obtained by the solid sampling techniqueReproduced from Taguchi and co-workers, American Chemical Society [93]
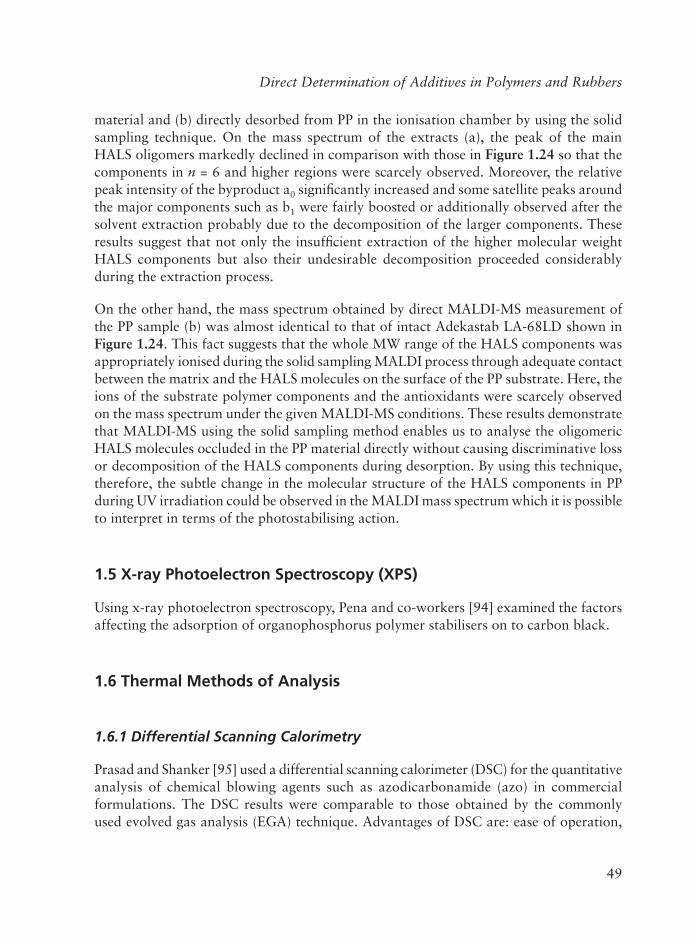
49
Direct Determination of Additives in Polymers and Rubbers
material and (b) directly desorbed from PP in the ionisation chamber by using the solid sampling technique. On the mass spectrum of the extracts (a), the peak of the main HALS oligomers markedly declined in comparison with those in Figure 1.24 so that the components in n = 6 and higher regions were scarcely observed. Moreover, the relative peak intensity of the byproduct a0 signifi cantly increased and some satellite peaks around the major components such as b1 were fairly boosted or additionally observed after the solvent extraction probably due to the decomposition of the larger components. These results suggest that not only the insuffi cient extraction of the higher molecular weight HALS components but also their undesirable decomposition proceeded considerably during the extraction process.
On the other hand, the mass spectrum obtained by direct MALDI-MS measurement of the PP sample (b) was almost identical to that of intact Adekastab LA-68LD shown in Figure 1.24. This fact suggests that the whole MW range of the HALS components was appropriately ionised during the solid sampling MALDI process through adequate contact between the matrix and the HALS molecules on the surface of the PP substrate. Here, the ions of the substrate polymer components and the antioxidants were scarcely observed on the mass spectrum under the given MALDI-MS conditions. These results demonstrate that MALDI-MS using the solid sampling method enables us to analyse the oligomeric HALS molecules occluded in the PP material directly without causing discriminative loss or decomposition of the HALS components during desorption. By using this technique, therefore, the subtle change in the molecular structure of the HALS components in PP during UV irradiation could be observed in the MALDI mass spectrum which it is possible to interpret in terms of the photostabilising action.
1.5 X-ray Photoelectron Spectroscopy (XPS)
Using x-ray photoelectron spectroscopy, Pena and co-workers [94] examined the factors affecting the adsorption of organophosphorus polymer stabilisers on to carbon black.
1.6 Thermal Methods of Analysis
1.6.1 Differential Scanning Calorimetry
Prasad and Shanker [95] used a differential scanning calorimeter (DSC) for the quantitative analysis of chemical blowing agents such as azodicarbonamide (azo) in commercial formulations. The DSC results were comparable to those obtained by the commonly used evolved gas analysis (EGA) technique. Advantages of DSC are: ease of operation,
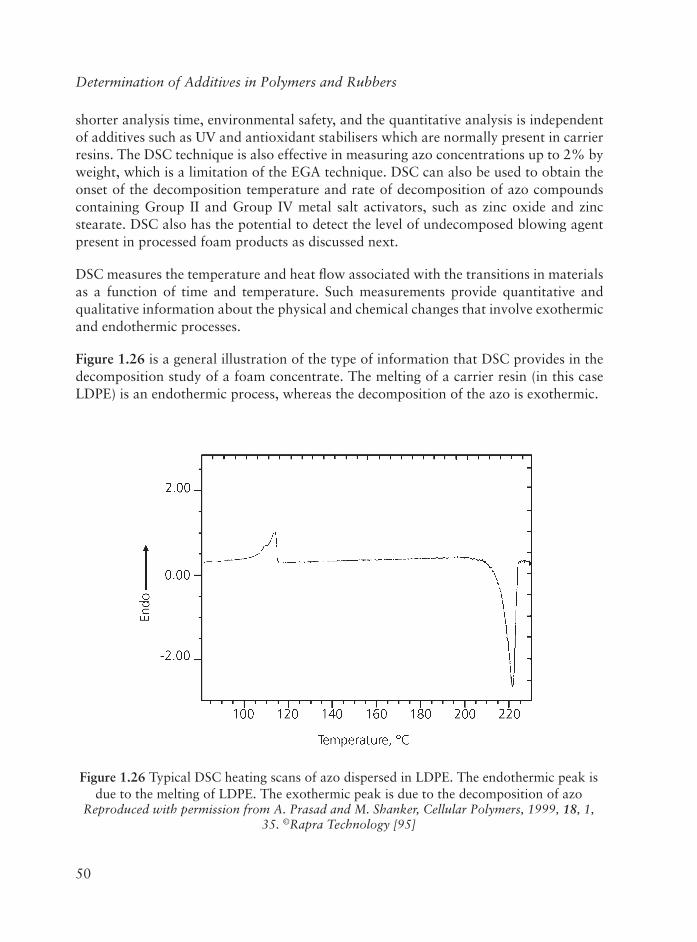
50
Determination of Additives in Polymers and Rubbers
shorter analysis time, environmental safety, and the quantitative analysis is independent of additives such as UV and antioxidant stabilisers which are normally present in carrier resins. The DSC technique is also effective in measuring azo concentrations up to 2% by weight, which is a limitation of the EGA technique. DSC can also be used to obtain the onset of the decomposition temperature and rate of decomposition of azo compounds containing Group II and Group IV metal salt activators, such as zinc oxide and zinc stearate. DSC also has the potential to detect the level of undecomposed blowing agent present in processed foam products as discussed next.
DSC measures the temperature and heat fl ow associated with the transitions in materials as a function of time and temperature. Such measurements provide quantitative and qualitative information about the physical and chemical changes that involve exothermic and endothermic processes.
Figure 1.26 is a general illustration of the type of information that DSC provides in the decomposition study of a foam concentrate. The melting of a carrier resin (in this case LDPE) is an endothermic process, whereas the decomposition of the azo is exothermic.
Figure 1.26 Typical DSC heating scans of azo dispersed in LDPE. The endothermic peak is due to the melting of LDPE. The exothermic peak is due to the decomposition of azo
Reproduced with permission from A. Prasad and M. Shanker, Cellular Polymers, 1999, 18, 1, 35. ©Rapra Technology [95]
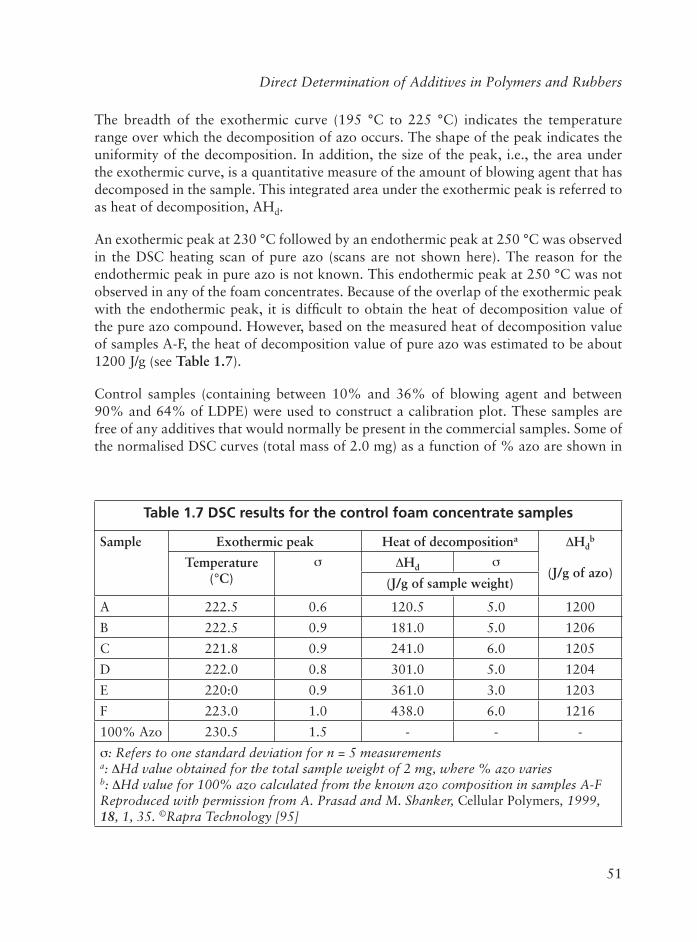
51
Direct Determination of Additives in Polymers and Rubbers
The breadth of the exothermic curve (195 °C to 225 °C) indicates the temperature range over which the decomposition of azo occurs. The shape of the peak indicates the uniformity of the decomposition. In addition, the size of the peak, i.e., the area under the exothermic curve, is a quantitative measure of the amount of blowing agent that has decomposed in the sample. This integrated area under the exothermic peak is referred to as heat of decomposition, AHd.
An exothermic peak at 230 °C followed by an endothermic peak at 250 °C was observed in the DSC heating scan of pure azo (scans are not shown here). The reason for the endothermic peak in pure azo is not known. This endothermic peak at 250 °C was not observed in any of the foam concentrates. Because of the overlap of the exothermic peak with the endothermic peak, it is diffi cult to obtain the heat of decomposition value of the pure azo compound. However, based on the measured heat of decomposition value of samples A-F, the heat of decomposition value of pure azo was estimated to be about 1200 J/g (see Table 1.7).
Control samples (containing between 10% and 36% of blowing agent and between 90% and 64% of LDPE) were used to construct a calibration plot. These samples are free of any additives that would normally be present in the commercial samples. Some of the normalised DSC curves (total mass of 2.0 mg) as a function of % azo are shown in
Table 1.7 DSC results for the control foam concentrate samples
Sample Exothermic peak Heat of decompositiona Hdb
(J/g of azo)Temperature
(°C)Hd
(J/g of sample weight)
A 222.5 0.6 120.5 5.0 1200
B 222.5 0.9 181.0 5.0 1206
C 221.8 0.9 241.0 6.0 1205
D 222.0 0.8 301.0 5.0 1204
E 220:0 0.9 361.0 3.0 1203
F 223.0 1.0 438.0 6.0 1216
100% Azo 230.5 1.5 - - -
: Refers to one standard deviation for n = 5 measurements a: Hd value obtained for the total sample weight of 2 mg, where % azo variesb: Hd value for 100% azo calculated from the known azo composition in samples A-FReproduced with permission from A. Prasad and M. Shanker, Cellular Polymers, 1999, 18, 1, 35. ©Rapra Technology [95]
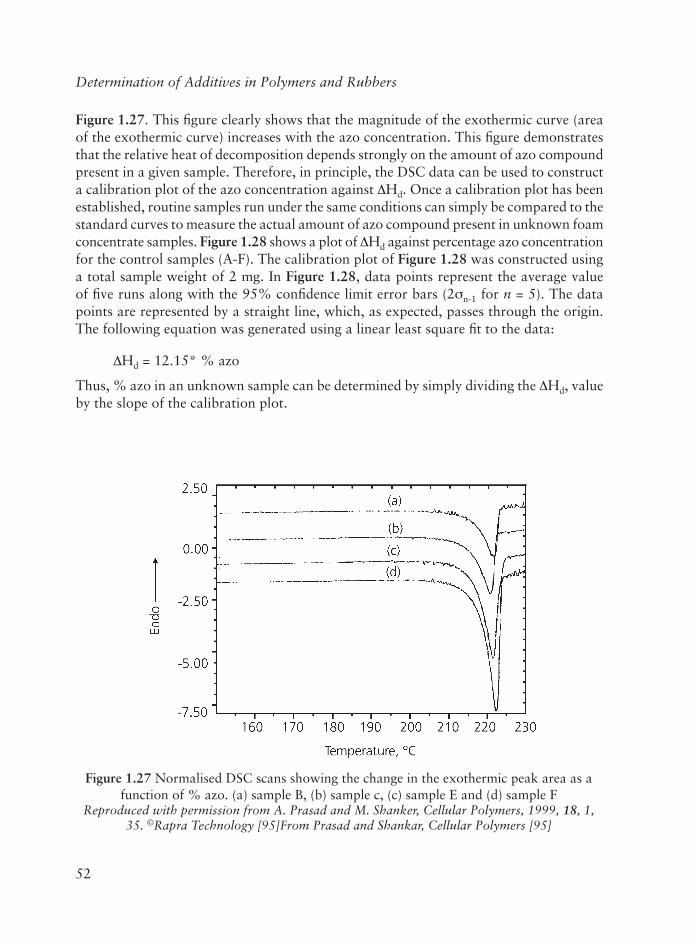
52
Determination of Additives in Polymers and Rubbers
Figure 1.27. This fi gure clearly shows that the magnitude of the exothermic curve (area of the exothermic curve) increases with the azo concentration. This fi gure demonstrates that the relative heat of decomposition depends strongly on the amount of azo compound present in a given sample. Therefore, in principle, the DSC data can be used to construct a calibration plot of the azo concentration against Hd. Once a calibration plot has been established, routine samples run under the same conditions can simply be compared to the standard curves to measure the actual amount of azo compound present in unknown foam concentrate samples. Figure 1.28 shows a plot of Hd against percentage azo concentration for the control samples (A-F). The calibration plot of Figure 1.28 was constructed using a total sample weight of 2 mg. In Figure 1.28, data points represent the average value of fi ve runs along with the 95% confi dence limit error bars (2 n-1 for n = 5). The data points are represented by a straight line, which, as expected, passes through the origin. The following equation was generated using a linear least square fi t to the data:
Hd = 12.15* % azo
Thus, % azo in an unknown sample can be determined by simply dividing the Hd, value by the slope of the calibration plot.
Figure 1.27 Normalised DSC scans showing the change in the exothermic peak area as a function of % azo. (a) sample B, (b) sample c, (c) sample E and (d) sample F
Reproduced with permission from A. Prasad and M. Shanker, Cellular Polymers, 1999, 18, 1, 35. ©Rapra Technology [95]From Prasad and Shankar, Cellular Polymers [95]
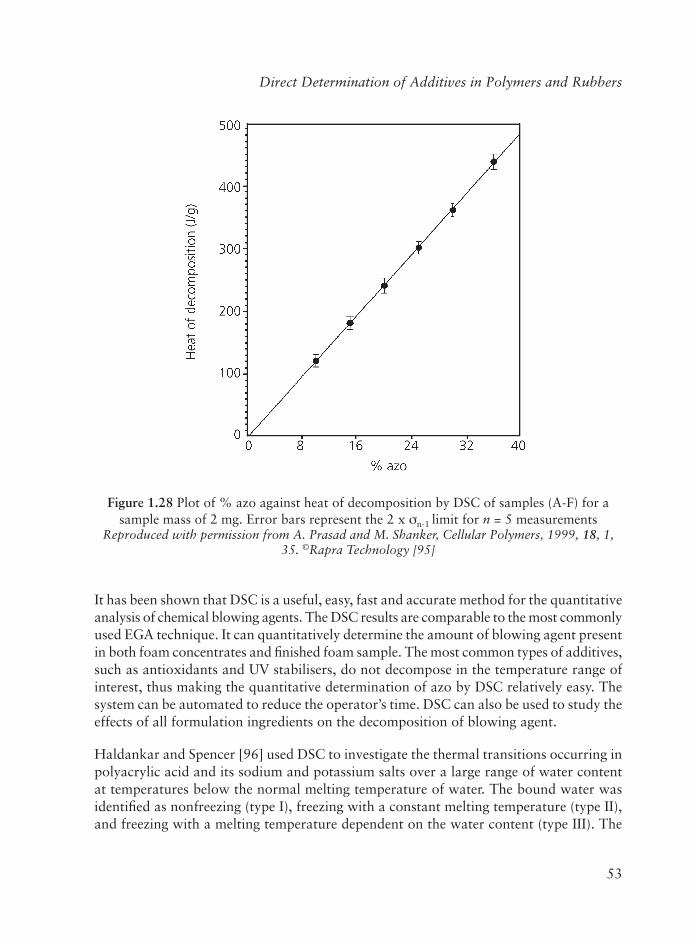
53
Direct Determination of Additives in Polymers and Rubbers
It has been shown that DSC is a useful, easy, fast and accurate method for the quantitative analysis of chemical blowing agents. The DSC results are comparable to the most commonly used EGA technique. It can quantitatively determine the amount of blowing agent present in both foam concentrates and fi nished foam sample. The most common types of additives, such as antioxidants and UV stabilisers, do not decompose in the temperature range of interest, thus making the quantitative determination of azo by DSC relatively easy. The system can be automated to reduce the operator’s time. DSC can also be used to study the effects of all formulation ingredients on the decomposition of blowing agent.
Haldankar and Spencer [96] used DSC to investigate the thermal transitions occurring in polyacrylic acid and its sodium and potassium salts over a large range of water content at temperatures below the normal melting temperature of water. The bound water was identifi ed as nonfreezing (type I), freezing with a constant melting temperature (type II), and freezing with a melting temperature dependent on the water content (type III). The
Figure 1.28 Plot of % azo against heat of decomposition by DSC of samples (A-F) for a sample mass of 2 mg. Error bars represent the 2 x n-1 limit for n = 5 measurements
Reproduced with permission from A. Prasad and M. Shanker, Cellular Polymers, 1999, 18, 1, 35. ©Rapra Technology [95]
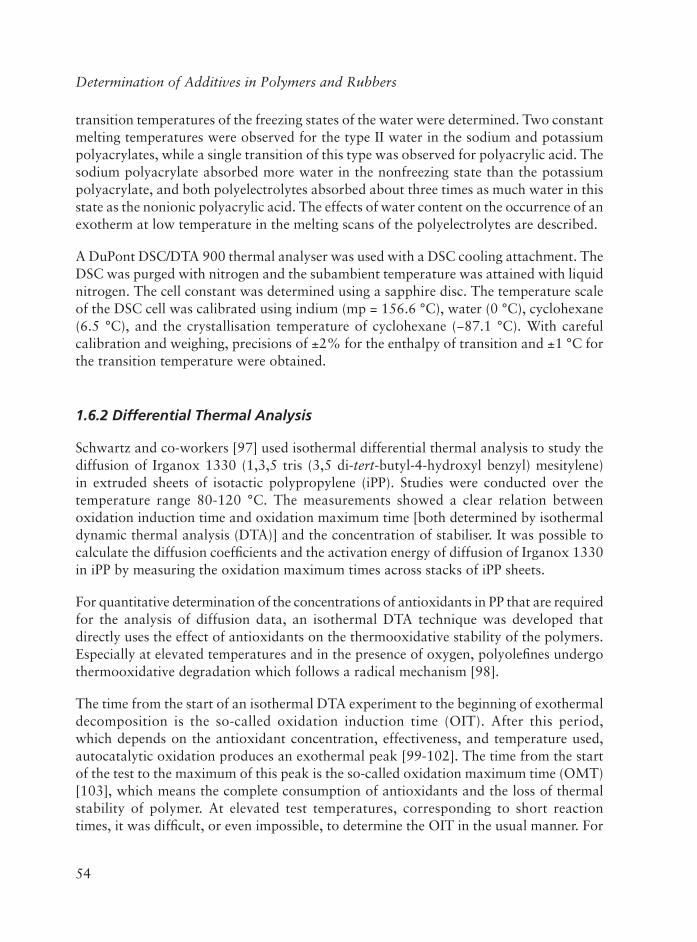
54
Determination of Additives in Polymers and Rubbers
transition temperatures of the freezing states of the water were determined. Two constant melting temperatures were observed for the type II water in the sodium and potassium polyacrylates, while a single transition of this type was observed for polyacrylic acid. The sodium polyacrylate absorbed more water in the nonfreezing state than the potassium polyacrylate, and both polyelectrolytes absorbed about three times as much water in this state as the nonionic polyacrylic acid. The effects of water content on the occurrence of an exotherm at low temperature in the melting scans of the polyelectrolytes are described.
A DuPont DSC/DTA 900 thermal analyser was used with a DSC cooling attachment. The DSC was purged with nitrogen and the subambient temperature was attained with liquid nitrogen. The cell constant was determined using a sapphire disc. The temperature scaleof the DSC cell was calibrated using indium (mp = 156.6 °C), water (0 °C), cyclohexane(6.5 °C), and the crystallisation temperature of cyclohexane (−87.1 °C). With careful calibration and weighing, precisions of ±2% for the enthalpy of transition and ±1 °C for the transition temperature were obtained.
1.6.2 Differential Thermal Analysis
Schwartz and co-workers [97] used isothermal differential thermal analysis to study the diffusion of Irganox 1330 (1,3,5 tris (3,5 di-tert-butyl-4-hydroxyl benzyl) mesitylene) in extruded sheets of isotactic polypropylene (iPP). Studies were conducted over the temperature range 80-120 °C. The measurements showed a clear relation between oxidation induction time and oxidation maximum time [both determined by isothermal dynamic thermal analysis (DTA)] and the concentration of stabiliser. It was possible to calculate the diffusion coeffi cients and the activation energy of diffusion of Irganox 1330 in iPP by measuring the oxidation maximum times across stacks of iPP sheets.
For quantitative determination of the concentrations of antioxidants in PP that are required for the analysis of diffusion data, an isothermal DTA technique was developed that directly uses the effect of antioxidants on the thermooxidative stability of the polymers. Especially at elevated temperatures and in the presence of oxygen, polyolefi nes undergo thermooxidative degradation which follows a radical mechanism [98].
The time from the start of an isothermal DTA experiment to the beginning of exothermal decomposition is the so-called oxidation induction time (OIT). After this period, which depends on the antioxidant concentration, effectiveness, and temperature used, autocatalytic oxidation produces an exothermal peak [99-102]. The time from the start of the test to the maximum of this peak is the so-called oxidation maximum time (OMT) [103], which means the complete consumption of antioxidants and the loss of thermal stability of polymer. At elevated test temperatures, corresponding to short reaction times, it was diffi cult, or even impossible, to determine the OIT in the usual manner. For
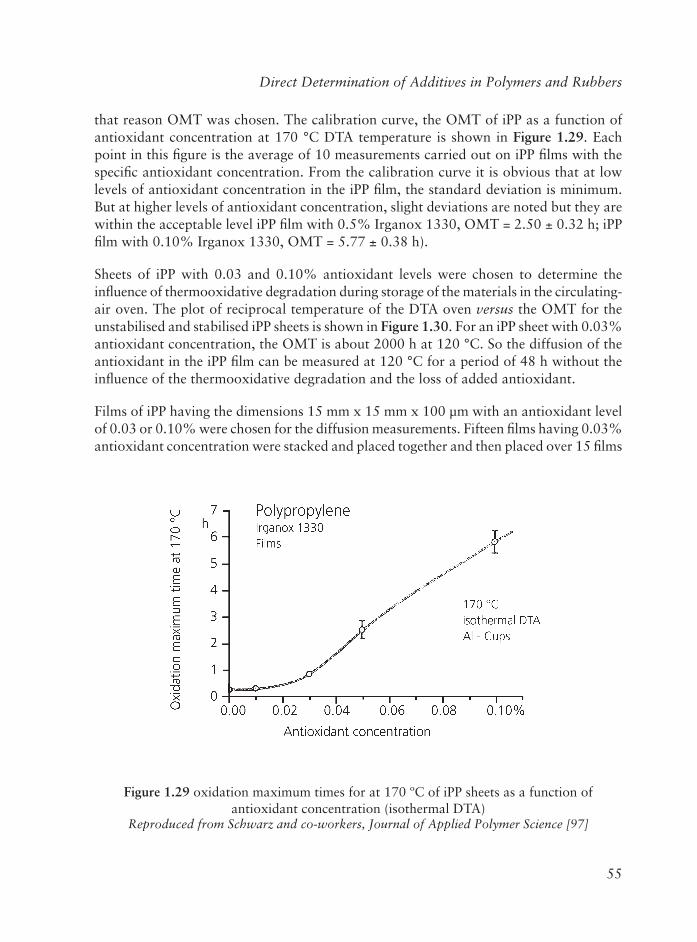
55
Direct Determination of Additives in Polymers and Rubbers
that reason OMT was chosen. The calibration curve, the OMT of iPP as a function of antioxidant concentration at 170 °C DTA temperature is shown in Figure 1.29. Each point in this fi gure is the average of 10 measurements carried out on iPP fi lms with the specifi c antioxidant concentration. From the calibration curve it is obvious that at low levels of antioxidant concentration in the iPP fi lm, the standard deviation is minimum. But at higher levels of antioxidant concentration, slight deviations are noted but they are within the acceptable level iPP fi lm with 0.5% Irganox 1330, OMT = 2.50 ± 0.32 h; iPP fi lm with 0.10% Irganox 1330, OMT = 5.77 ± 0.38 h).
Sheets of iPP with 0.03 and 0.10% antioxidant levels were chosen to determine the infl uence of thermooxidative degradation during storage of the materials in the circulating-air oven. The plot of reciprocal temperature of the DTA oven versus the OMT for the unstabilised and stabilised iPP sheets is shown in Figure 1.30. For an iPP sheet with 0.03% antioxidant concentration, the OMT is about 2000 h at 120 °C. So the diffusion of the antioxidant in the iPP fi lm can be measured at 120 °C for a period of 48 h without the infl uence of the thermooxidative degradation and the loss of added antioxidant.
Films of iPP having the dimensions 15 mm x 15 mm x 100 µm with an antioxidant level of 0.03 or 0.10% were chosen for the diffusion measurements. Fifteen fi lms having 0.03% antioxidant concentration were stacked and placed together and then placed over 15 fi lms
Figure 1.29 oxidation maximum times for at 170 ºC of iPP sheets as a function of antioxidant concentration (isothermal DTA)
Reproduced from Schwarz and co-workers, Journal of Applied Polymer Science [97]
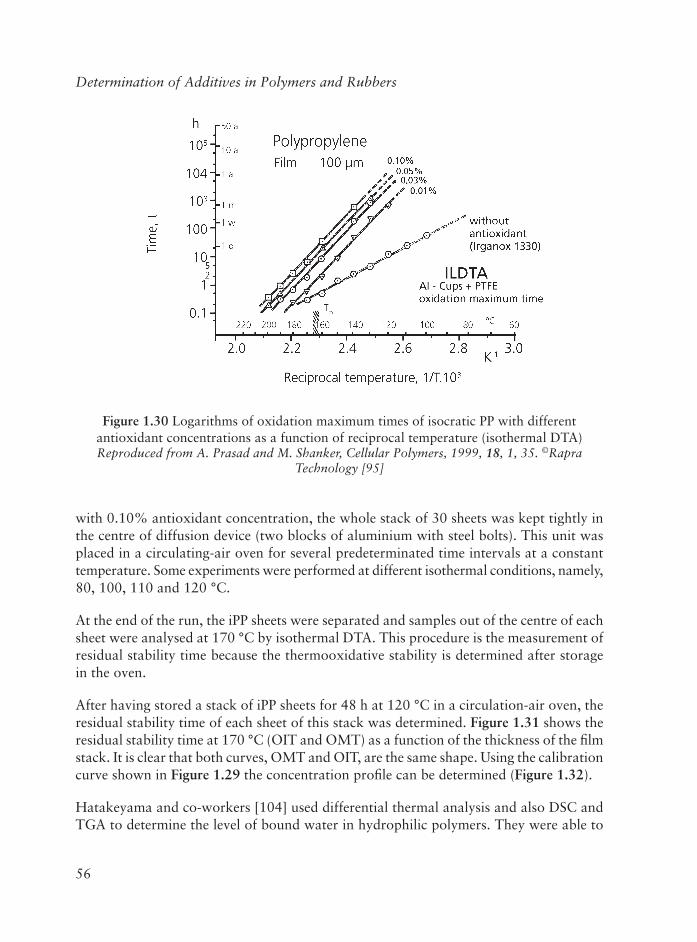
56
Determination of Additives in Polymers and Rubbers
with 0.10% antioxidant concentration, the whole stack of 30 sheets was kept tightly in the centre of diffusion device (two blocks of aluminium with steel bolts). This unit was placed in a circulating-air oven for several predeterminated time intervals at a constant temperature. Some experiments were performed at different isothermal conditions, namely, 80, 100, 110 and 120 °C.
At the end of the run, the iPP sheets were separated and samples out of the centre of each sheet were analysed at 170 °C by isothermal DTA. This procedure is the measurement of residual stability time because the thermooxidative stability is determined after storage in the oven.
After having stored a stack of iPP sheets for 48 h at 120 °C in a circulation-air oven, the residual stability time of each sheet of this stack was determined. Figure 1.31 shows the residual stability time at 170 °C (OIT and OMT) as a function of the thickness of the fi lm stack. It is clear that both curves, OMT and OIT, are the same shape. Using the calibration curve shown in Figure 1.29 the concentration profi le can be determined (Figure 1.32).
Hatakeyama and co-workers [104] used differential thermal analysis and also DSC and TGA to determine the level of bound water in hydrophilic polymers. They were able to
Figure 1.30 Logarithms of oxidation maximum times of isocratic PP with different antioxidant concentrations as a function of reciprocal temperature (isothermal DTA)Reproduced from A. Prasad and M. Shanker, Cellular Polymers, 1999, 18, 1, 35. ©Rapra
Technology [95]
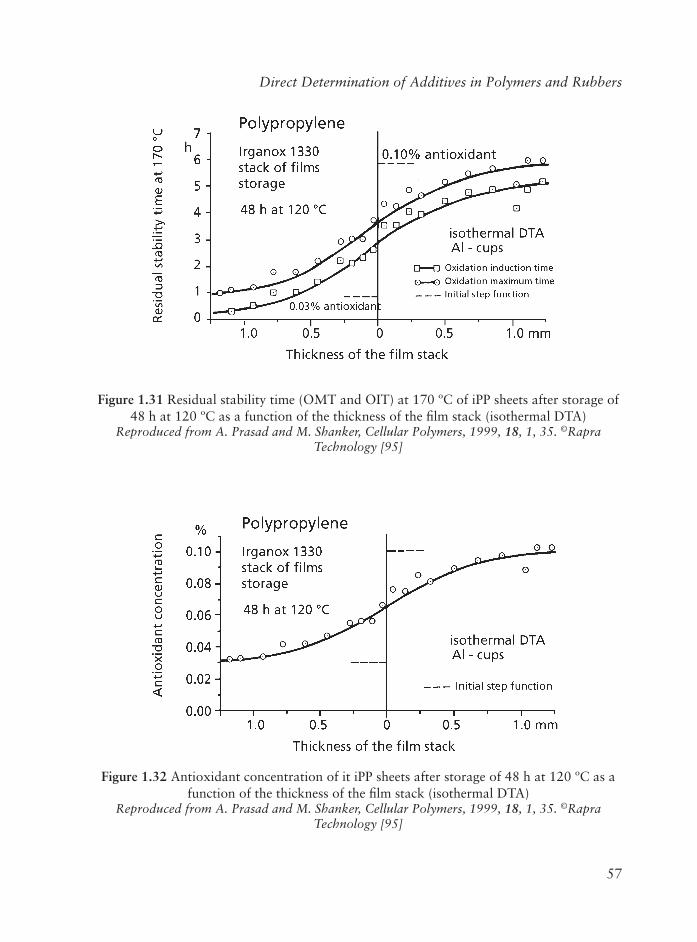
57
Direct Determination of Additives in Polymers and Rubbers
Figure 1.31 Residual stability time (OMT and OIT) at 170 ºC of iPP sheets after storage of 48 h at 120 ºC as a function of the thickness of the fi lm stack (isothermal DTA)
Reproduced from A. Prasad and M. Shanker, Cellular Polymers, 1999, 18, 1, 35. ©RapraTechnology [95]
Figure 1.32 Antioxidant concentration of it iPP sheets after storage of 48 h at 120 ºC as a function of the thickness of the fi lm stack (isothermal DTA)
Reproduced from A. Prasad and M. Shanker, Cellular Polymers, 1999, 18, 1, 35. ©RapraTechnology [95]
58
Determination of Additives in Polymers and Rubbers
distinguish between free water in the system and water bound to the polymer. Differential thermal analysis has been used to determine blowing agents in foams [105, 106].
1.6.3 Thermogravimetric Analyses
This technique has been used to determine blowing agents in foamed plastics [105] to study liberation of stabilisers from PVC pipe at elevated temperature [107].
1.7 Vapour Phase Ultraviolet Spectroscopy
Organic and inorganic pigments are used for coloration of polymers, polymer fi lms and polymer coatings on metal containers. Vapour/phase UV absorption spectrometry at 200 nm has been used to identify such pigments [29]. In this method powdered samples are directly vaporised in the heated graphite atomiser. Thermal UV profi les of organic pigments show absorption bands between 300 and 900 °C, while profi les of inorganic pigments are characterised by absorption bands at temperatures above 900 °C. Temperature, relative intensity, and width of the bands allow the identifi cation of the pigments. The technique shows fast acquisition of thermal UV profi les (2-3 minutes for each run), good repeatability and wide thermal range (from 150 to 2,300 °C). A 1:1 mixture of organic pigment yellow (2-nitro-p-toluidine coupled with acetoacetanilide) and inorganic PY 34 (lead chromate) was vaporised. The thermal UV profi le clearly shows two absorption/bands at about 500 °C and 1,250 °C. The fi rst band is attributed to the vapours which originate from the decomposition and pyrolysis of the organic pigment, the second band corresponds to the decomposition and vaporisation of lead chromate at high temperature (mp 844 °C). It is possible therefore to determine by a rapid run whether the pigment is a mixture or belongs to the organic or inorganic group.
1.8 X-Ray Fluorescence Analysis
This technique has been applied to determining the identity of oxygen absorbers in polymers [108] also to determine traces of metals in polymers.
1.9 Nuclear Magnetic Resonance Spectroscopy
The phase partitioning of additives in styrene-butadiene polymer blends has a large impact on the performance of the blend. Since solubility characteristics and processing of the blends infl uences partitioning, it is necessary to be able to quantify the level of Ionol
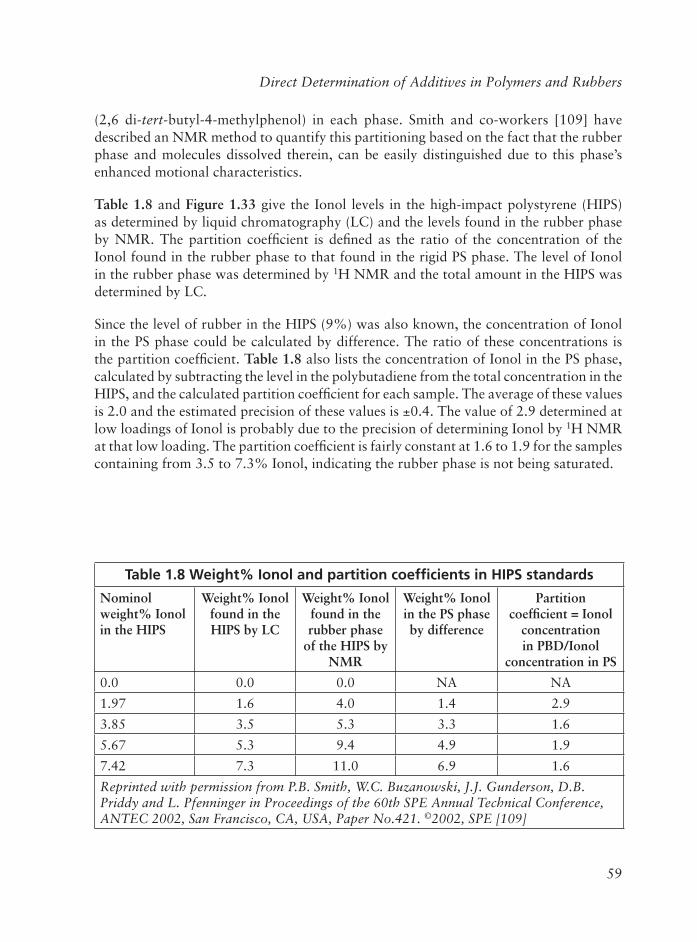
59
Direct Determination of Additives in Polymers and Rubbers
(2,6 di-tert-butyl-4-methylphenol) in each phase. Smith and co-workers [109] have described an NMR method to quantify this partitioning based on the fact that the rubber phase and molecules dissolved therein, can be easily distinguished due to this phase’s enhanced motional characteristics.
Table 1.8 and Figure 1.33 give the Ionol levels in the high-impact polystyrene (HIPS) as determined by liquid chromatography (LC) and the levels found in the rubber phase by NMR. The partition coeffi cient is defi ned as the ratio of the concentration of the Ionol found in the rubber phase to that found in the rigid PS phase. The level of Ionol in the rubber phase was determined by 1H NMR and the total amount in the HIPS was determined by LC.
Since the level of rubber in the HIPS (9%) was also known, the concentration of Ionol in the PS phase could be calculated by difference. The ratio of these concentrations is the partition coeffi cient. Table 1.8 also lists the concentration of Ionol in the PS phase, calculated by subtracting the level in the polybutadiene from the total concentration in the HIPS, and the calculated partition coeffi cient for each sample. The average of these values is 2.0 and the estimated precision of these values is ±0.4. The value of 2.9 determined at low loadings of Ionol is probably due to the precision of determining Ionol by 1H NMR at that low loading. The partition coeffi cient is fairly constant at 1.6 to 1.9 for the samples containing from 3.5 to 7.3% Ionol, indicating the rubber phase is not being saturated.
Table 1.8 Weight% Ionol and partition coeffi cients in HIPS standards
Nominolweight% Ionol in the HIPS
Weight% Ionol found in the HIPS by LC
Weight% Ionol found in the rubber phase
of the HIPS by NMR
Weight% Ionol in the PS phase by difference
Partitioncoeffi cient = Ionol
concentrationin PBD/Ionol
concentration in PS
0.0 0.0 0.0 NA NA
1.97 1.6 4.0 1.4 2.9
3.85 3.5 5.3 3.3 1.6
5.67 5.3 9.4 4.9 1.9
7.42 7.3 11.0 6.9 1.6
Reprinted with permission from P.B. Smith, W.C. Buzanowski, J.J. Gunderson, D.B. Priddy and L. Pfenninger in Proceedings of the 60th SPE Annual Technical Conference, ANTEC 2002, San Francisco, CA, USA, Paper No.421. ©2002, SPE [109]
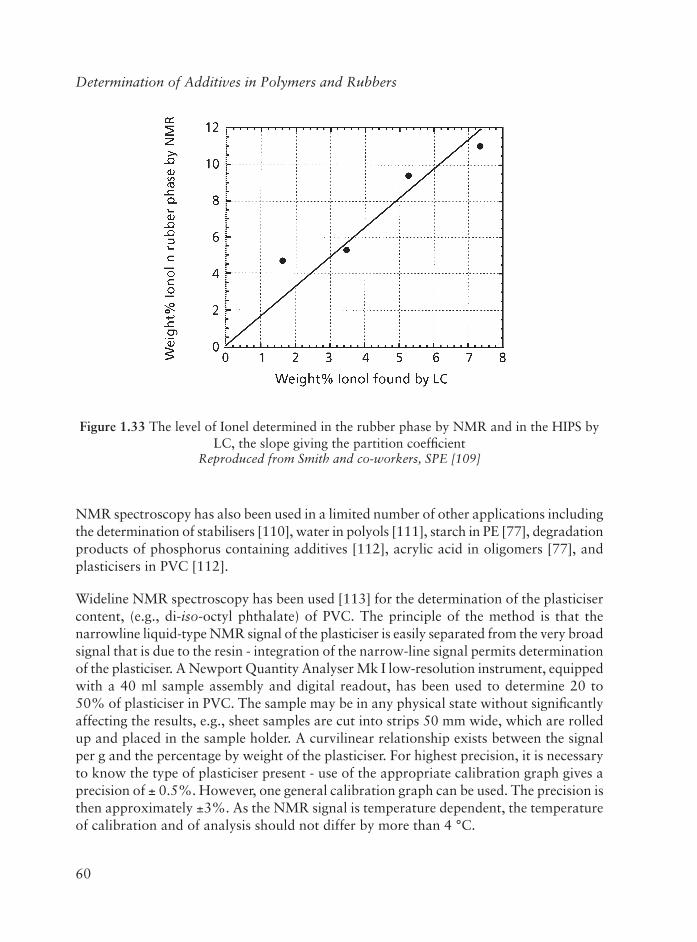
60
Determination of Additives in Polymers and Rubbers
NMR spectroscopy has also been used in a limited number of other applications including the determination of stabilisers [110], water in polyols [111], starch in PE [77], degradation products of phosphorus containing additives [112], acrylic acid in oligomers [77], and plasticisers in PVC [112].
Wideline NMR spectroscopy has been used [113] for the determination of the plasticiser content, (e.g., di-iso-octyl phthalate) of PVC. The principle of the method is that the narrowline liquid-type NMR signal of the plasticiser is easily separated from the very broad signal that is due to the resin - integration of the narrow-line signal permits determination of the plasticiser. A Newport Quantity Analyser Mk I low-resolution instrument, equipped with a 40 ml sample assembly and digital readout, has been used to determine 20 to 50% of plasticiser in PVC. The sample may be in any physical state without signifi cantly affecting the results, e.g., sheet samples are cut into strips 50 mm wide, which are rolled up and placed in the sample holder. A curvilinear relationship exists between the signal per g and the percentage by weight of the plasticiser. For highest precision, it is necessary to know the type of plasticiser present - use of the appropriate calibration graph gives a precision of ± 0.5%. However, one general calibration graph can be used. The precision is then approximately ±3%. As the NMR signal is temperature dependent, the temperature of calibration and of analysis should not differ by more than 4 °C.
Figure 1.33 The level of Ionel determined in the rubber phase by NMR and in the HIPS by LC, the slope giving the partition coeffi cient
Reproduced from Smith and co-workers, SPE [109]
61
Direct Determination of Additives in Polymers and Rubbers
References
1. B. Vigerust, K. Kolset, S. Nordenson, A. Henricsen and K. Kleveland, AppliedSpectroscopy, 1991, 45, 2, 173.
2. Unscrambler: A Program for Multivariate Calibration and Prediction, Version 2.2. User’s Guide, CAMO, Trondheim, Norway, 1988.
3. H. Martens and T. Naes, Multivariate Calibration, John Wiley and Sons, Chichester, UK, 1989.
4. D.L. Massart, B.G.M. Vandeginste, S.N. Deming, Y. Michotte and L. Kaufman, Chemometrics: A Textbook, Elsevier, Amsterdam, The Netherlands, 1988.
5. M.A. Sharaf, D.L. Illman and B.R. Kowalski, Chemometrics, John Wiley and Sons, New York, NY, USA, 1986.
6. S. Wold and M. Sjostrom in Chemometrics: Theory and Application, Ed.,B. Kowalski, ACS Symposium Series No.52, American Chemical Society, Washington, DC, USA, 1977, p.243-282.
7. D.M. Haaland and E.V. Thomas, Analytical Chemistry, 1988, 60, 11, 1193.
8. D.M. Haaland and E.V. Thomas, Analytical Chemistry, 1988, 60, 11, 1202.
9. D.M. Haaland, Analytical Chemistry, 1988, 60, 11, 1208.
10. T. Kumar, Analyst, 1990, 115, 12, 1597.
11. R.W. Crecely and C.E. Day in Plastics Additives: An A-Z Reference, Ed., G. Pritchard, Chapman and Hall, London, UK, 1998, p.26-31.
12. S. Karlsson, Advances in Polymer Science, 2004, 169, 201.
13. S. Karlsson, F. Stangenberg and S. Agren, and Refi ned Routine Analysis for Quality Assessment of Recycled Plastics in Standardisation, KTH, Stockholm, Sweden, 2002.
14. W.L. Camacho, A. Vallés-Lluch and A. Ribes-Greus and S. Karlsson, Journal ofApplied Polymer Science, 2003, 87, 13, 2165.
15. Y. Nishikawa, T. Nakano, H. Miyauchi, K. Nishikida and E.Y. Jiang, AppliedSpectroscopy, 2004, 58, 958.
62
Determination of Additives in Polymers and Rubbers
16. F. Scholl, Atlas of Polymer and Plastics Analysis, Volume 3, Additives and Processing Aids, Spectra and Methods of Identifi cation, 2nd Revised Edition, Carl Hanser Verlad, Munich, Germany, 1981, p.687.
17. F. De Thomas, J. Hall, D. Grzybowski in Leaping Ahead in Near Infrared Spectroscopy - Proceedings of the 6th International Conference on Near Infrared Spectroscopy, Eds., G.D. Batten, P.C. Flinn, L.A. Welsh and A.B. Blakeney, Australia, 1995, p.364-366.
18. J.W. Hall, D.E. Grzybowski and S.L. Monfre, Journal of Near Infrared Spectroscopy, 1993, 1, 1, 55.
19. S.P. Patel, Analytical Instrumentation, 1989, 44, 1331.
20. V. Di Noto, M. Saccon, B. Bresadola and R. Zannetti, Analyst, 1990, 115, 10, 41.
21. T. Kumar, Analyst, 1990, 115, 10, 1319.
22. M. Bowden, P. Donaldson, D.J. Gardiner, J. Birnie and D.L. Gerard, AnalyticalChemistry, 1991, 63, 24, 2915.
23. T.L. Rapp, W.K. Kowalchyk, K.L. Davis, E.A. Todd, K.L. Liu and M.D. Morris, Analytical Chemistry, 1992, 64, 20, 2434.
24. D.W. Windig and J. Guilment, Analytical Chemistry, 1991, 63, 14, 1425.
25. K.C. Cole, C. Lehto and M. Propac in SPIE Optical Techniques for Industrial Inspection Conference, Quebec City, Canada, 1986, p.243-251.
26. R.J. Meilunas, J.G. Bentsen and A. Steinberg, Studies in Conservation, 1990, 35,1, 33.
27. J. Soucek and E. Jelinkova, Analyst, 1982, 107, 1275, 623.
28. J. Lutzen, K. van Veen and S.T. Balke in Proceedings of the 60th SPE Annual Technical Conference, ANTEC 2000, San Francisco, CA, USA, Paper No.346.
29. P. Tittarelli, T. Zerlia, A. Colli and G. Ferrari, Analytical Chemistry, 1983, 55, 2, 220.
30. R.V. Albarino, Applied Spectroscopy, 1973, 27, 1, 47.
31. P. Hendra and H. Mould, International Laboratory, 1988, 18, 30.
63
Direct Determination of Additives in Polymers and Rubbers
32. F. Dywan, B. Hartmann, S. Klauer, M.D. Lechner, R.A. Rapp and M. Wöhlecke, Die Macromolekulare Chemie, 1993, 194, 6, 1527.
33. S. Ellahi, R.E. Hester and K.P.J. Williams, Spectrochimica Acta, 1995, 51A, 4, 549.
34. M.W. Hayes and A.G. Altenau, Rubber Age, 1970, 102, 5, 59.
35. R.P. Lattimer and R.E. Harris, Mass Spectrometry Reviews, 1985, 4, 3, 369.
36. R.P. Lattimer, Polymeric Materials, Science and Engineering, Spring Meeting, 2003, 88, 182.
37. R.P. Lattimer and K.R. Welch, Rubber Chemistry and Technology, 1980, 53, 1, 151.
38. R.P. Lattimer, R.E. Harris, D.B. Ross and H.E. Diem, Rubber Chemistry and Technology, 1984, 57, 5, 1013.
39. A.T. Jackson, A. Busy, J.H. Scrivens and K.R. Jennings in Proceedings of the 4th ASMS Conference on Mass Spectrometry and Allied Topics, Atlanta, GA, USA, 1981, p.750.
40. A.T. Jackson, A. Busy, K.R. Jennings and J.H. Scrivens, unpublished.
41. M. Barber, R.S. Bordoli, R.D. Sedgwick and A.N. Tyler, Journal of the Chemical Society, Chemical Communications, 1981, 7, 325.
42. N. Fürstenau, F. Hillenkamp and R. Nitsche, International Journal of Mass Spectrometry and Ion Processes, 1979, 31, 1-2, 85.
43. C.L. Johlman, C.L. Wilkins, J.D. Hogan, T.L. Donovan, D.A. Laude and M.J. Youssefi , Analytical Chemistry, 1990, 62, 11, 1167.
44. K. Peltonen, Analyst, 1986, 111, 7, 819.
45. P. Rudewicz and B. Munson, Analytical Chemistry, 1986, 58, 2, 358.
46. R.P. Lattimer, R.E. Harris, C.K. Rhee and H.R. Schulten, Analytical Chemistry,1986, 58, 14, 3188.
47. I.V. Bletsos, D.M. Hercules, J.H. Magill, D. Van Leyen, E. Niehuis, A. Benninghoven, Analytical Chemistry, 1988, 60, 9, 938.
48. R.P.Lattimer, D.M. Harris, C.K. Rhee and H.R. Schulten, Rubber Chemistry and Technology, 1988, 61, 4, 639.
64
Determination of Additives in Polymers and Rubbers
49. L. O’Toole, R.D. Short, F.A. Bottino, G. Di Pasquale and A. Pollicino, Surface Interface Analysis, 1992, 18, 9, 667.
50. D.W. Carlson, M.W. Hayes, H.C. Ransaw, R.S. McFadden and A.G. Altenau, Analytical Chemistry, 1971, 43, 13, 1874.
51. A. Hilton and A. Altenau, Rubber Chemistry and Technology, 1973, 46, 4, 1035.
52. K.M. Baker, G. Chantrey and D. Mauer, Kautschuk und Gummi Kunststoffe,1980, 33, 3, 175.
53. J. Pierre and J. Van Bree, Kunstoffe, 1983, 73, 6, 319.
54. R. Lattimer, Rubber Chemistry and Technology, 1988, 61, 4, 658.
55. R. Lattimer, H. Muenster and H. Budzikiewicz, Rubber Chemistry and Technology, 1990, 63, 2, 298.
56. H-R. Schulten, B. Plage and R. Lattimer, Rubber Chemistry and Technology,1989, 62, 4, 698.
57. R. Lattimer and R. Harris, Rubber Chemistry and Technology, 1989, 62, 3, 548.
58. T. Yoshikawa, K. Ushimi, K. Kimura and M. Tamura, Journal of Applied Polymer Science, 1971, 15, 9, 2065.
59. A.W. Wims and S.J. Swarin, Journal of Applied Polymer Science, 1975, 19, 5, 1243.
60. R. Lattimer, Rubber Chemistry and Technology, 1995, 68, 5, 783.
61. S.J. Wright, M.J. Dale, P.R.R. Langridge-Smith, Q. Zhan and R. Zenobi, Analytical Chemistry, 1996, 68, 20, 3585.
62. A.P. Snyder, Journal of Analytical Applied Pyrolysis, 1990, 17, 127.
63. C.L. Johlman, C.L. Wilkins, J.D. Hogan, T.L. Donovan, D.A. Laude and M.J. Youssefi , Analytical Chemistry, 1990, 62, 11, 1167.
64. W.H. Waddell, K.A. Benzing, L.R. Evans, S.K. Mowdood, D.A. Weil, J.M. McMahon, R.H. Cody, Jr., and J.A. Kinsinger, Rubber Chemistry and Technology,1991, 64, 4, 622.
65. Q. Zhan, R. Zanobi, S.J. Wright and P.R.R. Langridge-Smith, Macromolecules,1996, 29, 7865.
65
Direct Determination of Additives in Polymers and Rubbers
66. K. Schwetlick, Pure and Applied Chemistry, 1983, 55, 10, 1629.
67. K. Schwetlick, T. König, C. Rüger, J. Pionteck and W.D. Habicher, PolymerDegradation and Stability, 1986, 15, 2, 97.
68. K. Schwetlick, J. Pionteck, T. König and W.D. Habicher, European Polymer Journal, 1987, 23, 5, 383.
69. D.G. Pobedimskii, V.I. Kurashov and P.A. Kirpichnikov, Journal of PolymerScience: Polymer Chemistry Edition, 1983, 21, 1, 55.
70. M.M. Tannahill, W.P. Enlow, Limitations of Liquid Chromatographic and FTIR Determinations for Ultranox 626 in Polyolefi ns, GE Specialty Chemicals Technical Bulletin, GE Plastics, 1988.
71. M. Reeder, W. Enlow and E. Borkowski in Proceedings of the SPE Conference Polyolefi ns VI, Houston, TX, USA, 1989, p.181.
72. X. Xiang, J. Dahlgren, W.P. Enlow and A.G. Marshall, Analytical Chemistry,1992, 64, 22, 2862.
73. B. Asamoto, J.R. Young and R.J. Citerin, Analytical Chemistry, 1990, 62, 1, 61.
74. D.D. Bombick and J. Allison, Analytical Chemistry, 1987, 59, 3, 458.
75. W.J. Simonsick, Jr., private communication.
76. W.J. Simonsick, Jr., Progress in Organic Coatings, 1992, 20, 3-4, 411.
77. T. Tikuisis, D.E. Axelson and A. Shara, Polymer Engineering Science, 1993, 33, 1, 26.
78. R.J. Beuhler, E. Flanigan, L.F. Green and L. Friedman, Journal of the American Chemical Society, 1974, 96, 12, 3990.
79. F.W. Rollgen and H-R. Schulten, Organic Mass Specrometry, 1975, 10, 660.
80. D. Bombick, J.D. Pinkston and J. Allison, Analytical Chemistry, 1984, 56, 3, 396.
81. C.L. Johlman, C.L. Wilkins, J.D. Hogan, T.L. Donovan, D.A. Laude and M.J. Youssefi , Analytical Chemistry, 1990, 62, 11, 1167.
82. T. Chang, D. Waterman and M. Pignetti in Proceedings of the 40th ASMS Conference on Mass Spectrometry and Allied Topics, Washington, DC, USA, 1992, p.265.
66
Determination of Additives in Polymers and Rubbers
83. A.T. Jackson, K.R. Jennings and J.H. Scrivens, Rapid Communications in Mass Spectrometry, 1996, 10, 12, 1449.
84. A.T. Jackson, A. Buzy, K.R. Jennings and J.H. Scrivens, European Journal of Mass Specrometry, 1996, 2, 2, 115.
85. C.R. Shick, Jr., P.A. DePalma, Jr., and R.K. Marcus, Analytical Chemistry, 1996, 68, 13, 2113.
86. L. O’Toole, R.D. Short, F.A. Bottino, A. Pollucino and A. Recca, PolymerDegradation and Stability, 1992, 38, 2, 147.
87. J.J. Kirkland, C.H. Dilks and S.W. Rementer, Analytical Chemistry, 1992, 64, 11, 1296.
88. I.V. Bletsos, D.M. Hercules, D. Van Leyen, B. Hagenhoft, and E. Niehuis and A. Benninghoven, Analytical Chemistry, 1991, 63, 18, 1953.
89. S.G. McKay and P.J. Pachuta, Polymer Preprints, 1996, 37, 299.
90. A.S. Helton and A.G. Altenau, Rubber Chemistry and Technology, 1973, 46,1035.
91. V. Svob and F. Flajsmon, Croatian Chimica Acta, 1970, 42, 417.
92. S.D. Hanton, JCT Coatings Technology, 2004, 1, 1, 62.
93. Y. Taguchi, Y. Ishida, H. Ohtani and H. Matsubara, Analytical Chemistry, 2004, 76, 3, 697.
94. J.M. Pena, N.S. Allen, M. Edge, C.M. Liauw and B. Valange, PolymerDegradation and Stability, 2001, 72, 1, 31.
95. A. Prasad and M. Shanker, Cellular Polymers, 1999, 18, 1, 35.
96. G.S. Haldankar and H.G. Spencer, Journal of Applied Polymer Science, 1989, 37,11, 3137.
97. T. Schwarz, G. Steiner and J. Koppelmann, Journal of Applied Polymer Science,1989, 38, 1, 1.
98. R. Gächter and H. Müller, Kunststoff-Additive, 2nd Edition, Carl Hanser Verlag Munich, Germany, 1993.
67
Direct Determination of Additives in Polymers and Rubbers
99. E. Kramer and J. Koppelmann, Kunstoffe, 1983, 73, 11, 714.
98. E. Kramer, Osterreichische Kunstoffe Zeitschrift, 1984, 15, 3-4, 32.
99. E. Kramer and J. Koppelmann, Polymer Degradation and Stability, 1986, 14, 4, 333.
100. E. Kramer and J. Koppelmann, Polymer Degradation and Stability, 1986, 16, 3, 261.
101. E. Kramer and J. Koppelmann, Polymer Engineering and Science, 1987, 27, 13, 945.
102. G. Steiner and J. Koppelmann, Kunstoffe, 1987, 77, 3, 286.
103. G. Steiner and J. Koppelmann, Polymer Degradation and Stability, 1987, 19, 4, 307.
104. T. Hatakeyama, K. Nakamura and H. Hatakyama, Thermochimica Acta, 1988, 123, 1, 153.
105. R.H. Hensen, SPE Journal, 1962, 18, 77.
106. R.H. Hensen, SPE Journal, 1962, 18, 79.
107. W. Stachn and H. Sendel, Labor Praxis, 1988, 12, 308.
108. J. Lopez-Cervantes, D.I. Sanchez-Machado, S. Pastorelli, R. Rijk and P. Paseiro-Losada, Food Additives and Contaminants, 2003, 20, 3, 291.
109. P.B. Smith, W.C. Buzanowski, J.J. Gunderson, D.B. Priddy and L. Pfenninger in Proceedings of the 60th SPE Annual Technical Conference, ANTEC 2000, San Francisco, CA, USA, Paper No.421.
110. W. Barendswaard, J. Moone and M. Neilen, Analytica Chimica Acta, 1993, 283,3, 1007.
111. R.B. Ray, C. Kradgel and, L. McDermott, Polymer Materials Science and Engineering, 1988, 58, 542.
112. D.F. Slonaker and D.C. Sievers, Analytical Chemistry, 1964, 36, 6, 1130.
113. P.B. Mansfi eld, Chemische Industrie, 1971, 28, 792.

68
Determination of Additives in Polymers and Rubbers


![Pharos Manual[1].pdf](https://img.pdfslide.us/doc/110x75/577cc34f1a28aba711959d3c/pharos-manual1pdf.jpg)