Embed Size (px)
Citation preview
HAL Id: hal-01652337https://hal-univ-rennes1.archives-ouvertes.fr/hal-01652337
Submitted on 30 Nov 2017
HAL is a multi-disciplinary open accessarchive for the deposit and dissemination of sci-entific research documents, whether they are pub-lished or not. The documents may come fromteaching and research institutions in France orabroad, or from public or private research centers.
L’archive ouverte pluridisciplinaire HAL, estdestinée au dépôt et à la diffusion de documentsscientifiques de niveau recherche, publiés ou non,émanant des établissements d’enseignement et derecherche français ou étrangers, des laboratoirespublics ou privés.
Determination by reactive absorption of the rateconstant of the ozone reaction with the hydroperoxide
anionPierre-François Biard, Thom Dang, Annabelle Couvert
To cite this version:Pierre-François Biard, Thom Dang, Annabelle Couvert. Determination by reactive absorption of therate constant of the ozone reaction with the hydroperoxide anion. Chemical Engineering Researchand Design, Elsevier, 2017, 127, pp.62-71. �10.1016/j.cherd.2017.09.004�. �hal-01652337�

1
Determination by reactive absorption of the rate constant of the ozone
reaction with the hydroperoxide anion
Pierre-François BIARDa*, Thom Thi DANGa,b, Annabelle COUVERTa
aÉcole Nationale Supérieure de Chimie de Rennes, CNRS, UMR 6226, 11 Allée de Beaulieu, CS 50837,
35708 Rennes Cedex 7, France.
bInstitute of Environmental Technology, Vietnam Academy of Science and Technology, 18
Hoangquocviet Road, Hanoi, Vietnam.
*Corresponding author : [email protected], +33 2 23 23 81 49
Graphical abstract
2
Highlights
The reaction rate constant k between O3 and HO2- was determined by reactive absorption
k is in the range 1.91×10⁶ - 2.40×10⁶ L mol-1 s-1 at 20°C
k is in the range 5.68×10⁶ - 7.31×10⁶ L mol-1 s-1 at 35°C
An activation energy in the range 45-69 kJ mol-1 was determined.
Abstract
The reaction rate constant between the hydroperoxide anion (HO2-) and molecular ozone was
evaluated from the reactive absorption method in the range of temperature from 20 to 35°C. This
reaction is crucial in the initiation step of the ozone decomposition, especially using the peroxone
process which combines ozone and hydrogen peroxide in solution. A stirred-cell operated semi-
continuously was used for this purpose. A high initial concentration of tert-butanol (0.05 mol L-1) was
applied to efficiently scavenge all radicals and to avoid any parasite reaction. Based on the dissolved
H2O2 concentration decreasing and the outlet ozone concentration time-course, the stoichiometry of
the initiation reaction was determined, with one mol of H2O2 consumed per mol of ozone
transferred. The chemical conditions were thoroughly selected to reach a fast pseudo-first order
absorption regime. The reaction rate constant increased from 1.91×10⁶ - 2.40×10⁶ L mol-1 s-1 at 20°C
to 5.68×10⁶ - 7.31×10⁶ L mol-1 s-1 at 35°C.
Keywords:
Reactive absorption; ozone; hydrogen peroxide; initiation; rate constant; activation energy
Nomenclature
CG: gaseous ozone concentration (read in g Nm-3 and converted in mol m-3)
3
CL: dissolved ozone concentration (mol m-3)
CR: total reactant (H2O2 + HO2-) bulk concentration (mol L-1 or g L-1)
CS: scavenger (tert-butanol) bulk concentration (mol L-1)
DL: ozone diffusion coefficient at infinite dilution in the liquid phase (m2 s-1)
DR: reactant diffusion coefficient at infinite dilution in the liquid phase (m2 s-1)
E: enhancement (reaction) factor (dimensionless)
Ei : instantaneous enhancement (reaction) factor (dimensionless)
EI: elasticity index (dimensionless)
FG: gas flow rate (read and corrected in NL h-1 and further converted in Nm3 s-1 and m3 s-1)
H: ozone Henry’s law constant in water (Pa m3 mol-1)
Ha: Hatta number (dimensionless)
I: inputs of the model
J: mass-transfer rate (mol s-1)
k: second-order reaction rate constant (L mol-1 s-1)
k’: pseudo-first order reaction constant calculated for any species i by kHO°/i×[i] (s-1)
kG: gas-phase mass-transfer coefficient (m s-1)
kL: liquid-phase mass-transfer coefficient (m s-1)
KL: overall liquid-phase mass-transfer coefficient (m s-1)
Mi: molar mass of any compound i (g mol-1)
N: stirring speed (rpm)
nR: reactant (H2O2 + HO2-) amount (mol) in the reactor
O: output of the model
OF: objective function (according to Eq. 20)
P: pressure in the reactor (bar)
R: ideal gas constant (8.314 J mol-1 K-1)
RE (%): relative error
RSD (%): relative standard deviations
S: gas-liquid interfacial area (m2)
t: time (s)
T: Temperature (K or °C)
V: liquid volume (L)
z: stoichiometric coefficient corresponding to the amount of H2O2 consumed per amount of O3
consumed
Greek letters:
4
t: time path (s)
: standard deviation
Subscripts:
G/L: relative to the gas or the liquid
i/o: at the inlet or at the outlet
l: relative to the reactant (H2O2) lost
R: relative to the reactant
0: at the initial time
f: at the final time (1 h)
Superscripts:
*: at the interface
eq: at the equilibrium
t: at the time t
1. Introduction
Chemical oxidation and disinfection using ozone are currently implemented in drinking and waste
water treatment plants (Von Sonntag and Von Gunten, 2012). Besides its direct reactivity with
inorganic and organic compounds, a significant part of the ozone reactivity in water is based on
indirect reactions with radicals generated by the ozone decomposition (HO°, HO2°, O2°-, etc.) (Beltrán,
2004; Von Gunten, 2003; Von Sonntag and Von Gunten, 2012).
The indirect mechanism is often targeted to enhance the radical formation, especially of hydroxyl
radicals (HO°) which are particularly reactive and non-selective (Glaze and Kang, 1989; Glaze et al.,

5
1987; Von Gunten, 2003). Thus, the peroxone process, which combines hydrogen peroxide and
ozone in solution, is efficiently used for micropollutant (pesticides, drugs, endocrine disruptors, etc.)
oxidation (Acero and Von Gunten, 2001). This process is based on the fast ozone decomposition
initiation reaction with the hydroperoxide anion (HO2-). This anion is the H2O2 conjugated base (pKa ≈
11.75 at 20°C (Evans and Uri, 1949)).
The reaction between O3 and HO2- is described in the literature as a proton transfer reaction or as an
adduct formation reaction. The reaction between H2O2 and O3 is unlikely (Staehelin and Hoigne,
1982; Taube and Bray, 1940). Thus, according to Staehelin and Hoigné (1982), as well as Tomiyasu et
al. (1985), hydroperoxide anion initiates the ozone decomposition according to respectively Eqs. 1
and 2 (Staehelin and Hoigne, 1982; Tomiyasu et al., 1985):
2-C20 at s mol L 102.8k-
23 OOHOHO O-1-16
2 Eq. 1.
32C20 at s mol L 102.2k-
23 OHOHO O-1-16
Eq. 2.
All the radicals formed can be involved in several propagation or termination reactions (Buehler et
al., 1984a; Buehler et al., 1984b; Mandel et al., 2014; Staehelin et al., 1984; Tomiyasu et al., 1985).
These two models support a theoretical stoichiometry of 2 mol of O3 consumed and 2 mol of HO°
formed for one mol of H2O2 consumed (Merényi et al., 2010a). However, in real water, the formation
of less than one mol of HO° for one mol of H2O2 consumed is always observed (Fischbacher et al.,
2013; Merényi et al., 2010a; Staehelin and Hoigne, 1982). Thus, more recently, the ozone
decomposition mechanism has been extensively revisited assuming the reversible formation of the
adduct HO5- which is further decomposed into HO2° + O3
-° and 2 O3 + HO- (Merényi et al., 2010a;
Merényi et al., 2010b; Sein et al., 2007) :
Eq. 3.
6
Following the ozone decay in a UV-cell, Staehelin et al. (1982) determined a second-order reaction
rate constant k = (2.8 ± 0.6)×106 L mol-1 s-1 at 20 ± 1°C (Staehelin and Hoigne, 1982). Methylmercury
hydroxide was used as radical scavenger. Later, Tomiyasu et al. (1985) confirmed this order of
magnitude using advantageously the stopped-flow method with a value of k = 2.2 × 10⁶ L mol-1 s-1 at
20°C (Tomiyasu et al., 1985). No scavenger was used. More recently, Sein et al. (2007) found a value
of the apparent reaction rate constant equal to (4.8 ± 1.0)×106 L mol-1 s-1 at 20 ± 1°C from the ozone
decay measured by a spectrophotometer using a large excess (0.01 mol L-1) of tert-butanol (Sein et
al., 2007). This value should correspond to the forward reaction leading to the formation of the
adduct HO5- since it should be the rate limiting step (Gardoni et al., 2012). Different values of the
H2O2/HO2- pKa (in the range from 11.65 to 11.80) were considered in these studies, which influences
the determination of k (Sein et al., 2007).
The reactive absorption method might be advantageously used to assess the kinetics of this reaction.
This method is particularly adapted to reactions with molecular ozone since the dissolved ozone
concentration is zero (Dang et al., 2016). Thus, the accuracy of the method is not affected by the
poor ozone solubility and stability and its rather inaccurate quantification (Beltrán, 2004; Beltrán et
al., 1998; Cardona et al., 2010; Dang et al., 2016; Sotelo et al., 1990; Sotelo et al., 1991). The
calculation of the enhancement (or reaction) factor E, deduced from both the mass-transfer and
chemical reaction rates, is the basis of the method (Beltrán, 2004). Stirred-cell reactors, in which the
interfacial area is well known from the reactor geometry, are particularly appealing for ozonation
studies (Dang et al., 2016). Nonetheless, the gas-side resistance might be significant, even using a
poorly soluble compound such as O3, especially when a fast chemical reaction is involved in the liquid
phase (Dang et al., 2016). To reduce the number of inputs of the model and to gain in accuracy, the
pseudo-first order regime is recommended (Dang et al., 2016). In that case, the reactant
concentration near the gas-liquid interface is equal to the bulk concentration (Beltrán, 2004; Bin and
Roustan, 2000; Luzi et al., 2014; Vaidya and Kenig, 2007). Furthermore, the mass-transfer rate is

7
uninfluenced by the liquid-phase mass-transfer coefficient kL and the reactant diffusion coefficient
DR.
The knowledge of the reaction rate constant between O3 and HO2- is crucial for both fundamental
(ozone decomposition modeling) and industrial purposes (reactor design). However, its value is still
uncertain at 20°C and is unknown at other temperatures. Consequently, the purpose of this study is
to assess the evolution of this reaction rate constant from 20 to 35°C by using the reactive absorption
kinetic method in a temperature controlled stirred-cell reactor operated semi-continuously.
2. Material and methods
2.1. Reactor and experimental set-up description
Table 1: Experimental operating conditions, mass-transfer coefficients and surface area of the
stirred-cell reactor.
Experimental conditions
T P V FG N CG,i CR at t0 CR at t0 pH at t0 CS at t0
°C bar L NL h-1 rpm g Nm-3 g L-1 mol L-1 mol L-1
20-35 ≈ 1 ≈ 1.3 68.5 ±0.5 160 33-95 1.55 0.0456 9.55-10.10 0.050
Mass-transfer coefficients and surface area according to (Dang et al., 2016)
105×kL (m s-1) 103×kG (m s-1) Interfacial area S (m2)
20°C 25°C 30°C 35°C 20°C 25°C 30°C 35°C
1.19 1.61 1.77 1.75 3.95 4.40 4.86 4.80 7.72×10⁻³
The 2L jacketed stirred-cell reactor, in which the gas and liquid phases were separated by a flat
interface, and the experimental set-up have been already described by Dang et al. (2016) and are
also provided as a supplementary content. The operating conditions of Dang et al. studies (2016)
(pressure P of around 1 bar, 20 ≤ T ≤ 35°C, liquid volume V of 1.3 L, stirring speed N of 160 rpm,
turbines positions, gas flow-rate FG of 68.5 NL h-1) were selected, allowing to reuse their liquid (kL)
and gas-phase (kG) mass-transfer coefficients (Table 1). All the experiments were performed in ultra
8
pure water produced by reverse osmosis (resistivity < 18 M cm) by a Purelab system (Elga, France)
containing an initial tert-butanol (Sigma Aldrich, USA, purity > 99%) concentration CS of 0.05 mol L-1
to scavenge the radical chain. No buffer was added to avoid potential parasite reactions.
2.2. Experimental protocol
The semi-batch experiments were conducted at transient state. On the one hand, the gas flow-rate
and the ozone inlet concentration remained unchanged during the experiments. On the other hand,
the pH, the H2O2 concentration and the O3 outlet concentration varied during the experiments and
were monitored.
First, the stirred-cell reactor was filled with around 1.3 L of ultra pure water (weighted to know the
exact volume introduced), doped with controlled amounts of H2O2 (CR ≈ 1.5 g L-1) and NaOH (0.1 mol
L-1, provided by Merck, Germany) to set the initial conditions. The temperature of the liquid (in the
range from 20°C to 35°C) was controlled with a thermostatic bath. The gas–liquid reactor was fed
only when the inlet gas ozone concentration (CG,i), measured by an on-line ozone analyzer (BMT 964
N, Germany), was constant and the time was recorded. Thus, the ozone outlet gas concentration was
continuously monitored. Samples of 5 mL of the liquid phase were withdrawn regularly (every 300 s)
using a gas-tight syringe (SGE, Australia) for H2O2 quantification (by the iodometric titration method)
and for pH measurement (using a pH/T combined probe provided by SI Analytics, connected to a
WTW 315i pH - meter). The dissolved ozone solution was quantified by the indigo carmine method
and was found to be in all cases negligible. After approximately one hour of experiment, the reactor
was by-passed to measure once again the inlet ozone gas concentration. Then, the ozone generator
was turned off and the solution was drained. At each temperature, five experiments were carried-
out with different initial chemical conditions (Table 2).
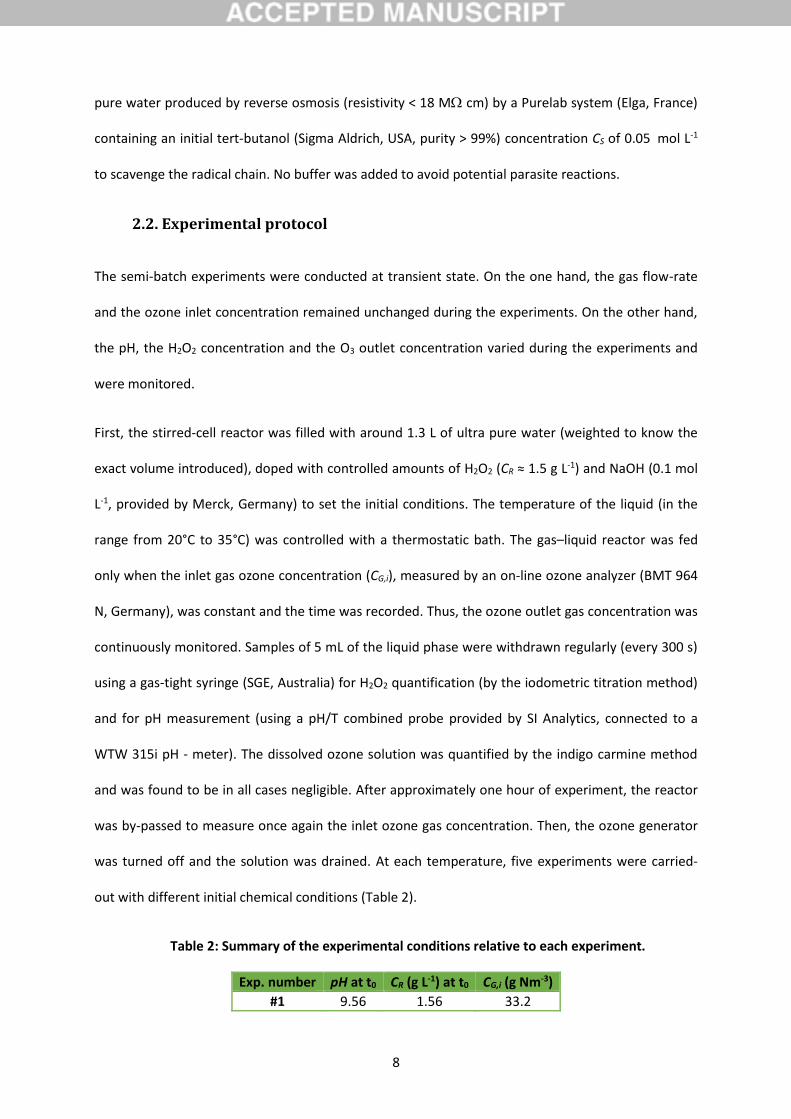
Table 2: Summary of the experimental conditions relative to each experiment.
Exp. number pH at t0 CR (g L-1) at t0 CG,i (g Nm-3)
#1 9.56 1.56 33.2

9
#2 9.74 1.56 94.3
#3 9.80 1.53 71.9
#4 9.59 1.58 71.7
#5 10.09 1.54 72.4
3. Results and discussion
3.1. Experimental results
Figure 1: H2O2 concentration (a) and ozone outlet gas concentration (b) time-courses at 20°C.
The points correspond to the experimental measurements. The straight curves correspond to the
concentrations deduced from the model (section 3.3).
During the experiments, the total H2O2 concentration (H2O2 is denoted as the reactant R and CR =
[H2O2] + [HO2-]) dropped. This decreasing was sharper for increasing inlet ozone concentration (Fig
1.a) and higher initial pH (pH#5 > pH#3 > pH#4) due to a higher reaction rate. In the meantime, the pH
dropped owing to the HO2- consumption by the reaction (Fig. 2). Both the pH and CR decreasing led to
a lower reaction rate with time. Thus, the outlet ozone gas concentration (CG,o) slightly increased
1.10
1.15
1.20
1.25
1.30
1.35
1.40
1.45
1.50
1.55
1.60
0 1000 2000 3000 4000
CR
,T(g
L-1
)
Time (s)
# 1
#2
# 3
# 4
# 5
25
30
35
40
45
50
55
60
65
70
75
80
85
90
95
0 1000 2000 3000 4000
CG
,o(g
Nm
-3)
Time (s)
# 1 : Exp
# 1 : Model
#2 : exp
# 2 : model
# 3 : exp
# 3 : Model
# 4 : exp
# 5 : exp
# 4 : Model
# 5 : Model
(a) (b)
10
with time (Fig. 1.b). CG,o values below around 5 min were biased due to the dead-time in the analysis
line (Dang et al., 2016).
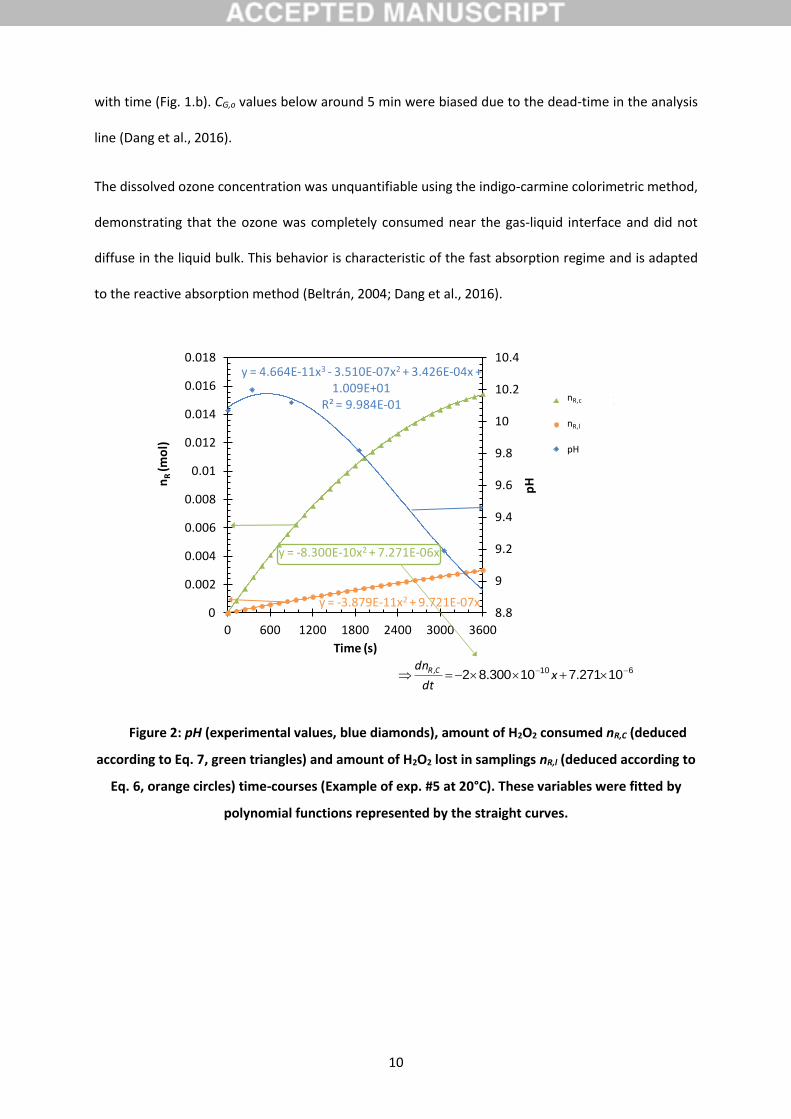
The dissolved ozone concentration was unquantifiable using the indigo-carmine colorimetric method,
demonstrating that the ozone was completely consumed near the gas-liquid interface and did not
diffuse in the liquid bulk. This behavior is characteristic of the fast absorption regime and is adapted
to the reactive absorption method (Beltrán, 2004; Dang et al., 2016).
Figure 2: pH (experimental values, blue diamonds), amount of H2O2 consumed nR,C (deduced
according to Eq. 7, green triangles) and amount of H2O2 lost in samplings nR,l (deduced according to
Eq. 6, orange circles) time-courses (Example of exp. #5 at 20°C). These variables were fitted by
polynomial functions represented by the straight curves.
y = -8.300E-10x2 + 7.271E-06x
y = -3.879E-11x2 + 9.721E-07x
y = 4.664E-11x3 - 3.510E-07x2 + 3.426E-04x + 1.009E+01
R² = 9.984E-01
8.8
9
9.2
9.4
9.6
9.8
10
10.2
10.4
0
0.002
0.004
0.006
0.008
0.01
0.012
0.014
0.016
0.018
0 600 1200 1800 2400 3000 3600
pHn
R(m
ol)
Time (s)
# 5 : nR,C
#5 : nR,l
# 5 : pH
nR,c
nR,l
pH
610 1027171030082 .., xdt
dn CR

11
3.2. Determination of the reaction stoichiometry
3.2.1. Mathematical modeling
The ozone transferred was entirely consumed near the interface and did not accumulate in the
solution (i.e. its concentration in the liquid bulk was zero, CL = 0). z represents the amount of H2O2
consumed per amount of O3 transferred (and consumed). The ozone mass balance can be written
according to Eq. 4:
dt
dn
zM
CF
M
CF R
O
oGG
O
iGG
1
33
,, reaction outlet Gasinlet Gas Eq. 4.
The read gas flow rate FG (NL h-1 where N stands for the standard conditions for temperature and
pressure) is corrected with the temperature and the pressure (Dang et al., 2016). CG is the gaseous
ozone concentration (read in g Nm-3). CR (g L-1) and nR (mol) are respectively the H2O2 concentration
and amount in the liquid bulk. V is the liquid volume (L) whose evolution with time was known since
samples of exactly 5 mL were withdrawn. The conversion of the volume expressed as NL or Nm3 into
the volume at the working temperature and pressure (L or m3) is detailed by Dang et al. (2016). The
amount of H2O2 lost (nR,l) in the samples withdrawn was significant and considered in the calculation
(Fig. 2). Therefore, Eq.4 is rewritten taking account of the amount of H2O2 really consumed by the
reaction (subscript “c”):
dt
dn
CCF
Mz cR
oGiGG
O ,
,, 3 Eq. 5.
nR,l and nR,c at any time t were evaluated by discretization through respectively Eqs 6 and 7:
00
tlRR
R
tttt
lRtt
lR nCM
VVnn ,,, with Eq. 6.
0 with 0
,,,
t
cR
tt
lR
R
tttt
R
tt
Rtt
cR nnM
VCVCn Eq. 7.
12
A time path (t) of 120 s was considered. The values of tRC used in Eqs 6 and 7 were previously
computed by second or third degree polynomial functions fitted to the experimental values of the
hydrogen peroxide concentration, with determination coefficients R2 higher than 99%. nR,l and nR,C
time-courses were also fitted to second or third degree polynomial functions (Fig. 2). Then, according
to Eq. 5, z was deduced at any time t by integration through Eq. 8:
dtCCF
nM
dtCCF
dnMz
t
oGiGG
cRO
t
oGiGG
n
cRO
cR
00
0 33
,,
,
,,
,
,
Eq. 8.
The denominator was easily calculated by numerical integration using the experimental values of
CG,o.
3.2.2. Determination of z
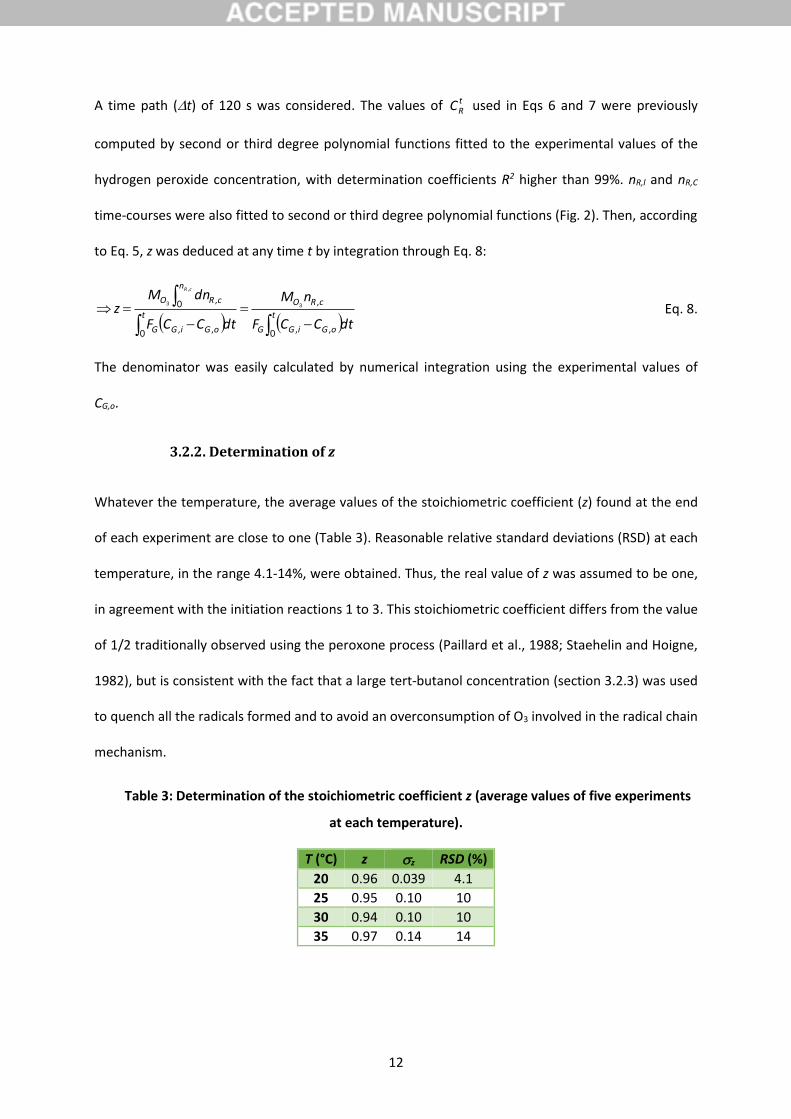
Whatever the temperature, the average values of the stoichiometric coefficient (z) found at the end
of each experiment are close to one (Table 3). Reasonable relative standard deviations (RSD) at each
temperature, in the range 4.1-14%, were obtained. Thus, the real value of z was assumed to be one,
in agreement with the initiation reactions 1 to 3. This stoichiometric coefficient differs from the value
of 1/2 traditionally observed using the peroxone process (Paillard et al., 1988; Staehelin and Hoigne,
1982), but is consistent with the fact that a large tert-butanol concentration (section 3.2.3) was used
to quench all the radicals formed and to avoid an overconsumption of O3 involved in the radical chain
mechanism.
Table 3: Determination of the stoichiometric coefficient z (average values of five experiments
at each temperature).
T (°C) z z RSD (%)
20 0.96 0.039 4.1
25 0.95 0.10 10
30 0.94 0.10 10
35 0.97 0.14 14
13
3.2.3. Selection of the tert-butanol concentration
To avoid parasite reactions with the radicals induced by the ozone decomposition and to control
carefully the reaction stoichiometry, the aqueous solution was spiked with tert-butanol which acts as
an efficient radical scavenger in the presence of ozone (Sein et al., 2007). A sufficient tert-butanol
concentration was necessary to (i) insure that the reaction rate between HO° and tert-butanol was
higher than the reaction rate of HO° with H2O2, HO2- or O3 and to (ii) insure an excess of tert-butanol
compared to the amount of radical produced during the experiments and then, to guarantee a
perennial effect. On the one hand, several experiments carried out at 0.001 and 0.01 mol L-1 provided
erroneous results. At 0.001 mol L-1, the reaction rates determined at 20°C were around 1 order of
magnitude higher than the one expected, which might be due to an enhanced O3 transfer due to
parasite reactions between O3 and radicals. Then, a concentration of 0.01 mol L-1 was not enough to
control the stoichiometry of the reaction after a certain period of time (i.e. z ranged between 1/2 and
1), probably because the amount of tert-butanol introduced was around 4.5 times lower than the
amount of H2O2 introduced and lower than the amount of radical produced. Thus, a total tert-
butanol consumption before the end of the experiments might be observed.
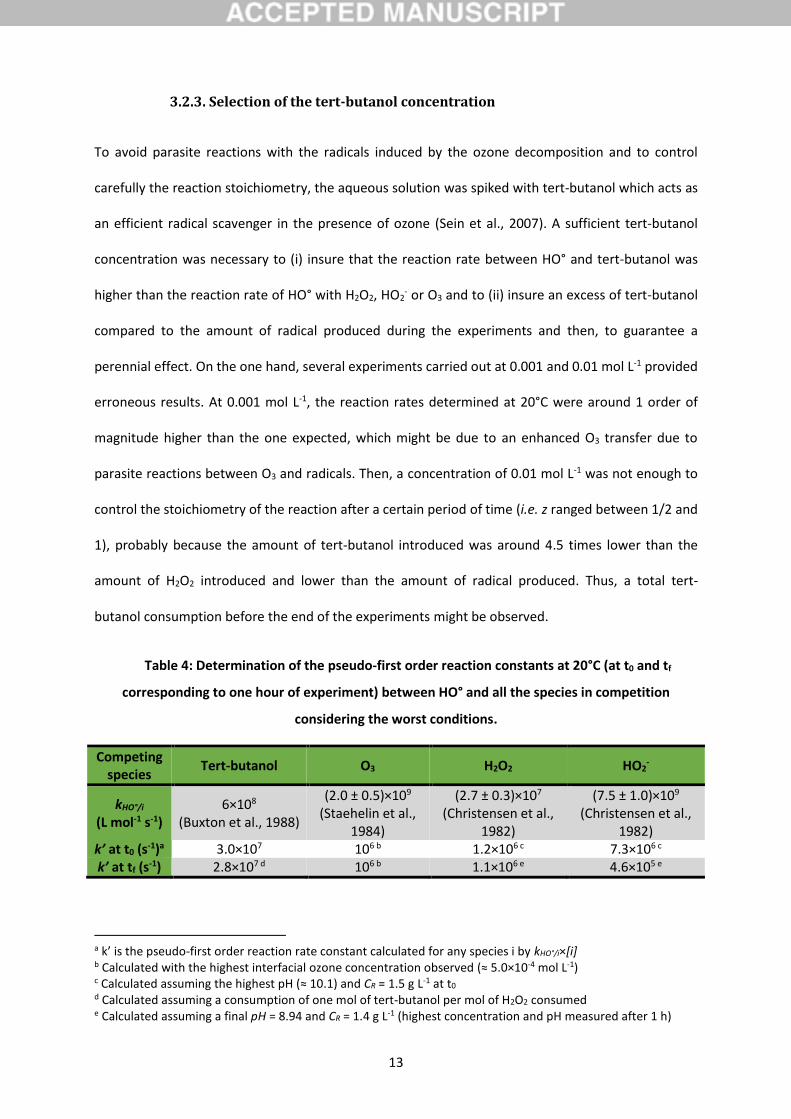
Table 4: Determination of the pseudo-first order reaction constants at 20°C (at t0 and tf
corresponding to one hour of experiment) between HO° and all the species in competition
considering the worst conditions.
Competing species
Tert-butanol O3 H2O2 HO2-
kHO°/i
(L mol-1 s-1) 6×10⁸
(Buxton et al., 1988)
(2.0 ± 0.5)×109
(Staehelin et al., 1984)
(2.7 ± 0.3)×107
(Christensen et al., 1982)
(7.5 ± 1.0)×109
(Christensen et al., 1982)
k’ at t0 (s-1)a 3.0×10⁷ 106 b 1.2×10⁶ c 7.3×10⁶ c k’ at tf (s-1) 2.8×10⁷ d 106 b 1.1×10⁶ e 4.6×10⁵ e
a k’ is the pseudo-first order reaction rate constant calculated for any species i by kHO°/i×[i] b Calculated with the highest interfacial ozone concentration observed (≈ 5.0×10⁻⁴ mol L-1) c Calculated assuming the highest pH (≈ 10.1) and CR = 1.5 g L-1 at t0 d Calculated assuming a consumption of one mol of tert-butanol per mol of H2O2 consumed e Calculated assuming a final pH = 8.94 and CR = 1.4 g L-1 (highest concentration and pH measured after 1 h)
14
On the other hand, using an initial tert-butanol concentration of 0.05 mol L-1, the hydroxyl radicals
should selectively react with the tert-butanol, more than with O3, H2O2 and HO2-, according to the
values of the pseudo-first order reaction rate constants (k’ in s-1) computed between HO° and all
these species (Table 4). Indeed, the values of k’ which corresponds to the reaction between HO° and
tert-butanol are from 4 to 60 times higher than the other values of k’, even after 1 h of experiment. A
consumption of one mol of H2O2 and one mol of tert-butanol and the production of one mol of HO°
per mol of ozone transferred were considered (Moss et al., 2008).
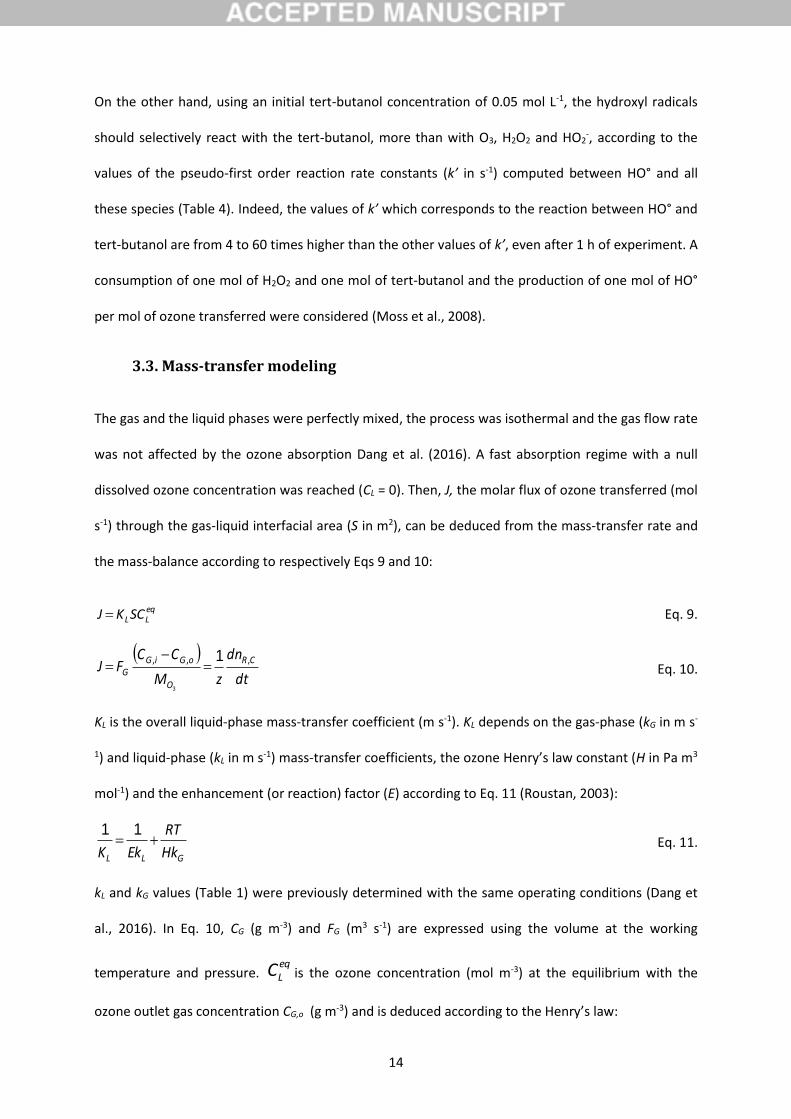
3.3. Mass-transfer modeling
The gas and the liquid phases were perfectly mixed, the process was isothermal and the gas flow rate
was not affected by the ozone absorption Dang et al. (2016). A fast absorption regime with a null
dissolved ozone concentration was reached (CL = 0). Then, J, the molar flux of ozone transferred (mol
s-1) through the gas-liquid interfacial area (S in m2), can be deduced from the mass-transfer rate and
the mass-balance according to respectively Eqs 9 and 10:
eqLLSCKJ Eq. 9.
dt
dn
zM
CCFJ CR
O
oGiGG
,,, 1
3
Eq. 10.
KL is the overall liquid-phase mass-transfer coefficient (m s-1). KL depends on the gas-phase (kG in m s-
1) and liquid-phase (kL in m s-1) mass-transfer coefficients, the ozone Henry’s law constant (H in Pa m3
mol-1) and the enhancement (or reaction) factor (E) according to Eq. 11 (Roustan, 2003):
GLL Hk
RT
EkK
11 Eq. 11.
kL and kG values (Table 1) were previously determined with the same operating conditions (Dang et
al., 2016). In Eq. 10, CG (g m-3) and FG (m3 s-1) are expressed using the volume at the working
temperature and pressure. eqLC is the ozone concentration (mol m-3) at the equilibrium with the
ozone outlet gas concentration CG,o (g m-3) and is deduced according to the Henry’s law:

15
HM
RTCC
O
oGeqL
3
, Eq. 12.
Thus, Eqs. 13 and 14 are deduced from Eqs. 9 and 10 with the help of Eq. 12:
HM
CzSRTK
dt
dn
O
oGLCR
3
,, Eq. 13.
HF
SRTK
CC
G
L
iGoG
1
,, Eq. 14.
Then CG,o can be replaced in Eq. 13 using Eq. 14 to lead to Eq. 15:
1
1
3
SRTK
HF
M
FzC
dt
dn
L
G
O
GiGCR ,, Eq. 15.
Eq. 16 allows to correlate directly KL, and hence E, to the H2O2 concentration time-course.The
determination of E depends on the nature of the reaction(s) (reversible, irreversible, etc.) and
reagents involved, on the reaction kinetics, on the reagent(s) and solute diffusion coefficients and on
kL (van Swaaij and Versteeg, 1992). According to the reactions 1 to 3, the reaction involved assuming
an efficient scavenging of the radicals formed is a bimolecular irreversible reaction. The selected
initial chemical conditions (Table 2) were advantageous to reach long-lasting (at least one hour)
relevant mass-transfer and reaction rates involving a fast absorption regime. Assuming that the
reactant concentration was in excess compared to the interfacial ozone concentration (fast pseudo-
first order absorption regime assumption, checked in the section 3.4.3), E is equal to the Hatta
number (Ha) whatever the considered mass-transfer theory (Beltrán, 1997):
pHpKARL
LR
L
L
Mk
DkC
k
]Dk[HOHaE
10122
2 Eq. 16.
k is the reaction constant of the irreversible bimolecular reaction between HO2- and O3 (L mol-1 s-1). DL
is the ozone diffusion coefficient at infinite dilution in water (m2 s-1). [HO2-] is the bulk HO2
-
concentration (mol L-1) which is deduced from CR , the H2O2/HO2- pKa and of the solution pH. Thus,
16
from Eqs. 11 and 16, KL depends on the chemical conditions (CR, pH), the reaction rate constant k and
the local gas-phase mass-transfer coefficient (kG) through Eq. 17:
1
101
1
G
pHpKAR
LR
LHk
RT
M
DkCK Eq. 17.
Thus, replacing Eq. 17 into Eq. 15, the time derivative of the amount of H2O2 consumed can be
computed according to Eq. 18:
1
101
11
3
SRT
HF
Hk
RT
M
DkCM
FzC
dt
dnG
GpHpKA
R
LRO
GiGCR ,, Eq. 18.
Eq. 18 only depends on the selected operating conditions (T, CG,i, FG) and on the varying chemical
conditions (CR, pH). The geometry and dynamics of the reactor (through the surface area S and kG),
the stoichiometric number (z) and some physico-chemical properties (H, DL, pKa, O3 and H2O2 molar
masses) are also involved.
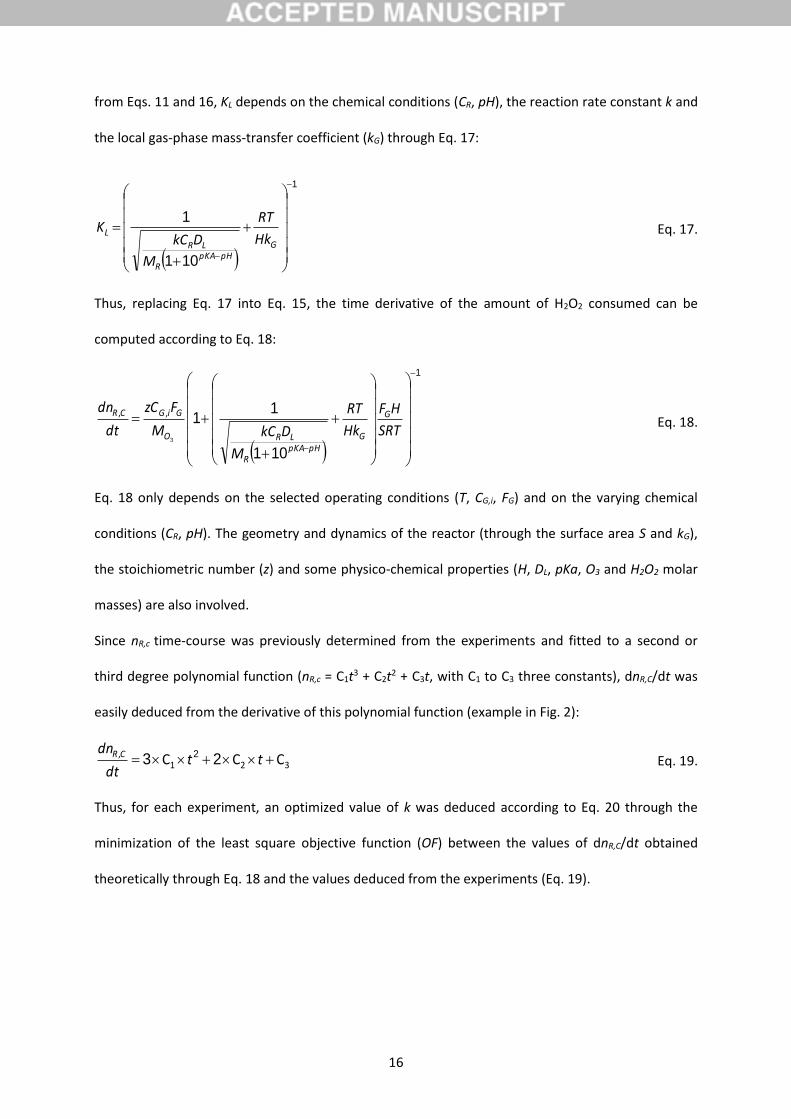
Since nR,c time-course was previously determined from the experiments and fitted to a second or
third degree polynomial function (nR,c = C1t3 + C2t2 + C3t, with C1 to C3 three constants), dnR,C/dt was
easily deduced from the derivative of this polynomial function (example in Fig. 2):
321, CCC tt
dt
dn CR 23 2 Eq. 19.
Thus, for each experiment, an optimized value of k was deduced according to Eq. 20 through the
minimization of the least square objective function (OF) between the values of dnR,C/dt obtained
theoretically through Eq. 18 and the values deduced from the experiments (Eq. 19).

17
n
jt
CR
t
CR
t
CR
j
jj
dt
dn
dt
dn
dt
dn
nOF
1
2
1
Eq.19
,
Eq.19
,
Eq.18
,
with n the number of time-path t Eq. 20.
Then, it was possible to deduce both the theoretical time-courses of nR,C through Eq. 21 and CR
through Eq. 22:
18 Eq.
,
18 Eq.
,,,
t
CR
tt
CRtcR
ttcR
dt
dn
dt
dntnn
2 with 0t
cRn , = 0 Eq. 21.
tt
ttlRR
ttcRR
ttRtt
RV
nMnMVCC
,,00
Eq. 22.
The experimental and theoretical values of CR were in good agreement (example at 20°C in Fig. 1.a).
The theoretical time-course of CG,o was also deduced from Eq. 18 and the mass-balance through Eq. 4
(examples at 20°C in the Fig. 1.b). The time path t of 120 s was sufficient for a good accuracy. In Eq.
18, DL was computed with the empirical correlation of Johnson and Davis (Beltrán, 2004; Johnson and
Davis, 1996; Masschelein, 2000):
KTDL
18961011 6 exp. Eq. 23.
The H2O2/HO2- pKa was calculated according to the results of Evans and Uri (1949) (Evans and Uri,
1949). The pH was computed by second or third degree polynomial functions fitted to the
experimental values with determination coefficients R2 higher than 99% (Example Fig. 2).
3.4. Determination of the reaction rate constant and the activation energy
3.4.1 Reaction rate constant
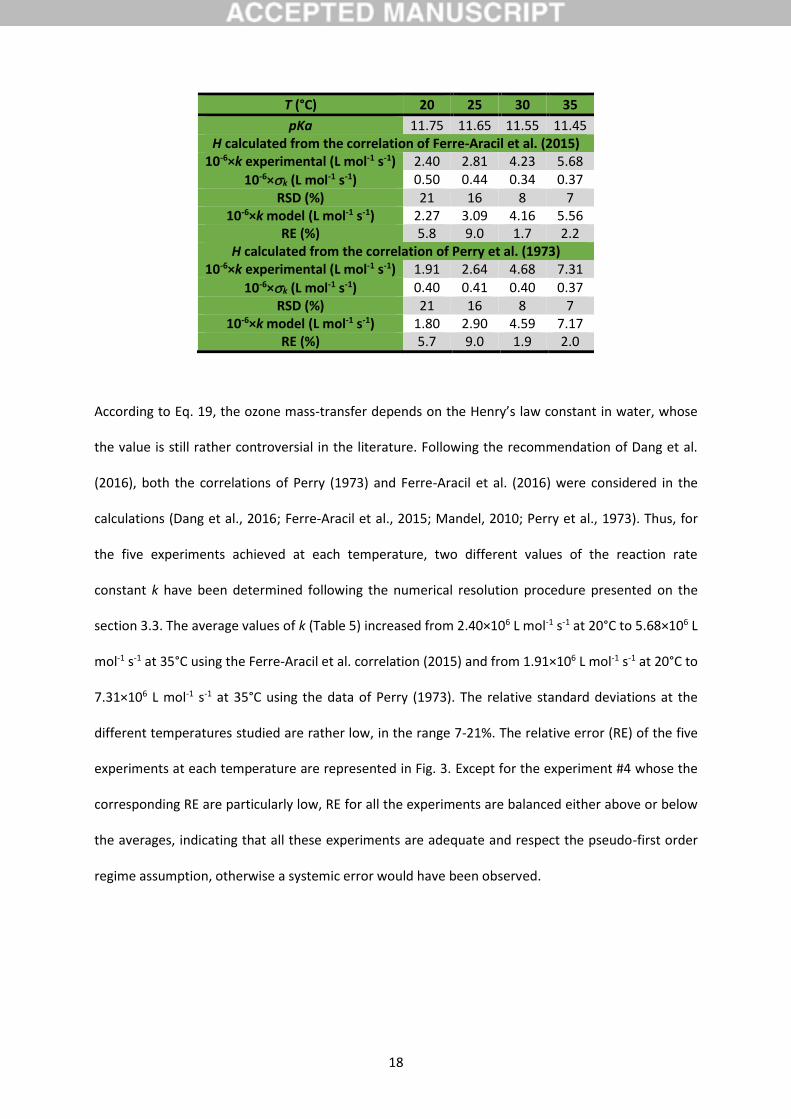
Table 5: Determination of the reaction rate constant considering both the Ferre-Aracil et al.
and Perry’s correlations to determine H. The relative error (RE) is calculated between the
experimental values of k and the values deduced from the Arrhenius law (Eqs 24 and 25).
18
T (°C) 20 25 30 35
pKa 11.75 11.65 11.55 11.45 H calculated from the correlation of Ferre-Aracil et al. (2015)
10-6×k experimental (L mol-1 s-1) 2.40 2.81 4.23 5.68
10-6×k (L mol-1 s-1) 0.50 0.44 0.34 0.37 RSD (%) 21 16 8 7
10-6×k model (L mol-1 s-1) 2.27 3.09 4.16 5.56 RE (%) 5.8 9.0 1.7 2.2
H calculated from the correlation of Perry et al. (1973) 10-6×k experimental (L mol-1 s-1) 1.91 2.64 4.68 7.31
10-6×k (L mol-1 s-1) 0.40 0.41 0.40 0.37 RSD (%) 21 16 8 7
10-6×k model (L mol-1 s-1) 1.80 2.90 4.59 7.17 RE (%) 5.7 9.0 1.9 2.0
According to Eq. 19, the ozone mass-transfer depends on the Henry’s law constant in water, whose
the value is still rather controversial in the literature. Following the recommendation of Dang et al.
(2016), both the correlations of Perry (1973) and Ferre-Aracil et al. (2016) were considered in the
calculations (Dang et al., 2016; Ferre-Aracil et al., 2015; Mandel, 2010; Perry et al., 1973). Thus, for
the five experiments achieved at each temperature, two different values of the reaction rate
constant k have been determined following the numerical resolution procedure presented on the
section 3.3. The average values of k (Table 5) increased from 2.40×10⁶ L mol-1 s-1 at 20°C to 5.68×10⁶ L
mol-1 s-1 at 35°C using the Ferre-Aracil et al. correlation (2015) and from 1.91×10⁶ L mol-1 s-1 at 20°C to
7.31×10⁶ L mol-1 s-1 at 35°C using the data of Perry (1973). The relative standard deviations at the
different temperatures studied are rather low, in the range 7-21%. The relative error (RE) of the five
experiments at each temperature are represented in Fig. 3. Except for the experiment #4 whose the
corresponding RE are particularly low, RE for all the experiments are balanced either above or below
the averages, indicating that all these experiments are adequate and respect the pseudo-first order
regime assumption, otherwise a systemic error would have been observed.

19
Figure 3: Relative error of the five experiments at the different temperatures. The average
experimental values of k are considered for the calculation.
Whatever the correlation considered to calculate the Henry’s law constant, the reaction rate
constant follows undoubtedly the Arrhenius law (Fig. 4), with determination coefficients R2 equal to
97.2% and 98.8%. Thus, the values of k can be extrapolated at any temperature in the range 20-35°C
according to respectively Eq. 24 when H is estimated by the data of Perry (1973) and Eq. 25 when H is
estimated by the correlation of Ferre-Aracil et al. (2015):
KRTk
318 10169
10693.
exp.s mol L 1-1- Eq. 24.
KRTk
314 10944
10292.
exp.s mol L -1-1 Eq. 25.
-50%
-40%
-30%
-20%
-10%
0%
10%
20%
30%
40%
50%
Exp. #1 Exp. #2 Exp. #3 Exp. #4 Exp. #5
Re
lati
ve e
rro
r (%
)
293.15
298.15
303.15
308.15
20
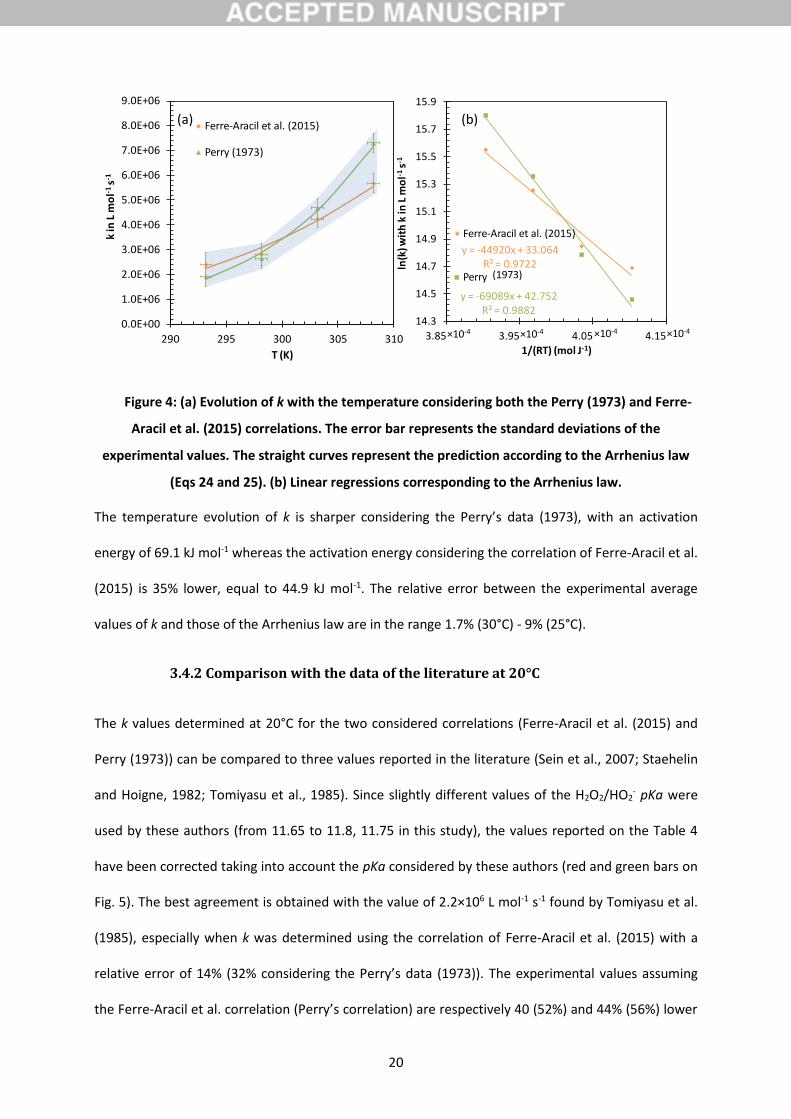
Figure 4: (a) Evolution of k with the temperature considering both the Perry (1973) and Ferre-
Aracil et al. (2015) correlations. The error bar represents the standard deviations of the
experimental values. The straight curves represent the prediction according to the Arrhenius law
(Eqs 24 and 25). (b) Linear regressions corresponding to the Arrhenius law.
The temperature evolution of k is sharper considering the Perry’s data (1973), with an activation
energy of 69.1 kJ mol-1 whereas the activation energy considering the correlation of Ferre-Aracil et al.
(2015) is 35% lower, equal to 44.9 kJ mol-1. The relative error between the experimental average
values of k and those of the Arrhenius law are in the range 1.7% (30°C) - 9% (25°C).
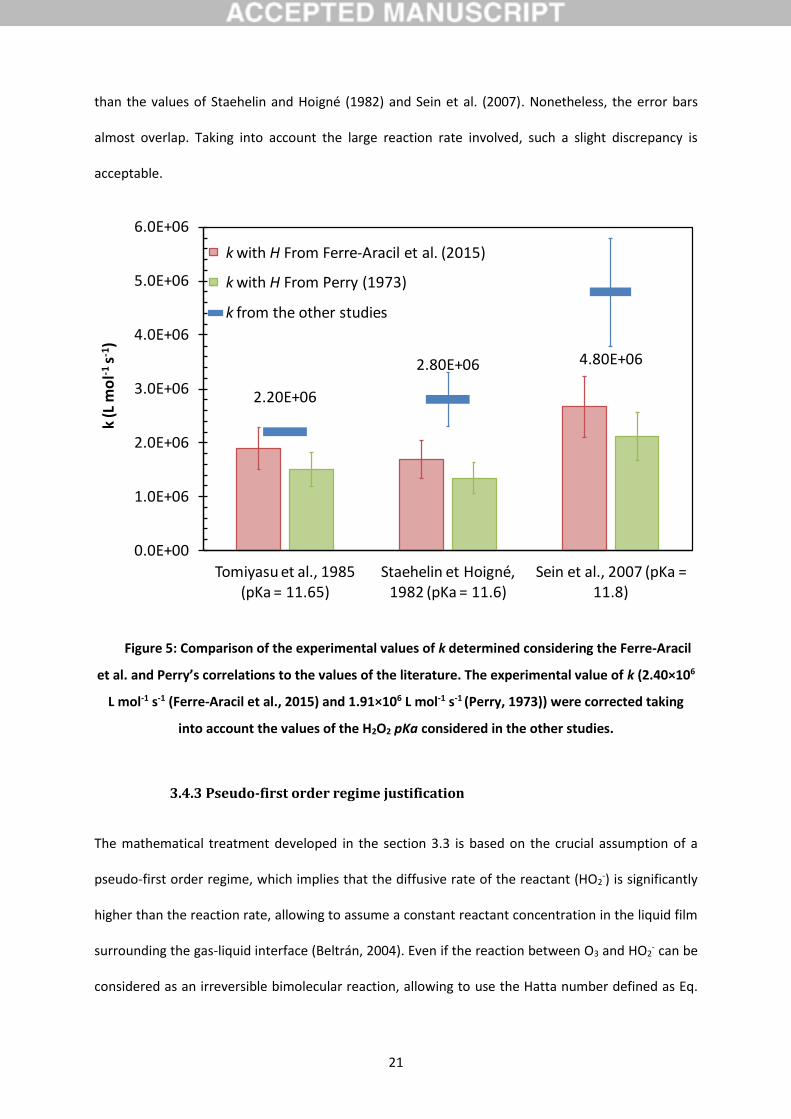
3.4.2 Comparison with the data of the literature at 20°C
The k values determined at 20°C for the two considered correlations (Ferre-Aracil et al. (2015) and
Perry (1973)) can be compared to three values reported in the literature (Sein et al., 2007; Staehelin
and Hoigne, 1982; Tomiyasu et al., 1985). Since slightly different values of the H2O2/HO2- pKa were
used by these authors (from 11.65 to 11.8, 11.75 in this study), the values reported on the Table 4
have been corrected taking into account the pKa considered by these authors (red and green bars on
Fig. 5). The best agreement is obtained with the value of 2.2×10⁶ L mol-1 s-1 found by Tomiyasu et al.
(1985), especially when k was determined using the correlation of Ferre-Aracil et al. (2015) with a
relative error of 14% (32% considering the Perry’s data (1973)). The experimental values assuming
the Ferre-Aracil et al. correlation (Perry’s correlation) are respectively 40 (52%) and 44% (56%) lower
0.0E+00
1.0E+06
2.0E+06
3.0E+06
4.0E+06
5.0E+06
6.0E+06
7.0E+06
8.0E+06
9.0E+06
290 295 300 305 310
k in
L m
ol-1
s-1
T (K)
Ferre-Aracil et al. (2015)
Perry (1973)
y = -44920x + 33.064R² = 0.9722
y = -69089x + 42.752R² = 0.9882
14.3
14.5
14.7
14.9
15.1
15.3
15.5
15.7
15.9
3.85E-04 3.95E-04 4.05E-04 4.15E-04
ln(k
) wit
h k
in L
mo
l-1s-1
1/(RT) (mol J-1)
Ferre-Aracil et al. (2015)
Perry
(a) (b)
×10-4 ×10-4 ×10-4 ×10⁻⁴
(1973)
21
than the values of Staehelin and Hoigné (1982) and Sein et al. (2007). Nonetheless, the error bars
almost overlap. Taking into account the large reaction rate involved, such a slight discrepancy is
acceptable.
Figure 5: Comparison of the experimental values of k determined considering the Ferre-Aracil
et al. and Perry’s correlations to the values of the literature. The experimental value of k (2.40×10⁶
L mol-1 s-1 (Ferre-Aracil et al., 2015) and 1.91×10⁶ L mol-1 s-1 (Perry, 1973)) were corrected taking
into account the values of the H2O2 pKa considered in the other studies.
3.4.3 Pseudo-first order regime justification
The mathematical treatment developed in the section 3.3 is based on the crucial assumption of a
pseudo-first order regime, which implies that the diffusive rate of the reactant (HO2-) is significantly
higher than the reaction rate, allowing to assume a constant reactant concentration in the liquid film
surrounding the gas-liquid interface (Beltrán, 2004). Even if the reaction between O3 and HO2- can be
considered as an irreversible bimolecular reaction, allowing to use the Hatta number defined as Eq.
2.20E+06
2.80E+06 4.80E+06
0.0E+00
1.0E+06
2.0E+06
3.0E+06
4.0E+06
5.0E+06
6.0E+06
Tomiyasu et al., 1985 (pKa = 11.65)
Staehelin et Hoigné, 1982 (pKa = 11.6)
Sein et al., 2007 (pKa = 11.8)
k (L
mo
l-1s-1
)
kFA,modif (L mol-1 s-1)
kPerry,modif (L mol-1 s-1)
k (L mol-1 s-1)
k with H From Ferre-Aracil et al. (2015)
k with H From Perry (1973)
k from the other studies
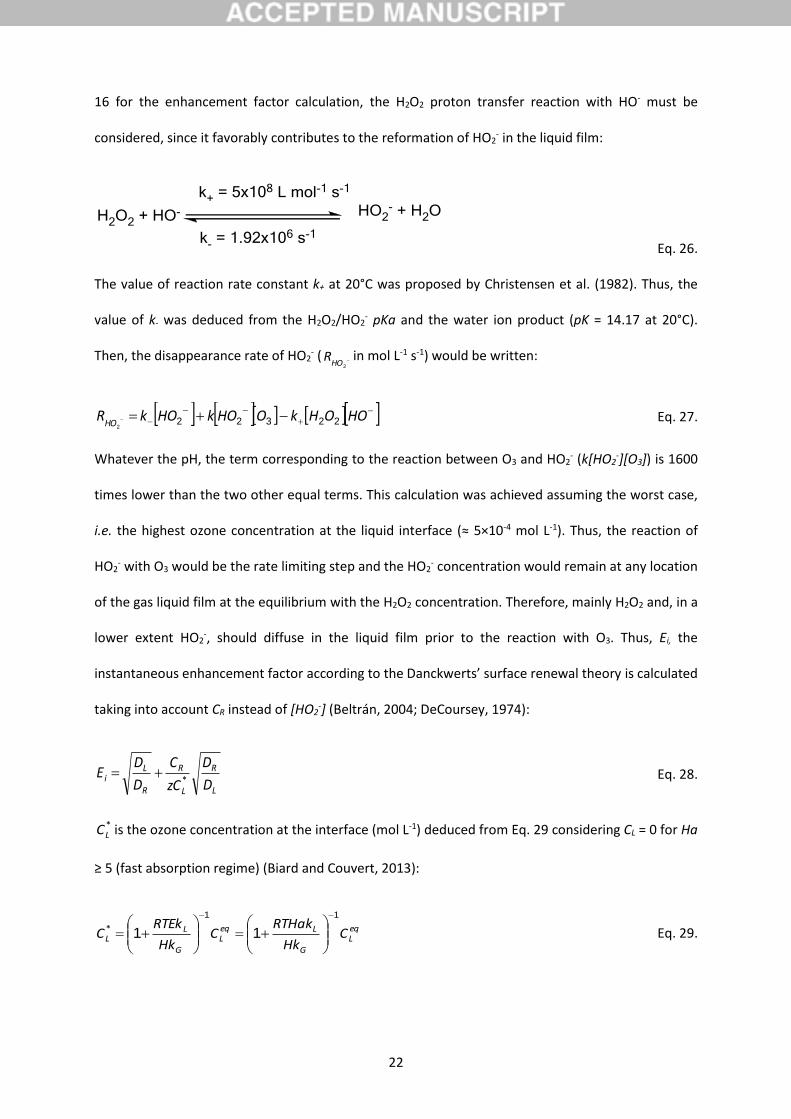
22
16 for the enhancement factor calculation, the H2O2 proton transfer reaction with HO- must be
considered, since it favorably contributes to the reformation of HO2- in the liquid film:
Eq. 26.
The value of reaction rate constant k+ at 20°C was proposed by Christensen et al. (1982). Thus, the
value of k- was deduced from the H2O2/HO2- pKa and the water ion product (pK = 14.17 at 20°C).
Then, the disappearance rate of HO2- (
2HOR in mol L-1 s-1) would be written:
HOOHkOHOkHOkRHO 22322
2
Eq. 27.
Whatever the pH, the term corresponding to the reaction between O3 and HO2- (k[HO2
-][O3]) is 1600
times lower than the two other equal terms. This calculation was achieved assuming the worst case,
i.e. the highest ozone concentration at the liquid interface (≈ 5×10⁻⁴ mol L-1). Thus, the reaction of
HO2- with O3 would be the rate limiting step and the HO2
- concentration would remain at any location
of the gas liquid film at the equilibrium with the H2O2 concentration. Therefore, mainly H2O2 and, in a
lower extent HO2-, should diffuse in the liquid film prior to the reaction with O3. Thus, Ei, the
instantaneous enhancement factor according to the Danckwerts’ surface renewal theory is calculated
taking into account CR instead of [HO2-] (Beltrán, 2004; DeCoursey, 1974):
L
R
L
R
R
Li
D
D
zC
C
D
DE
* Eq. 28.
*LC is the ozone concentration at the interface (mol L-1) deduced from Eq. 29 considering CL = 0 for Ha
≥ 5 (fast absorption regime) (Biard and Couvert, 2013):
eqL
G
LeqL
G
LL C
Hk
RTHakC
Hk
RTEkC
11
11
* Eq. 29.
23
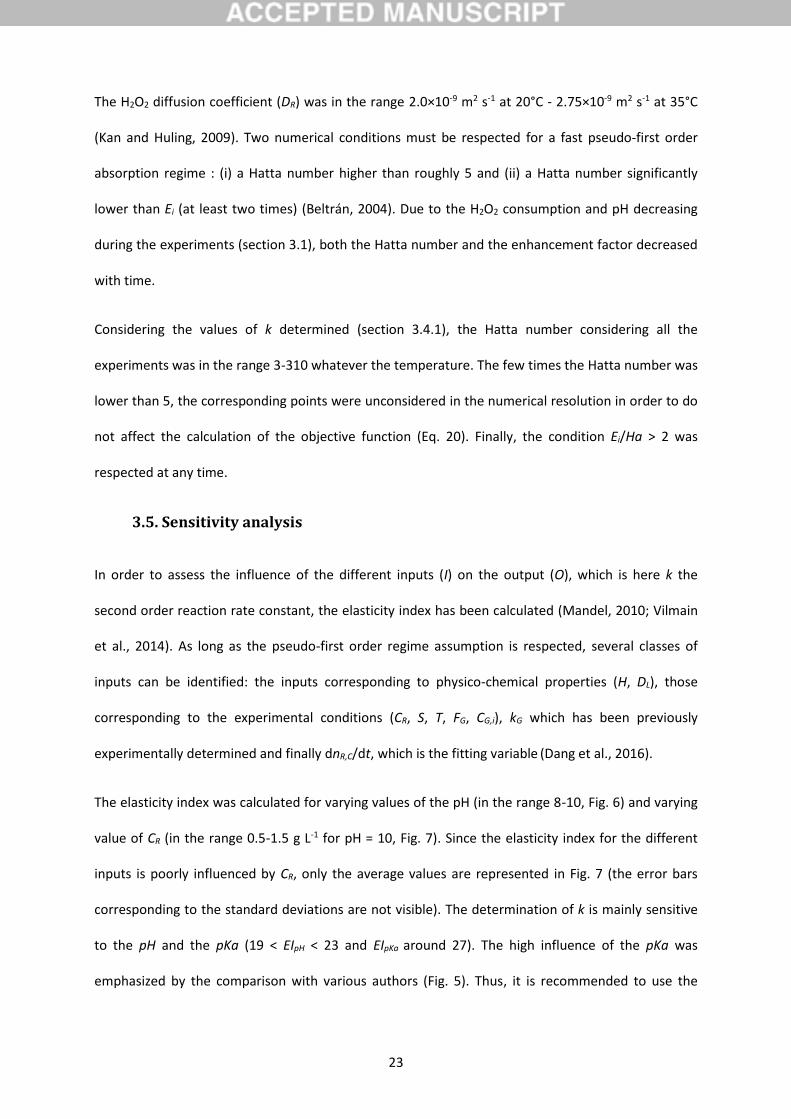
The H2O2 diffusion coefficient (DR) was in the range 2.0×10⁻⁹ m2 s-1 at 20°C - 2.75×10⁻⁹ m2 s-1 at 35°C
(Kan and Huling, 2009). Two numerical conditions must be respected for a fast pseudo-first order
absorption regime : (i) a Hatta number higher than roughly 5 and (ii) a Hatta number significantly
lower than Ei (at least two times) (Beltrán, 2004). Due to the H2O2 consumption and pH decreasing
during the experiments (section 3.1), both the Hatta number and the enhancement factor decreased
with time.
Considering the values of k determined (section 3.4.1), the Hatta number considering all the
experiments was in the range 3-310 whatever the temperature. The few times the Hatta number was
lower than 5, the corresponding points were unconsidered in the numerical resolution in order to do
not affect the calculation of the objective function (Eq. 20). Finally, the condition Ei/Ha > 2 was
respected at any time.
3.5. Sensitivity analysis
In order to assess the influence of the different inputs (I) on the output (O), which is here k the
second order reaction rate constant, the elasticity index has been calculated (Mandel, 2010; Vilmain
et al., 2014). As long as the pseudo-first order regime assumption is respected, several classes of
inputs can be identified: the inputs corresponding to physico-chemical properties (H, DL), those
corresponding to the experimental conditions (CR, S, T, FG, CG,i), kG which has been previously
experimentally determined and finally dnR,C/dt, which is the fitting variable (Dang et al., 2016).
The elasticity index was calculated for varying values of the pH (in the range 8-10, Fig. 6) and varying
value of CR (in the range 0.5-1.5 g L-1 for pH = 10, Fig. 7). Since the elasticity index for the different
inputs is poorly influenced by CR, only the average values are represented in Fig. 7 (the error bars
corresponding to the standard deviations are not visible). The determination of k is mainly sensitive
to the pH and the pKa (19 < EIpH < 23 and EIpKa around 27). The high influence of the pKa was
emphasized by the comparison with various authors (Fig. 5). Thus, it is recommended to use the
24
same pKa values than the one considered to determine k. The pH probe was calibrated daily and
corrected by a temperature compensation. A systematic error in the pH measurement is then
unlikely. Nonetheless, the high sensitivity to the pH affects the experimental uncertainty of k, which
can justify the relative standard deviations observed for the determination of k (Fig. 4.a).
The elasticity indexes corresponding to S, CG,O, CR, DL and H are nearly equal to 2, meaning that an
error of 10% in one of this input would affect by 20% the value of k determined. H and DL are two
physico-chemical properties. Two correlations for H have been considered allowing to define a
window for the k value evolution with the temperature (Fig. 4.a). DL value is controversial in the
literature with a relative difference of 30% considering the empirical correlations of Johnson and
Davis (1996) and Matrozov et al. (1976). The correlation of Johnson and Davis, which provides the
best agreement with the semi-empirical correlation of Wilke-Chang, was taken into account but we
cannot dismiss a potential uncertainty on it. The gas-liquid interfacial area (S) was deduced with a
low uncertainty from the vessel diameter measured with a sliding caliper. CG,o was measured using an
on-line ozone analyzer with an experimental uncertainty lower than 0.5% according to the supplier
(BMT, Germany). The zero of this analyzer was regularly controlled. CR was measured by the
iodometric method with a low relative uncertainty. Therefore, the influence of CR and CG,o in the
determination of k would remain limited. Finally, k was poorly sensitive to the gas phase mass-
transfer coefficient (EIkG < 0.5). Rather low mass-transfer enhancements were involved, allowing to
locate the mass-transfer resistance mainly in the liquid phase. Thus, the experimental uncertainty on
this measured variable poorly influences the determination of k (Dang et al., 2016). Finally, the
determination of k is insensitive to kL and DR when using the pseudo-first order absorption regime.

25
Figure 6: Evolution of the elasticity index of different inputs with the pH (with CR = 1.5 g L-1).
Figure 7: Average elasticity index of different inputs at pH = 10 for 0.5 < CR < 1.5 g L-1 (with CR =
1.5 g L-1).
15
17
19
21
23
25
27
29
0.0
0.5
1.0
1.5
2.0
2.5
3.0
8 8.5 9 9.5 10
EI f
or
pH
an
d p
Ka
EI
pH
kG
pH
pKa
S and CG,o dnR/dt
CR and DL
T
H
0.231.01
2.00 2.04 2.23 2.29
22.83
26.92
0.00
5.00
10.00
15.00
20.00
25.00
30.00
kG CR and DL
H R and T dnR/dt S and CG,o
pH pKa
EI
kG S and CG,oCR and DL H pHdnR/dt pKaT

26
5. Conclusion
The rate constant of the reaction of the hydroperoxide anion (the H2O2 conjugated base) with
molecular ozone was determined in the temperature range from 20 to 35°C by reactive absorption. A
stirred-cell reactor operated semi-continuously was used for this purpose. The operating conditions
(an initial H2O2 concentration around 1.5 g L-1 and an initial pH in the range 9.5-10) were selected to
reach a fast pseudo-first order absorption regime. Tert-butanol was added at a concentration of 0.05
mol L-1 to scavenge the radicals formed allowing to prevent parasite reactions.
From the ozone mass balance and from the hydrogen peroxide concentration time-course, a
consumption of one mol of ozone per mol of hydrogen peroxide was confirmed, in agreement with
the stoichiometry of the initiation reaction.
Thus, from the hydrogen peroxide concentration and pH time-courses, which were correlated to the
ozone mass-transfer rate assuming a pseudo-first order absorption regime, the reaction rate
constant was deduced at 20, 25, 30 and 35°C. The values found at 20°C (1.91 or 2.40×10⁶ L mol-1 s-1,
depending on the considered correlation to calculate the ozone Henry’s law constant) were
consistent with the other values reported in the literature. Thus, the evolution of the reaction
constant was correlated to the temperature using the Arrhenius law. An activation energy in the
range 45-69 kJ mol-1 was determined.
6. Acknowledgments
The authors wish to thank the Vietnam Ministry of Education and Training and Campus France for
their financial supports (PhD thesis grants N° 793312F & 793315L).

27
References
Acero, J.L., Von Gunten, U., 2001. Characterization of oxidation processes : ozonation and the AOP
O3/H2O2. Journal of the American Water Works Association 93, 90-100.
Beltrán, F.J., 1997. Theoretical aspects of the kinetics of competitive first reactions of ozone in the
O3/H2O2 and O3/UV oxidation processes. Ozone Science and Engineering 19, 13 - 38.
Beltrán, F.J., 2004. Ozone reaction kinetics for water and wastewater systems. Lewis Publisher, Boca
Raton.
Beltrán, F.J., Fernández, L.A., Álvarez, P., Rodriguez, E., 1998. Comparison Of Ozonation Kinetic Data
From Film and Danckwerts Theories. Ozone: Sci. Eng. 20, 403-420.
Biard, P.-F., Couvert, A., 2013. Overview of mass transfer enhancement factor determination for
acidic and basic compounds absorption in water. Chem. Eng. J. 222, 444-453.
Bin, A.K., Roustan, M., 2000. Mass transfer in ozone reactors, IOA International specialised
symposium, fundamental and engineering concepts for ozone reactor design, Toulouse, pp. 99-131.
Buehler, R.E., Staehelin, J., Hoigne, J., 1984a. Ozone Decomposition in Water Studied by Pulse
Radiolysis 1. HO2°/O2-° and HO3°/O3°- as Intermediates - Correction. Journal of Physical Chemistry 88,
5450-5450.
Buehler, R.E., Staehelin, J., Hoigne, J., 1984b. Ozone decomposition in water studied by pulse
radiolysis. 1. Perhydroxyl (HO2)/hyperoxide (O2-°) and HO3°/O3
-° as intermediates. Journal of Physical
Chemistry 88, 2560-2564.
Buxton, G.V., Greenstock, C.L., Helman, W.P., Ross, A.B., Tsang, W., 1988. Critical review of rate
constants for reactions of hydrated electrons, hydrogen atoms and hydroxyl radicals (OH•/O•−) in
aqueous solution. Journal of Physical and Chemical Reference Data 17, 513-886.
Cardona, S.C., López, F., Abad, A., Navarro-Laboulais, J., 2010. On bubble column reactor design for
the determination of kinetic rate constants in gas–liquid systems. Can. J. Chem. Eng. 88, 491-502.
28
Christensen, H., Sehested, K., Corfitzen, H., 1982. Reactions of hydroxyl radicals with hydrogen
peroxide at ambient and elevated temperatures. The Journal of Physical Chemistry 86, 1588-1590.
Dang, T.T., Biard, P.-F., Couvert, A., 2016. Assessment of a Stirred-Cell Reactor Operated
Semicontinuously for the Kinetic Study of Fast Direct Ozonation Reactions by Reactive Absorption.
Ind. Eng. Chem. Res. 55, 8058-8069.
DeCoursey, W.J., 1974. Absorption with chemical reaction: development of a new relation for the
Danckwerts model. Chem. Eng. Sci. 29, 1867-1872.
Evans, M., Uri, N., 1949. The dissociation constant of hydrogen peroxide and the electron affinity of
the HO 2 radical. Transactions of the Faraday Society 45, 224-230.
Ferre-Aracil, J., Cardona, S., Navarro-Laboulais, J., 2015. Determination and validation of Henry’s
Constant for Ozone in Phosphate Buffers using different analytical methodologies. Ozone: Sci. Eng.
37, 106-118.
Fischbacher, A., von Sonntag, J., von Sonntag, C., Schmidt, T.C., 2013. The •OH Radical Yield in the
H2O2 + O3 (Peroxone) Reaction. Environ. Sci. Technol. 47, 9959-9964.
Gardoni, D., Vailati, A., Canziani, R., 2012. Decay of Ozone in Water: A Review. Ozone: Sci. Eng. 34,
233-242.
Glaze, W.H., Kang, J.W., 1989. Advanced oxidation processes. Description of a kinetic model for the
oxidation of hazardous materials in aqueous media with ozone and hydrogen peroxide in a
semibatch reactor. Ind. Eng. Chem. Res. 28, 1573-1580.
Glaze, W.H., Kang, J.W., Chapin, D.H., 1987. Chemistry of water treatment processes involving ozone,
hydrogen peroxide and ultraviolet radiation. Ozone Science and Engineering 9, 335-352.
Johnson, P.N., Davis, R.A., 1996. Diffusivity of Ozone in Water. J. Chem. Eng. Data 41, 1485-1487.
Kan, E., Huling, S.G., 2009. Effects of temperature and acidic pre-treatment on Fenton-driven
oxidation of MTBE-spent granular activated carbon. Environ. Sci. Technol. 43, 1493-1499.

29
Luzi, C., Bressa, S., Mazza, G., Barreto, G., 2014. A supporting formulation for introducing gas–liquid
reactions. Ed. Chem. Eng. 9, 50-66.
Mandel, P., 2010. Modelling ozonation processes for disinfection by-product control in potable water
treatment : from laboratory to industrial units, ENSCR. PhD thesis, Université de Rennes 1, Rennes, p.
292.
Mandel, P., Roche, P., Wolbert, D., 2014. Large-Scale Experimental Validation of a Model for the
Kinetics of Ozone and Hydroxyl Radicals with Natural Organic Matter. Ozone: Sci. Eng. 36, 73-85.
Masschelein, W.J., 2000. Fundamental properties of ozone in relation to water sanitation and
environmental applications, IOA International specialised symposium, fundamental and engineering
concepts for ozone reactor design, Toulouse, pp. 1-21.
Matrozov, V., Kachtunov, S., Tregunov, B., Stepanov, A., 1976. Experimental determination of the
molecular diffusion coefficient of ozone in water. Zh. Prikl. Khim 49, 1070-1073.
Merényi, G., Lind, J., Naumov, S., Sonntag, C.v., 2010a. Reaction of Ozone with Hydrogen Peroxide
(Peroxone Process): A Revision of Current Mechanistic Concepts Based on Thermokinetic and
Quantum-Chemical Considerations. Environ. Sci. Technol. 44, 3505-3507.
Merényi, G., Lind, J., Naumov, S., von Sonntag, C., 2010b. The Reaction of Ozone with the Hydroxide
Ion: Mechanistic Considerations Based on Thermokinetic and Quantum Chemical Calculations and
the Role of HO4− in Superoxide Dismutation. Chemistry – A European Journal 16, 1372-1377.
Moss, J.T., Berkowitz, A.M., Oehlschlaeger, M.A., Biet, J., Warth, V., Glaude, P.-A., Battin-Leclerc, F.,
2008. An Experimental and Kinetic Modeling Study of the Oxidation of the Four Isomers of Butanol.
The Journal of Physical Chemistry A 112, 10843-10855.
Paillard, H., Brunet, R., Dore, M., 1988. Optimal conditions for applying an ozone-hydrogen peroxide
oxidizing system. Water Res. 22, 91-103.
Perry, R.H., Green, D.W., Maloney, J.O., 1973. Chemical Engineers handbook. McGraw-Hill
Professional, New-York.

30
Roustan, M., 2003. Transferts gaz-liquide dans les procédés de traitement des eaux et des effluents
gazeux. Lavoisier, Paris.
Sein, M.M., Golloch, A., Schmidt, T.C., von Sonntag, C., 2007. No Marked Kinetic Isotope Effect in the
Peroxone (H2O2/D2O2+O3) Reaction: Mechanistic Consequences. Chem. Phys. Chem. 8, 2065-2067.
Sotelo, J.L., Beltrán, F.J., Gonzalez, M., 1990. Ozonation of aqueous solutions of resorcinol and
phloroglucinol. 1. Stoichiometry and absorption kinetic regime. Ind. Eng. Chem. Res. 29, 2358-2367.
Sotelo, J.L., Beltrán, F.J., Gonzalez, M., Garcia-Araya, J.F., 1991. Ozonation of aqueous solutions of
resorcinol and phloroglucinol. 2. Kinetic study. Ind. Eng. Chem. Res. 30, 222-227.
Staehelin, J., Buehler, R.E., Hoigne, J., 1984. Ozone decomposition in water studied by pulse
radiolysis. 2. Hydroxyl and hydrogen tetroxide (HO4°) as chain intermediates. Journal of Physical
Chemistry 88, 5999-6004.
Staehelin, J., Hoigne, J., 1982. Decomposition of ozone in water: rate of initiation by hydroxide ions
and hydrogen peroxide. Environ. Sci. Technol. 16, 676-681.
Taube, H., Bray, W.C., 1940. Chain Reactions in Aqueous Solutions Containing Ozone, Hydrogen
Peroxide and Acid. J. Am. Chem. Soc. 62, 3357-3373.
Tomiyasu, H., Fukutomi, H., Gordon, G., 1985. Kinetics and mechanism of ozone decomposition in
basic aqueous solution. Inorg. Chem. 24, 2962-2966.
Vaidya, P.D., Kenig, E.Y., 2007. Gas–Liquid reaction kinetics: a review of determination methods.
Chem. Eng. Commun. 194, 1543-1565.
van Swaaij, W.P.M., Versteeg, G.F., 1992. Mass transfer accompanied with complex reversible
chemical reactions in gas—liquid systems: an overview. Chem. Eng. Sci. 47, 3181-3195.
Vilmain, J.-B., Courousse, V., Biard, P.-F., Azizi, M., Couvert, A., 2014. Kinetic study of hydrogen
sulfide absorption in aqueous chlorine solution. Chem. Eng. Res. Des. 92, 191-204.
Von Gunten, U., 2003. Ozonation of drinking water: Part I. Oxidation kinetics and product formation.
Water Res. 37, 1443-1467.
31
Von Sonntag, C., Von Gunten, U., 2012. Chemistry of ozone in water and wastewater treatment:
From basic principles to applications. IWA Publishing, p. 320.