Embed Size (px)
Citation preview

Atmos. Meas. Tech., 7, 2373–2387, 2014www.atmos-meas-tech.net/7/2373/2014/doi:10.5194/amt-7-2373-2014© Author(s) 2014. CC Attribution 3.0 License.
Determination and analysis of in situ spectral aerosol opticalproperties by a multi-instrumental approach
S. Segura1, V. Estellés1, G. Titos2, H. Lyamani2, M. P. Utrillas 1, P. Zotter3, A. S. H. Prévôt3, G. Mocnik4,L. Alados-Arboledas2, and J. A. Martínez-Lozano1
1Departament de Física de la Terra i Termodinàmica, Universitat de València, Burjassot (Valencia), Spain2Andalusian Institute for Earth System Research, IISTA-CEAMA, University of Granada, Junta de Andalucía,Granada, 18006, Spain3Laboratory Atmospheric Chemistry (LAC), Paul Scherrer Institute, Villigen, Switzerland4Aerosol d. o. o., Research and Development Department, Ljubljana, Slovenia
Correspondence to:S. Segura ([email protected])
Received: 19 December 2013 – Published in Atmos. Meas. Tech. Discuss.: 26 February 2014Revised: 21 May 2014 – Accepted: 27 June 2014 – Published: 6 August 2014
Abstract. Continuous in situ measurements of aerosol opti-cal properties were conducted from 29 June to 29 July 2012in Granada (Spain) with a seven-wavelength Aethalometer, aMulti-Angle Absorption Photometer, and a three-wavelengthintegrating nephelometer. The aim of this work is to describea methodology to obtain the absorption coefficients (babs)for the different Aethalometer wavelengths. In this way, datahave been compensated using algorithms which best estimatethe compensation factors needed. Two empirical factors areused to infer the absorption coefficients from the Aethalome-ter measurements:C – the parameter describing the enhance-ment of absorption by particles in the filter matrix due tomultiple scattering of light in the filter matrix – andf , theparameter compensating for non-linear loading effects in thefilter matrix. Spectral dependence off found in this study isnot very strong. Values for the campaign lie in the range from1.15 at 370 nm to 1.11 at 950 nm. Wavelength dependencein C proves to be more important, and also more difficultto calculate. The values obtained span from 3.42 at 370 nmto 4.59 at 950 nm. Furthermore, the temporal evolution ofthe Ångström exponent of absorption (αabs) and the single-scattering albedo (ω0) is presented. On averageαabsis around1.1± 0.3, andω0 is 0.78± 0.08 and 0.74± 0.09 at 370 and950 nm, respectively. These are typical values for sites with apredominance of absorbing particles, and the urban measure-ment site in this study is such. Thebabsaverage values are of16± 10 Mm−1 (at 370 nm) and 5± 3 Mm−1 (at 950 nm), re-spectively. Finally, differences between workdays and Sun-
days have been further analysed, obtaining higherbabs andlower ω0 during the workdays than on Sundays as a conse-quence of the diesel traffic influence.
1 Introduction
The radiative forcing in the Earth’s atmosphere caused byaerosols is highly uncertain (IPCC, 2013). The direct effectof aerosol influence is exhibited by scattering and/or absorb-ing solar radiation. By scattering the light they contributeto the cooling of the underlying atmosphere and the surface(negative radiative forcing). Furthermore, by absorbing lightthey contribute to the heating of the atmosphere (positive ra-diative forcing). The latter is an important component of theradiation budget of the atmosphere which still needs to bebetter characterized to reduce uncertainties in climate models(Houghton et al., 2001; Ramanathan et al., 2001; Kirchstetteret al., 2004).
The major light-absorbing compounds among aerosols arecarbonaceous substances and mineral dust. However, thespectral dependence of the aerosol absorption coefficientvaries depending on their chemical and physical properties.Light absorption by black carbon (BC) is generally con-sidered to vary weakly with wavelength (Bergstrom et al.,2007). Nevertheless, other aerosol components – such asdesert aerosols (Dubovik et al., 2002), organic compounds(Jacobson, 1998), or biomass burning (Mukai and Ambe,
Published by Copernicus Publications on behalf of the European Geosciences Union.

2374 S. Segura et al.: In situ spectral aerosol optical properties
1986) – exhibit a stronger wavelength dependence. There-fore, the spectral dependence of aerosol absorption coeffi-cient is important to distinguish different aerosol-absorbingcomponents (Collaud-Coen et. al, 2004; Fialho et al., 2005;Sandradewi et al., 2008a).
Different methods and instruments are used to measurelight absorption (Hansen et al., 1984; Horvath, 1993; Bondand Bergstrom, 2006; Moosmüller et al., 2009; Müller et al.,2011). The most widely used method for in situ measure-ments is the filter-based technique, which relies on determin-ing the absorption coefficient by measuring the change oflight attenuation due by aerosol collected on a filter matrix(Hansen et al., 1982). Instruments currently used for deter-mining the aerosol absorption coefficient using filter-basedtechniques are the Aethalometer (Hansen et al., 1984), theParticle Soot Absorption Photometer (PSAP) (Bond et al.,1999) and the Multi-Angle Absorption Photometer (MAAP)(Petzold and Schönlinner, 2004).
It is known that all filter-based instruments suffer fromseveral artefacts (Schmid et al., 2006; Müller et al., 2011;Collaud-Coen et al., 2010). Therefore, it is necessary to ap-ply compensation to the data to determine the absorption co-efficient. Several studies have proposed different numericalmethods to compensate these artefacts (Bond et al., 1999;Weingartner et al., 2003; Arnott et al., 2005; Schmid et al.,2006), and have proven to give quite satisfactory results whencompared to other non-filter-based instruments.
From the instruments mentioned above, the MAAP isone of the newer filter-based instrument for measuringthe aerosol absorption coefficient (Petzold and Schönlinner,2004; Petzold et al., 2005). Measurements provided by theMAAP are only available for one wavelength, which is a dis-advantage since it is important to determine bothbabs andits spectral dependence. This information can be obtained bycombining the MAAP measurements with those performedby a multi-wavelength Aethalometer AE-31, which performsmeasurements at seven different channels covering the rangefrom the ultraviolet (UV, 370 nm) to near infrared (NIR,950 nm).
The aim of this work is to obtain the spectral variation ofthe compensation factors of the Aethalometer data and thenapply them to the measurements performed at the differentchannels of the Aethalometer. In this way, the aerosol ab-sorption coefficients at all the different Aethalometer chan-nels are calculated, and then other optical parameters, suchas the spectral single-scattering albedo (ω0) or the Ångströmexponent of absorption (αabs), are determined and analysed.
The data set presented in this study was measured duringone month, from 29 June 2012 to 29 July 2012, in Granada(Spain) using a MAAP, an Aethalometer, and a nephelome-ter. In this work we will discuss the methodology used forcompensating the Aethalometer and MAAP data. Finally,the temporal evolution of the results obtained is presentedand compared with results in other works to evaluate thereliability of the data.
2 Site description and instrumentation
2.1 Measurement site
Measurements presented in this study were performedin Granada, from 29 June to 29 July 2012. Granada(37.18◦ N, 3.58◦ W, 680 m a.s.l.) is a non-industrializedmedium-size city located in southeastern Spain with a popu-lation of around 500 000 inhabitants, considering the wholemetropolitan area (http://www.juntadeandalucia.es/). Near-continental conditions prevail at this site and are responsiblefor large temperature differences, providing cool winters andhot summers (Lyamani et al., 2010).
The measurement station is located in the southern part ofthe city, less than 500 m away from a highway that surroundsthe city. Local aerosol sources are mainly road traffic (domi-nated by diesel engines) together with soil re-suspension, es-pecially during the warm-dry season when the reduced rain-fall may increase the contribution of local mineral dust. Dueto its location in the Mediterranean basin, it is influenced bytwo major aerosol source regions: Europe, as a source of an-thropogenic pollutants, and northern Africa, as a source ofnatural mineral dust (Lyamani et al., 2010).
2.2 Instrumentation
Sampling for all the different instruments was obtained us-ing a stainless steel tube 20 cm in diameter 5 m in length(Lyamany et al., 2008). The inlet was located about 15 mabove the ground. Measurements were carried out withoutan aerosol size cut-off or heating of the sampled air. Fromthe tube, several stainless steel pipes led the sampled air toeach instrument at the appropriate flows. Different diameterswere adjusted to maintain the laminar flow in the tubes andminimize particle losses (Baron and Willeke, 2005).
The aerosol light absorption coefficient was measuredusing two different filter-based instruments. The MAAP(Thermo Scientific) measures the light transmitted throughand backscattered from a particle-loaded filter. Thebabs at637 nm (Müller et al., 2011) is calculated using radiativetransfer model which includes a treatment of the scatter-ing effects of the filter matrix and the light scattered by theaerosol component. A detailed description of the method isprovided by Petzold and Schönlinner (2004). The MAAPworks at a constant flow rate of 16.7 L min−1 and providesmeasurements every minute. The total method uncertaintyfor the aerosol light absorption coefficient inferred fromMAAP measurement is around 12 % (Petzold and Schönlin-ner, 2004; Petzold et al., 2005).
The MAAP was believed to be the instrument which is theleast affected by artefacts for obtaining the aerosol absorp-tion coefficient among all the different filter-based methods.Different studies have shown thatbabs measured by MAAPis in good agreement with those measured by photoacousticspectrometry (e.g. Petzold et al., 2005; Sheridan et al., 2005).
Atmos. Meas. Tech., 7, 2373–2387, 2014 www.atmos-meas-tech.net/7/2373/2014/

S. Segura et al.: In situ spectral aerosol optical properties 2375
However, a recent study by Hyvärinen et al. (2013) showedthat MAAP measurements suffer from some artefacts in lo-cations with high concentrations of light-absorbing parti-cles. Therefore, to avoid these artefacts, MAAP data havebeen compensated using the method described in Hyvärinenet al. (2013). A more detailed explanation can be found inSect. 3.1.
The other instrument used to measure thebabs is theAethalometer model AE-31-ER (Magee Scientific). The AE-31 measures light attenuation at seven different wavelengths(λ) covering the UV (370 nm), visible (470, 520, 590, and660 nm), and NIR (880 and 950 nm) ranges. A complete de-scription of the operating principles of Aethalometers can befound in Hansen (2005).
The Aethalometer measures the light attenuation througha quartz filter matrix as aerosols are deposited on the filter.This parameter is defined by
ATN (λ) = − ln
(I (λ)
I0 (λ)
), (1)
where I is the intensity of light that passes though theparticle-loaded part of the filter, andI0 is the intensity of lightpassing through the unloaded part of the filter. The attenua-tion coefficient (bATN) at each wavelength can be obtainedby
bATN (λ) =A
V
1ATN (λ)
1t, (2)
whereA is the filter spot area (1.67 cm2), V the flow rate,and1ATN is the variation in the attenuation measured dur-ing the time interval1t . The attenuation coefficient is deter-mined from the change of attenuation and is therefore dueentirely to the loading of the filter by aerosols. In this workthe instrument was operated with a flow rate of 4 L min−1 anda sampling interval of 5 min. The compensation algorithm toobtainbabsfrom bATN is described in more detail in Sect. 3.2.
Aerosol scattering (bscat) and backscattering (bbsp) coef-ficients at ground level were measured using a TSI Model3563 three-wavelength (450, 550, 700 nm) integrating neph-elometer (Anderson et al., 1996; Heintzenberg et al., 2006).This instrument draws the ambient air through a temperature-monitored inlet at a flow rate of 30 L min−1, illuminates thesample with a halogen lamp, and measures the scattered lightusing three photomultiplier tubes. The scattered light is inte-grated over an angular range which can be adjusted to ei-ther 7–170◦ or 90–170◦, using a backscatter shutter to givetotal scatter and backscatter signals. Pressure and tempera-ture are measured in the sample chamber, so scattering byair molecules can be calculated and then subtracted from thetotal scattering to determine scattering by aerosol particles.In our case, although no drying of the aerosol stream wasperformed, the relative humidity measured within the neph-elometer chamber was low with a mean value of 28± 10 %.Thus, we can consider that the hygroscopic growth does not
affect our measurements. In this study, non-idealities dueto truncation errors were corrected (Anderson and Ogren,1998). Uncertainties in the nephelometer measurements con-sist of angular truncation errors, non-Lambertian nature ofthe light source, and wavelength non-idealities. The calibra-tion uncertainty is approximately 7 % (Anderson et al., 1996;Anderson and Ogren, 1998; Esteve et al., 2012).
3 Data compensation and methods
All filter absorption photometers are affected by loading ef-fects which need to be compensated, and the various com-pensation methods relied mostly on the continuity of data(Weingartner et al., 2003; Virkkula et al., 2007; Hyvärinenet al., 2013) to derive the compensation parameters. Here wepropose a more robust method to determine the quality of thecompensation for loading effects: the slope of the absorp-tion coefficient vs. the loading of the spot. This method wasused to compensate the BC measurements (Park et al., 2010),but here we use it as an independent criterion to evaluate thecompensation. This criterion does not use any assumptionsor external data, only the measurements from a single instru-ment – it checks the measured parameters for internal con-sistency. For a long period of homogeneous measurementsin terms of the sources and meteorology, the absorption co-efficient should not depend on the loading of the spot. Theuncompensated measurements of BC in filter photometersare proportional to the time derivative of the attenuation ofdetected light intensity (MAAP: in reflection; Aethalometer:in transmission), not on the absolute attenuation values. Anydependence of the measured absorption on the loading (at-tenuation) is evidence of a bias due to the loading of the spot.The parameter, which was shown to be most representative ofthese effects, is the slope of the attenuation or absorption co-efficient or as a function of the loading (following the logic inPark et al., 2010). We will demonstrate the usefulness of thismethod as an independent criterion of the compensation forboth absorption photometers used in the study – the MAAPand the Aethalometer AE-31 – by plotting the average valueof the attenuation or absorption coefficient as a function ofthe loading of the spot with BC.
3.1 MAAP compensation
Hyvärinen et al. (2013) observed that at high BC concen-trations the MAAP measurements are also affected by arte-facts which are different to those seen in other filter-basedinstruments, such as the PSAP or the Aethalometer. Two so-lutions were proposed to avoid or compensate for this prob-lem: either applying a compensation algorithm to thebatngiven directly by the MAAP’s internal algorithm or using re-flectance signal only, as obtained from the photodetector at165◦, which was found to be relatively free of this artefact,
www.atmos-meas-tech.net/7/2373/2014/ Atmos. Meas. Tech., 7, 2373–2387, 2014

2376 S. Segura et al.: In situ spectral aerosol optical properties
Figure 1. Non-compensated absorption coefficient (batn,MAAP) vs.compensated absorption coefficient obtained from the reflected sig-nal (babs,MAAP), showing the relationship between thebatn,MAAPgiven by the MAAP, as explained in Sect. 2.2, and the compensatedbabs,MAAP obtained with the reflected signal at 165◦.
albeit exhibiting more scatter and not completely eliminatingthe artefact jump at the tape advance (Hyvärinen et al., 2013).
In this work, the MAAP was set to give the photodetectorraw signals as an output, so the reflected signal at 165◦ waschosen to obtain the absorption coefficient at 637 nm. The at-tenuation coefficient given by the MAAP (batn,MAAP) can bedetermined from the reflected signals by using the followingequation (Petzold et al., 2005):
batn,MAAP = 0.5A
Vln
(R0
R
), (3)
where, in our case, (R0/R) is the ratio of the photodetectorsignal at 165◦ for a particle-free to a particle-loaded filter,A
is the filter spot area (2 cm2), andV is the sampled volume.The multiplication factor of 0.5 in Eq. (3) has to be appliedbecause the light passes through the layer of sampled aerosoltwice before reaching the photodetector.
The value obtained from Eq. (3) does not correspond tothe absorption coefficient since there is a filter-loading effectwhich influences the measured signals. Petzold et al. (2005)determined an empirical method to compensate this arte-fact using test aerosols. These test aerosols consisted of pureblack aerosol samples from kerosene flame particles, and ex-ternally mixed grey and black aerosols of varying single-scattering albedo. The obtained relation for the aerosol ab-sorption coefficient for these aerosols using the reflected sig-nal is
babs,MAAP = batn,MAAP
(0.226+ 1.415
R
R0.
)−1
(4)
Figure 2.Average attenuation and absorption coefficient vs. loadingof the spot:(a) the non-compensated MAAP attenuation coefficientbatn,MAAP and the compensated (Eq.4) MAAP absorption coeffi-cient babs,MAAP , and(b) the Aethalometer attenuation coefficientbATN and the compensated (Eq.7) Aethalometer absorption coeffi-cientbabs.
Similar to Hyvärinen et al. (2013), values automatically pro-vided by the MAAP are lower than those calculated from rawreflected signal for high absorption coefficients (babs,MAAP)
(Fig. 1). We do not observe any systematic saturation in themeasurements as found previously (Kanaya et al., 2008) orlarge discontinuities in the data at the tape advance (Britoet al., 2013). This indicates that the use of the reflectionsignals rather than the default values compensated the datasuccessfully. To check the compensation, we plot (Fig. 2a)the average value of the MAAP attenuation and absorptioncoefficient in a spot-loading bin (with width 0.3 µg cm−2)
as a function of the loading of the spot with BC betweena clean filter (no loading) and the BC value with enoughdata in the campaign to gather enough statistics (just above5 µg cm−2). The slope of the compensated MAAP absorp-tion coefficient is half of that of the uncompensated ones,proving that the compensation reduces the loading effects.Another feature which is informative is the intercept of thefit: this is the uncompensated MAAP attenuation coeffi-cient (7.83 Mm−1; Fig. 2a) or the compensated absorption
Atmos. Meas. Tech., 7, 2373–2387, 2014 www.atmos-meas-tech.net/7/2373/2014/

S. Segura et al.: In situ spectral aerosol optical properties 2377
coefficient (6.94 Mm−1; Fig. 2b) characteristic for the cam-paign. We propose to use the difference between the intercept6.94 Mm−1 (that is, the compensated absorption coefficient,representative for the campaign) and the campaign averageabsorption coefficient 7.25 Mm−1 as an additional internalcriterion for the “efficiency of compensation” with an empir-ical limit of 5 %. The compensation of the MAAP data usingthe reflection measurements, rather than the raw MAAP data,satisfies this criterion, and we use the compensated MAAPabsorption coefficient for comparison with the Aethalometerattenuation and absorption coefficients.
3.2 Aethalometer
3.2.1 Data pre-processing
The Aethalometer raw data were first screened with threecriteria: data showing excessive noise, and the upper andlower limits of the Aethalometer detection. High noise in themeasurements degrades the determination of the absorptionspectral dependence. This wavelength dependence can be ap-proximated by a power-law expression (Ångström, 1929).A measurement is considered too noisy if the curve cannotfit a spectrum satisfactorily (Rizzo et al., 2011); therefore,only fits with R2 higher than 0.85 have been chosen to re-duce noise. The same data treatment was applied to the neph-elometer data as well.
The second criterion is related to the lower detection limitof the instrument, as the measured attenuation should beabove it. According to the Aethalometer manual, this limitcorresponds to a mass increase of 5 ng and can be expressedin units of thebabs(Mm−1) by the following expression:
min(babs) =m · σATN (λ)
1t · V, (5)
where m = 5 ng, σATN(λ) is the mass-specific attenuationcross section in m2 g−1, 1t is the time-based period (set to5 min in our case), and V is the sampling flow in L min−1
(4 L min−1 in our instrument). The attenuation cross sectionis calculated using the following equation:
σATN =14625
λ [nm]. (6)
This equation is based on a calibration at 880 nm using theMalissa–Novakov method, a solvent-based thermal desorp-tion method for elemental carbon analysis (Gundel et al.,1984).
Also, as a consequence of random voltage fluctuations andfrom recording discontinuities which take place during theAethalometer’s tape advance, a third criterion related to theupper detection limit is applied (De Castro et al., 2008). Toidentify these low-quality data, the 99th percentile of the at-tenuation coefficient (i.e. 162.2 Mm−1 at 660 nm) was cho-sen as the extreme upper limit.
From the whole data set, 4 % of the data did not satisfyany of these three criteria, leaving a total number of 8276measurements.
3.2.2 Data compensation
Aethalometer artefacts, unlike MAAP artefacts, are wellknown and five different algorithms have been proposed tocompensate them (Weingartner et al., 2003; Arnott et al.,2005; Schmid et al., 2006; Virkkula et al., 2007; Collaud-Coen et al., 2010). The light beam crossing the filter suf-fers (1) multi-scattering effects due to the filter fibres;(2) single-scattering effects, due to the aerosol particles de-posited in the filter; and (3) filter-loading effects, which arerelated to the shadowing produced as the particles accumu-late on the filter. The result of these optical interactions isthatbATN is generally larger thanbabs (Petzold et al., 1997;Ballach et al., 2001).
Due to the aforementioned aerosol–filter interactions, theAethalometer requires specific site compensation factors. Inthis sense, we have calculated these compensation factorsfor our site and used them to compensate the Aethalometerdata by applying the algorithms proposed by Weingartner etal. (2003) and Schmid et al. (2006). The reason to select thesetwo algorithms, out of the five existing ones, is that Wein-gartner et al. (2003) and Schmid et al. (2006) found a wayto obtain the spectral dependence of the multiple-scatteringcompensation factor from aerosol single-scattering albedo.Knowing this spectral dependence will allow us to convertbATN to babs for all seven Aethalometer wavelengths. Themost important difference between these two algorithms liesin the fact that Weingartner’s algorithm does not considerthe artefact produced by the single-scattering effect, whileSchmid’s does.
In their test with ammonium sulfate, Weingartner etal. (2003) found no significant dependence ofbATN on thescattering component of the aerosol in the filter. Therefore,they proposed an algorithm to obtainbabswithout taking intoaccount the single-scattering effect of the aerosols:
babs=bATN
C · R(f,ATN), (7)
whereC is the parameter describing the enhancement of ab-sorption particles in the filter matrix and compensates for themultiple-scattering effects exhibiting values≥ 1 andR(f ,ATN) for the loading effect with values≤ 1. The loadingcompensation depends on the amount of the sample collectedon the filter and is hence dependent on the attenuation mea-sured by the Aethalometer. The parameter can be expressedas proposed in Weingartner et al. (2003):
R(f,ATN) =
(1
f− 1
)lnATN − ln10%
ln50%− ln10%+ 1, (8)
wheref is the shadowing factor, which depends on the typeof the aerosols. This parameter has been calculated by min-imizing the difference between the ratio ofbATN before and
www.atmos-meas-tech.net/7/2373/2014/ Atmos. Meas. Tech., 7, 2373–2387, 2014

2378 S. Segura et al.: In situ spectral aerosol optical properties
Table 1.Compensation factors obtained for the seven Aethalometerwavelengths:f corresponds to the “shadowing effect” in the load-ing compensation; 100ms is the value given in Arnott et al. (2005)to the scattering fraction of particles;C∗
Arnott is the value given inArnott et al. (2005) to the multiple-scattering compensation factor(C∗ in Schmid et al., 2006, and in this work);C∗ andC are thevalues specifically site-calculated in this work.
Spectral compensation factors
λ (nm) 370 470 520 590 660 880 950f 1.204 1.141 1.120 1.093 1.084 1.044 1.041100ms 3.35 4.57 5.23 6.16 7.13 10.38 11.48C∗
Arnott 1.813 2.073 2.076 2.104 2.182 2.226 2.199C∗ 3.26 3.72 3.73 3.78 3.92 3.99 3.95C 3.42 3.87 3.90 3.98 4.19 4.35 4.59
after the filter spot change. The calculated medianf valueswere plotted as a function ofλ and fitted with a linear equa-tion (Sandradewi et al., 2008b). Values obtained for this pa-rameter are shown in Table 1.
The effect of the compensation of the Aethalometer mea-surements is shown in Fig. 2b. The slope reduces signif-icantly to a value which is non-distinguishable from 0 –the compensation is efficient in eliminating the loading ef-fects. The difference between the intercept 7.14 Mm−1 (thecompensated absorption coefficient, representative for thecampaign) and the campaign average absorption coefficient7.10 Mm−1 satisfies the empirical 5 % criterion. Addition-ally, the value lies extremely close to the average and theintercept determined from the analysis of the MAAP com-pensation (Sect. 3.1).
Since the loading effect is small for lightly loaded filters(Weingartner et al., 2003),C can be determined by compar-ing low loaded Aethalometer measurements (ATN< 10 %)with the ones obtained by a different comparison instrument.In this study we compared the Aethalometer-derived absorp-tion coefficient withbabs,MAAP from the MAAP, andC isdetermined using the equation proposed in Weingartner etal. (2003) as
C =bATN (ATN < 10)
babs,MAAP. (9)
C has been calculated at 637 nm, as the MAAP measure-ments are performed at this wavelength. Since the nearestwavelengths in the Aethalometer are 590 and 660 nm,bATN(637 nm) has been calculated by approximating the wave-length dependence of the attenuation spectra for each mea-surement to a power-law expression, such as
bATN (λ) = a · λ−αatn, (10)
wherea is a fitting parameter andαatn is the Ångström expo-nent of attenuation.
After taking logarithm of Eq. (10), a “linear fit” was ap-plied to the log–log curve:
ln [bATN (λ)] = lna − αatnln(λ) . (11)
To calculateC, bATN at 637 nm for the Aethalometer datahas to be calculated sincebabs,MAAP in Eq. (9) is related to637 nm. The averageC value at the wavelength of 637 nm(C637) was determined to beC637 = 4.22± 0.06 from thearithmetic mean (95 % confidence level of the mean) of theratios of bATN (637) andbabs,MAAP (Schmid et al., 2006).Collaud-Coen et al. (2010) obtained differentC values rang-ing between 2.8 and 7.8 at several sites. In particular, fromthe different sites chosen in that paper, our value is close tothose obtained (C = 4.12± 0.06 at 660 nm,C660) at Cabauw(the Netherlands), a background site located near populatedand industrialized areas (Collaud-Coen et al., 2010).
Some publications (Lack et al., 2009; Nakayama et al.,2010) indicate that the multiple-scattering compensation fac-tor might depend on the particle size, as the aerosol penetra-tion depth into the filter varies depending on the size. Sincethis effect is still difficult to quantify (Rizzo et al., 2011), it isnot straightforward to conclude if there will be an overesti-mation or underestimation in our absorption coefficients dueto this effect. A significant part of the aerosol loading on thefilter tape on the measurement site is always diesel exhaustparticles, so at least this part of the loading is extremely ho-mogeneous. Therefore, we did not consider this effect furtherin this manuscript.
3.2.3 Spectral dependence ofC and Aethalometerabsorption coefficients
Schmid et al. (2006) parameterized (based on Arnott et al.,2005) the spectral dependence ofC using the following ex-pression:
C (λ) = C∗ (λ) + ms(λ)ω0 (λ)
1− ω0 (λ), (12)
where C∗ is the multiple-scattering compensation factor,which includes the effects of aerosol scattering;ms is thefraction of the aerosol scattering coefficient erroneously in-terpreted as absorption;ω0 is the aerosol single-scatteringalbedo; andλ is the wavelength. BothC∗(λ) andms werecalculated for ammonium sulfate particles by Arnott etal. (2005). They however showed that these values gave un-satisfactory results when used to correct ambient measure-ments.
Equation (12) has been used to obtainC∗ at 637 (C∗
637)
usingC637 calculated in the previous section with Eq. (9).Once it is calculated,C∗ values for the other wavelengthswill be obtained assuming the same wavelength dependenceas in Arnott et al. (2005). Values ofms used here were takenfrom Arnott et al. (2005) since with our data it is not pos-sible to determine them.ω0 (637) was calculated using thefollowing expression (Schmid et al., 2006):
ω0 (637) =bscat(637)
bscat(637) + babs,MAAP (637), (13)
where babs,MAAP (637) is the MAAP absorption coeffi-cient measured at 637 nm andbscat (637) is the scattering
Atmos. Meas. Tech., 7, 2373–2387, 2014 www.atmos-meas-tech.net/7/2373/2014/

S. Segura et al.: In situ spectral aerosol optical properties 2379
coefficient from the nephelometer, interpolated to 637 nm byusing Eqs. (10) and (11) for bscat(λ).
To obtain the differentC values for the remainingAethalometer wavelengths,ω0(λ), C∗(λ), and ms(λ), arerequired (Eq.12). Equation (13) is not useful in this casesince MAAP absorption is only obtained at one wavelengthand cannot be applied for the other Aethalometer channels.Therefore, for calculatingω0(λ) we used the following ex-pression (Schmid et al., 2006):
ω0 (λ) =
ω0,ref
(λ
λref
)−αscat
ω0,ref
(λ
λref
)−αscat+
(1− ω0,ref
)(λ
λref
)−αabs, (14)
whereω0,ref is the reference single-scattering albedo calcu-lated at 637 nm (λref) using Eq. (13), αscat is the Ångströmexponent of scattering, andαabs is the Ångström exponentof absorption.αscat depends on thebscat measured at differ-ent wavelengths and can be obtained from the nephelome-ter measurements (450–700 nm). However,αabs is calculatedfrom the babs measured by the Aethalometer at differentwavelengths.
Schmid et al. (2006) used fixed values forαscatcalculatedusing wavelengths 450–700 (αscat,450−700) andω0(545) mea-surements given by Chand et al. (2006) for Amazonia, and arange of differentαabs based on Kirchstetter et al. (2004) toobtain a parameterization function ofC(λ) andαabs. Thenthey applied an iterative procedure over this function toobtain C(λ) and αabs. The fixed values used wereαscat=
2.0± 0.4 andω0(532)= 0.92± 0.02, which differ from ourvalues in Granada during July 2012,αscat,450−700 = 1.3± 0.3and ω0(637)= 0.76± 0.08, consistent with the prevalenceof diesel traffic on the highway near the measurement site.These differences between both sites are significant andmake the parameterization function ofC(λ) given by Schmidet al. (2006) not applicable to our measurements. Therefore,based on their work, the iterative procedure has been used tocalculateαabs and, then,C(λ) andbabs(λ), following thesesteps:
1. The Ångström exponent of attenuation (αatn) is calcu-lated by fitting the logarithm of the spectral attenuationcoefficients with a linear fit as presented in Eq. (11).
2. Theαatn is used in Eq. (14) as a first estimation ofαabs,to obtainω0(λ), and then the compensation factorC
for each Aethalometer wavelength is calculated usingEq. (12).
3. The compensation factorC(λ) at different wavelengthsis used in Eq. (7) to obtain the new compensated absorp-tion coefficients (babs).
4. This newbabs(λ) is used again in step 1 to get a betterestimation forαabs.
5. Repeat steps 2–4 untilαabs converges with a precisionof 0.005.
Figure 3. Comparison of the Aethalometer vs. MAAP absorp-tion coefficient (babs,MAAP) at 637 nm for(a) non-compensatedAethalometer data (bATN) and (b) Weingartner’s compensation(babs,W).
4 Results of the compensations
4.1 Non-compensated/compensated Aethalometer vs.MAAP data
In Fig. 3a, non-compensated Aethalometer data (bATN) at637 nm obtained using Eq. (11) are compared tobabs,MAAPvalues. The Aethalometer and the MAAP are well correlated,with R = 0.917, while the slope of 3.66 shows the relation-ship between the Aethalometer attenuation coefficient andthe MAAP absorption.
After Weingartner’s compensation (Weingartner et al.,2003) is applied to the Aethalometer attenuation coefficient,we obtain the compensated Aethalometer absorption coef-ficient, which is represented asbabs,W in this section to
www.atmos-meas-tech.net/7/2373/2014/ Atmos. Meas. Tech., 7, 2373–2387, 2014

2380 S. Segura et al.: In situ spectral aerosol optical properties
Table 2.Statistics of MAAP and Aethalometer compensated and non-compensated absorption coefficients at 637 nm: mean standard error,standard deviation, median, maximum, minimum, 25th percentile, and 95th percentile. MAAP corresponds tobabs,MAAP statistics;bATNcorresponds to non-corrected Aethalometer data;babs,W corresponds to data compensated as proposed by Weingartner et al. (2003); andbabs,Arnott represents data compensated with the algorithm and compensation factors (M andα) from Arnott et al. (2005).
b637 (Mm−1) Mean± SE SD Median Minimum Maximum P25 P95
babs,MAAP 9.15± 0.07 5.8 7.7 1.76 49.0 5.3 20.2bATN 34.0± 0.2 21.5 28.7 6.37 171.5 19.7 76.0babs,W 9.35± 0.07 6.1 7.8 1.87 48.0 5.3 21.3babs,Arnott 17.84± 0.13 11.6 14.8 3.56 91.5 10.1 40.6
highlight that it has been obtained using Weingartner’s com-pensation. The slope betweenbabs,W andbabs,MAAP changesto 1.005 and there appears a slight increase of the correlationcoefficient: from 0.917 to 0.926 (Fig. 3b). The compensationfactors used (C637= 4.22± 0.06 andf637≈ f660= 1.131)were already obtained in Sect. 3.2.2. Dispersion of somepoints is due to some noise in the data which has notbeen removed by the filtration algorithm described above inSect. 3.2.1.We can further reduce this dispersion by averag-ing the data over a more extended period of time. Further-more, the compensatedbabs,W values are on average 73 %lower than corresponding non-compensatedbATN values anddiffer from babs,MAAP on average by around 2 %.
The statistics of the comparison between the two datasets are shown in Table 2. Average values ofbabs,MAAPandbabs,W with their standard deviations are 9.2± 5.8 and9.4± 6.1 Mm−1, respectively. The 25th and 95th percentilefor both data sets are very similar, indicating a similar dis-tribution of the data. The statistical analysis shows a goodagreement betweenbabs,MAAP and babs,W. Therefore it isconcluded that Weingartner’s compensation, with our site-specific compensation parameters, compensates satisfacto-rily the AethalometerbATN to obtain absorption coefficientswhich agree well with those measured by the MAAP.
4.2 Compensation parameters at different wavelengthsand final compensation
The spectral dependence ofC can be obtained using Eq. (12).To start, C∗ and ms as proposed in Arnott et al. (2005)for 660 nm were used (see Table 2). TheC660 value of2.21 was obtained, which is only∼ 50 % of the value ob-tained at 637 nm (see previous Sect. 3.2.2). Applying thiscompensation factor leads to unsatisfactory comparison withbabs,MAAP , since the new compensated data (babs,Arnott) over-estimate the MAAP data (slope of 1.92). The statistics of thecomparison of these two data sets are shown in Table 2 asbabs,Arnott. These results corroborate that theC∗ andms pa-rameter values from Arnott et al. (2005) are not applicablefor this campaign. To get a better estimation of the spec-tral dependence onC, specific ambient measurements werecalculated to obtainC∗(λ). As we only have availableC637for the direct comparison of the two absorption photome-
ters,C∗
637 can be calculated by using Eq. (12) and assumingms(637) ≈ ms(660)= 0.0713 (Table 1). The value obtainedis 3.93, which differs from the value obtained by Arnott etal. (2005) in the laboratory (C∗
Arnott of 2.182 at 660 nm), ascan be seen in Table 1. On the other hand, this value is con-sistent with their proposal ofC∗ (521)= 3.69 for ambientmeasurements. Following this,C∗(λ) values at other wave-lengths have been calculated assuming the same spectral de-pendence ofC∗
Arnott (λ) given by Arnott et al. (2005) and nor-malized toC∗
Arnott(660). As can be seen from Table 1, the ob-tainedC∗(λ) are much higher than those estimated by Arnottet al. (2005) or by Weingartner et al. (2003) in the laboratory.
Once we had retrieved theC∗(λ) values, the iterativemethod explained in Sect. 3.2.3 was applied for each mea-surement to calculate theC(λ), which will be used to com-pensatebATN(λ). Almost 93 % of the data converges at thefourth iteration, while the remaining 7 % does at the fifthiteration. The averaged values forC(λ) are shown in Ta-ble 1. It is evident thatC increases withλ, from 3.42 inthe UV (370 nm) channel to 4.59 in the infrared (950 nm).Comparing these values with our referenceC637, calculatedusing Eq. (9), a higher wavelength dependence is observedat lower wavelengths (∼ 23 % forC at 370 nm) than at near-infrared wavelengths (∼ 4 % for C at 950 nm). Weingartneret al. (2003) assumed that there was no wavelength depen-dence onC since the difference in their measurements be-tween 450 and 660 nm was smaller than 10 %. This is con-sistent with our data since the difference inC between 470and 660 nm is≈ 8 %, and the only wavelength differing moreis 370 nm (see Table 1). Furthermore, the differences in ourcalculatedC values at each wavelength are similar to theones reported in Schmid et al. (2006) forαabs≈ 1. In addi-tion, the averageαabsobtained with the iterative method wasfound to be 1.09 with a standard deviation of around 0.25.We performed a sensitivity analysis on the effect of the com-pensation on theC values: a 15 % change of the parameterf causes a change in theC values smaller than 1 % for allwavelengths.
The obtainedbabs are, on average, around 72 and 79 %lower than the correspondingbATN values measured at 370and 950 nm, respectively. Rizzo et al. (2011) reported a de-crease of 75 % at 450 nm, which is similar to the findings in
Atmos. Meas. Tech., 7, 2373–2387, 2014 www.atmos-meas-tech.net/7/2373/2014/

S. Segura et al.: In situ spectral aerosol optical properties 2381
Figure 4. Whisker boxplot of(a) the Aethalometer (black) andMAAP (red) compensated absorption coefficients (babs) and (b)single-scattering albedo (ω0) for the seven aethalometer channels.The square inside the boxes represents the average; the centralline corresponds to the median; the edges of the box are the 25thand 75th percentiles; the whiskers correspond to 5th and 95th per-centiles; and horizontal lines outside the boxes correspond to max-ima and minima.
this study. Figure 4 shows a boxplot of the compensated ab-sorption coefficientsbabs at each wavelength obtained fromthe Aethalometer and the MAAP. On one hand, it can beseen that the MAAP absorption coefficient is in reasonableagreement with the boxes from the compensated Aethalome-ter data at 590 and 660 nm. This is expected when the data areproperly compensated, since the spectral behaviour of the ab-sorption coefficient follows a power law as shown in Eq. (10).
Rizzo et al. (2011) performed sensitivity tests and showedthat the main source of error due tobabsandαabs is driven bythe choice ofαscat. Since they used averaged values over the
whole measurement period, their sensitivity tests consisted invarying these values and seeing how this affected the final re-sult forbabsandαabs. They obtained a maximum deviation inthe results of±10 and±40 % onbabsandαabs, respectively.Following their tests, in our measurements, only±1 % forbabs and±2 % for αabs deviations are observed. This is dueto the fact that we have used concurrent absorption and scat-tering measurements at multiple wavelengths and have thusreduced deviations inbabsandαabssignificantly.
5 Spectral absorption coefficient, spectralsingle-scattering albedo, and Ångströmexponent of absorption
5.1 Temporal evolution of aerosol spectral properties
The statistics forω0 obtained for the seven Aethalometerchannels were calculated (Fig. 4b). Averagedω0 values from370 to 950 nm lie between 0.78 and 0.74, with a standarddeviation of 0.08–0.09. Lyamani et al. (2010) reported an av-erage value ofω0 at 670 nm of 0.73± 0.06 in summer, whichis close to the value obtained in this work,ω0 at 660 nm of0.76± 0.08. In general, theω0(λ) average values show thatduring the measurement period the atmosphere in Granada atsurface level contained a large fraction of absorbing particles.
Figure 5 shows the temporal evolution of hourly and dailyaveraged data for the different optical aerosol parameterscalculated in the previous section during the period from29 June to 29 July. Figure 5a and b display the hourlyand daily average values ofω0(λ) obtained for the 370 and950 nm channels of the Aethalometer. In Fig. 5a it can beobserved that theω0 minima of 0.5–0.6 correspond to max-imum peaks ofbabs (Fig. 5d). These maxima inbabs are aconsequence of traffic emissions; this suggests that lower val-ues ofω0 are caused by traffic emissions which increase theabsorbing component at surface level (Lyamani et al., 2010,2011). During the whole periodω0 at 950 nm is higher thanω0 at 370 nm, except for ordinal days 181 (29 June) and 202–203 (20 and 21 July). A more detailed analysis of these dayswill be discussed below.
In the case of theαabs (Fig. 5c), except for the men-tioned special episodes, values of this parameter show point-to-point variations no greater than 0.1. Hourly average val-ues ofαabs are mostly between 0.9 and 1.2. The spectraldependence ofbabs does not vary a lot, nor does the dailyaverage ofαabs, which exhibits values around 1.1 for mostof the month. Values ofαabs around 1 are related to thepresence of traffic aerosols (Sun et al., 2007) and are typ-ical of urban areas (Bergstrom et al., 2007). This corrobo-rates the fact that the site in Granada is dominated by ur-ban aerosols whose major source is traffic (Lyamani et al.,2008, 2010; Titos et al., 2012). Maxima are greater than 1.55(P95) and reach values up to 2.5. These high values are re-lated to special aerosol episodes (dust and biomass burning
www.atmos-meas-tech.net/7/2373/2014/ Atmos. Meas. Tech., 7, 2373–2387, 2014

2382 S. Segura et al.: In situ spectral aerosol optical properties
Figure 5. Temporal evolution of:(a) ω0,370 andω0,950 hourly av-eraged,(b) ω0,370andω0,950daily averaged,(c) αabshourly (blackline) and daily averaged (blue dots), and(d) babs,370 andbabs,950hourly averaged and daily averaged values forbabs,370 (blue dots)with their standard deviations. Black lines correspond to hourly av-erages at 370 nm and red lines to hourly averages at 950 nm, exceptfor αabsand panel(b), where they correspond to daily averages. Allthese data correspond to the period June–July 2012.
particles) affecting Granada during the measurement period,which will be described in more detail below.
Figure 5d shows the hourly average values of thebabs at370 and 950 nm. Both channels exhibit very similar tempo-ral behaviour, although absorption coefficients in the UV areconsiderably higher than those in the near infrared. The sameevolution is seen forbabsat the other five channels, with val-ues located between these two channels (not shown). Aver-aged values obtained for the compensatedbabsrange between16 (at 370 nm) and 5 Mm−1 (at 950 nm) with standard devi-ations of 10 and 3 Mm−1, respectively (Fig. 4a).
For the two events already mentioned – ordinal days 181(29 June) and 202–203 (20 and 21 July) – an extendedanalysis of surface level characteristics was made usingback trajectories and results from the Navy Aerosol Anal-ysis and Prediction System (NAAPS,http://www.nrlmry.navy.mil/aerosol/). The model used for calculating backtrajectories is the Hybrid Single-Particle Lagrangian Inte-grated Trajectory Model (HYSPLIT) developed by the Na-tional Oceanic and Atmosphere Administration (Draxler andRolph, 2003). On the other hand, the NAAPS model is aglobal model that predicts concentrations of sulfates, dustand smoke aerosols at ground level and in the atmosphericcolumn (Christensen, 1997). Measurements of a Raman li-dar operated at Granada station (Guerrero-Rascado et al.,
Figure 6. Five-day back trajectories from HYSPLIT at three differ-ent heights (500 (red), 1500 (blue), and 3000 m (green) a.g.l.) for(a) 29 June and(b) 20 July.
2008) and included in EARLINET (European Aerosol Re-search Lidar Network; Boesenberg et al., 2001) were used tosupport the interpretation of the data. Images of the tempo-ral evolution of the lidar range-corrected signal (RCS) can beconsulted online athttp://atmosfera.ugr.es/inv/index.php/en/quicklooks.html.
Figure 6 shows the five-day back trajectories arriving atGranada on 29 June and 20 July 2012. Figure 7 shows theconcentration of different types of particles (dust, biomasssmoke) at ground level predicted by the NAAPS model for29 June and 20 July at 12:00 and 18:00 UTC. On 29 June,the trajectories arriving at 1500 and 3000 m a.g.l. came fromthe western Sahara, while the trajectory at 500 m a.g.l. camefrom the Mediterranean Sea between Spain and northernAfrica (Fig. 6a). In addition, from Fig. 7a it can be seen thaton 29 June NAAPS predicted a significant surface concen-tration of dust particles (80–160 µg m−3) at Granada. Fur-thermore, no significant contributions from biomass burningand sulfate aerosols were obtained from the NAAPS model.Figure 8a shows the temporal evolution of the lidar RCS at532 nm on 29 July. Early in the morning the presence of anaerosol layer decoupled from the planetary boundary layeris evident. The analysis of the backward trajectories suggeststhat the decoupled layer extending from 2000 to 3000 m a.s.l.originated in northern Africa. This is clear evidence of theSaharan dust outbreak over our station.
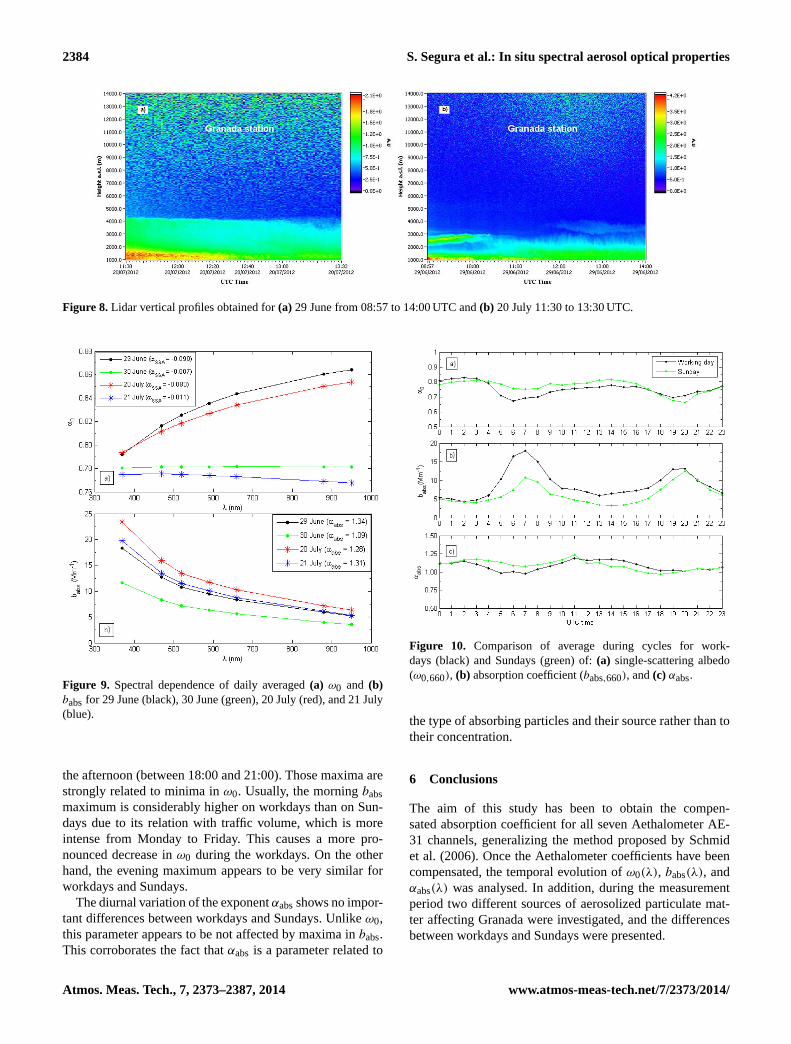
To study whether there is any noticeable effect in the opti-cal properties at ground level or not, the 24 h average valuesof bothω0(λ) andbabs(λ) obtained on 29–30 June and 20–21 July are shown in Fig. 9a and b, respectively. Figure 9ashows a strong spectral dependence ofω0(λ) on 29 June withconsiderably lower values (∼ 0.80) for the UV channel thanin the IR, which is a well-known characteristic of dust. On30 June, the spectral dependence ofω0(λ) is not strong, andcan be related to the fact that the dust intrusion is over and ur-ban aerosols are dominant again. Collaud-Coen et al. (2004)proposed a method for detecting Saharan dust events basedon the change of the Ångström exponent of single-scattering
Atmos. Meas. Tech., 7, 2373–2387, 2014 www.atmos-meas-tech.net/7/2373/2014/

S. Segura et al.: In situ spectral aerosol optical properties 2383
Figure 7.Total surface dust and biomass burning concentration pre-dicted by the NAAPS model for 29 June at(a) 12:00 UTC and(b)18:00 UTC,(c, d)20 July 12:00 UTC, and(e, f)20 July 18:00 UTC.Biomass burning concentration is only shown for 20 July since on29 June there were no concentrations of this type over Granada.
albedo (αSSA). Negative exponent values of theαSSA are dueto the large size of mineral aerosols. In our case, on 29 Junea αSSA= −0.09 is obtained, which is related to the presenceof dust in the atmosphere. On 30 June this wavelength de-pendence decreased toαSSA= −0.007, indicating that themineral dust intrusion was over. In the case of thebabs(λ)
a stronger spectral dependence for the values obtained on29 than for 30 June is found (Fig. 9b). This spectral depen-dence leads to the values ofαabsof 1.34 and 1.09 on 29 and30 June, respectively. The return of the exponent to a valueclose to 1 is consistent with diesel aerosols becoming pre-dominant again. Figure 5c shows that theαabs reached val-ues up to nearly 2.0 during the dust intrusion on 29 June. Tostudy the consistency of theαabsvalues obtained during thisdust event, they were compared with those obtained in otherstudies. Collaud-Coen et al. (2004) reportedαabs values be-tween 1.5 and 1.8 during Saharan dust events at Jungfrau-joch, as well as a non-negligible spectral dependence ofω0.Values ofαabsof 2.2 were reported by Bergstrom et al. (2002)for mixed urban pollution and desert dust aerosols in ACE-Asia (Aerosol Characterization Experiment). Therefore, it
can be concluded that our determination of the Saharan dustepisodes and the associated values of the Ångström expo-nent of single-scattering albedo are in good agreement withthe published values.
Another event was detected on 20 (day 202) and 21 (day203) July. HYSPLIT back trajectories arriving on 21 July at500 and 1500 m a.g.l. reached Granada proceeding from theMediterranean Sea, along northern Africa’s coast, althoughthey have their origin in western France. At 3000 m a.g.l. theyoriginate from the Atlantic Ocean (Fig. 6b). NAAPS predic-tions, presented in Fig. 7b and c, show influence of both dustand smoke aerosols at surface level on 20 July. The temporalevolution of RCS at 532 nm obtained from lidar measure-ments (Fig. 8b) shows the presence of aerosol particles upto 4000 m a.s.l., and especially high concentrations are mea-sured up to 2000 m a.s.l. Based on the NAAPS model andlidar measurements, aerosols measured at surface level areconsidered to be affected by wood smoke and mineral dust.
Values on 20 July were daily averaged starting at12:00 UTC, when the event is first detected. The analysisof the wavelength dependence ofω0 leads toαSSA= −0.08on 20 July, showing again presence of dust, and toαSSA= −0.011 on 21 July, when the episode is over. InFig. 9a a stronger spectral dependence ofω0 during the eventis observed. Similar to the event on 29 July, variations in thespectral dependence indicate a change in the dominant sourceand origin of the aerosols which is corroborated with NAAPSpredictions of dust and smoke aerosols at surface level. Fig-ure 9b shows that the spectral dependence ofbabs does notshow significant differences from one day to another; the val-ues ofαabsare 1.28 and 1.31 for 20 and 21 July, respectively.
Although there are similarities in the spectral dependen-cies of the optical parameters, the two events differ: on29 June the event is dominated by dust with largerω0 andlower babs; on 20 and 21 July the aerosol is a mixture ofsmoke and dust, with lowerω0 and higherbabs.
5.2 Comparison between workdays and Sundays
In Fig. 5d, based on the daily averages (blue dots), it wasalready observed thatbabswas generally higher during work-days than on Sundays. Due to these differences, the hourlyaverage values in UTC ofω0 at 370 and 950 nm,babs at370 and 950 nm, andαabshave been calculated for workdays(Monday to Friday) and Sundays (Fig. 10).
In Fig. 10a it can be seen that during daytimeω0 is ingeneral slightly higher on Sundays than workdays. At night-time, ω0 values are very similar, the difference being only0.05. The fact that a less absorptive atmosphere is found onweekends than on workdays results directly from thebabsbe-haviour. During the daytime,babs for workdays is consid-erably higher than during Sundays (Fig. 10b), which alsocauses lowerω0 from Monday to Friday. It is also seenthat on workdays and Sundaysbabs has two maxima, onein the morning (between 04:00 and 09:00) and another in
www.atmos-meas-tech.net/7/2373/2014/ Atmos. Meas. Tech., 7, 2373–2387, 2014
2384 S. Segura et al.: In situ spectral aerosol optical properties
Figure 8. Lidar vertical profiles obtained for(a) 29 June from 08:57 to 14:00 UTC and(b) 20 July 11:30 to 13:30 UTC.
Figure 9. Spectral dependence of daily averaged(a) ω0 and (b)babsfor 29 June (black), 30 June (green), 20 July (red), and 21 July(blue).
the afternoon (between 18:00 and 21:00). Those maxima arestrongly related to minima inω0. Usually, the morningbabsmaximum is considerably higher on workdays than on Sun-days due to its relation with traffic volume, which is moreintense from Monday to Friday. This causes a more pro-nounced decrease inω0 during the workdays. On the otherhand, the evening maximum appears to be very similar forworkdays and Sundays.
The diurnal variation of the exponentαabsshows no impor-tant differences between workdays and Sundays. Unlikeω0,this parameter appears to be not affected by maxima inbabs.This corroborates the fact thatαabs is a parameter related to
Figure 10. Comparison of average during cycles for work-days (black) and Sundays (green) of:(a) single-scattering albedo(ω0,660), (b) absorption coefficient (babs,660), and(c) αabs.
the type of absorbing particles and their source rather than totheir concentration.
6 Conclusions
The aim of this study has been to obtain the compen-sated absorption coefficient for all seven Aethalometer AE-31 channels, generalizing the method proposed by Schmidet al. (2006). Once the Aethalometer coefficients have beencompensated, the temporal evolution ofω0(λ), babs(λ), andαabs(λ) was analysed. In addition, during the measurementperiod two different sources of aerosolized particulate mat-ter affecting Granada were investigated, and the differencesbetween workdays and Sundays were presented.
Atmos. Meas. Tech., 7, 2373–2387, 2014 www.atmos-meas-tech.net/7/2373/2014/

S. Segura et al.: In situ spectral aerosol optical properties 2385
The attenuation coefficient at 637 nm was compensatedapplying the method proposed by Weingartner et al. (2003)and then compared tobabs obtained from MAAP measure-ments. Furthermore, site-specific parameters for the load-ing (R (f,ATN)) and multiple scattering (C) were obtained.The values for the loading parameter (f ) range from 1.15 at370 nm to 1.11 at 950 nm, which is consistent with previousvalues reported by Weingartner et al. (2003), Sandradewi etal. (2008b), and Collaud-Coen et al. (2010), among others.Compensated data from both instruments were checked forany remaining loading effects, and none were found.
For the multiple-scattering effect, theC value at 637 nmwas found to be 4.22± 0.06, and it is in agreement with val-ues published in the literature for sites with similar character-istics. Results of the comparison with the MAAP give a slopeof 1.005 and a correlation coefficient of 0.926. Therefore, thecompensated factors obtained in this study provide a satisfac-tory compensation of the data and are used to calculate theC
factor at other wavelengths.To obtain the wavelength dependence ofC(λ), the addi-
tional parametersms and C∗ are needed, which were ob-tained by Arnott et al. (2005) in laboratory experiments.These values proved to be quite low when applied to ambientmeasurements, so newC∗( λ) values were calculated in thisstudy. TheC∗ value for ambient data calculated at 637 nmfor this campaign exhibits a value of 3.93, while thems usedis the value provided by Arnott et al. (2005). Differences inC∗ agree with those expected from Arnott et al. (2005) forambient measurements. The same spectral dependence as inArnott et al. (2005) has been used to obtainC∗ at other wave-lengths.
Applying the iterative procedure proposed by Schmid etal. (2006),C(λ), ω0(λ), andαabsusing wavelengths from 370to 950 nm were calculated.C values obtained span from 3.42at 370 nm to 4.59 at 950 nm, and their spectral differences arein agreement with the ones observed in Schmid et al. (2006)for the Amazon Basin.
Once the different parameters had been compensated andcalculated at each wavelength, a study of their temporal evo-lution was performed. Averaged values ofω0 range between0.784 (at 370 nm) and 0.737 (at 950 nm), indicating that dur-ing July 2012 Granada’s atmosphere was significantly bur-dened with absorbing particles. This is in agreement with re-sults obtained by Lyamani et al. (2010) for the summer pe-riod. An average value of 1 forαabs is explained by the factthat the Granada site is dominated by urban aerosols (Sun etal., 2007) whose major source is traffic.
Finally, the difference between workdays and Sundaysshows that the absorption coefficients are higher duringworkdays than during Sundays as a consequence of the traf-fic intensity on the highway close to the station. These valuescause decreases inω0, leading to an atmosphere with moreabsorbing particles during the workdays. However,αabs isnot affected and exhibits no differences between work days
and Sundays as this value is more related to the aerosol typeand their source, which does not strongly change at this site.
Acknowledgements.The authors gratefully acknowledge theNOAA Air Resources Laboratory (ARL) for the provision ofthe HYSPLIT transport and dispersion model and/or READYwebsite used in this publication. Also, we acknowledge the NavalResearch Laboratory for providing the NAAPS data on theirwebsite. This work was financed jointly by the Spanish Ministry ofEconomy and Competitiveness and the European Regional Devel-opment Fund through projects CGL2011-24290, CGL2010-18782,CSD2007-00067, and CGL2012-33294; by the Valencia Au-tonomous Government through project PROMETEO/2010/064; theAndalusia Regional Government through projects P08-RNM-3568and P10-RNM-6299; and by the Slovenian Ministry of EconomicDevelopment and Technology JR-KROP grant 3211-11-000519.The research leading to these results has received funding from theEuropean Union Seventh Framework Programme (FP7/2007-2013)under grant agreement no. 262254 (ACTRIS). The collaborationof S. Segura in this work was possible thanks to fellowshipBES-2010-031626.
Edited by: M. Rapp
References
Anderson, T. L. and Ogren, J. A.: Determining aerosol radiativeproperties using the TSI 3563 integrating nephelometer, AerosolSci. Tech., 29, 57–69, 1998.
Anderson, T. L., Covert, D. S., Marshall, S. F., Laucks, M. L., Charl-son, R. J., Waggoner, A. P., Ogren, J. A., Caldow, R., Holm, R. L.,and Quant, F. R., Sem, G. J., Wiedensohler, A., Ahlquist, N. A.,and Bates, T. S.: Performance Characteristics of a High Sensitiv-ity, Three-Wavelength, Total Scatter/Backscatter Nephelometer,J. Atmos. Ocean. Tech., 13, 967–986, 1996.
Ångström, A.: On the Atmospheric Transmission of Sun Radiationand on Dust in the Air, Geogr. Ann., 11, 156–166, 1929.
Arnott, W. P., Hamasha, K., Moosmuller, H., Sheridan, P. J., andOgren, J. A.: Towards aerosol light-absorption measurementswith a 7-wavelength aethalometer: Evaluation with a photoa-coustic instrument and 3-wavelength nephelometer, Aerosol Sci.Technol., 39, 17–29, 2005.
Ballach, J., Hitzenberger, R., Schultz, E., and Jaeschke, W.: Devel-opment of an improved optical transmission technique for blackcarbon (BC) analysis, Atmos. Environ., 35, 2089–2100, 2001.
Baron, P. A. and Willeke, K.: Aerosol Measurement: Principles,Techniques, and Applications, John Willey, Hoboken, N. J.,2005.
Bergstrom, R. W., Russell, P. B., and Hignett: Wavelength depen-dence of the absorption of black carbon particles: Predictionsand results from the TARFOX experiment and implications forthe aerosol single scattering albedo, Atmos. Sci., 59, 567–577,2002.
Bergstrom, R. W., Pilewskie, P., Russell, P. B., Redemann, J., Bond,T. C., Quinn, P. K., and Sierau, B.: Spectral absorption proper-ties of atmospheric aerosols, Atmos. Chem. Phys., 7, 5937–5943,doi:10.5194/acp-7-5937-2007, 2007.
www.atmos-meas-tech.net/7/2373/2014/ Atmos. Meas. Tech., 7, 2373–2387, 2014

2386 S. Segura et al.: In situ spectral aerosol optical properties
Boesenberg, J., Balis, D., Flamant, P., Papalardo, G., Papayanis, A.,Pelon, J., Schneider, J., Trickl, T., Visconti, G.: in: EARLINET:A European Aerosol Research Lidar Network, Advances in Re-mote Sensing, edited by: Dabas, A., Flamant, P., and Pelon, J.,Selected papers from the 20th International Laser Radar Confer-ence, Vichy, France, 10–14 July, 2000, 155–158, 2001.
Bond, T. C. and Bergstrom: Light absorption by carbonaceous par-ticles: an investigative review, Aerosol Sci. Tech., 40, 27–67,doi:10.1080/02786820500421521, 2006.
Bond, T. C., Anderson, T. L., and Campbell, D.: Calibration andintercomparison of filter-based measurements of visible light ab-sorption by aerosols, Aerosol Sci. Technol., 30, 582–600, 1999.
Brito, J., Rizzo, L. V., Herckes, P., Vasconcellos, P. C., Caumo,S. E. S., Fornaro, A., Ynoue, R. Y., Artaxo, P., and Andrade,M. F.: Physical-chemical characterisation of the particulate mat-ter inside two road tunnels in the São Paulo Metropolitan Area,Atmos. Chem. Phys., 13, 12199–12213, doi:10.5194/acp-13-12199-2013, 2013.
Chand, D., Guyon, P., Artaxo, P., Schmid, O., Franck, G. P., Rizzo,L. V., Mayol-Bracero, O. L., Gatti, L. V., and Andreae, M.O.: Optical and physical properties of aerosols in the bound-ary layer and free troposphere over the Amazon Basin duringthe biomass burning season, Atmos. Chem. Phys., 6, 2911–2925,doi:10.5194/acp-6-2911-2006, 2006.
Christensen, J. H.: The Danish Eulerian hemispheric model – athree-dimensional air pollution model used for the artic, Atmos.Environ., 31, 4169–4191, 1997.
Collaud-Coen, M., Weingartner, E., Schaub, D., Hueglin, C., Cor-rigan, C., Henning, S., Schwikowski, M., and Baltensperger, U.:Saharan dust events at the Jungfraujoch: detection by wavelengthdependence of the single scattering albedo and first climatologyanalysis, Atmos. Chem. Phys., 4, 2465–2480, doi:10.5194/acp-4-2465-2004, 2004.
Collaud-Coen, M., Weingartner, E., Apituley, A., Ceburnis, D.,Fierz-Schmidhauser, R., Flentje, H., Henzing, J. S., Jennings, S.G., Moerman, M., Petzold, A., Schmid, O., and Baltensperger,U.: Minimizing light absorption measurement artifacts of theAethalometer: evaluation of five correction algorithms, Atmos.Meas. Tech., 3, 457–474, doi:10.5194/amt-3-457-2010, 2010.
De Castro, B. R., Wang, L., Mihalic, J. N., Breysse, P. N., and Geyh,A. S.: The Longitudinal Dependence of Black Carbon Concen-tration on Traffic Volume in an Urban Environment, Japca J. AirWaste Manage., 58, 928–393, 2008.
Draxler, R. R. and Rolph, G. D.: HYSPLIT (HYbrid Single-ParticleLagrangian Integrated Trajectory), Model access via NOAAARL READY Website, available at:http://www.arl.noaa.gov/ready/hysplit4.html, NOAA Air Resources Laboratory, SilverSpring, MD, 2003.
Dubovik, O., Holben, B., Eck, T. F., Smirnov, A., Kaufman, Y. J.,King, M. D., Tanré, D., and Slutsker, I.: Variability of absorptionand optical properties of key aerosol types observed in world-wide locations, Atmos. Sci., 59, 590–608, 2002.
Esteve, A. R., Estellés, V., Utrillas, M. P., and Martínez-Lozano, J.A.: In-situ integrating nephelometer measurements of the scat-tering properties of atmospheric aerosols at an urban coastal sitein western Mediterranean, Atmos. Environ., 47, 43–50, 2012.
Fialho, P., Hansen, A. D. A., and Honrath, R. E.: A new approachto decouple dust and black carbon absorption coefficients usingseven-wavelength Aethalometer data, J. Aerosol Sci., 36, 267–282, 2005.
Guerrero-Rascado, J. L., Ruiz, B., and Alados-Arboledas, L.: Multi-spectral lidar characterization of the vertical structure of Saharandust aerosol over southern Spain, Atmos. Environ., 42, 2668–2681, 2008.
Gundel, L. A., Dod, R. L., Rosen, H., and Novakov, T.: The relation-ship between optical attenuation and black carbon concentrationfor ambient and source particles, Sci. Total Environ., 36, 197–202, 1984.
Hansen, A. D. A.: The Aethalometer TM. Magee Scientific Com-pany, Berkeley, California, USA, available at:http://mageesci.com/images/stories/docs/Aethalometer_book_2005.07.03.pdf(last access: August 2014), 2005.
Hansen, A. D. A., Rosen, H., and Novakov, T.: Real-time mea-surement of the absorption coefficient of aerosol particles, Appl.Opt., 21, 3060–3062, 1982.
Hansen, A. D. A., Rosen, H., and Novakov, T.: The aethalometer; aninstrument for the real-time measurements of optical absorptionby aerosol particles, Sci. Total Environ., 36, 191–196, 1984.
Heintzenberg, J., Wiedensohler, A., Tuch, T. M., Covert, D. S.,Sheridan, P. J., Ogren, J. A., Gras, J., Nessler, R., Kleefeld, C.,Kalivitis, N., Aaltonen, V., Wilhelm, R.-T., and Havlicek, M.: In-tercomparisons and aerosol calibrations of 12 commercial inte-grating nephelometers of three manufacturers, J. Atmos. Ocean.Tech., 23, 902–914, 2006.
Horvath, H: Atmospheric light absorption: a review, Atmos. Envi-ron., 27, 293–317, 1993.
Houghton, J. T., Ding, Y., Griggs, D. J., Noguer, M., van der Linden,P. J., and Xiaosu, D.: Climate Change 2001: The Scientific Basis,Cambridge Univ. Press, New York, 2001.
Hyvärinen, A. P., Vakkari, V., Laakso, L., Hooda, R. K., Sharma,V. P., Panwar, T. S., Beukes, J. P., van Zyl, P. G., Josipovic, M.,Garland, R. M., Andreae, M. O., Pöschl, U., and Petzold, A.:Correction for a measurement artifact of the Multi-Angle Ab-sorption Photometer (MAAP) at high black carbon mass concen-tration levels, Atmos. Meas. Tech., 6, 81–90, doi:10.5194/amt-6-81-2013, 2013.
IPCC: in: Climate Change 2013, edited by: Stocker, T. F., Qin, D.,Plattner, G.-K., Tignor, M., Allen, S. K., Boschung, J., Nauels,A., Xia, Y., Bex, V., and Midgley, P. M., The Physical ScienceBasis. Working Group I Contribution to the IPCC 5th Assess-ment Report – Changes to the underlying Scientific/TechnicalAssessment. Cambridge University Press, Cambridge, UK &New York, USA, 2013.
Jacobson, M. Z.: Studying the effects of aerosol son vertical pho-tolysis rate coefficient and temperature profiles over an urban airshed, J. Geophys. Res., 103, 10593–10604, 1998.
Kanaya, Y., Komazaki, Y., Pochanart, P., Liu, Y., Akimoto, H.,Gao, J., Wang, T., and Wang, Z.: Mass concentrations of blackcarbon measured by four instruments in the middle of CentralEast China in June 2006, Atmos. Chem. Phys., 8, 7637–7649,doi:10.5194/acp-8-7637-2008, 2008.
Kirchstetter, T. W., Novakov, T., and Hobbs, P. V.: Evidencethat the spectral dependence of light absorption by aerosols isaffected by organic carbon, J. Geophys. Res., 109, D21208,doi:10.1029/2004JD004999, 2004.
Atmos. Meas. Tech., 7, 2373–2387, 2014 www.atmos-meas-tech.net/7/2373/2014/

S. Segura et al.: In situ spectral aerosol optical properties 2387
Lack, D. A., Cappa, C. D., Cross, E. S., Massoli, P., Ahern, A. T.,Davidovits, P., and Onasch, T. B.: Absorption enhancement ofcoated absorbing aerosols: validation of the photo-acoustic tech-nique for measuring the enhancement, Aerosol Sci. Technol., 43,1006–1012, doi:10.1080/02786820903117932, 2009.
Lyamani, H., Olmo, F. J., and Alados-Arboledas, L.: Light scatter-ing and absorption properties of aerosol particles in the urban en-vironment of Granada, Spain, Atmos. Environ., 42, 2630–2642,doi:10.1016/j.atmosenv.2007.10.070, 2008.
Lyamani, H., Olmo, F. J., and Alados-Arboledas, L.: Physical andoptical properties of aerosols over an urban location in Spain:Seasonal and diurnal variability, Atmos. Chem. Phys., 10, 239–254, doi:10.5194/acp-10-239-2010, 2010.
Lyamani, H., Olmo, F. J., Foyo I., and Alados-Arboledas, L.:Black carbon aerosols over an urban area in south-eastern Spain:Changes detected after the 2008 economic crisis, Atmos. Envi-ron., 45, 6423–6432, 2011.
Moosmüller, H., Chakrabarty, R. K., and Arnott, W. P.: Aerosol lightabsorption and its measurement: A review, J. Quant. Spectrosc.Ra., 110, 844–878, doi:10.1016/j.jqsrt.2009.02.035, 2009.
Müller, T., Henzing, J. S., de Leeuw, G., Wiedensohler, A.,Alastuey, A., Angelov, H., Bizjak, M., Collaud-Coen, M., En-gstrom, J. E., Gruening, C., Hillamo, R., Hoffer, A., Imre, K.,Ivanow, P., Jennings, G., Sun, J. Y., Kalivitis, N., Karlsson, H.,Komppula, M., Laj, P., Li, S.-M., Lunder, C., Marinoni, A., Mar-tins dos Santos, S., Moerman, M., Nowak, A., Ogren, J. A., Pet-zold, A., Pichon, J. M., Rodriquez, S., Sharma, S., Sheridan,P. J., Teinila, K., Tuch, T., Viana, M., Virkkula, A., Weingart-ner, E., Wilhelm, R., and Wang, Y. Q.: Characterization and in-tercomparison of aerosol absorption photometers: result of twointercomparison workshops, Atmos. Meas. Tech., 4, 245–268,doi:10.5194/amt-4-245-2011, 2011.
Mukai, H. and Ambe, Y.: characterization of a humic acid-likeBrown substance in airborne particulate matter and tentativeidentification of its origin, Atmos. Environ., 20, 813–819, 1986.
Nakayama, T., Kondo, Y., Moteki, N., Sahu, L. K., Kinase, T.,Kita, K., and Matsumi, Y.: Size-dependent correction factors forabsorption measurements using filter-based photometers: PSAPand COSMOS, J. Aerosol Sci., 41, 333–343, 2010.
Park, S. S., Hansen, A. D. A., and Cho, Y.: Measurement of real timeblack carbon for investigating spot loading effects of Aethalome-ter data, Atmos. Environ., 11, 1449–1455, 2010.
Petzold, A. and Schönlinner, M.: Multi-angle absorption photome-try – a new method for the measurement of aerosol light absorp-tion and atmospheric black carbon, J. Aerosol Sci., 35, 421–441,2004.
Petzold, A., Kopp, C., and Niessner, R.: The dependence of thespecific attenuation cross section on black carbon mass fractionand particle size, Atmos. Environ., 31, 661–672, 1997.
Petzold, A., Schloesser, H., Sheridan, P. J., Arnott, W., Ogren, J. A.,and Virkkula, A.: Evaluation of multiangle absorption photome-try for measuring aerosol light absorption, Aerosol Sci. Technol.,39, 40–51, 2005.
Ramanathan, V., Crutzen, P. J., Kiehl, J. T., and Rosenfeld, D.:Aerosols, Climate, and hydrological cycle, Science, 7, 2119–2124, 2001.
Rizzo, L. V., Correia, A. L., Artaxo, P., Procópio, A. S., and An-dreae, M. O.: Spectral dependence of aerosol light absorptionover the Amazon Basin, Atmos. Chem. Phys., 11, 8899–8912,doi:10.5194/acp-11-8899-2011, 2011.
Sandradewi, J., Prevot, A. S. H., Szidat, S., Perron, N., Lanz, V.A., Weingartner, E., and Baltensperger, U.: Using aerosol lightabsorption measurements for the quantitative determination ofwood burning and traffic emission contributions to particulatematter, Environ. Sci. Technol., 42, 3316–3323, 2008a.
Sandradewi, J., Prevot, A. S. H., Weingartner, E., Schmidhauser,R., Gysel, M., and Baltensperger, U.: A study of wood burningand traffic aerosols in an Alpine valley using a multi-wavelengthaethalometer, Atmos. Environ., 42, 101–112, 2008b.
Schmid, O., Artaxo, P., Arnott, W. P., Chand, D., Gatti, L. V., Frank,G. P., Hoffer, A., Schnaiter, M., and Andreae, M. O.: Spectrallight absorption by ambient aerosols influenced by biomass burn-ing in the Amazon Basin. I: Comparison and field calibrationof absorption measurement techniques, Atmos. Chem. Phys., 6,3443–3462, doi:10.5194/acp-6-3443-2006, 2006.
Sheridan, P. J., Arnott, W. P., Ogren, J. A., Andrews, E., Atkinson,D. B., Covert, D. S., Moosmuller, H., Petzold, A., Schmid, B.,Strawa, A. W., Varma, R., and Virkkula, A.: The Reno AerosolOptics Study: An Evaluation of Aerosol Absorption Measure-ment Methods, Aerosol Sci. Technol., 39, 1–16, 2005.
Sun, H., Biedermann, L., and Bond, T. C.: Color of Browncarbon: A model for ultraviolet and visible light absorptionby organic carbon aerosol, Geophys. Res. Lett., 34, L17813,doi:10.1029/2007GL029797, 2007.
Titos, G., Foyo-Moreno, I., Lyamani, H., Querol, X., Alastuey, A.,and Alados-Arboledas, L.: Optical properties and chemical com-position of aerosol particles at an urban location: An estimationof the aerosol mass scattering and absorption efficiencies, J. Geo-phys. Res., 117, D04206, doi:10.1029/2011JD016671, 2012.
Virkkula, A., Makel, T., Yli-Tuomi, T., Hirsikko, A., Koponen, I. K.,Hameri, K., and Hillamo, R.: A simple procedure for correctingloading effects of aethalometer data, Japca J. Air Waste Manage.,57, 1214–1222, doi:10.3155/1047-3289.57.10.1214, 2007.
Weingartner, E., Saathoff, H., Schnaiter, M., Streit, N., Bitnar, B.,and Baltensperger, U.: Absorption of light by soot particles: De-termination of the absorption coefficient by means of aethalome-ters, J. Aerosol Sci., 34, 1445–1463, 2003.
www.atmos-meas-tech.net/7/2373/2014/ Atmos. Meas. Tech., 7, 2373–2387, 2014