Embed Size (px)
Citation preview
DETERMINANTS OF INFANT MORTALITY IN MALAWI
DETERMINANTS OF INFANT MORTALITY IN MALAWI: A SPATIAL PERSPECTIVE
Ezekiel Kalipeni Department of Geography
Colgate University Hamilton. NY 13346
ABSTRACf This paper examines the spatial variation of infant mortality in Malawi between 1977 and 1987. Data from the 1977 and 1987 censuses are used in simple correlation and forward stepwise regression analysis to explain and/or predict the variation and change of infant mortality at district (county) level. The results indicate that infant mortality is strongly associated with a number of demographic and socioeconomic variables. Region in which a district finds itself also matters as far as levels of infant mortality are concerned
INTRODUCTION
Malawi, like many other countries in Sub-Saharan Africa, offers an excellent opportunity to study mortality conditions from various angles. TIlls paper examines the determinants of infant mortality in Malawi from a geographic, rather than a purely demographic or household, perspective. The main goal of the paper is to explore the spatial variation and change of infant mortality in the country between the 1977 and 1987 decade and to identify some of the factors behind the variation. The paper addresses two research questions concerning the spatial variation of infant mortality. First, is there a discernible geographic pattern to the variation of infant mortality in the country at district (county) level? Second. what are the main explanatory or predictor factors behind the geographic patterns and dynamics of infant mortality in this period.
BACKGROUND AND METHOD OF ANALYSIS
Most research on children's mortality in developing countries has been undertaken by clinically oriented medical practitioners or public health professionals who are concerned with finding remedies within existing social systems (Kent 1991). Inevitably such studies narrowly attribute the immediate causes of death among young children to malnutrition and disease. The household is usually the unit of analysis in regionally unrepresentative sample surveys designed to identify the underlying socioeconomic factors. The spatial or regional factor is usually neglected in such studies. Yet in studies which do consider region as one of the variables, regional differences in socioeconomic conditions are found to be a powerful explanatory variable in the spatial variation of infant mortality (Bell 1988, Anker & Knowles 1977, Faruqee 1980, Farah & Preston 1982).
In trying to account for the spatial variation and change of infant mortality in Malawi, correlation and multiple regression analyses are used extensively. The Forward Stepwise Regression Procedure in the SAS statistical package (SAS Institute 1990) is employed for two purposes: fIrst to weed out variables that are not significant or are highly correlated with other independent variables; and second to develop stepwise regression models for the remaining significant variables. The initial pool of variables was 18 and after the stepwise elimination procedure only 9 are found fIt for further analysis. The data for this study are primarily from the 1977 and 1987 censuses carried out by the Malawi National Statistical OffIce (NSO 1984, 1986 & 1991).
* This study was supported by a grant from the Colgate University Research Council. The author is grateful to Professors Robert Elgie and Maureen Hays-Mitchell for their constructive comments on an earlier draft of this paper.
119
MIDDLE STATES GEOGRAPHER - VOL. 25, 1992
Dependent and Independent Variables
The selected independent variables fall into five main groupings of determinants of mortality: demographic, education, occupation, health facilities and region. These, including the three dependent variables, are described below.
There are three dependent variables under consideration. These are infant mortality rates in 1977 (1977 IMR), infant mortality rates in 1987 (1987 IMR) and percent change in infant mortality rates between these two years «(1987 IMR-1977 IMR)/1977 IMR)*l00. For each one of these dependent variables, a series of regression models are generated using the 1977 set of independent variables. Infant mortality (IMR) is defmed as the number of deaths among infants under one year of age in a given year per 1,000 live births in that year with district as the geographic unit of aggregation.
Research has shown that demographic variables such as mean age at first marriage and total fertility rates are related to infant mortality. It is assumed that an increase in the age at first marriage lowers the risk of an infant dying at birth or during the first year of life. A woman who marries at an older age is likely to be physically fit to give birth to a healthy infant and also well prepared to take care of her baby. The opposite effect is expected to prevail with fertility rates. High fertility rates are likely to result in high infant mortality rates (Cantrelle et al. 1978; M'manga and Srivastava 1991).
There is overwhelming evidence from literature about the strong relationship between infant mortality and socioeconomic variables such as education and occupation. Two measures of education attainment and availability of educational facilities are used. The first is female literacy rates expressed as a percentage and the second is the number of homecraft centers per 10,000 women. Homecraft centers are educational facilities in Malawi where women go to learn about home planning, nutrition and infant care. It has been reported that mother's education exerts an influence on infant mortality that is independent both of the level of medical technology found in the society and of the family's access to it (Caldwell 1979; Caldwell & MacDonald 1982).
Due to high multicollinearity among the initial eight occupational variables, only one was retained for entry into the regression models. This is the percentage of females with agriculture as the main occupation. The nature of the mother's (or for that maner the father's) occupation affects children's mortality rates primarily through its role in determining the family's economic status (Kent 1991; M'manga & Srivastava 1991). I expect to fmd a strong positive relationship between infant mortality and this variable.
There is one health variable measuring the availability of health care facilities in the form of maternity beds per 10,000 women. As Kent (1991) notes, access to modern health care services. especially prenatal care, by mothers and children is sometimes thought to be particularly important in reducing mortality. However, it has been argued that, due to cultural differences, availability of modem health care services cannot alone assme significant reductions in child mortality (Kalipeni and Kamlongera 1987).
Malawi is divided into three administrative regions or provinces - North. Central and South. Each region contains a number of smaller subdivisions known as districts. There are 24 districts in the country as a whole. The three regions have quite different sociocultural characteristics, especially with respect to lineage and kinship organization. To account for this and since there are three regions, it was necessary to generate two binary (dummy) regional variables. The first dummy variable (01) has the following values: North=l, Central=O, South=O and the second dummy variable (D2) has the following values: North=O, Central=1 and South=O. Together, these two variables should clearly show the relative differences in infant mortality among the three regions, especially that part left \Dlexplained by the chosen demographic and socioeconomic variables.
RESULTS OF CORRELATION AND REGRESSION ANALYSES
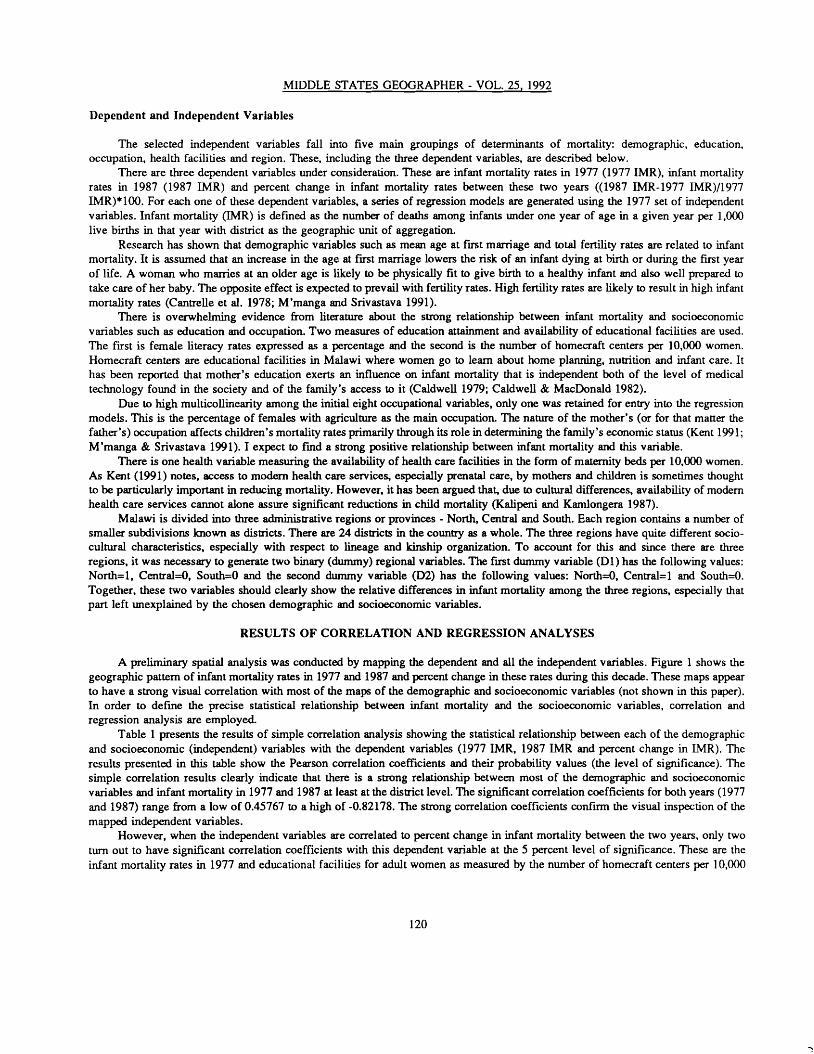
A preliminary spatial analysis was conducted by mapping the dependent and all the independent variables. Figure 1 shows the geographic pattern of infant mortality rates in 1977 and 1987 and percent change in these rates during this decade. These maps appear to have a strong visual correlation with most of the maps of the demographic and socioeconomic variables (not shown in this paper). In order to defme the precise statistical relationship between infant mortality and the socioeconomic variables, correlation and regression analysis are employed.
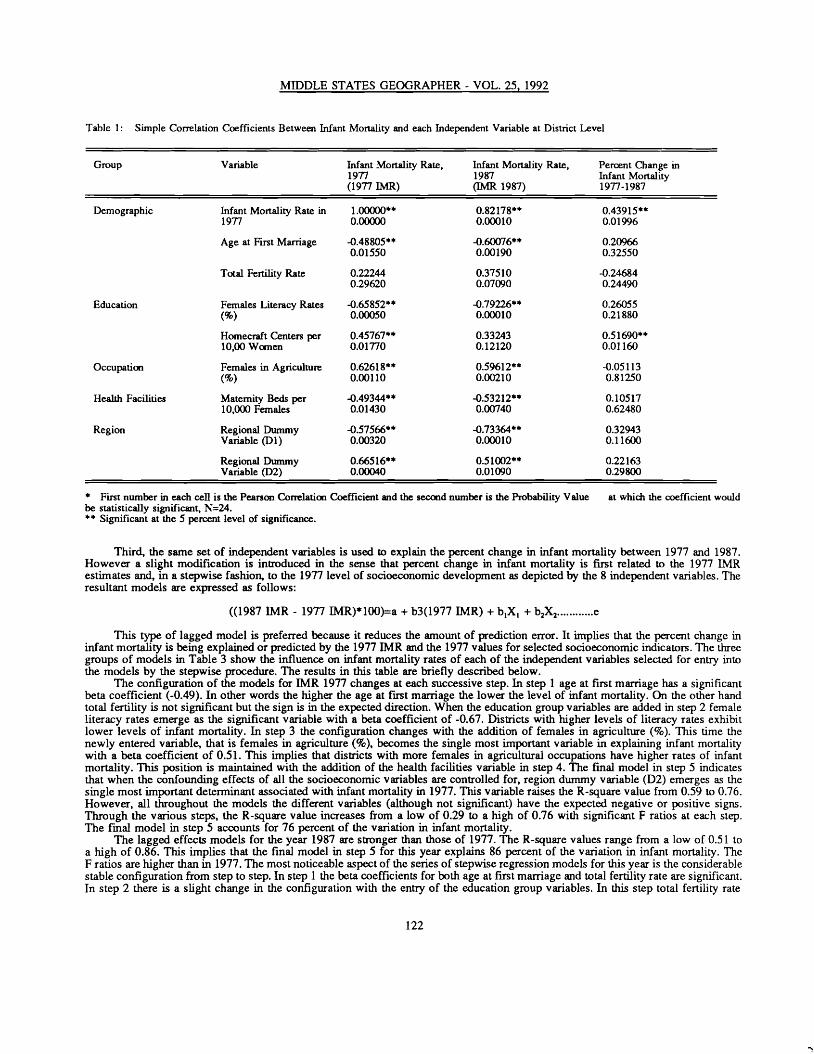
Table 1 presents the results of simple correlation analysis showing the statistical relationship between each of the demographic and socioeconomic (independent) variables with the dependent variables (1977 IMR, 1987 IMR and percent change in IMR). The results presented in this table show the Pearson correlation coefficients and their probability values (the level of significance). The simple correlation results clearly indicate that there is a strong relationship between most of the demographic and socioeconomic variables and infant mortality in 1977 and 1987 at least at the district level. The significant correlation coefficients for both years (1977 and 1987) range from a low of 0.45767 to a high of -0.82178. The strong correlation coefficients confirm the visual inspection of the mapped independent variables.
However, when the independent variables are correlated to percent change in infant mortality between the two years, only two turn out to have significant correlation coefficients with this dependent variable at the 5 percent level of significance. These are the infant mortality rates in 1977 and educational facilities for adult women as measmed by the number of homecraft centers per 10,000
120
DETERMINANfS OF INFANf MORTAUTY IN MALAWI
women (fable 1). It is not clear why the percent change in IMR should have a weak relationship with most of the selected independent variables.
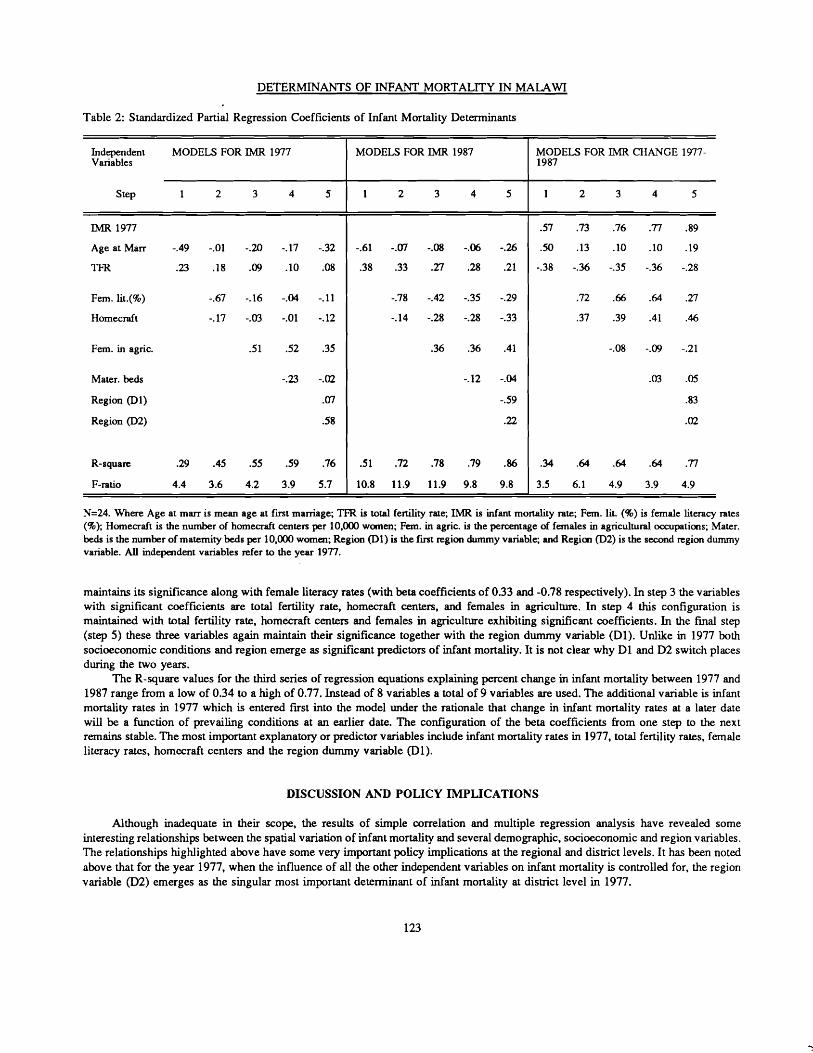
Results of the forward stepwise regression analysis are presented in Table 2. All the selected independent variables are entered in a forward stepwise regression procedure with the aim of building a series of regression models for explanatory and predictive purposes. Variables are added to the regression equation in the following order: (1) infant mortality rate in 1977 (only entered in the case of percent change in infant mortality). age at flTSt marriage, total fertility rate; (2) female literacy rates (%), munber of homecraft centers per 10,000 women; (3) females in agriculture (%); (4) maternity beds per 10.000 women, (5) regional dummy variable (01), regional dummy variable (D2). In this way the partial effects of each group of variables on infant mortality rates can be meaningfully assessed in a controlled manner.
Due to the non-availability of a set of socioeconomic indicators for the 1987 year, the study uses the "lagged" effects approach in explaining the variation of infant mortality rates in 1987 and the percent change during the 1977 and 1987 decade (fsui & Bogue 1978). First. the analysis relates the 1977 socioeconomic conditions to infant mortality in that year to develop a series of stepwise regression models of the following nature:
IMR 1977 = a + b.X1 + bzXz +e
Where "a" is the constant or Y-intercept, 'b" is the slope or regression coefficient associated with X. the independent variable, and e is the error term.
Second, similar models are developed for IMR 1987 by relating IMR 1987 estimates to the 1977 level of socioeconomic development according to the 8 socioeconomic indicators. Tsui and Bogue (1978) point out that this approach explores the "lagged" effects of the explanatory or predictor variables on the dependent variable. The rationale for using this approach is that the impact of development is not instantaneous but rather is lagged over a considerable period of time (fsui and Bogue 1978). The resultant models have the following form: 1987 IMR = a +b.X. + b~2 +..•.........+e
Figure I: Infant Mortality Rates in Malawi. 1977, 1987 and 1977-1987 Percent Chan~e
c) Percenl change in infanl morll1lily rolesa) Infanl morlalily rales in 1977 b) Infanl morlalily rales in 19B7 1977-1907
100 aN
PtRcr"", CHAI"C£ IN INI'.urTIN'''''' OCAniS PER lOCO MORTAUT'l••m-IM?INFANT DEA11IS PER \000 BIRniS. 1817
BIRTilS. 1877 o -O.I>4"".Uo \37.00 I. 1l\Z.00o 106.00 10 144.00 ~ 1.1''''13.14~ 1l\Z.00 I. 1113.00
~ 144.00 I. 11IZ.OO ~ 13.... \0 .!I.'.II 11S:J.OD to 1517.00
IIIIG2.00 I. IG9.00 II .U4 '" Z3.BI• U7.00 to 221.00• IG9.00 I. 177.00
• Z311 10 >11.34• _00 I. 233.01••77.00 I. 191.0.
121
MIDDLE STATES GEOGRAPHER - VOL. 25, 1992
Table 1: Simple Correlation Coefficients Between Infant Mortality and each Independent Variable at District Level
Variable Infant Mortality Rate, 1977 (l977 IMR)
Infant Mortality Rate in 1.00000" 1977 0.00000
Age at First Marriage -0.48805** 0.01550
Total Fertility Rate 0.22244 0.29620
Females Literacy Rates -0.65852*· (%) 0.00050
Homecraft Centers per 0.45767*· 10,00 Women 0.01770
Females in Agriculture 0.62618** (%) 0.00110
Maternity Beds per -0.49344*· 10,000 Females 0.01430
Regional Dummy -0.57566·· Variable (D1) 0.00320
Regional Dummy 0.66516·· Variable (02) 0.00040
Demographic
Education
Occupatioo
Health Facilities
Region
Infant Mortality Rate, 1987 (IMR 1987)
0.82178** 0.00010
-0.60076·* 0.00190
0.37510 0.07090
-0.79226** 0.00010
0.33243 0.12120
0.59612*· 0.00210
-0.53212*· 0.00740
-0.73364·· 0.00010
0.51002·· 0.01090
0.43915·· 0.01996
0.20966 0.32550
-0.24684 0.24490
0.26055 0.21880
0.51690** 0.01160
-0.05113 0.81250
0.10517 0.62480
0.32943 0.11600
0.22163 0.29800
• First number in each cell is the Pearson Correlatioo Coefficient and the second number is the Probability Value at which the coefficient would be statistically significant, N=24. ** Significant at the 5 percent level of significance.
Third, the same set of independent variables is used to explain the percent change in infant mortality between 1977 and 1987. However a slight modification is introduced in the sense that percent change in infant mortality is first related to the 1977 IMR estimates and, in a stepwise fashion, to the 1977 level of socioeconomic development as depicted by the 8 independent variables. The resultant models are expressed as follows:
«(1987 IMR - 1977 IMR)*I00)=a + b3(1977 IMR) + b1X1 + b2X2 e
This type of lagged model is preferred because it reduces the amount of prediction error. It implies that the percent change in infant mortality is being explained or predicted by the 1977 IMR and the 1977 values for selected socioeconomic indicators. The three groups of models in Table 3 show the influence on infant mortality rates of each of the independent variables selected for entry into the models by the stepwise procedure. The results in this table are briefly described below.
The configuration of the models for IMR 1977 changes at each successive step. In step 1 age at first marriage has a significant beta coefficient (-0.49). In other words the higher the age at first marriage the lower the level of infant mortality. On the other hand total fertility is not significant but the sign is in the expected direction. When the education group variables are added in step 2 female literacy rates emerge as the significant variable with a beta coefficient of -0.67. Districts with higher levels of literacy rates exhibit lower levels of infant mortality. In step 3 the configuration changes with the addition of females in agriculture (%). This time the newly entered variable, that is females in agriculture (%), becomes the single most important variable in explaining infant mortality with a beta coefficient of 0.51. This implies that districts with more females in agricultural occupations have higher rates of infant mortality. This position is maintained with the addition of the health facilities variable in step 4. The final model in step 5 indicates that when the confounding effects of all the socioeconomic variables are controlled for, region dummy variable (02) emerges as the single most important determinant associated with infant mortality in 1977. This variable raises the R-square value from 0.59 to 0.76. However, all throughout the models the different variables (although not significant) have the expected negative or positive signs. Through the various steps, the R-square value increases from a low of 0.29 to a high of 0.76 with significant F ratios at each step. The [mal model in step 5 accounts for 76 percent of the variation in infant mortality.
The lagged effects models for the year 1987 are stronger than those of 1977. The R-square values range from a low of 0.51 to a high of 0.86. This implies that the final model in step 5 for this year explains 86 percent of the variation in infant mortality. The F ratios are higher than in 1977. The most noticeable aspect of the series of stepwise regression models for this year is the considerable stable configuration from step to step. In step 1 the beta coefficients for both age at first marriage and total fertility rate are significant. In step 2 there is a slight change in the configuration with the entry of the education group variables. In this step total fertility rate
122
DETERMINANTS OF INFANT MORTALITY IN MALAWI
Table 2: Standardized Partial Regression Coefficients of Infant Mortality Determinants
Independent MODELS FOR IMR 1977 Variables
Step 1 2 3 4 5
IMR 1977
Age at Marr -.49 -.01 -.20 -.17 -.32
TFR .23 .18 .09 .10 .08
Fern. lit.(%) -.67 -.16 -.04 -.11
Hornecraft -.17 -.03 -.01 -.12
Fern. in agric. .51 .52 .35
Mater. beds -.23 -.02
Region (Dl) .en Region (D2) .58
R-square .29 .45 .55 .59 .76
F-ratio 4.4 3.6 4.2 3.9 5.7
MODELS FOR IMR 1987
1 2 3 4 5
-.61 -.en -.08 -.06 -.26
.38 .33 .27 .28 .21
-.78 -.42 -.35 -.29
-.14 -.28 -.28 -.33
.36 .36 .41
-.12 -.04
-.59
.22
.51 .72 .78 .79 .86
10.8 11.9 11.9 9.8 9.8
MODELS FOR IMR CHANGE 19771987
1 2 3 4 5
.57
.50
-.38
.73
.13
-.36
.76
.10
-.35
.77
.10
-.36
.89
.19
-.28
.72
.37
.~
.39
.64
.41
.27
.46
-.08 -.09 -.21
.03 .05
.83
.02
.34
3.5
.64
6.1
.64
4.9
.64
3.9
.77
4.9
N=24. Where Age at rnarr is mean age at first marriage; TfR is total fertility rate; IMR is infant mortality rate; Fem. lit. (%) is female literacy rates (%); Homecraft is the number of homecraft centers per 10,000 women; Fem. in agric. is the percentage of females in agricultural occupations; Mater. beds is the number of maternity beds per 10,000 women; Region (D1) is the fmt region dummy variable; and Region (D2) is the second region dummy variable. All independent variables refer to the year 1977.
maintains its significance along with female literacy rates (with beta coefficients of 0.33 and -0.78 respectively). In step 3 the variables with significant coefficients are total fertility rate, homecraft centers, and females in agriculture. In step 4 this configuration is maintained with total fertility rate, homecraft centers and females in agriculture exhibiting significant coefficients. In the final step (step 5) these three variables again maintain their significance together with the region dummy variable (Dl). Unlike in 1977 both socioeconomic conditions and region emerge as significant predictors of infant mortality. It is not clear why Dl and D2 switch places during the two years.
The R-square values for the third series of regression equations explaining percent change in infant mortality between 1977 and 1987 range from a low of 0.34 to a high of 0.77. Instead of 8 variables a total of 9 variables are used. The additional variable is infant mortality rates in 1977 which is entered first into the model under the rationale that change in infant mortality rates at a later date will be a function of prevailing conditions at an earlier date. The configuration of the beta coefficients from one step to the next remains stable. The most important explanatory or predictor variables include infant mortality rates in 1977, total fertility rates, female literacy rates, homecraft centers and the region dummy variable (Dl).
DISCUSSION AND POllCY IMPllCATIONS
Although inadequate in their scope, the results of simple correlation and multiple regression analysis have revealed some interesting relationships between the spatial variation of infant mortality and several demographic, socioeconomic and region variables. The relationships higWighted above have some very important policy implications at the regional and district levels. It has been noted above that for the year 1977, when the influence of all the other independent variables on infant mortality is controlled fOf, the region variable (D2) emerges as the singular most important determinant of infant mortality at district level in 1977.
123
MIDDLE STATES GEOORAPHER - VOL. 25, 1992
The results of this study raise several issues which need to be addressed if infant mortality rates are to be reduced especially in those districts where the rate is above the national average. There are some underlying socio-cultural factors which seem to account for the variation of infant mortality but cannot be easily pinpointed in a study like this one. A comprehensive survey to study the dynamics of infant mortality is therefore essential for a better understanding of the regional factor. It is also apparent from the results that regional inequalities in socioeconomic conditions are intensifying over time.
Partly due to historical chance, there are regional inequalities in the availability of educational facilities in the country which can be traced back to the early days of colonial rule. Missionaries set up schools in the Northern Region while the colonial administration established itself in the Southern Region. The northern part of the country thus experienced an unprecedented development of its educational infrastructure while the central and southern parts lagged behind in this respect (Pachai 1972; Sindima 1992). Today the Northern Region enjoys the highest literacy and school enrollment rates in the country (NSO 1991).
There is need to spatially balance educational facilities. An intensified and more equitably distributed educational system would drastically reduce infant mortality rates in districts such as Nsanje, Salima, Dewa and Mangochi. Increased education, particularly of women, would also have an added advantage of reducing achieved fertility and raising the age at which girls marry.
CONCLUSION
Through the use of simple choropleth maps, correlation analysis, and forward stepwise regression analysis this study has attempted to explain the spatial variation of infant mortality in Malawi at district level. The results indicate that infant mortality is strongly associated with a number of demographic and socioeconomic variables. Age at first marriage, total fertility rates, female literacy rates, number of homecraft centers per 10,000 women and females in agriculture (%) are among the most important demographic and socioeconomic variables. For example, districts with high levels of literacy rates and educational facilities have lower rates of infant mortality. Districts with more females engaged in agriculture have higher levels of infant mortality. As a result, there are distinct regional differentials due to the inequitable distribution of educational opportunities, health care facilities, and nonagricultural activities. But even after controlling for these socioeconomic variables, regional differentials in infant mortality still persist. This leads me to believe that there are some significant socio-cultural or other region specific factors that need to be identified.
REFERENCES
Anker, R., and J. C. Knowles. 1977. An empirical analysis of mortality differential in Kenya at the macro and micro levels. IW Working Paper 60, Geneva: ILO.
Bell, M. 1988. Contemporary Africa. Burnt Mill, Harlow: Longman Scientific & Technical. Caldwell, J. C. 1979. Education as a factor in mortality decline: an examination of Nigerian data. Population Studies 33(3):395
413. Caldwell, 1. C., and P. F. MacDonald. 1982. Influence of maternal education on infant and child mortality: levels and causes.
Health Policy and Education 2:251-267. Cantrelle, P., B. Ferry, and J. Mondot. 1978. Relationships between fertility and mortality in tropical Africa. In The Effects of
Infant and Child Mortality on Fertility, ed. S. H. Preston, 18lff. New York: Academic Press. EPD (Economic Planning Department). 1986. Statement ofDevelopment Policies 1987-1996. Lilongwe: Office of the President
and Cabinet. Farah, A., and S. H. Preston. Child mortality differentials in Sudan. Population and Development Review 8(2):365. Faruqee, K. C. 1980. Kenya: Population and Development. Washington, D.C.: World Bank. Kalipeni, E., and C. Kamlongera. 1987. Popular Theatre and Primary Health Care in Malawi. Zomba: University of Malawi,
Demographic Unit. Kent, G. 1991. The Politics of Children's Survival. New York: Praeger. M'manga, W. R., and M. L. Srivastava. 1991. Socio-economic and Demographic Determinants of Family Size in malawi: A
Multivariate Analysis. Zomba: University of Malawi, Demographic Unit. MOH (Ministry of Health). 1987. Survey Description and Background Characteristics: 1984 Family Formation Survey.
Lilongwe: Ministry of Health. NSO (National Statistical Office). 1984. Malawi Population Census 1977: Analytical Report. Zomba: Government Printer. ___. 1987a. Malawi Demographic Survey, 1982. Zomba: Government Printer. ____. 1987b. Malawi Family Formation Survey - 1984. Zomba: Government Printer. ____. 1991. Malawi Population and Housing Census, 1987: Summary ofResults. Zomba: Government Printer. Pachai, B. 1972. State and churches in Malawi during the early protectorate rule. Malawi Journal ofSocial Science 1:7-27.
124

DETERMINANTS OF INFANT MORTALITY IN MALAWI
SAS Institute. 1990. SASISTAT User's Guide: StaJistical Applications Vol. 1 & 2, Fourth Edition. Cary, NC.: SAS Institute. Sindima. H. J. 1992. The Legacy of Scottish Missionaries in Malawi. Lewiston, NY.: Edwin Mellen. Theroux, P. 1989. Malawi: faces of a quiet land. NaJionaJ Geographic. 176(3):371-389. Tsui, A. 0., and D. J. Bogue. Declining world fertility: trends, causes, implications. Population Bulletin 33(4). World Bank. 1990. World Development Report 1990: Poverty. New York: Oxford University Press for the World Bank, New
York, 1990.
125
...