Embed Size (px)
Citation preview

Determinants of Hedge Fund Internal Controls and Fees*
Gavin Cassar
The Wharton School University of Pennsylvania
Joseph Gerakos
Graduate School of Business University of Chicago
October, 2008
ABSTRACT
We investigate the determinants of hedge fund internal controls and their association with the fees that funds charge investors. Unlike other investment vehicles, hedge funds are subject to minimal regulation, allowing fund managers to voluntarily choose and implement internal controls, and managers and investors to freely contract on investor fees and manager compensation. Using a proprietary database of due diligence reports, we find that funds domiciled offshore are more likely to adopt stronger control mechanisms that decrease the likelihood of fraud and financial misstatements, and are more likely to use reputable outside service providers and incorporate stricter authority over the transfer of funds. We also find that internal controls vary systematically by fund leverage and fund age, and whether the fund pursues a short selling investment strategy; consistent with agency costs and the protection of proprietary information explanations, respectively. With respect to internal control outcomes, managers of funds that have restated performance receive lower management fees. Further, we find a positive association between internal controls and performance based fees, which is consistent with investors protecting against manipulated reported returns due to inadequate internal controls. Overall, this study contributes to the literature by investigating the demand and implications of internal controls in an unregulated setting.
Keywords: hedge funds, internal controls, investor fees, restatements. Data Availability: The data used in this study are obtained from Lipper TASS and through agreement with HedgeFundDueDiligence.com. This agreement prohibits the authors from making the data available to other parties. * Corresponding author: Gavin Cassar. Steinberg Hall-Dietrich Hall (Suite 1300), 3620 Locust Walk, Philadelphia, PA 19104-6365. [email protected] P: (215) 898 2023. The authors thank HedgeFundDueDiligence.com for providing the data used in the project. The authors also thank Ralph DiMeo, Wayne Guay, Chris Ittner, Robert Krause, Ro Verrecchia, and seminar participants from Florida State University, McGill University and the Wharton Applied Economics Workshop for their comments. This project benefited from the research assistance of Amy Chang, Tanoya Chatterjee, Jessica Leung, and Nicholas Smith-Wang. The financial support of The Wharton School and The University of Chicago GSB’s Initiative on Global Markets is greatly appreciated.

I. INTRODUCTION
We investigate internal controls used in hedge funds. While there is some evidence on the
determinants and consequences of internal controls use for publicly traded firms (e.g., Kinney
2000; Ge and McVay 2005; Ogneva, Raghunandan, and Subramanyam 2007), their internal
controls are often mandated by the Securities and Exchange Commission (SEC) and/or by the
stock exchanges on which they are listed. In contrast, hedge funds are typically not exchange
traded and not registered with the SEC. Therefore, hedge funds are exempt from the regulations
that other investment vehicles face, and hedge fund managers can voluntarily choose the extent
of internal controls employed. Further, exemptions from these regulations provide managers and
investors substantial discretion to negotiate over fees. Therefore, hedge funds provide a setting to
investigate ex ante how investment contract parameters vary with an investment vehicle’s
internal controls.
In this study, we examine the determinants of hedge fund internal controls and the
association between internal controls and the fees that funds charge investors. We use a broad
definition of internal controls that encompasses mechanisms designed to decrease the likelihood
of fraud and to increase the accuracy of asset valuations and performance disclosed to investors.
Some examples are independent pricing of investment positions and the use of reputable service
providers, such as auditors and administrators.
Although better internal controls should decrease the likelihood of fraud and the
manipulation of reported performance, not all hedge funds are likely to invest in internal controls
because they are costly. We predict that managers of younger funds and offshore funds are more
likely to adopt stronger internal controls and reporting mechanisms, as these funds are riskier
along the dimensions of fraud and financial misstatements and therefore should obtain greater
benefits. Further, we posit that internal controls designed to decrease the likelihood of
1
misreported performance vary with the costs arising from the disclosure of proprietary
information about the fund’s investment strategy and positions, with funds that employ a short
selling strategy being less likely to use independent pricing sources to reduce the likelihood of
any outsiders knowing their short positions or strategies.
To investigate the use of internal controls in hedge funds we utilize a proprietary
database of due diligence reports prepared by HedgeFundDueDiligence.com (HFDD). These
reports provide an extensive array of detail regarding fund characteristics and internal controls,
investment contract terms and provisions, investment style and portfolio characteristics, and fund
and manager backgrounds. These due diligence investigations were commissioned by investors
evaluating whether to invest in the funds. Therefore, the sample represents a set of hedge funds
that were actively seeking investors and for which investors initiated due diligence to evaluate
the backgrounds, contract terms, and internal controls of the funds.
We observe substantial variation in the use of internal controls. Offshore funds are more
likely to use control mechanisms that decrease the likelihood of fraud and financial
misstatements, to incorporate stricter signature authority for the transfer of funds, to use
independent pricing mechanisms, and to employ more reputable outside service providers. These
findings are consistent with investors demanding greater internal controls for funds that are not
subject to the U.S. legal systems. Also, consistent with agency cost arguments we find evidence
that younger funds and levered funds employ stronger internal control mechanisms. Further,
consistent with higher costs associated with proprietary information about investment strategies
and positions, we observe that funds with a short bias investment style are less likely to utilize
external parties to price their portfolios.
We argue that when considering an investment in a hedge fund, investors estimate the
probability of fraud and financial misstatements, and this probability decreases in the quality of a
2

fund’s internal controls. Consequently, we posit that managers of funds with more stringent
internal controls can charge higher fees and have greater sensitivity between their fees and the
fund’s reported performance. Consistent with these arguments, we observe internal controls that
reduce managers’ opportunities to manipulate reported performance are positively associated
with the percentage of investment profits received by the manager. This finding is consistent
with investors mitigating moral hazard costs from manipulated reported returns when managers
have greater discretion, thereby protecting against potential financial misstatements and fraud.
Further, we supplement the above analysis by examining the association between
restatements and fees. Prior research considers restatements an outcome of weak internal
controls (Abbott, Parker, and Peters 2004; Doyle, Ge, and MacVay 2007). Relevant to our
setting, restatements are not chosen by hedge funds at the time of due diligence, making them
predetermined at the point of contracting. We find funds that have restated performance receive a
significantly lower percentage of assets under management for managing the fund. This result is
consistent with investors protecting against the risk of future misstatements by paying lower
fees.
We make several contributions. First, we contribute to understanding the costs and
benefits of internal controls by investigating a broad range of internal controls and their
association with fees in an unregulated setting. Present evidence on internal controls is generally
based on public firms and public finance markets (Ashbaugh-Skaife, Collins, and Kinney 2007;
Ashbaugh-Skaife, Collins, Kinney, and LaFond 2007; Doyle, Ge, and McVay 2007; Ge and
McVay 2005; Hammersley, Myers, and Shakespeare 2008; Kim, Song, and Zhang 2008;
Ogneva, et al. 2007). The limited non-public firm evidence is primarily based on the use of
auditors and its affect on cost of debt financing (Allee and Yohn 2009; Blackwell, Noland, and
Winters 1998; Fortin and Pittman 2007). This study differs from previous research on internal
3

controls in that it focuses on an unregulated setting, free from SEC requirements that can affect
internal operations and investor fees. Further, hedge funds are opaque and risky investment
vehicles, thereby providing a powerful setting in investigate internal control determinants and
outcomes. Indeed, the operational risks, which internal controls attempt to monitor and reduce,
may be more important than financial risks in determining fund performance (Lo 2001, 30–31).
Second, we extend the literature on hedge funds by examining their internal operations.
In doing so, we contribute to the debate on the regulation hedge funds. In general, the SEC
regards internal controls as a critical element in the protection of investors. And, it recently
increased its regulatory focus on hedge funds and proposed hedge fund regulations that include
the mandatory disclosures and other investor protections (Smith 2006a; Smith 2006b; Oesterle
2006). Hedge fund advocacy groups responded to these proposals by suggesting that funds
follow ‘best practice’ standards determined by the funds themselves given consideration to the
particular characteristics and circumstances of each fund (e.g. MFA 2005). We show predictable
differences in cross-sectional use of internal controls within hedge funds in a voluntary setting,
suggesting that funds systematically vary their internal controls by fund characteristics. Further,
we show that internal control use by hedge funds is associated with investor fees.
The following section provides an overview of hedge funds. Section three develops the
empirical predictions. Section four details the sample and its characteristics. Section five reports
the results. Section six concludes.
II. HEDGE FUND SETTING
A hedge fund is a private, managed investment vehicle. Some stylistic features of hedge
funds include they are often privately-held, generally comprised of wealthy individuals and
institutional investors, and typically organized in the U.S. as limited partnerships and offshore as
4

corporations (Fung and Hsieh 1999).1 There has been substantial growth in the hedge fund
industry, both in the number of funds and assets under management (Brown, Goetzmann, and
Ibbotson 1999; Fung and Hsieh 1999; Lo 2007). As of the first quarter of 2008 hedge funds held
over $2.8 trillion in assets under management (HFN 2008). Although hedge funds have grown
tremendously and are under intense scrutiny regarding their operations and potential contribution
to systemic risk, because of their opaqueness little is known about how they operate (Lo 2001;
Chan, Getmansky, Haas, and Lo 2006).
Unlike other investment vehicles, hedge funds are structured to be exempt from public
offering requirements of the Securities Act of 1933, the periodic reporting obligations of the
Securities Exchange Act of 1934, and the registration requirements of the Investment Company
Act of 1940 (Oesterle 2006).2 For example, Section 5 of the Securities Act of 1933 requires
registration of the sale of securities unless the issue qualifies for a ‘private placement’
exemption.3 Rule 506 of Regulation D provides exemption for hedge funds if they restrict their
offering to only accredited investors, namely investment companies, or individuals with more
than $1 million or income exceeding $200,000 in the two most recent years or joint income with
spouse over $300,000; and up to 35 other US purchasers.4 Additionally, to qualify for exemption
all non-accredited investors must be determined by the fund to be sophisticated, with knowledge
and experience to evaluate the prospective investment. Therefore, a more descriptive definition
of a hedge fund is an investment fund exempt from a list of specific federal acts regulating
investment vehicles (Oesterle 2006).5 To ensure exemptions from SEC regulation, hedge funds
1 Although the early hedge funds generally held offsetting long and short positions (leading to the title “hedge funds”), hedge funds are not limited to strict long-short positions. 2 For a more detailed discussion of the regulation of hedge funds see Lhabitant (2008, 37–84) and ABA (2005). 3 While issuers of private placements are required to file a Form D with SEC within 15 days after the first sale, this form contains very little detailed information about the issuance (Lhabitant 2008, 41). 4 Regulation S provides detailed exemptions related to issuances to non-US investors. 5 Providing a definition of a hedge fund based on operating characteristics is problematic given their wide variation in investment asset class, sector, duration, region, and organizational structure (ABA 2005, 1; Lhabitant 2008, 1).
5

cannot undertake any form of general solicitation or general advertising for their services or sale
of securities to the general public, and therefore must solicit investments through private
placements only to those who are sophisticated enough to evaluate the investment and have
sufficient wealth to bear the risk of the investment (ABA 2005, 214–215; Lhabitant 2008).6
This minimal regulatory environment provides hedge funds substantially more flexibility
in their operations. For example, hedge funds have greater discretion regarding valuation and
reporting of their investments (McVea 2008; SEA 2003). Unlike other investment vehicles that
are registered under the Investment Company Act of 1940, hedge funds have greater discretion
to use leverage to finance their investment positions and can undertake substantial short-selling
(Lhabitant 2008, 46).7 In addition, hedge funds can charge fees based on performance, whereas
other investment vehicles, such as mutual funds, are restricted to fees based solely on assets
under management (Fung and Hsieh 1999).8
When evaluating an investment in a hedge fund, investment advisors or accredited
investors solicit information about the fund, with the investment terms laid out in an offering
circular or “private placement memorandum” (PPM). The PPM, and the subsequent executable
limited partnership agreements and subscription agreements, lay out the fund’s operations and
the investor’s contractual rights: the fund’s investment strategy, the fees agreed to be paid, the
6 Violation of this solicitation rule may evoke registration of the sale of securities under the Securities Act of 1933, registration as a mutual fund under the Investment Company Act of 1940, and registration as an investment advisor under the Investment Advisers Act of 1940. 7 For example, open-end investment companies are restricted to bank sourced leverage only, with this amount capped at 300% of the asset coverage (Section 18(f)(1) Investment Company Act of 1940). 8 While there is a general prohibition of performance-based fees by investment vehicles under the Investment Advisers Act of 1940 section 205(a)(1), there are some exemptions provided by the Performance Fee Rule (Investment Advisers Act of 1940 Rule 205-3). Specifically, an SEC registered investment adviser or offshore fund with US investors may charge performance fees if one of the following conditions is met by the investor at the time of investment: 1) the investor has at least $750,000 under the management of the adviser; 2) the investor has net worth in excess of $1.5 million; or 3) the investor is a “qualified purchaser” as defined in Company Act section 2(a)(51)(A), which includes individuals who hold at least $5 million in investments or other corporate entities and trusts that meet sufficient wealth thresholds. The Performance Fee Rule is motivated by the SEC’s belief that wealthy investors can fend themselves against potential fee abuses related to hedge fund performance (ABA 2005, 331–334).
6

terms that which the investor can invest and withdraw funds, the investor’s ability to monitor the
fund, the manner and frequency in which the fund will estimate and report performance, and the
investor’s remedy rights in the case of a dispute (ABA 2005, 96–98). Because hedge funds are
substantively exempt from securities regulations, the terms laid out in the PPM, and subsequent
executable agreements, represent the virtually all of the mechanisms in place to protect the
investor’s investment. Consequently, hedge funds provide a setting to examine investment fund
structure and financial contracting in an unregulated environment.
III. EMPIRICAL PREDICTIONS
Hedge funds are opaque due to the limited mandatory disclosure requirements and the
proprietary nature of their operations. Consequently, there is the potential for substantial agency
costs between investors and fund managers. In addition, hedge funds often engage in complex
trading strategies that involve large numbers of securities and/or trades thereby increasing the
potential for fraud on the part of employees. Therefore, in this setting there are strong incentives
to implement internal controls that increase the monitoring of managers, reduce the likelihood of
fraud, and increase the accuracy of asset valuations and the performance disclosures made to
investors.9 Consistent with the importance of hedge fund internal controls, Kundro and Feffer
(2003) find that the breakdown of internal systems was a major determinant of failure for over
50% of the 100 failed funds they investigate.
The fund manager is the residual claimant on the fund. By implementing internal controls
to reduce the agency costs between investors and the fund, managers can increase the value of
their residual claim if the benefits of implementation, such as obtaining greater fees, are greater
than the costs of implementing and maintaining internal controls. While there may be benefits to
7

having particular internal controls in place, not all hedge fund managers will invest or commit to
using internal controls as they are costly to use and in many cases have a large fixed component
(SEC 2003).
Managers of established, higher quality funds have valuable reputations and potentially
superior investing technologies, implying that they hold more valuable residual claims from
operating their funds than managers of lower quality funds. Therefore, managers of higher
quality funds have greater incentives to prevent fraud and to provide investors with more
accurate performance reports, thereby reducing the benefit for explicit internal controls. Fund
quality can be signaled by past investment performance and capital flows (Fung and Hsieh
1997). Therefore, for new funds there is greater uncertainty about the quality of the manager and
the likelihood that the manager will commit fraud or misstate performance. This uncertainty
should increase the benefit to new funds from enacting more stringent internal controls and using
reputable outside service providers. For example, Mansi, Maxwell, and Miller (2004) find that
auditor quality and tenure are negatively related with the cost of debt financing, especially for
firms with riskier grades of debt. Consequently, ceteris paribus we predict a negative association
between internal controls and fund age.10, 11
Although onshore and offshore funds are generally exempt from US securities
regulations, investors in onshore funds can use the US legal system to redress fraud and financial
misstatements. While many offshore funds are domiciled in countries that regulate investment
9 Note that even in the absence of agency problems internal controls can increase the precision of asset values disclosed to investors and therefore reduce uncertainty about the cash flows that investors expect to receive. 10 Smaller funds are also indicative of these features as they have had less capital inflows; however, counteracting this quality effect is the greater demand for better internal controls as the magnitude of agency costs increases. For example, research has consistently shown a positive association between better internal controls and organization size (Chow 1982; Doyle, Ge, and McVay 2007). Therefore, ex-ante it is unclear what the association between fund size and better internal controls will be. 11 Note that this prediction is based on the assumption that either that internal control technology has improved over time and older funds find it too costly to implement newer technologies or that over time funds receive decreasing benefits from internal controls and therefore unravel internal controls over time.
8
vehicles and provide investors with legal regress, US legal contract enforcement mechanisms are
generally considered superior (Djankov, La Porta, Lopez-de-Silanes, and Shleifer 2008).
Therefore, ceteris paribus we predict that funds domiciled offshore will have better internal
controls because investors have reduced legal recourse to redress fraud and financial
misstatements.
Some funds use leverage to increase their invested assets. Funds generally obtain
leverage from investment banks and their prime brokers (Lhabitant 2008). Leverage creates
another stakeholder in the fund’s performance and operations. Therefore, leverage providers may
demand that funds implement strong internal controls as precondition for providing credit,
leading to positive relation between leverage and internal controls. However, the extent that the
leverage provider has an incentive and the ability to monitor the fund manager may dampen this
hypothesized association, given potential substitutability between formal internal control
mechanisms and monitoring on the part of debt holders.
Finally, investment style can affect a fund’s internal control choices. It is generally
accepted that a hedge fund investment is essentially a bet on the fund manager’s investing skill
and/or proprietary investment strategies (Edwards and Caglayan 2001; Lo 2007). Therefore, a
fund can incur substantial costs if outsiders acquire proprietary information about the fund’s
investment strategies and positions.12 These costs are particularly relevant for funds that employ
a short bias investment style. Outsiders who learn a fund’s short positions can profit because the
fund eventually has to unwind its short positions and the informed outsiders can therefore trade
against the fund when it has to cover its short position (Dechow, Hutton, Meulbroek, and Sloan
12 Note that hedge funds are required under Section 13(d) and Section 13(g) of the Securities Act of 1933 to report long positions relevant to corporate control and transfer, namely those with more than 5% of a class of equity security registered under Section 12 of the Securities Exchange Act 1934. Also, hedge funds with discretion over $100 million in assets are required to disclose their long positions on a quarterly basis. However, these requirements
9

2001). If short bias funds take actions to protect proprietary information about investment
strategies and positions, then they should limit the use of objective external verification of fund
operations, such as the valuation of fund assets.13 Consequently, ceteris paribus we predict a
negative association between short selling and internal controls that involve outside service
providers.
In conclusion, we predict that managers of younger funds and offshore funds are more
likely to adopt stronger internal controls and reporting mechanisms, as these funds are riskier
along the dimensions of fraud and financial misstatements and therefore internal controls should
allow managers of these funds to charge higher fees. In addition, we predict that leverage affects
managers internal control decisions and that short bias funds are less likely to use external
parties to value fund assets.
IV. SAMPLE
To investigate the determinants of internal controls and their association with fees we
utilize a database of hedge fund due diligence reports prepared by HFDD. The reports were
commissioned by investors evaluating whether to invest in the funds.14 Therefore, the sample
represents a set of hedge funds that investors were actively seeking to invest capital. HFDD
specializes exclusively in hedge fund due diligence and it obtained the information included in
these reports from several sources including on-site visits and interviews with key staff,
discussions with service providers (auditors and administrators), review of offering
are of limited proprietary risk given the disclosures are aggregated, delayed, and restricted to long positions only (Lhabitant 2008, 44). 13 Although service providers can and do implement mechanisms to protect the release and use of clients’ proprietary information, such systems are not perfect. For example, Geczy and Yan (2006) find that such mechanisms do not completely prevent the transmission of proprietary information between brokers and market makers, while Ivashina and Sun (2007) find that institutional investors trade on proprietary information that they receive from participating in loan syndicates.
10
memorandums, examinations of public filings and registrations, media scans, background checks
of fund managers and staff, review of financial statements, and review of internal control
protocols. Consequently, this database overcomes potential concerns related to commercial
hedge fund databases that are based on self-reported fund performance and manager
characteristics.15 The HFDD reports provide an extensive array of detail regarding fund
characteristics, internal controls, contract terms, and manager backgrounds.
Table 1 provides the descriptive statistics for the funds and managers. The sample
consists of 427 funds run by 358 unique managers. Panel A shows the sample distribution by
year and domicile. The funds were investigated from 2003 to 2007. Sample funds are domiciled
primarily in the Cayman Islands, United States, British Virgin Islands, and Bermuda. Panel B
provides a summary of fund characteristics. The mean (median) fund has $304 million ($107
million) in assets under management and is on average less than three years old (1,020 days) at
the time of due diligence. We find 36% of our sample funds’ managers are domiciled offshore;
however, in contrast to manager location, most funds (84%) are located offshore. Examining the
overlap between offshore managers and offshore funds, all of the onshore funds in our sample
are managed by onshore managers. More than half (56.8%) of our offshore funds managed by
onshore managers; however, no onshore funds are managed by an offshore manager. For
multivariate analyses we create two indicator variables to reflect the joint distribution offshore
funds and managers, and capture potential variation from the separation of fund and manager
domicile. The first variable is coded as 1 if both the manager and the fund are offshore, and 0
14 All HFDD investigations were initiated and paid for by potential investors, there were no investigations that were commissioned by, or compensation received by, HFDD from the investigated hedge funds. 15 One concern with the database is that it consists of funds willing to be subject to due diligence. However, the management HFDD stated that it was rare for a hedge fund to refuse due diligence, given that refusal typically resulted in their clients not investing in the fund.
11

otherwise. The second variable is coded as 1 if the fund is offshore and the manager is onshore,
and 0 otherwise.
Table 1 also provides descriptive detail on the funds’ investment styles and portfolio
characteristics. We observe that 54% of the funds use leverage to finance their investments. With
respect to investment style, 20% of the funds have a short bias, while 36% have a long bias. In
addition, there is substantial variation in the number of investment positions typically held in the
funds’ portfolios: 41% holding less than 40 positions, and 3% holding 1000 or more positions.
There is also variation in the typical holding period for the investments made by the sample
funds, with 13% holding investment positions for only days, 32% holding investment positions
for greater than a year.
Hedge fund managers generally receive two types of fees. First, they receive a
management fee calculated as a percentage of assets under management. For the sample the
mean (median) management fee is 1.52% (1.50%) of assets under management. Second,
managers receive a performance fee calculated as a percentage of investment profits. For the
sample, the mean (median) performance fee is 19.34% (20.00%). To provide further descriptive
detail of the fees paid to managers, Figure 1 provides cumulative distributions of the sample’s
management and performance fees. A large proportion of management fees are set at 1.00%,
1.50%, and 2.00%; while the majority performance fees are clustered at 20.0%.16 Finally, we
find that 10% of our sample funds have restated asset values and performance disclosures that
were made to investors. Overall, the characteristics of the sample are consistent with previous
empirical evidence on hedge funds (Aragon 2007).
16 To address the kinks in the distributions of management fees and performance fees, in robustness tests we replace with fee measures with ordinal measures coded as 0 for below the mode of the distribution, 1 equal to the mode, and 2 for above the mode. The results are invariant to this alternative specification.
12

V. RESULTS
Descriptive statistics of internal controls in hedge funds
We report a comprehensive set of internal controls used in hedge funds. The first group
consists of the signatures required to make transfers out of the fund’s bank and prime broker
account. The use of more than one signature authority and the use of external parties to authorize
fund movement and withdrawals provide greater control of the cash held by the fund, thereby
decreasing the likelihood of fraud. The second group relates to the mechanisms used to estimate
and disclose the fund’s performance to investors. This group can be further broken down into
three sub-groups: who prices the portfolio; what is the source of prices used to value individual
asset performance; and who calculates the portfolio’s net asset value (NAV) that is reported to
investors. The use of external parties and objective sources to value invested assets and the use
of an independent party without manager involvement to report and verify the NAV to investors
provide the most objective measurement of fund position and performance, thereby reducing the
likelihood of fraud and increasing the precision of asset valuations disclosed to investors.
The third group of internal controls consists of the quality and reputation of the fund’s
service providers, specifically its auditor and administrator. Similar to engagements with
operating firms, auditors generally undertake annual audits of hedge funds to ensure that the
financial statements furnished to fund investors comply with the relevant accounting standards.
However, note that in our setting auditors typically neither review nor comment on how funds
value their investment positions (Lhabitant 2008). Nevertheless, auditors with good reputations
have incentives to decrease the likelihood of fraud or financial misstatement on the part of their
clients.17 The role of a fund administrator varies substantially across engagements; however,
17 Note that in contrast with much of the auditing literature, we assume that the reputation as opposed to the size of the auditor and/or administrator determines the quality of services provided (see Weber, Willenborg, and Zhang 2008 for a discussion). Although hedge fund service providers can be sued, the reputational loss due to fraud or
13

they generally provide “back-office” support, such as performing day-to-day administrative
operations, accounting and valuation services, and serving as the interface with investors. In
many cases the administrator also calculates the NAV using data provided by either the fund
custodian or prime broker (Lhabitant 2008). Similar to auditors, we assume that administrators
with valuable reputations work to decrease the likelihood of fraud or financial misstatement.
Table 2 Panel A reports the descriptive statistics for the internal controls implemented by
the funds in the sample. We find that the type and number of signatures required to transfer
funds out of the bank or prime broker account vary substantially across our sample. We observe
27.7% of the funds require multiple signatures from both internal and external parties, and
24.2% require only an external signature. Some funds require only internal signatures with
24.6% requiring at least two internal signatures and 23.5% requiring only one internal signature
to transfer money out of the fund’s bank and prime broker accounts.
There is also substantial variation as to who prices the funds’ portfolio. We observe that
9.2% of funds use at least one internal service and one external service to price investment
positions, while 62.9% use only external services to price the portfolio. We also find that 11.7%
of funds use collaborative pricing, whereby an external pricing service collaborates with the fund
manager to determine the value of the portfolio. Finally, 16.2% of the funds in the sample price
the portfolio internally.
The HFDD reports list all price sources that the funds use to value their invested assets.
We report all sources and the least objective source used by each fund. The most objective
source, exchange quotes, are used (solely used) by 69.9% (34.8%) of the funds. Over-The-
Counter (OTC) quotes are used (the least objective source) for 15.8% (5.9%) of the funds, while
dealer quotes are used (the least objective source) for 40.2% (33.2%). Regarding proprietary
misstatement is probably larger than any damages that can be recovered especially for funds and service providers
14

based valuation sources, we find 14.8% (12.7%) of our sample uses (use as their least objective
source) model based prices. Finally, 13.4% of our sample generates price internally. Internal
pricing may be advantageous if the asset if difficult to value, allowing managers to use their
superior judgment and information to provide the best estimate of the investment value. But, it
provides managers with greater opportunities to manipulate reported performance. We use the
least objective price source for our empirical analyses.
Who sets and reports to investors the NAV of the hedge fund’s investment portfolio
differs from who prices the investment positions. Pricing is done on an asset by asset basis and
occurs on a routine, frequent basis, while NAV represents the net asset value of the entire
portfolio and it is estimated and reported to investors typically at month end. The majority of
funds (85.9%) have no manager involvement in the determination of the NAV, which represents
the most unbiased approach to its calculation. However, the remaining 14.1% have some
manager involvement, with most giving the manager sole determination of the setting and
reporting NAV.
We now describe the use of service providers by our funds. While Big 4 auditor is
typically used in accounting research to represent auditor quality (Fortin and Pittman 2007;
Hogan 1997; Mansi et al. 2004), we utilize hedge fund industry specific rankings of audit firms
obtained from Institutional Investor’s Alpha Survey, because hedge fund auditing may require
specialized skills that differ from those required to audit publicly traded firms.18 The Alpha
survey is based on voting by industry participants and it is similar to Institutional Investor’s
ranking of equity analysts used by researchers (Hong and Kubik 2003; Stickel 1992). Of the
funds in the sample, 77.0% are audited by an auditor that is ranked in the Alpha survey. We also
located offshore. 18 The correspondence between Big 4 and the hedge fund industry specific measure is 85%.
15

use the Alpha survey to determine the quality of fund administrator and find that 31.6% of
sample utilizes a ranked administrator.19
Panel A also reports internal control use for all domiciles with more than 10
observations. In doing so, we rule out the possibility that one or more regulatory regimes require
hedge funds to utilize mandated internal controls. Importantly, we observe variation across all
the internal controls investigated within domicile group, suggesting that funds have discretion on
all these internal control choices. Further, examining the regulation of our sample domiciles we
find no mandatory requirements that would require internal control adoption investigated in this
study (ABA 2005; PWC 2006). For example, the Cayman Islands have a requirement that hedge
fund service providers are from an accredited registered list, but this list includes many service
providers who were not ranked by Alpha Investors. Consistent with this list, we observe non-
ranked auditors and administrators used by Cayman Island domiciled funds. Further, we observe
a higher likelihood of engaging a ranked auditor and administrator across non-Cayman offshore
funds then in US domiciled funds, suggesting that our offshore findings are not solely
attributable to the Cayman Islands.
We numerically rank each of our internal controls by quality, to allow estimation of
better internal controls across each of our investigated internal controls types.20 These ranks are
provided in Panel A. Further, to measure the overall association between more effective internal
controls and their determinants we sum the individual internal controls used into an overall index
score.21 An advantage of this approach is to enable estimation of overall internal control use and
allow for potential substitutes and complements across their use. Panel B presents the descriptive
19 We also considered prime broker as a potential service provider. We found that almost all of our sample hedge funds utilized a prime broker that was ranked by the Alpha survey. 20 The ordering of each item is based on the ordering provided in the due diligence reports.
16

statistics for summary measures of each of our internal controls and our overall internal control
measure.
Table 3 reports the correlations between each of the internal controls investigated, the
overall internal control measure, the independent variables, and hedge fund fees. We observe
that the six internal controls are all significantly positively correlated (at p < 0.10, two-tailed),
aside from the signature-administrator pairing. We also find that better internal controls are
significantly positively correlated with funds and managers that are offshore, levered funds, and
management and performance fees, and negatively correlated with fund age, and short bias in
investment strategy.
Examination of determinants of hedge fund internal controls
Table 4 presents regressions modeling the determinants of internal controls used by the
funds in the sample. To represent fund characteristics we use the following independent
variables: the fund’s assets under management; and the natural logarithm of the fund’s age in
days; indicators for whether the fund and fund manager are offshore and for whether the fund is
offshore but the manager is onshore. To proxy for portfolio characteristics and investment style
we include indicator variables for whether the fund uses leverage, whether the portfolio has a
long bias, and whether the portfolio has a short bias. To control for the liquidity of the portfolio’s
investments we include indicator variables for typical holding period of portfolio investments,
indicator variables for typical number of positions held by the fund, and year fixed effects.
Although previous research that investigates the liquidity of hedge fund investment
portfolios uses a measure based on the serial correlation of self-reported monthly fund returns
21 In unreported results we attempted to reduce the dimensionality of the internal control variables through principal component factor analysis. While the six internal controls were positively correlated with each other, as shown in Table 3, the largest factor obtained explained only 33.9% of the overall variance in our internal controls.
17

(Getmansky et al. 2004), we use the series of indicators representing typical number and length
of positions to avoid potential endogeneity between the serial correlation measure and internal
controls. Specifically, if internal controls affect the serial correlation of reported performance by
influencing the ability of the manager to smooth reported performance, then the serial correlation
measure of liquidity may also be correlated with the quality of the fund’s internal controls.
Panel A presents Probit regressions for the signatures required to transfer funds from the
bank accounts and prime broker accounts. We find that single internal signature authority is
significantly less likely to be used by offshore funds, regardless of manager domicile, consistent
with offshore funds providing higher quality internal controls. Larger funds are also more likely
to use single signature authority. As shown from the External Only and Dual/Triple Entity
models, offshore funds and offshore managers are also more likely to require external signatures.
Transaction costs appear to affect signature authority with funds that hold over 1,000 positions
less likely to require external signatures. If these funds move positions regularly and are quite
liquid, the requirement to have an external party authorize the transfer of funds on each occasion
may be overly burdensome and costly. These funds are, however, more likely to require at least
two internal signatures, because large numbers of positions increases the likelihood of fraud.
The right-most column of Panel A presents an Ordered Probit regression in which the
dependent variable takes on the index values (0, 1, 2, 3) representing Single Internal, Double
Internal, External Only, and Dual/Triple Entity signature authority, respectively, to enable us to
determinant the overall association between more effective signature internal controls and the
independent variables. Under this specification we observe that larger funds and funds that are
domiciled offshore are significantly associated with increased control over signatures required to
transfer funds out of bank and prime broker accounts.
18

Panel B presents a series of Probit regressions modeling who prices the hedge fund
portfolio. We find offshore funds are significantly less likely to internally price their portfolio,
and significantly more likely to use external pricing services. Levered funds are also
significantly less likely to use manager sourced prices and alternatively utilize multiple external
entity pricing. Furthermore, funds with a short bias in their investment positions are more likely
to use internal pricing and less likely to use external pricing. This finding is likely driven by the
proprietary nature of short selling and the potential for outsiders to profit from knowing that the
fund has to unwind its short positions. The right-most column of the panel presents an Ordered
Probit regression of overall pricing sources quality. The coefficients in this specification are
consistent with the inferences from the individual pricing regressions with offshore funds and
levered funds more likely to rely on external rather than internal pricing, and those funds with a
short bias in their investment strategy more likely to rely on internal pricing than external
pricing.
Panel C presents Probit regressions modeling the source of prices used to value the
funds’ portfolios. Consistent with the results for who prices the portfolio, offshore funds are less
likely to use internal and model-based sources of prices, and more likely to use more dealer and
exchange-based sources to value their portfolio. Funds that use leverage are less likely to use
internal sources and more likely to use dealer sourced prices, consistent with hedge funds with
greater agency costs having more objective pricing. Further, we observe that funds with some
bias in their investment style, long or short, are less likely to use external sources, such as dealer
and exchange-based prices, and more likely to use internal price sources. The right-most column
of Panel C provides the Ordered Probit of overall pricing source quality. We again observe those
with bias in their investment style making less use of objective prices sources, and some
19

evidence that small funds use less objective sources. We also observe that funds with managers
domiciled offshore making greater use of more objective pricing source measures.
The left-most column of Panel D presents Probit regressions modeling whether the NAV
is determined without manager involvement. We observe that managers of offshore funds,
regardless manager location, are more likely to determine and report NAV without manager
involvement. These findings are consistent with the pricing findings observed in Panel B and C.
The remaining columns from Panel D model whether the fund uses an auditor or an
administrator ranked by Institutional Investor’s Alpha Survey. Larger funds and offshore funds
are more likely to use a higher quality auditor and administrator. Additionally, funds that use
leverage are more likely to use a higher quality auditor, while younger funds are more likely to
use a higher quality administrator.
Panel E provides the Ordinary Least Squares regression modeling overall internal control
quality as a function of fund characteristics. Overall, the evidence is consistent with offshore
funds and managers adopting stronger internal control mechanisms to decrease the likelihood of
fraud and financial misstatements, incorporating stricter signature authority for the transfer of
funds, using independent pricing mechanisms, and employing more reputable outside service
providers. These findings are consistent with investors demanding greater internal controls for
funds that are not subject to the U.S. legal infrastructure. There is also evidence that funds that
use leverage, thereby increasing the risk of their fund, also employ stronger internal control
mechanisms. Overall internal control quality is weakly associated with fund age, consistent with
younger funds having greater incentives to implement stronger internal controls to reduce greater
concerns with adverse selection and moral hazard. Finally, short bias funds have lower quality
internal controls, driven in part by these funds reducing proprietary costs that can arise from
external parties learning the funds’ investment positions.
20

Examination of the determinants of hedge fund fees
This section investigates the association between internal controls and investor fees. We
predict that investors take into account the likelihood of fraud and manipulated reported
performance when contracting with hedge funds and that therefore weaker internal controls are
associated with lower fees and reduced fee-performance sensitivity.
Specifically, when the investor cashes out, the value of the investor’s asset is revealed by
the hedge fund. The greater the likelihood that the revealed value is deliberately deflated by the
hedge fund to reduce the investor’s claims, and therefore the asset retained by the hedge fund,
the more likely investors will price protect when investing in the fund. Managers have incentives
to inflate reported performance because on they collect management fees and future capital
inflows based on reported assets under management and returns performance (Fung, Hsieh,
Naik, and Ramadorai 2008; Getmansky et al. 2004). Therefore, we posit that more extensive
internal controls improve the accuracy and precision of asset valuations and returns disclosures
made to investors, decreasing the likelihood and magnitude of investor losses from managers’
manipulation of reported performance.
Aside from variations in the fees paid as a proportion of assets under management, the
use of internal controls may also affect the sensitivity between the fees paid to managers and
fund performance. Specifically, if the manager has greater discretion or less oversight regarding
the value of the fund’s investments reported to investor, this will increase the opportunity for the
manager to misreport the investment values for self-interested purposes. The incentive to
manipulate the reported value of the investment increases with the sensitivity of managers’
compensation relative to the reported value. The most obvious mechanism to vary this sensitivity
is through the relative proportion of fees rewarded from investment profits, namely the
21
performance fee. Therefore, ceteris paribus we predict that internal controls that provide greater
opportunity to manipulate reported performance will be negatively associated with the
performance fee paid to fund managers.
Table 5 presents regressions of the determinants of hedge fund fees. For these regressions
we use the same independent variables as in Section 4.2. Panel A presents ordinary least squares
regressions that model the determinants of the management fee paid to the hedge fund manager,
with the left-most model presenting the results with controls only, and the second model with
controls and our measure of internal control quality. For exposition, we multiply the dependent
by 100. Examining our overall measure of internal controls on management fees, there is no
significant effect. Taken by itself, this evidence suggests that our investigated internal controls
are not priced through the management fees.
Panel B presents ordinary least squares regressions that model the determinants of the
performance fee paid to the manager. Examining the internal control coefficients we find that
better internal controls are significantly positively associated with performance fees (β = 0.261;
p < 0.05). This result is consistent with investors protecting against potential misstatement as a
result of inadequate internal controls through lower performance fees. It is also consistent with
investors and hedge funds reducing the costs from moral hazard and the motivation for managers
to manipulate reported performance. This finding suggests that as the opportunity for
manipulation of fund performance increases the reliance on fund performance as an incentive
mechanism decreases. Performance fees are also positively associated with funds that have
higher turnover in their investment portfolios.
Endogeneity
22

A potential concern is that our internal control measures are endogenous. While we
include the variables that predict internal control quality in the model determining fees we
recognize that endogeneity may affect our inferences because of simultaneity and/or correlated
omitted variables. We discuss below these endogeneity concerns and how we address them.
First, our motivation for adopting our empirical design is driven by the ordering of the
various parameters investigated in this study. Given fund managers have specialized expertise in
particular areas of investment (Brown and Goetzmann 2003) it is unlikely that they change fund
characteristics over time; therefore, making these characteristics predetermined. Internal controls
are then likely chosen as a function of these fund characteristics. The management and
performance fees are detailed in the PPM to investors. Investors first observe these
predetermined characteristics of the fund and the internal controls used by the fund, and then
decide whether to invest in the fund based on the terms and fees offered.22 In addition, given that
the observed internal controls and fees are determined based on those offered to all fund
investors, the likelihood that internal controls and fees vary by individual investor characteristics
is low.23
Second, to investigate the likelihood that unobserved fund characteristics determine both
internal controls and fees, we adopt the approach developed by Rosenbaum (2002) to estimate a
bound on the extent that omitted variables would have to be correlated with our measures in
order to drive the results. Specifically, we use Kruath’s (2007) calculation to estimate how large
the correlation between unobserved heterogeneity and the internal control index would have to
22 There is limited ability for the fund to change these investment terms, as changes are only allowed under certain circumstances and with the majority consent of the investors (Aragon 2007). Consistent with this, empirical evidence suggests there is very limited variation in fees over time (Liang 2000). 23 We acknowledge that some investors have greater bargaining power and are therefore able to negotiate special fees and terms. But, such fees and terms are laid out in “side letters” that are separate from the PPM. Further, some investors may negotiate a “favored nation” clause, which would result in any favorable terms contracted with other investors also granted to them, suggesting that the presence of such a clause would increase the overall cost to the fund to offer more favorable terms to some investors.
23
be compared to the correlation between the internal control index and the other independent
variables. In order for the 95% confidence interval on the internal control index coefficient to
include zero the correlation between unobserved heterogeneity and the index would have to be
greater than 56% of the correlation between the index and the other independent variables. While
such a correlation is possible, it is unlikely due the comprehensive measures of fund
characteristics included in our independent variables.
Third, an alternative approach to address potential endogeneity when examining the
determinants of internal controls and fees is to hold the investment characteristics of the fund
constant, thereby ruling out that the internal controls are deterministic of, or are capturing, the
underlying investment characteristics of the fund. To achieve this we reperformed our analyses
only for those funds that typically held 1-40 positions, the investment positions category with the
greatest number of sample funds. For these 172 funds we observe the determinants of internal
controls and the association between internal controls and performance fees are consistent with
the presented results for the full sample, and are consequently not reported. Additionally, we
reperformed our analyses for those hedge funds that typically held their positions for one year
and greater. Again, we observed that the determinants of internal control use and the association
between internal controls and fees to be consistent with the overall sample.
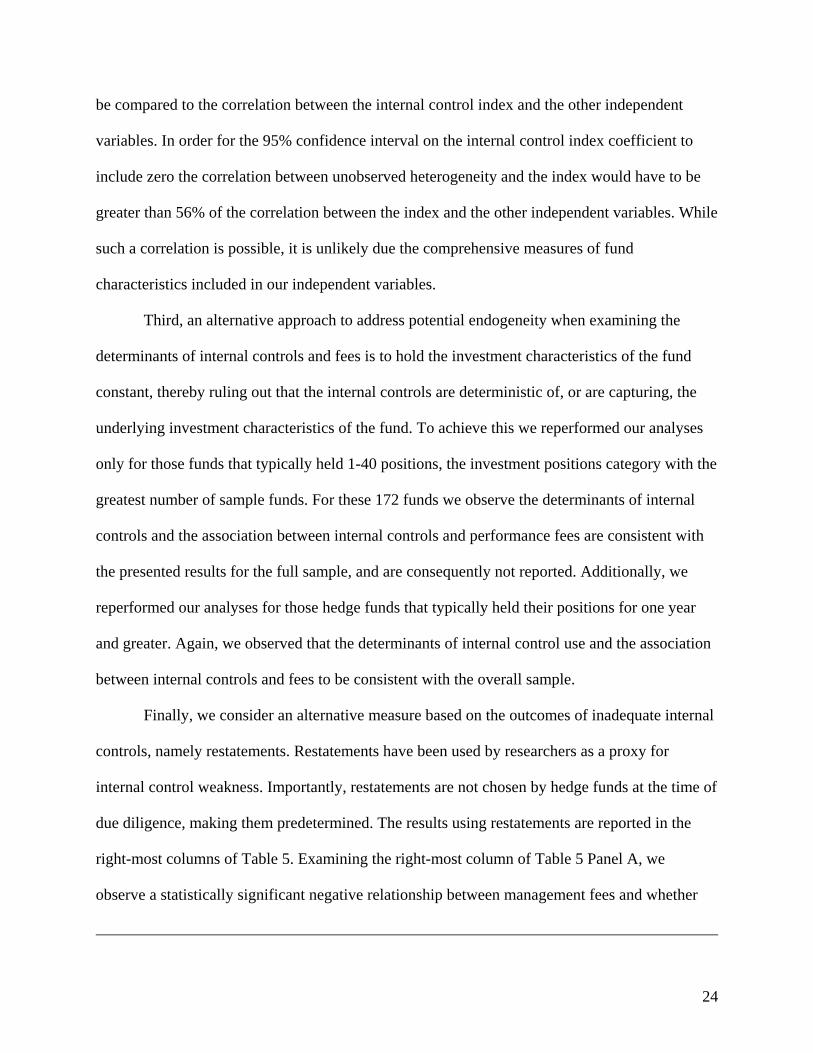
Finally, we consider an alternative measure based on the outcomes of inadequate internal
controls, namely restatements. Restatements have been used by researchers as a proxy for
internal control weakness. Importantly, restatements are not chosen by hedge funds at the time of
due diligence, making them predetermined. The results using restatements are reported in the
right-most columns of Table 5. Examining the right-most column of Table 5 Panel A, we
observe a statistically significant negative relationship between management fees and whether
24

the fund has restated the performance reported to investors (β = -0.227; p < 0.05). This
relationship between restatements and management fees is also economically significant. For
example, for the mean fund restatements of reported performance is associated with $692,000
less in management fees per annum. This finding is consistent with investors regarding
restatements being indicative of internal control problems (Doyle, Ge, and McVay 2007). The
observation of restated performance by the hedge fund increases the likelihood that future fund
performance may also be restated and reduces confidence in the accuracy of present and future
reported fund performance. This finding is consistent with investors protecting against this risk
by paying lower management fees. Therefore, this evidence demonstrates a significant
association between restatements, a predetermined and observable event that occurred prior to
contracting, and management fees paid by investors. However, in contrast to the management fee
findings we find little evidence of a relationship between restatements and performance fees.
Unit of analysis
We perform the analyses of the determinants of internal controls and investor fees at the
fund level and cluster the standard errors by manager to address any manager-related cross-
correlations. Alternatively, the analyses could be performed at the manager level. To investigate
the robustness of our results we reperformed all the analysis using three alternative selection
criteria using only observation per manager. The criteria were: 1) the first investigated fund by
manager; 2) the last investigated fund by manager; and 3) an average of the dependent and
independent variables by manager. For all three approaches, the results for both the determinants
of internal controls and their relationship to fees are consistent with the presented findings and
consequently not reported.
25

Representativeness
The advantage of using the HFDD reports is that they provide detailed and verified
information regarding fund operations, such as internal controls, fund and manager
characteristics, and investor fees. A potential issue with empirical results based on the data
provided in the reports is external validity to the broader hedge fund population. To investigate
external validity, we compare our sample hedge funds to a broader population of hedge funds
consisting of the funds on the Lipper TASS database, which the primary database used in
academic research on hedge funds (see Lo 2007 for a discussion of the database). It should be
noted that similar to our sample, Lipper TASS and other hedge fund databases do not comprise
the complete universe of hedge funds as these databases consist of information self-reported
from hedge funds that choose to be included in the databases. However, these datasets are an
order of magnitude greater in number of reported funds and the extent to which our sample is
differs from these datasets will assist in evaluating the implications of our findings to the broader
hedge fund population.
Table 6 compares sample funds that do (n = 232) and do not (n = 195) report
performance to Lipper TASS. It presents univariate tests for differences across fund age, fund
and manager location, use of leverage, investment style, management and performance fees, and
internal controls. Across all these variables the only significant difference is that older sample
funds have a significantly higher likelihood of reporting to Lipper TASS (p < 0.01), with the
mean number of days being 1.252 (742) for sample funds reporting (not reporting) to Lipper
TASS. An explanation for the difference across fund age is the potential for self-selection based
on performance for funds that choose to report to Lipper TASS. Specifically, if older surviving
funds generally have better performance, they have greater incentives to self-report to database
vendors for promotion and marketing purposes. It should be noted that this significant difference
26

is above any other potential self-selection bias arising from HFDD being appointed to perform
due diligence on a fund. Importantly, aside from the age difference, there are no obvious reasons
why our results would not be representative of the population of hedge funds. In addition, we
note that investors were considering an investment in the funds included in our sample.
Further controlling of investment style
While we control for fund investment style including typical holding period, number of
positions, and the use of long or short bias, we examined the extent that further control of
investment style influences our observed findings. Specifically, for our 232 sample observations
that report to TASS we include dummy variables for each fund’s investment style as classified
by TASS. These investment styles include: convertible arbitrage, dedicated short seller,
emerging markets, equity market neutral, event driven, fixed income arbitrage, global macro, and
long/short equity.24 All the findings for the determinants of internal controls and the
determinants of investor fees are robust to the inclusion of the TASS investment style dummies,
and are consequently not reported.
Offshore results
In the presented analyses we categorize the domicile of the hedge fund into on- and
offshore. We examine the robustness of our findings by replacing the fund domicile variables in
the reported analyses with indicator variables for each country with ten or more funds. Our
results are not altered by the inclusion of country dummies.
24 Evidence on hedge fund returns suggests very few distinct investment styles (Brown and Goetzmann 2003; Fung and Hsieh 1997). We include all available investment styles on Tass to specifically address concerns that differences in investment style is driving our study findings.
27

VI. CONCLUSION
We investigate the determinants and internal controls of hedge funds and their
association with the fees that funds charge investors. To achieve this, we utilize proprietary due
diligence reports commissioned by sophisticated investors. These reports are based on
interviews, analysis of contract terms and financial position, third party sources, and publicly
available filings. The multi-faceted nature of this data provides a substantial detail regarding
fund characteristics and operations, and internal controls and overcomes potential concerns of
other hedge fund datasets that are solely based on self-report, unverified information.
Consistent with our predictions, we find that managers of funds domiciled offshore adopt
stronger mechanisms to decrease the likelihood of fraud and financial misstatements, incorporate
stricter signature authority to transfer funds, use external pricing services, and use more
reputable outside service providers. We also observe levered funds and younger funds are more
likely to have stronger internal controls. Further, we find that funds that have a short bias
investment strategy are less likely to employ independent pricing sources. We suggest this is
driven by greater proprietary costs from others trading against the short positions of these funds.
In regard to outcomes from internal control weaknesses, we observe funds that have
restated performance charge lower management fees. Further, we find a positive association
between the quality of internal controls and the performance fees rewarded to managers,
consistent with investors protecting against potential financial misstatements by placing less
emphasis on the reported performance when internal controls are less likely to detect or prevent
managers from manipulating reported performance. Overall, this study contributes to our
understanding by investigating the demand and implications of internal control use in an
unregulated setting.
28

REFERENCES
Abbott, L. J., S. Parker, and G. F. Peters. 2004. Audit Committee Characteristics and
Restatements. Auditing: A Journal of Practice and Theory 23, 69–87. Allee, K. D., and T. L. Yohn. 2009. The demand for financial statements in an unregulated
environment: An examination of the production and use of financial statements by privately-held small businesses. The Accounting Review 84, forthcoming.
Altonji, J. G., T. E. Elder, C. R. Taber. 2005. Selection on observed and unobserved variables:
Assessing the effectiveness of Catholic schools. Journal of Political Economy 113, 151–184. American Bar Association (ABA). 2005. U.S. Regulation of Hedge Funds. Shartsis Friese LLP. Aragon, G. O. 2007. Share restrictions and asset pricing: Evidence from the hedge fund industry.
Journal of Financial Economics 83, 33–58. Aragon, G. O., and J. Qian. 2007. The role of high-water marks in hedge fund compensation.
Working paper, Arizona State University, Tucson, AZ. Ashbaugh-Skaife, H., D. W. Collins, and W. R. Kinney Jr. 2007. The discovery and reporting of
internal control deficiencies prior to SOX-mandated audits. Journal of Accounting and Economics 44, 166–192.
Ashbaugh-Skaife, H., D. W. Collins, W. R. Kinney Jr., and R. LaFond. 2007. The effect of SOX
internal control deficiencies on firm risk and cost of equity capital. Working paper, University of Wisconsin, Madison, WI.
Blackwell, D. W., T. R. Noland, and D. B. Winters. 1998. The value of auditor assurance:
Evidence from loan pricing. Journal of Accounting Research 36, 57–70. Brown, S. J., and W. N. Goetzmann. 2003. Hedge funds with style. Journal of Portfolio
Management 26, 101–112. Brown, S. J., W. N. Goetzmann, and R. G. Ibbotson. 1999. Offshore hedge fund: Survival and
performance, 1989–95. Journal of Business 72, 91–117. Brown, S. J., W. N. Goetzmann, B. Liang, and C. Schwarz. 2007. Mandatory disclosure and
operational risk: Evidence from hedge fund registration. Working paper, New York University, New York, NY.
Chan, N., M. Getmansky, S. M. Haas, and A. W. Lo. 2006. Do hedge funds increase systematic
risk? Economic Review of the Federal Reserve Board of Atlanta 91, 49–80. Chow, C. W. 1982. The demand for external auditing: Size, debt and ownership influences. The
Accounting Review 42, 272–291.
29

Dechow, P. M., A. P. Hutton, L. Meulbroek, R. G. Sloan. Short-sellers, fundamental analysis, and stock returns. Journal of Financial Economics 61, 77–106.
Djankov, S., R. La Porta, F. Lopez-de-Silanes, and A. Shleifer. 2008. The law and economics of
self dealing. Journal of Financial Economics 88, 430–465. Doyle, J., W. Ge, and S. McVay. 2007. Determinants of weaknesses in internal control over
financial reporting. Journal of Accounting and Economics 44, 193–223. Edwards, F. R., and M. O. Caglayan. 2001. Hedge Fund Performance and Manager Skill.
Journal of Futures Markets 21, 1003–1028. Fortin, S., and J. A. Pittman. 2007. The role of auditor choice in debt pricing in private firms.
Contemporary Accounting Research 24, 859–896. Fung, W. and D. A. Hsieh. 1997. Survivorship Bias and investment style in the returns of CTAs.
Journal of Portfolio Management 23, 30–41. Fung, W., and D. A. Hsieh. 1999. A primer on hedge funds. Journal of Empirical Finance 6,
309–331. Fung, W., D. A. Hsieh, N. Y. Naik, and T. Ramadorai. 2008. Hedge funds: Performance, risk,
and capital formation. Journal of Finance 63, 1777–1803. Ge, W., and S. McVay. 2005. The Disclosure of Material Weaknesses in Internal Control after
the Sarbanes-Oxley Act. Accounting Horizons 19, 137–158. Geczy, C. C., and J. Yan. 2006. Who Are the Beneficiaries When Insiders Trade? An
Examination of Piggybacking in the Brokerage Industry. Working paper, The Wharton School, University of Pennsylvania, PA.
Getmansky, M., A. Lo, and I. Makarov. 2004. An econometric model of serial correlation and
illiquidity in hedge fund returns. Journal of Financial Economics 74, 529–609. Goetzmann, W. N., J. E. Ingersoll. Jr., and S. A. Ross. 2003. High-water marks and hedge fund
management contracts. Journal of Finance 58, 1685–177. Hammersley, J. S., L. A. Myers, and C. Shakespeare. 2008. Market reactions to the disclosure of
internal control weaknesses and to the characteristics of those weaknesses under section 302 of the Sarbanes Oxley Act of 2002. Review of Accounting Studies 13, 141–165.
HedgeFund.net (HFN). 2008. Q1 2008 Hedge Fund Asset Flows & Trends Report. Hogan, C. E. 1997. Costs and benefits of audit quality in the IPO market: A self-selection
analysis. The Accounting Review 72, 67–86. Hong, H., and J. D. Kubik. 2003. Analyzing the analysts: Career concerns and biased earnings
forecasts. Journal of Finance 58, 313–351.
30

Ivashina, V., and Z. Sun. 2007. Institutional Stock Trading on Loan Market Information.
Working Paper, Harvard Business School, Cambridge, MA. Kim, J. B., B. Y. Song, and L. Zhang. 2008. Internal control effectiveness and bank loan pricing.
Working paper, Concordia University, Montreal, Canada. Kinney, W. 2000. Research opportunities in internal control quality and quality assurance.
Auditing: A Journal of Practice and Theory 19, 83–90. Krauth, B. 2007. Bounding a linear causal effect using relative correlation restrictions. Working
paper, Simon Fraser University, Vancouver, Canada. Kundro, C., and Feffer, S. 2003. Understanding and Mitigating Operational Risk in Hedge Fund
Investments. The Capital Markets Company Ltd. Liang, B. 2000. Hedge funds: the living and the dead. Journal of Financial and Quantitative
Analysis 35, 309–326. Liang, B., and H. Park. 2007. Share restrictions, liquidity premium, and offshore hedge funds.
Working paper, University of Massachusetts, Amherst, MA. Lhabitant, F.S. 2008. Handbook of Hedge Funds. West Sussex, England: Wiley Finance. Lo, A. 2007. Hedge Funds: An Analytic Perspective. Princeton, NJ: Princeton University Press. Lo, A. 2001. Risk management for hedge funds: Introduction and overview. Financial Analysts
Journal 57, 16–33. Managed Funds Association (MFA). 2005. MFA’s 2005 sound practices for hedge fund
managers. Washington, DC: MFA. Mansi, S. A., W. F. Maxwell, and D. P. Miller. 2004. Does auditor quality and tenure matter to
investors? Evidence from the bond market. Journal of Accounting Research 42, 755–793. McVea, H. 2008. Hedge fund asset valuations and the work of the international organization of
securities commissions (IOSCO). International and Comparative Law Quarterly 57, 1–24.
Oesterle, D. A. 2006. Regulating hedge funds. Working paper, The Ohio State University,
Columbus, OH. Ogneva, M., K. Raghunandan, and K. R. Subramanyam. 2007. Internal control weakness and
cost of equity: Evidence from SOX Section 404 disclosures. The Accounting Review 82, 1255–1297.
Panageas, S., and M. M. Westerfield. 2008. High-water marks: High risk appetites? Convex
compensation, long horizons, and portfolio choice. Journal of Finance, forthcoming.
31

PricewaterhouseCoopers (PWC). 2006. The regulation, taxation and distribution of hedge funds
in Europe: Changes and challenges. Rosenbaum, P. 2002. Observational Studies. New York: Springer. Securities and Exchange Commission (SEC). 2003. Implications of the growth of hedge funds.
Staff Report. Washington, DC: SEC. Smith, T. R. Jr. 2006a. Mutual funds under fire: a chronology of developments since January 1,
2003. Journal of Investment Compliance 7, 4–33 Smith, T. R. Jr. 2006b. Mutual funds under fire: reform initiatives. Journal of Investment
Compliance 7, 4–27. Stickel, S. E. 1992. Reputation and performance among security analysts. Journal of Finance 47,
1811–1836. Weber, J., M. Willenborg, and J. Zhang. 2008. Does Auditor Reputation Matter? The Case of
KPMG Germany and ComROAD AG. Journal of Accounting Research 46, 941–972.
32

FIGURE 1 Cumulative Distribution Functions of Management and Performance Fees
0
.2
.4
.6
.8
1
Cum
ulat
ive
Prob
abili
ty
0.000 0.010 0.020 0.030 0.040Management Fee
0
.2
.4
.6
.8
1
Cum
ulat
ive
Pro
babi
lity
0.000 0.100 0.200 0.300 0.400 0.500Performance Fee
33

TABLE 1 Descriptive Statistics of Hedge Funds
Panel A: Year and Domicile of Funds Year
Funds
Domicile
Funds
2003 110 Cayman Islands 251 2004 127 United States 70 2005 101 British Virgin Islands 50 2006 65 Bermuda 34 2007 24 Bahamas 5 Other 14 Total 427 427 Panel B: Descriptive Statistics for Funds
Variable
Mean
Std. Dev
Min
Q1
Median
Q3
Max
AUM ($ millions) 304.78 652.38 0.00 40.00 107.00 269.00 6300.00 Ln(AUM) 18.43 1.74 0.00 17.50 18.49 19.41 22.56 Age (Days) 1019.59 976.80 0.00 373.00 700.00 1339.00 4877.00 Ln(Age) 6.39 1.30 0.00 5.92 6.55 7.20 8.49 Management Fee (%) 1.52 0.48 0.00 1.00 1.50 2.00 3.50 Performance Fee (%) 19.34 4.42 0.00 20.00 20.00 20.00 50.00 Fund Offshore 0.84 Manager Offshore 0.36 Leverage 0.54 Short Bias 0.20 Long Bias 0.36 1000+ Positions 0.03 200–999 Positions 0.08 100–199 Positions 0.12 40–99 Positions 0.35 1–39 Positions 0.41 Years 0.32 Quarters 0.31 Months 0.15 Weeks 0.09 Days 0.13 Restatement 0.10 AUM is the assets under management for the fund. Age (Days) is the number days since the fund’s inception. Management Fee is the percentage of the fund’s assets under management that the manager receives annually for managing the fund. Performance Fee is the percentage of positive profits that the manager receives annually as compensation. Fund Offshore is an indicator variable coded as 1 if the fund is registered offshore, and 0 if the fund is located in the United States. Manager Offshore is an indicator variable coded as 1 if the manager is located offshore, and 0 if the manager is located in the United States. Leverage is an indicator variable coded as 1 if the fund uses leverage, and 0 otherwise. Short Bias is an indicator variable coded as 1 if the fund’s investment style is weighted
34

35
TABLE 1
Descriptive Statistics of Hedge Funds (cont.) toward short positions, and 0 otherwise. Long Bias is an indicator variable coded as 1 if the fund’s investment style is weighted toward long positions, and 0 otherwise. 1000+ Positions, 200–999 Positions, 100–199 Positions, 40–99 Positions, and 1–30 Positions are indicator variables for the average number of investment positions in the fund’s portfolio. Years, Quarters, Months, Weeks, and Days are indicator variables for the average holding period of an investment position. Restatement is an indicator variable coded as 1 if fund has restated the performance reported to its investors, and 0 otherwise.

36
TABLE 2 Descriptive Statistics of Internal Controls
Panel A: Internal Control Measures by Domicile
Variable
Index Weight
Overall
(%)
US (%)
Cayman
Islands (%)
British Virgin
Islands (%)
Bermuda (%)
Other
Offshore (%)
Signatures: One Internal Signature 0 23.5 49.3 20.9 12.2 17.7 5.3 Two Internal Signatures 1 24.6 27.5 22.5 38.8 20.6 10.5 One External Signature 2 24.2 7.3 24.5 26.5 35.3 52.6 Dual/Triple Entity Signatures 3 27.7 15.9 32.1 22.5 26.5 31.6 Who Prices Portfolio: Manager Only 0 16.2 37.1 11.2 12.0 20.6 5.3 Manager and Administrator 1 11.7 10.0 13.2 8.0 14.7 5.3 Administrator Only 2 62.9 48.6 65.2 76.0 50.0 84.2 Dual/Triple Entity Pricing 3 9.2 4.3 10.4 4.0 14.7 5.3 Least Objective Source of Prices: Manager 0 13.4 20.3 12.4 16.0 5.9 10.5 Model 1 12.7 18.8 12.0 6.0 14.7 15.8 Dealer Quote 2 33.2 17.4 36.0 38.0 35.3 42.1 OTC Quotes 3 5.9 2.9 5.6 8.0 8.8 0.0 Exchange Quotes 4 34.8 40.6 34.0 32.0 35.2 31.6 Who Sets NAV: Manager Involved 0 14.1 40.0 8.8 8.0 14.7 5.3 Manager Not Involved 1 85.9 60.0 91.2 92.0 85.3 94.7 Auditor: Not Ranked by Alpha Magazine 0 23.0 51.4 17.9 20.0 17.7 5.3 Ranked by Alpha Magazine 1 77.0 48.6 82.1 80.0 82.4 94.7 Administrator: Not Ranked by Alpha Magazine 0 68.4 91.4 59.0 70.0 79.4 78.9 Ranked by Alpha Magazine 1 31.6 8.6 41.0 30.0 20.6 21.1

37
TABLE 2 Descriptive Statistics of Internal Controls (cont.)
Panel B: Internal Control Indices
Mean
Std. Dev
Min
Q1
Median
Q3
Max
Signatures Index 1.56 1.13 0.00 1.00 2.00 3.00 3.00 Who Prices Index 1.65 0.86 0.00 1.00 2.00 2.00 3.00 Source of Prices Index 2.55 1.42 0.00 1.00 3.00 4.00 4.00 NAV Index 0.86 0.35 0.00 1.00 1.00 1.00 1.00 Auditor Index 0.77 0.42 0.00 1.00 1.00 1.00 1.00 Administrator Index 0.32 0.47 0.00 1.00 1.00 1.00 1.00 Internal Control Index 7.52 2.78 0.00 6.00 8.00 10.00 12.00 Signatures refer to the signatures required to transfer funds out of the bank or prime broker. Double/Triple Signature funds require two or three signatures one of which is internal and one external. External Signature funds require only external signatures. Double Internal funds require at least two internal signatures. Single Internal funds require only one internal signature. Who prices the portfolio identifies who values each of the assets under management. Dual/Triple Entity Pricing funds use at least one internal service and one external service to price the portfolio. External Pricing funds use only external services to price the portfolio. Collaborative Pricing funds use an external pricing service that collaborates with the manager. Internal Pricing funds price the portfolio in house. Least objective source of prices provides the sources used to price individual investment positions in the portfolio. Who sets the NAV identifies whether the manager has involvement in the reporting of the net asset value to fund investors. Ranked Auditors and Ranked Administrators are ranked according to Institutional Investor’s Alpha ranking of hedge fund service providers. The index values in Panel B are based on the values from Panel A. Internal Control Index is the sum of the six presented indexes.

TABLE 3 Correlations Matrix a
1 2 3 4 5 6 7 8 9 10 11 12 13
1. Signa tures 2. Pricing 0.37 3. Source of prices 0.09 0.24 4. NAV 0.19 0.54 0.14 5. Auditor 0.22 0.13 0.10 0.13 6. Administrator 0.07 0.15 0.09 0.18 0.16 7. Internal control 0.64 0.72 0.68 0.50 0.35 0.34 8. Ln(Age) -0.02 -0.04 -0.13 -0.07 0.05 -0.04 -0.12 9. Off. Mgr. & Fund 0.17 0.19 0.08 0.21 0.15 0.21 0.25 0.01 10. Fund offshore 0.03 -0.01 -0.04 0.05 0.07 -0.03 -0.01 -0.07 -0.71 11. Leverage 0.12 0.13 0.12 0.03 0.13 0.16 0.17 0.00 0.08 -0.02 12. Short bias 0.02 -0.05 -0.06 -0.07 -0.03 -0.11 -0.09 0.00 -0.04 0.03 0.01 13. Long bias 0.02 0.01 -0.11 0.06 -0.02 0.16 -0.02 0.05 0.05 0.00 0.18 -0.22 14. Ln(AUM) 0.12 0.04 -0.17 0.02 0.17 0.16 0.02 0.49 0.09 0.04 0.11 -0.03 0.17 15. Years -0.05 -0.04 -0.33 -0.06 -0.09 -0.06 -0.24 0.07 -0.07 -0.01 -0.18 0.05 0.03 16. Quarters -0.06 0.00 0.12 0.10 0.11 0.01 0.06 -0.02 0.04 0.05 0.05 -0.05 -0.03 17. Months 0.05 -0.04 0.12 -0.02 0.03 0.01 0.09 -0.01 -0.03 0.02 0.00 0.01 0.01 18. Weeks 0.08 0.10 0.06 -0.02 -0.01 0.06 0.09 0.03 0.01 -0.05 0.08 0.06 -0.07 19. Days 0.04 0.01 0.10 -0.02 -0.05 0.00 0.06 -0.08 0.07 -0.03 0.11 -0.05 0.05 20. 1000+ positions -0.06 -0.11 -0.09 0.00 -0.06 0.04 -0.10 0.03 -0.05 0.05 0.12 -0.06 0.14 21. 200-999 positions 0.08 0.00 0.05 -0.03 0.03 0.01 0.05 0.05 -0.05 0.08 0.12 -0.01 0.15 22. 100-199 positions 0.00 0.05 0.04 0.03 0.07 0.10 0.06 0.10 -0.02 0.11 0.07 0.03 -0.05 23. 40-99 positions 0.01 0.04 0.08 -0.03 0.04 0.02 0.05 0.03 0.00 -0.09 -0.01 -0.02 -0.07 24. 1-39 positions -0.03 -0.03 -0.10 0.03 -0.08 -0.10 -0.09 -0.13 0.06 -0.04 -0.15 0.03 -0.03 25. Management fee 0.05 0.15 0.12 0.13 0.09 0.04 0.16 -0.05 0.17 -0.04 0.09 -0.04 0.06 26. Performance fee 0.07 0.06 0.36 0.04 0.08 0.07 0.23 0.02 0.01 0.10 0.13 0.01 -0.04 27. Restatement -0.02 -0.02 0.05 0.00 0.04 -0.06 -0.01 0.04 -0.01 0.06 -0.04 -0.01 -0.06
38
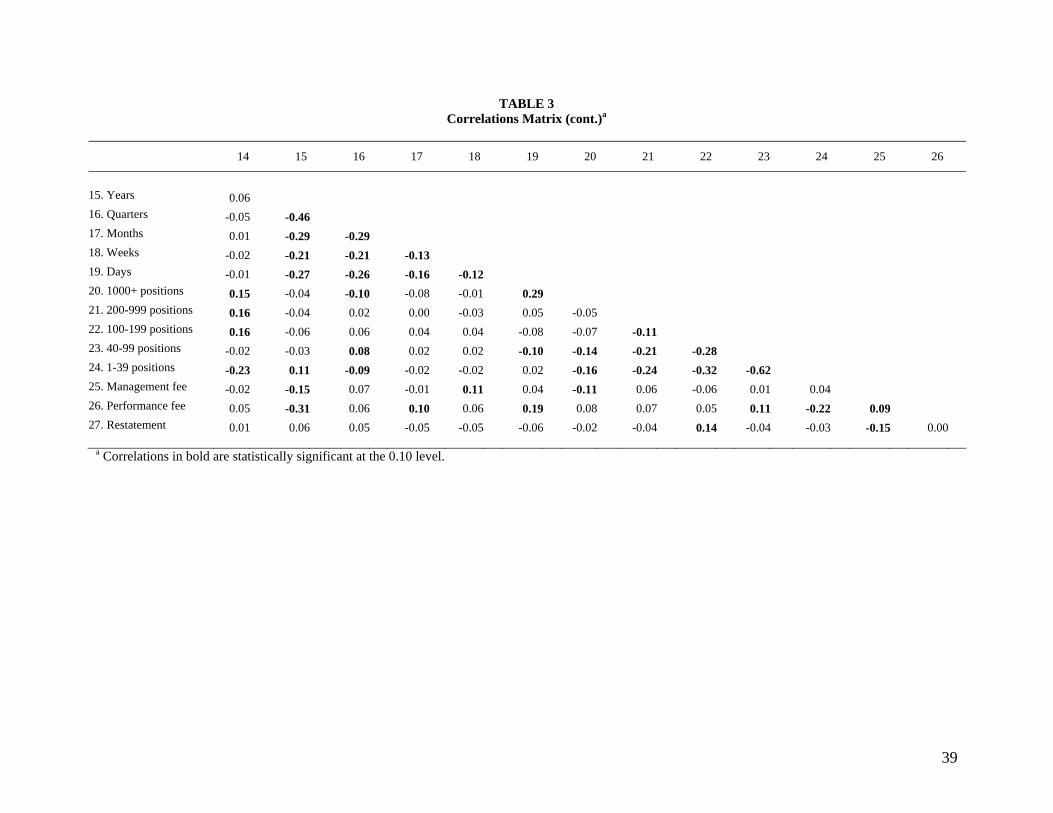
TABLE 3 Correlations Matrix (cont.)a
14 15 16 17 18 19 20 21 22 23 24 25 26
15. Years 0.06 16. Quarters -0.05 -0.46 17. Months 0.01 -0.29 -0.29 18. Weeks -0.02 -0.21 -0.21 -0.13 19. Days -0.01 -0.27 -0.26 -0.16 -0.12 20. 1000+ positions 0.15 -0.04 -0.10 -0.08 -0.01 0.29 21. 200-999 positions 0.16 -0.04 0.02 0.00 -0.03 0.05 -0.05 22. 100-199 positions 0.16 -0.06 0.06 0.04 0.04 -0.08 -0.07 -0.11 23. 40-99 positions -0.02 -0.03 0.08 0.02 0.02 -0.10 -0.14 -0.21 -0.28 24. 1-39 positions -0.23 0.11 -0.09 -0.02 -0.02 0.02 -0.16 -0.24 -0.32 -0.62 25. Management fee -0.02 -0.15 0.07 -0.01 0.11 0.04 -0.11 0.06 -0.06 0.01 0.04 26. Performance fee 0.05 -0.31 0.06 0.10 0.06 0.19 0.08 0.07 0.05 0.11 -0.22 0.09 27. Restatement 0.01 0.06 0.05 -0.05 -0.05 -0.06 -0.02 -0.04 0.14 -0.04 -0.03 -0.15 0.00
a Correlations in bold are statistically significant at the 0.10 level.
39

TABLE 4 Determinants of Internal Controlsa
Panel A: Determinants of Signatures Required to Transfer Funds Out of Bank or Prime Broker (n=403)
Single Internal
(Probit)
Double Internal
(Probit)
Single External
(Probit)
Dual / Triple
(Probit)
Signature Index (Ordered Probit)
Independent variables
Coefficient
Std. error
Coefficient
Std. error
Coefficient
Std. error
Coefficient
Std. error
Coefficient
Std. error
Ln (Fund Age) 0.059 0.067 0.021 0.068 -0.010 0.081 -0.066 0.064 -0.061 0.051 Off. Mgr. & Fund -1.122*** 0.239 -0.239 0.241 1.500*** 0.277 0.163 0.240 0.776*** 0.200 Fund offshore only -0.600*** 0.224 -0.259 0.223 0.711*** 0.268 0.597*** 0.228 0.721*** 0.205 Leverage -0.215 0.156 0.003 0.159 0.080 0.172 0.143 0.159 0.173 0.125 Short bias 0.219 0.196 0.024 0.196 -0.475** 0.207 0.154 0.182 -0.036 0.163 Long bias 0.089 0.172 0.157 0.164 -0.405** 0.204 0.103 0.162 -0.042 0.130 Ln (AUM Fund) -0.119** 0.051 0.030 0.060 0.049 0.054 0.056 0.053 0.084* 0.046 Years 0.028 0.246 0.178 0.242 0.598** 0.278 -0.588** 0.231 -0.294 0.212 Quarters 0.159 0.244 0.132 0.232 0.441 0.276 -0.552** 0.236 -0.348 0.214 Weeks -0.334 0.329 -0.351 0.330 0.843** 0.373 -0.100 0.303 0.178 0.266 Days -0.121 0.317 0.077 0.295 0.547 0.340 -0.409 0.285 -0.116 0.239 1000+ positions -0.001 0.497 1.249*** 0.452 -1.407** 0.586 -0.632 0.475 -0.606** 0.285 200-999 positions -0.142 0.295 -0.022 0.271 0.033 0.299 0.046 0.252 0.072 0.197 100-199 positions 0.077 0.246 0.436* 0.236 -0.282 0.242 -0.208 0.244 -0.229 0.186 1-39 positions 0.081 0.175 0.113 0.179 -0.157 0.178 0.023 0.160 -0.054 0.135 Intercept 1.741** 0.782 -1.020 0.957 -3.029*** 0.977 -1.598* 0.820 Year fixed effects Yes Yes Yes Yes Yes
Pseudo R2 0.128 0.088 0.210 0.071 0.051 Log-Likelihood -192.937*** -200.654** -179.301*** -220.259 -529.657*** a Individual intercepts not reported on ordered probit. Independent variables defined in Table 1. Dependent variables defined in Table 2. Standard errors for all regressions are clustered at the manager level. * denotes significance at p = 0.10, ** denotes significance at p = 0.05, *** denotes significance at p = 0.01 (based on a two-tailed test).
40

TABLE 4 Determinants of Internal Controls (cont.)a
Panel B: Determinants of Who Prices the Portfolio (n=406)
Manager Only
(Probit)
Manager and Administrator
(Probit)
Administrator Only
(Probit)
Dual / Triple Entity
(Probit)
Pricing Index
(Ordered Probit)
Independent variables
Coefficient
Std. error
Coefficient
Std. error
Coefficient
Std. error
Coefficient
Std. error
Coefficient
Std. error
Ln (Fund Age) 0.105 0.082 0.034 0.080 -0.071 0.065 0.031 0.095 -0.054 0.051 Off. Mgr. & Fund -1.261*** 0.264 -0.003 0.278 0.861*** 0.225 -0.072 0.404 0.678*** 0.211 Fund offshore only -0.706*** 0.238 0.132 0.267 0.461** 0.214 0.047 0.367 0.508** 0.207 Leverage -0.305* 0.170 -0.027 0.177 -0.069 0.151 0.698*** 0.223 0.346*** 0.126 Short bias 0.493** 0.208 0.168 0.198 -0.550*** 0.178 0.422 0.271 -0.168 0.175 Long bias 0.046 0.182 0.035 0.188 0.059 0.168 -0.260 0.233 -0.101 0.125 Ln (AUM Fund) 0.003 0.063 -0.022 0.076 -0.038 0.062 0.120 0.094 0.039 0.048 Years 0.060 0.261 -0.296 0.273 0.150 0.213 0.054 0.337 0.090 0.203 Quarters 0.168 0.267 -0.113 0.243 -0.082 0.197 0.171 0.350 0.035 0.213 Weeks -0.480 0.384 -0.506 0.409 0.342 0.295 0.372 0.467 0.552* 0.317 Days -0.196 0.372 -0.212 0.353 0.084 0.278 0.250 0.429 0.199 0.261 1000+ positions 0.817 0.539 0.861** 0.437 -0.713 0.441 N/A N/A -0.995*** 0.343 200-999 positions 0.088 0.309 -0.167 0.345 0.281 0.259 -0.769** 0.351 -0.237 0.222 100-199 positions -0.064 0.305 0.199 0.254 0.017 0.220 -0.205 0.318 -0.114 0.190 1-39 positions 0.323 0.204 0.047 0.206 -0.313* 0.160 0.211 0.220 -0.111 0.141 Intercept -0.785 1.062 -0.860 1.249 0.896 1.048 -4.481*** 1.585 Year fixed effects Yes Yes Yes Yes Yes
Pseudo R2 0.176 0.052 0.111 0.202 0.064 Log-Likelihood -147.160*** -139.920 -237.264*** -95.981*** -398.853*** a Individual intercepts not reported on ordered probit. Independent variables defined in Table 1. Dependent variables defined in Table 2. Standard errors for all regressions are clustered at the manager level. * denotes significance at p = 0.10, ** denotes significance at p = 0.05, *** denotes significance at p = 0.01 (based on a two-tailed test). N/A represented missing variable due to the model being perfectly identified with its inclusion.
41

42
TABLE 4 Determinants of Internal Controls (cont.)a
Panel C: Determinants of Sources for Pricing the Portfolio (n=405)
Manager (Probit)
Model (Probit)
Dealer (Probit)
OTC
(Probit)
Exchange (Probit)
Source Index
(Ordered Probit)
Independent variables
Coefficient
Std. error
Coefficient
Std. error
Coefficient
Std. error
Coefficient
Std. error
Coefficient
Std. error
Coefficient
Std. error
Ln (Fund Age) 0.099 0.099 -0.081 0.074 0.086 0.066 0.010 0.072 -0.098 0.070 -0.052 0.055
Off. Mgr. & Fund -0.764*** 0.289 -0.571** 0.283 0.376 0.237 0.178 0.293 0.501** 0.226 0.366* 0.201
Fund offshore only -0.533* 0.293 -0.587** 0.256 0.704*** 0.223 0.331 0.287 0.339 0.213 0.087 0.189
Leverage -0.483** 0.209 -0.294 0.180 0.393*** 0.152 0.254 0.186 -0.189 0.161 0.121 0.127
Short bias 0.472** 0.239 0.141 0.190 0.489*** 0.189 -0.204 0.226 -0.714*** 0.203 -0.374** 0.152
Long bias 0.485** 0.229 -0.218 0.199 0.557*** 0.158 0.049 0.177 0.113 0.174 -0.317** 0.133
Ln (AUM Fund) 0.182** 0.083 0.139* 0.073 0.078 0.075 0.072 0.084 0.006 0.055 -0.119* 0.071
Years 1.534*** 0.382 0.227 0.240 0.210 0.234 -0.672** 0.297 -1.086*** 0.259 -0.857*** 0.175
Quarters 0.636 0.405 -0.098 0.267 0.253 0.234 -0.035 0.276 -0.535* 0.273 -0.221 0.171
Weeks 0.086 0.516 -0.335 0.362 0.276 0.362 0.221 0.359 0.123 0.371 -0.188 0.219
Days 0.521 0.543 -0.615 0.431 0.121 0.303 -0.118 0.369 0.600 0.392 0.196 0.242
1000+ positions 1.211** 0.528 1.225** 0.512 0.226 0.368 0.123 0.502 0.085 0.501 -0.730** 0.372
200-999 positions -0.272 0.572 0.380 0.310 -0.278 0.271 -0.300 0.283 -0.134 0.298 0.249 0.206
100-199 positions 0.459 0.358 0.161 0.267 -0.224 0.214 -0.407 0.260 0.624** 0.297 0.103 0.188
1-39 positions 0.716*** 0.235 0.103 0.226 -0.308* 0.160 -0.146 0.184 -0.652*** 0.185 -0.237* 0.138
Intercept -7.482*** 1.734 -2.834** 1.152 -2.776** 1.275 -2.234 1.404 1.585* 0.874
Year fixed effects Yes Yes Yes Yes Yes Yes
Pseudo R2 0.359 0.126 0.166 0.152 0.232 0.088 Log-Likelihood -103.054*** -142.302*** -226.988*** -149.837*** -184.140*** -514.151*** a Individual intercepts not reported on ordered probit. Independent variables defined in Table 1. Standard errors for all regressions are clustered at the manager level. Dependent variables defined in Table 2. * denotes significance at p = 0.10, ** denotes significance at p = 0.05, *** denotes significance at p = 0.01 (based on

TABLE 4 Determinants of Internal Controls (cont.)a
Panel D: Determinants of NAV Independence and Service Providers (Probit)
NAV Independence
Ranked Auditor
Ranked Administrator
Independent variables
Coefficient
Std. error
Coefficient
Std. error
Coefficient
Std. error
Ln(Age Fund) -0.034 0.079 0.016 0.068 -0.137** 0.069 Off. Mgr. & Fund 1.452*** 0.282 1.021*** 0.237 1.270*** 0.298 Fund Offshore Only 0.958*** 0.246 0.845*** 0.226 0.924*** 0.299 Leverage -0.054 0.183 0.376** 0.162 0.234 0.161 Short Bias -0.295 0.221 -0.137 0.188 -0.447** 0.199 Long Bias 0.142 0.197 -0.219 0.172 0.347** 0.163 Ln(AUM Fund) -0.037 0.069 0.109* 0.057 0.123** 0.059 Years -0.109 0.251 -0.130 0.234 -0.017 0.232 Quarters 0.235 0.267 0.120 0.251 -0.089 0.229 Weeks 0.033 0.359 -0.165 0.304 0.244 0.288 Days -0.132 0.334 -0.313 0.296 -0.077 0.305 1000+ Positions -0.100 0.569 -0.665 0.446 0.106 0.426 200–999 Positions -0.222 0.272 -0.102 0.301 -0.288 0.276 100–199 Positions -0.062 0.299 -0.063 0.267 0.228 0.222 1–39 Positions 0.002 0.212 -0.132 0.175 -0.242 0.165 Intercept 0.855 1.148 -1.959** 0.913 -2.980*** 0.912 Year Fixed Effects Yes Yes Yes
Pseudo R2 0.171 0.131 0.143 Log-Likelihood -135.054*** -191.070*** -219.868*** n 406 407 407 a Independent variables defined in Table 1. Standard errors for all regressions are clustered at the manager level. Dependent variables defined in Table 2. * denotes significance at p = 0.10, ** denotes significance at p = 0.05, *** denotes significance at p = 0.01 (based on a two-tailed test).
43

TABLE 4 Determinants of Internal Controls (cont.)a
Panel E: Determinants of Overall Internal Controls (Ordinary Least Squares)
Independent variables
Coefficient
Std. error
Ln(Age Fund) -0.229* 0.119 Off. Mgr. & Fund 2.727*** 0.469 Fund Offshore Only 1.973*** 0.468 Leverage 0.593** 0.283 Short Bias -0.992*** 0.379 Long Bias -0.406 0.306 Ln(AUM Fund) 0.036 0.115 Years -1.460*** 0.450 Quarters -0.606 0.446 Weeks 0.422 0.600 Days -0.043 0.528 1000+ Positions -2.259*** 0.861 200–999 Positions -0.053 0.441 100–199 Positions -0.189 0.407 1–39 Positions -0.547* 0.303 Intercept 6.817*** 1.903 Year Fixed Effects Yes
Adjusted R2 0.224 F-stat 5.792*** n 403 a Independent variables defined in Table 1. Standard errors for all regressions are clustered at the manager level. Dependent variables defined in Table 2. * denotes significance at p = 0.10, ** denotes significance at p = 0.05, *** denotes significance at p = 0.01 (based on a two-tailed test).
44

TABLE 5 Determinants of Hedge Fund Feesa
Panel A: Determinants of Management Fees (Ordinary Least Squares)
Controls Only
With Index
With Restatements
Independent variables
Coefficient
Std. error
Coefficient
Std. error
Coefficient
Std. error
Internal Control Index 0.005 0.011 Restatements -0.227** 0.091 Ln(Age Fund) -0.013 0.021 -0.013 0.021 -0.008 0.022 Off. Mgr. & Fund 0.208*** 0.075 0.188** 0.080 0.223*** 0.075 Fund Offshore Only 0.116 0.078 0.095 0.081 0.132* 0.078 Leverage 0.074 0.049 0.069 0.050 0.066 0.048 Short Bias -0.053 0.058 -0.046 0.060 -0.061 0.056 Long Bias 0.019 0.058 0.021 0.060 0.016 0.058 Ln(AUM Fund) -0.002 0.015 -0.002 0.015 -0.004 0.015 Years -0.087 0.063 -0.082 0.063 -0.070 0.062 Quarters 0.039 0.061 0.040 0.061 0.047 0.060 Weeks 0.205** 0.104 0.204* 0.104 0.204* 0.104 Days 0.088 0.099 0.083 0.100 0.087 0.098 1000+ Positions -0.398* 0.240 -0.378 0.236 -0.393 0.244 200–999 Positions 0.037 0.091 0.043 0.091 0.037 0.093 100–199 Positions -0.121* 0.065 -0.114* 0.066 -0.096 0.066 1–39 Positions 0.021 0.054 0.025 0.056 0.015 0.054 Intercept 1.387*** 0.231 1.364*** 0.250 1.408*** 0.240 Year Fixed Effects Yes Yes Yes
Adjusted R2 0.070 0.066 0.086 F-stat 3.275*** 3.062*** 3.934*** n 406 402 404 a Variables defined in Table 1 and 2. Standard errors for all regressions are clustered at the manager level. Dependent variables defined in Table 2. * denotes significance at p = 0.10, ** denotes significance at p = 0.05, *** denotes significance at p = 0.01 (based on a two-tailed test).
45

TABLE 5 Determinants of Hedge Fund Fees (cont.)a
Panel B: Determinants of Performance Fees (Ordinary Least Squares)
Controls Only
With Index
With Restatements
Independent variables
Coefficient
Std. error
Coefficient
Std. error
Coefficient
Std. error
Internal Control Index 0.261** 0.102 Restatements -0.137 0.591 Ln(Age Fund) 0.135 0.236 0.193 0.236 0.142 0.243 Off. Mgr. & Fund 1.303 0.887 0.516 0.782 1.319 0.890 Fund Offshore Only 1.640* 0.849 1.008 0.776 1.649* 0.852 Leverage 0.452 0.416 0.273 0.420 0.435 0.415 Short Bias 0.013 0.427 0.347 0.447 -0.010 0.432 Long Bias -0.632 0.522 -0.473 0.528 -0.625 0.527 Ln(AUM Fund) -0.014 0.112 -0.028 0.114 -0.017 0.113 Years -2.698*** 0.609 -2.276*** 0.581 -2.688*** 0.614 Quarters -0.880* 0.450 -0.715 0.453 -0.890* 0.454 Weeks -0.095 0.485 -0.201 0.501 -0.091 0.487 Days 1.525* 0.892 1.557* 0.901 1.518* 0.903 1000+ Positions -0.279 2.455 0.324 2.426 -0.275 2.459 200–999 Positions -0.251 0.614 -0.230 0.631 -0.248 0.614 100–199 Positions -0.766* 0.443 -0.688 0.437 -0.747* 0.448 1–39 Positions -1.950*** 0.522 -1.782*** 0.498 -1.967*** 0.525 Intercept 19.633*** 1.967 18.064*** 2.136 19.672*** 2.073 Year Fixed Effects Yes Yes Yes
Adjusted R2 0.167 0.181 0.165 F-stat 2.288*** 2.144*** 2.170*** n 406 402 404 a Variables defined in Table 1 and 2. Standard errors for all regressions are clustered at the manager level. Dependent variables defined in Table 2. * denotes significance at p = 0.10, ** denotes significance at p = 0.05, *** denotes significance at p = 0.01 (based on a two-tailed test).
46

TABLE 6 Mean Hedge Fund Characteristics by TASS Reporting
Variable
Non-TASS reporting (n=195)
TASS reporting
(n=232)
p-value
Ln(Age Fund) 6.02 6.71 0.00 Off. Mgr. & Fund 0.37 0.35 0.67 Fund Offshore Only 0.49 0.46 0.49 Leverage 0.54 0.54 0.99 Short Bias 0.17 0.22 0.23 Long Bias 0.38 0.34 0.46 Ln(AUM) 18.27 18.56 0.08 Management Fee (%) 1.51 1.53 0.65 Performance Fee (%) 19.45 19.25 0.65 Signatures Index 1.59 1.53 0.59 Who Prices Index 1.68 1.63 0.56 Source of Prices Index 2.49 2.25 0.09 NAV 0.88 0.84 0.34 Auditor 0.75 0.78 0.45 Administrator 0.34 0.29 0.26 Internal Control Index 7.73 7.34 0.16
a TASS reporting represents those funds that reported their fund returns to Lipper TASS. Remaining variables defined in Table 1 and 2. P-values based on two-tailed tests.
47