Embed Size (px)
Citation preview
RESEARCH Open Access
Determinants of food insecurity in the ruralfarm households in South Wollo Zone ofEthiopia: the case of the Teleyayen sub-watershedAlem-meta Assefa Agidew1* and K. N. Singh2
* Correspondence: [email protected] of Geography andEnvironmental Studies, WolloUniversity, P.O. Box 1145, Dessie,EthiopiaFull list of author information isavailable at the end of the article
Abstract
This study evaluated determinants of food insecurity in the rural farm households of theTeleyayen sub-watershed in Ethiopia. The study used a multistage sampling procedure toselect 215 sample households involving a combination of purposive and randomsampling. Data were collected using structured survey questionnaire, focus groupdiscussion (FGD), and key informant interviews. Independent sample t test, chi-square,percentage, mean, and standard deviation were employed to analyze the data. It wasfound that 20.9 and 79.1% of the sample households are food secure and food insecure,respectively. The majority of the food insecure households were younger householdheads, who own less than 1 ha of farmlands. On average, male-headed households weremore food secure than female-headed households. The result of the binary logisticregression revealed that shortage of farmland, poverty, recurrent drought and climatechange, shortage of rainfall, and land degradation are determining factors for such foodinsecurity. However, the gender of household head, policy support, land redistribution,farmland topography, soil fertility, and erosion do not show any significant influence.
Keywords: Food insecurity, Binary logistic regression, Rural household, Ethiopia
BackgroundEthiopia is one of the poorest countries in the world, and about 90% of the populations live
in the rural areas. In this layer, more than half suffer from food insecurity (Barnett 2001).
Similarly, Doocy et al. (2005) indicated that poverty and food insecurity are endemic and
are exacerbated by the frequent droughts that plague the region, wars, and lack of public
policy. In response to the threat of declining crop yield and food security, farmers react in a
number of ways and adopt several land management technologies (Gafsi and Brossier
1997). Normally, they concentrate their conservation efforts on soils which are susceptible
to high rates of erosion (Ervin and Ervin 1982; Paudel 2001). According to Feleke et al.
(2005), seven factors affect household food security in Ethiopia. These are the technology
used, farming systems, farm size, soil quality, family size, aggregated per capita production,
and access to markets. A study conducted by Holden et al. (2005) also revealed that soil
degradation is extensive, reducing the average agricultural production and increasing the
farmers’ vulnerability to drought.
Agricultural and FoodEconomics
© The Author(s). 2018 Open Access This article is distributed under the terms of the Creative Commons Attribution 4.0 InternationalLicense (http://creativecommons.org/licenses/by/4.0/), which permits unrestricted use, distribution, and reproduction in any medium,provided you give appropriate credit to the original author(s) and the source, provide a link to the Creative Commons license, andindicate if changes were made.
Agidew and Singh Agricultural and Food Economics (2018) 6:10 https://doi.org/10.1186/s40100-018-0106-4

Rural food insecurity is one of the defining features of rural poverty, particularly in
the moisture-deficit northeast highland plateaus and some pastoral areas of Ethiopia
(MOFED 2002). The study area, the Teleyayen sub-watershed, is among these areas,
which is mostly affected by food insecurity, land degradation in the form of soil erosion
and nutrient depletion. Moreover, the area is prone to low and erratic rainfall and
frequent droughts. Most cultivated lands in the sub-watershed are suffering from loss
of topsoil leaving bare stones behind. Such a loss is linked with reduced crop and
livestock productivity and forces farmers to move to native and intact ecosystems of
the landscape and marginal lands to develop new farmlands. Thus, to establish the full
picture of food security, land degradation, and economic benefits of sustainable land
management, a greater understanding of food insecurity drivers and impacts at the
sub-watershed level is needed.
Most of the studies that have been done so far on the issues of food security in
Ethiopia are very general and consider the problem from national, regional, and district
points of view. While aggregate data are generally available at the national level, little
work has been done to understand the food security problems at the household level in
specific sub-watershed. Having national food balance data is not sufficient to under-
stand determinants of food insecurity in rural farm households in the country. Most
agricultural production comes from millions of rural households. Despite the increasing
global concern of improving food security, the nature and extent of food security at the
household level in rural areas are not well documented. The main objective of this
study was, therefore, to examine the determinants of food insecurity in the rural farm
households in Ethiopia using the Teleyayen sub-watershed as a case study. The specific
objectives were to investigate the food security status of the rural households and to
assess the extent and magnitude of rural farm household’s food insecurity in the study
area. To the best of my knowledge, there are no studies done on assessing such determin-
ing factors in this particular sub-watershed. Therefore, this study was conducted in order
to fill this gap by sharing robust empirical evidence on determinants of food insecurity
and household food security status in the Teleyayen sub-watershed. The result of this
study is intended to be useful for policy-makers, land use planners, and development
practitioners in Ethiopia in general and in the study area in particular, who are seeking to
understand how best to respond to the problems of food insecurity by identifying their
major determinants. As a result, the findings will allow them to redesign better land use
and land management practices that could motivate farmers to produce more food crops
to improve their food supply. Moreover, farmers will be able to gain adequate knowledge
on understanding the best ways of alleviating the problems of food security.
Food security and food insecurity situations of Ethiopia
The concept of food security has been defined on numerous occasions by the inter-
national community, and it has evolved considerably over time. The consensus that has
emerged from the global debate is that: “Food security, at the individual, household, na-
tional, regional, and global levels is achieved when all people, at all times, have physical
and economic access to sufficient, safe, and nutritious food to meet their dietary needs
and food preferences for an active and healthy life” (FAO 1996). In contrast, food inse-
curity exists when all people at all times have no physical and economic access to
Agidew and Singh Agricultural and Food Economics (2018) 6:10 Page 2 of 23

sufficient or adequate, safe, and nutritious food to meet their dietary needs and food pref-
erences for an active and healthy life (Phillips and Taylor 1990). Food security is a concept
that encompasses four main dimensions, namely availability in sufficient quantity of food
of an appropriate nature and quality in all parts of the national territory, irrespective of its
origin (local production, imports, or food aid), access by all people to the resources
required to be able to acquire the food needed by them for an nutritionally adequate diet.
These resources include not only financial resources but also rights of access to the
resources required to produce food or to receive it from others; stability of access to food,
i.e., the assurance of access by people to food even in the face of natural or economic
shocks; and a satisfactory utilization of food by people that is not inhibited by health or
hygiene problems (safe drinking water, sanitation or medical services, etc.).
Drivers of food insecurity
Discussions about causes of food insecurity in Ethiopia have always been complex
(Webb et al. 1992; Markos 1997) given that multiple factors affect food security. How-
ever, drought risk remains one of the key drivers of food insecurity in Ethiopia. Since
1950, 12 major drought-induced food security crises have occurred, highlighting the
sensitivity of food security to climate-related risks. According to Woldeamlak (2009),
once every 3 or 4 years is a drought year in Ethiopia. Environmental degradation is also
a critical factor which exacerbates soil loss, deforestation, and pest incidence—all of
which affect food security. In addition, rapid population growth, poverty, rural-urban
migration, and conflict can contribute to food insecurity.
MethodsGeographic location of the study area
This research was conducted in the Teleyayen sub-watershed, which is located in South
Wollo Zone, which is one of the 11 administrative zones of the Amhara National Regional
State of Ethiopia. The reasons for the selection of the site for this study include: the water-
shed is part of the northeastern highlands of Ethiopia, which is historically known to be
food insecure and highly threatened by severe resource degradation; as far as my reading
is concerned, no study has been carried out on the issues of food security in this particular
sub-watershed. This may be because of the ruggedness of the topography of the study
area. Thus, it needs intervention as soon as possible.
The study area is located in Kutaber and Ambasel woredas (districts). It lies partly in
Kutaber and partly in Ambasel districts. It covers a total area of 152 km2. Of this,
Kutaber district shares 125 km2 (82%) and Ambasel shares 27 km2 (18%).
Geographically, the sub-watershed is located between 11° 14′ 30″ N and 11° 29′ 30″ N
latitude and 39° 21′ 0″ E and 39° 33′ 0″ E longitude (Fig. 1) and is about 441 km north
of Addis Ababa (the capital city) and about 40 km northwest of Dessie Town, on the
Dessie-Kutaber-Delanta Road. It is characterized by diverse topographic conditions that
form part of the headstream of the Abay (Blue Nile) basin. Its elevation ranges from
1703 to 3406 m above sea level. The total population of the study area is about 20,296
distributed within eight rural 1kebeles, namely Doshign, Aba Selama, Asecha, Kundina
Jerjero, Amba-gebi, Manosh (in Kutaber district), Delba, and Teregma (in Ambasel
district). Its total population is der0ived from the total area and total population of the
Agidew and Singh Agricultural and Food Economics (2018) 6:10 Page 3 of 23
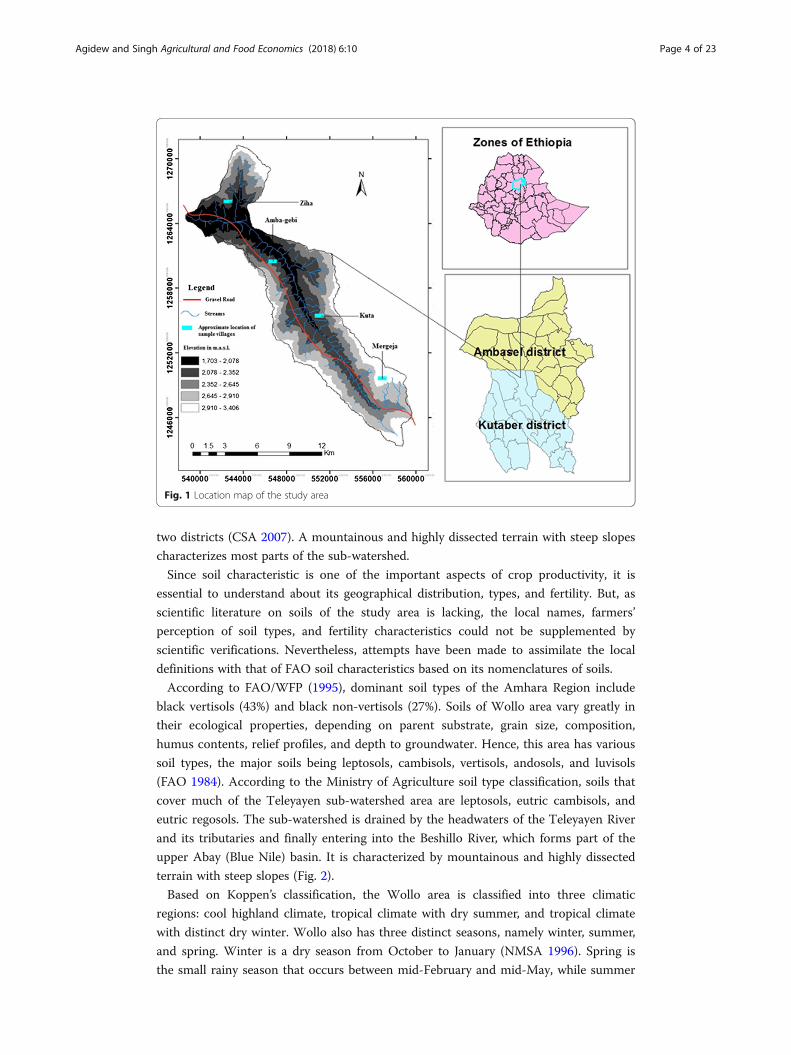
two districts (CSA 2007). A mountainous and highly dissected terrain with steep slopes
characterizes most parts of the sub-watershed.
Since soil characteristic is one of the important aspects of crop productivity, it is
essential to understand about its geographical distribution, types, and fertility. But, as
scientific literature on soils of the study area is lacking, the local names, farmers’
perception of soil types, and fertility characteristics could not be supplemented by
scientific verifications. Nevertheless, attempts have been made to assimilate the local
definitions with that of FAO soil characteristics based on its nomenclatures of soils.
According to FAO/WFP (1995), dominant soil types of the Amhara Region include
black vertisols (43%) and black non-vertisols (27%). Soils of Wollo area vary greatly in
their ecological properties, depending on parent substrate, grain size, composition,
humus contents, relief profiles, and depth to groundwater. Hence, this area has various
soil types, the major soils being leptosols, cambisols, vertisols, andosols, and luvisols
(FAO 1984). According to the Ministry of Agriculture soil type classification, soils that
cover much of the Teleyayen sub-watershed area are leptosols, eutric cambisols, and
eutric regosols. The sub-watershed is drained by the headwaters of the Teleyayen River
and its tributaries and finally entering into the Beshillo River, which forms part of the
upper Abay (Blue Nile) basin. It is characterized by mountainous and highly dissected
terrain with steep slopes (Fig. 2).
Based on Koppen’s classification, the Wollo area is classified into three climatic
regions: cool highland climate, tropical climate with dry summer, and tropical climate
with distinct dry winter. Wollo also has three distinct seasons, namely winter, summer,
and spring. Winter is a dry season from October to January (NMSA 1996). Spring is
the small rainy season that occurs between mid-February and mid-May, while summer
Fig. 1 Location map of the study area
Agidew and Singh Agricultural and Food Economics (2018) 6:10 Page 4 of 23

is the main rainy season that extends from mid-June to mid-September (NMSA 1996).
The mean annual temperature and mean annual rainfall of Wollo area range from 14
to 20 °C and from 680 to 1200 mm, respectively (Gonfa 1996). Based on the moisture
index, the climate of Wollo is classified as dry with arid to dry sub-humid conditions.
According to the climatic characteristics, the region is further subdivided into an east-
ern and western part. Eastern Wollo has a relatively dry climate with a moisture index
of minus 60 to 0, and most areas receive sufficient moisture during the rainy seasons
with some surplus water. In contrast, western Wollo has a moderate to a large amount
of water surplus in the rainy seasons, which results in a high runoff, soil erosion, and
waterlogging depending on the soil type and topography (Gonfa 1996).
The meteorological data used for this study was obtained from Kombolcha Meteoro-
logical Station, recorded for Dessie site. Hence, the mean annual temperature of the
Teleyayen sub-watershed is about 16 °C, and the average annual total rainfall is
1133 mm (taking into account the whole seasons of a year) (Fig. 3). More than 58% of
the total rain falls in 2 months of July and August (summer season), while 18% falls in
the spring season (March, April, and May), and less than 5% of the total occurs during
the dry months of December, January, and February (winter season). The uneven distri-
bution of the rainfall gives rise to a serious shortage of water during the dry season par-
ticularly in the lower parts of the sub-watershed.
Basically, the economy of rural households in Ethiopia depends on agriculture, be it
dominantly pastoral, arable, or mixed farming system. Like other parts of the Ethiopian
highlands, the major farming system of Wollo is mixed cereal-livestock (Haileslassie et
al. 2005). The farming system is diversified and determined by agro-ecology. Cereals
are the dominant crop accounting for over 73%, followed by pulses (24%), and the
Fig. 2 Slope of the Teleyayen sub-watershed
Agidew and Singh Agricultural and Food Economics (2018) 6:10 Page 5 of 23

remaining 3% is oilseed (ANRS-BFED 2008). Among the cereal crops, tef (Eragrostis
tef ), sorghum (Sorghum spp.), wheat (Triticum vulgare), and barley (Hordeum vulgaris)
are dominant, accounting for 25, 18, 16, and 11% of the total, respectively (ANRS-
BFED 2008).
Likewise, rural households in the Teleyayen sub-watershed carry out mixed agricul-
ture where crop production and livestock rearing are simultaneously practiced. Land
and livestock are therefore the most important assets of the people, with which they
lead a sedentary life. Livestock provides the draught power and household members,
the labor that is needed for farming operation. The land is a scarce resource due to
high population pressure and land degradation. Most of the agricultural produce is for
the farm household’s own consumption. The farming is carried out using rain-fed sys-
tems, but a small-scale irrigation project has begun recently in the sub-watershed.
A variety of crops is produced by every household because of the strong orientation
towards self-sufficiency. Crop production follows a bimodal rainfall regime (short
spring and longer summer rains) leading to two harvest periods, but the spring harvest
is by far the most important. This is because of the combination of rugged topography
and intense summer rains which permit cultivation on the areas with a gentle slope,
which covers only small areas. Major crops grown in the sub-watershed include tef
(Eragrostis tef ), wheat (Triticum vulgare), barley (Hordeum vulgaris), oats (Avena
sativa), horse beans (Vicia faba), peas (Pisum sativum), potato (Solanum tuberosum),
maize (Zea mays), sorghum (Sorghum spp.), pepper (Piper nigrum), and onion (Allium
cepa). Spring rains are used for growing wheat, barley, and pulses between January and
April. Also, some villages in the lowlands take advantage of spring rains to cultivate tef.
Spring rains are also important for farmers in the mid-highland for growing long ma-
turing varieties of tef, sorghum, and maize. Crop production is, therefore, the major
source of income to the households. Incomes from off-farm employment include petty
trading, charcoal and firewood selling, weaving, and pottery. The livestock types include
cattle, sheep, goats, pack animals, and poultry. The average landholding size per family
is 0.5 ha on which mixed crop and livestock farming are practiced (UNDP 1994).
Fig. 3 Min., max., and mean annual temperature and mean monthly rainfall of the study area
Agidew and Singh Agricultural and Food Economics (2018) 6:10 Page 6 of 23
Data collection and analysis
The study was conducted based on the data that were obtained through a farm house-
hold survey administered to 215 sample farm household heads drawn through multi-
stage sampling technique. The target populations for the study were farmers who
cultivate crops, vegetables, and fruits within the Teleyayen sub-watershed. A sampling
frame is a list that identifies the target population (Kothari 2004). The sampling frame
for this study was obtained from the selected sample kebele administration offices.
The data used for this study were derived from both primary and secondary sources.
Primary data were collected through household questionnaire, focus group discussions,
key informant interview, and personal field observations, while secondary data were
collected from relevant local authority reports, books, and journals. Questionnaire data,
which is gathered from respondents, was quantitatively analyzed, summarized, and pre-
sented in tables, graphs, and percentages.
The questions included in the survey questionnaire were both closed-ended and
open-ended types. The questionnaire was administered during January and February
2016. This period was chosen mainly because it is an ideal time when farmers have
completed their harvesting activities and start the natural resource development pro-
gram works at the watershed level, which is carried out yearly by organized government
support schedule. Hence, it is easy to interview the sample farm households and collect
the required data. Before full implementation, the questionnaire was pre-tested as a
pilot survey in the sample villages. The pilot tests of questions were made by distribut-
ing the questionnaire to four household heads in each sample kebele in order to know
whether the instruments are appropriate and suit to the intended study. Hence, neces-
sary adjustments were made based on the comments obtained from pre-test responses
from farmers to ensure reliability and validity of the questionnaire. Secondary data were
also collected from books, journals, and internet sources.
A modified form of a simple equation termed as Household Food Balance Model was
used to measure the sample households’ food security. It involves the measurement of
the average daily food available to each person in a sample household. After data
collection, the researcher has converted the households’ annual available food grain
supply into kilograms and then based on the conversion factors of major cereals con-
verted into kilocalories. The converted results were then divided by the household size
as adult equivalent and the number of days in the recall period. Moreover, the data
were also analyzed using descriptive and inferential statistics Module of the Statistical
Package for Social Sciences (SPSS-IBM) software, version 21. Descriptive statistics were
used to show the effects of continuous and descriptive variables of the study on sample
household food security, while inferential statistics like binary logistic regression was
used to know the association between dependent and independent variables upon
determinants of food insecurity in rural farm households.
Results and discussionHousehold’s food security measurement
While accurate measurement of household food security is essential for effective
research and well-targeted policies and programs, there is no standard methodology for
measuring food security, and despite an improved theoretical understanding of food
Agidew and Singh Agricultural and Food Economics (2018) 6:10 Page 7 of 23

security, the FAO notes that there exists no “perfect single measure that captures all
aspects of food insecurity” (FAO 2002). Instead, a household’s level of food insecurity
or hunger must be determined by obtaining information on a variety of specific condi-
tions, experiences, and behaviors that serve as indicators of the varying degrees of
severity of the condition. Household surveys, usually conducted in person or by tele-
phone, are used to get this information. Research over the past two decades has identified a
particular set of this kind of condition, experience, and behavior pattern that consistently
characterizes the phenomenon of food insecurity and hunger (Derrickson 2000).
According to Bouis (1993), two approaches have been commonly used in measuring
household food consumption. The first is expenditure technique that estimates gross
household’s production and purchases over the given time. Estimates of the increase or
reduction of food stocks held over time are made, and the balance is considered as con-
sumed by the household. The limitation of expenditure survey is that it tends to under-
estimate expenditures on food if the value of food produced at home or gathered
locally is not recorded or recalled. The second method uses a recall method to measure
the amount of food consumed by the household members during 24 h. This technique,
in relation to the expenditure method, gives more reliable household consumption in-
formation, but it is costly due to the considerable time required for collecting the data.
In this study, a modified form of a simple equation termed as Household Food
Balance Model, originally adapted by (Degefa 1996) from FAO Regional Food Balance
Model and thenceforth used by different researchers in this field (Eshetu 2000; Messay
2009), was used to calculate the per capita food available.
Household food balance model
NGA ¼ GPþ GBþ FAþ GGð Þ− HLþ GUþ GSþ GVð Þ
where NGA = net grain available/year/household, GP = total grain produced/year/
household, GB = total grain bought/year/household, FA = quantity of food aid
obtained/year/household, GG = total grain obtained through gift or remittance/year/
household, HL = post-harvest losses/year, GU = quantity of grain reserved for seed/
year/household, GS = amount of grain sold/year/household, and GV = grain given to
others within a year.
The single most important indicator of food adequacy level of a community is the per
capita dietary energy supply measured in kilocalorie. This is the measure of the average
daily food available to each person in a sample household. Consequently, after data collec-
tion from sample respondents, the researcher has converted the households’ annual avail-
able food grain supply into kilograms and then by using the conversion factors of major
cereals; they were changed into kilocalories. This was done after computing the balance
between grains gained and lost using the simple Household Food Balance Model indi-
cated above. The converted results were then divided by the number of household mem-
bers as adult equivalent and the number of days in the recall period.
Consequently, the results were compared with the minimum requirements per day
per adult equivalent unit (AEU). According to Kaluski et al. (2002), the minimum daily
recommended food energy intake of 2100 kcal per AEU was used as the cutoff level for
classifying households into food secure and food insecure. Hence, households whose
caloric consumption is greater than or equal to 2100 kcal/day/AEU were categorized as
Agidew and Singh Agricultural and Food Economics (2018) 6:10 Page 8 of 23

food secure. On the other hand, households whose caloric consumption is less than
2100 kcal/day/AEU were categorized as food insecure.
After categorizing households as food secure and insecure, the next step was to iden-
tify variables that have an association with food security at household level. The
dependent variable (household food security) is dichotomous in nature (food secure
and food insecure households); the binary logistic regression model was used as the
estimated probabilities that lie between the logical limit of 0 and 1 (Gujarati 1995).
Hence, food security statuses were expressed by a binary dependent variable (0 = food
insecure households and 1 = food secure households).
A household is food secure when it shows no or minimal evidence of food insecurity,
while it is food insecure when all households with children have reduced the children’s
food intake to an extent indicating that the children have experienced hunger. For
some other households with children, this already has occurred at an earlier stage of
severity. Adults in households with and without children have repeatedly experienced
more extensive reductions in food intake.
The amount of energy available per AEU per day
The food energy available for the households is compared with the minimum subsist-
ence requirement per AEU/day. Therefore, the percentages of food secure and food
insecure sample households were found to be 20.9 and 79.1%, respectively. Hence, the
survey results of the study showed that the mean value of the energy available for the
food secure and food insecure rural households was 2278 and 1350 kcal/AEU/day,
respectively. The minimum and maximum energy available for food secure households
were found to be 2100.9 and 2703.9 kcal, respectively. But the minimum and maximum
energy available for the food insecure households were found to be 916.2 and 2095.
9 kcal, respectively. On the other hand, the standard deviations of the food secure and
food insecure households were 159 and 259, respectively. The mean energy intake and
standard deviation of the total sample households were 1544.6 kcal and 448.8, corres-
pondingly. The independent t test value of the total sample households (22.87)
approved that there is a significant mean difference between food secure and food inse-
cure rural farm households at p < 0.1 (Table 1).
Statistical summary of continuous variables of the study
Independent Student’s t test was used to examine the group mean difference between
food secure and food insecure rural households. Consequently, the means of food se-
cure and insecure households significantly differ only in three of the five continuous
variables included in the analysis of the study (Table 2). These variables are family size,
the age of the household heads, and household’s annual food requirement in kilograms.
The independent t test results of these variables were found to be statistically signifi-
cant at 5% level of confidence. The statistical analysis of the study showed that the
mean family size of food secure households (3.64) is significantly different from the
mean family size of food insecure households (4.44). The mean age of food secure
household heads (40.51 years) is also significantly different from the mean age of food
insecure household heads (44.78 years). Moreover, the mean annual food requirements
of food secure households (843 kg) significantly differ from the mean annual food
requirements of food insecure households (734 kg), with a standard deviation of 325
and 235, respectively.
Agidew and Singh Agricultural and Food Economics (2018) 6:10 Page 9 of 23

Whereas, the independent t test results of livestock size and agricultural labor force
were not significant at 5% level of confidence. This shows that there is no significant
difference between the means of the food secure and food insecure rural households of
these variables. A study conducted by Bukusuba et al. (2007) in Uganda revealed that
large numbers of people in the household are normally seen as equivalent to family
labor, and therefore, a large household has the potential of obtaining sufficient labor
which is capable of producing more food and therefore becomes food secure. Nonethe-
less, their argument will only be true if there is no underemployment of the labor force
available.
As indicated in Table 3, 47.6% of sample household heads with 1 to 15 years of farm-
ing experience were found to be food insecure as opposed to the rest of the groups.
Generally, as the number of farming experience of household heads increases, their
probability of being food secure increases. This could be attributed to the fact that
because of farmland shortage and fragmentation of the available farmland in the sub-
watershed, younger household heads own extremely small farm size, which could not
allow them to produce the required amount of food crops thereby becomes food inse-
cure. This result agrees with the study conducted by Hofferth (2004). He indicated that
the higher the age of the household head, the more stable the economy of the farm
household because older people have also relatively richer experiences of the social and
physical environment as well as a greater experience of farming activities. Moreover,
older household heads are expected to have better access to land than the younger
heads because younger men either have to wait for land distribution or have to share
the land with their families.
Statistical summary of discrete variables of the study
The statistical analysis of this study showed that one out of seven discrete variables
included in the analysis found to be significant in explaining variations in food security
Table 1 Energy available per AEU per day among sample households
Energy available per AEU in kcal Food secure (n = 45) Food insecure (n = 170) Total sample (n = 215)
Minimum 2100.9 916.2 916.2
Maximum 2703.9 2095.9 2703.9
Mean 2278 1350 1544.6
Standard deviation 159 259 448.8
t value – – 22.87
Table 2 Descriptive statistics of continuous variables
Variable Food secure(n = 45)
Food insecure(n = 170)
Total sample(n = 215)
t value
Mean SD Mean SD Mean SD
Family size (AEU) 3.64 1.19 4.44 1.28 4.27 1.30 − 3.749*
Age of the household head (years) 40.51 13.96 44.78 11.42 43.89 12.09 − 2.125*
Livestock size 3.28 1.30 3.38 1.68 3.33 1.49 − 0.351
Agricultural labor force (numbers) 2.24 1.02 2.17 0.93 2.18 0.95 0.461
Household’s annual food requirements (kg) 843.48 325.23 733.96 235.18 788.72 280.20 2.55*
Source: authors’ survey result, 2016*Significant at 5%
Agidew and Singh Agricultural and Food Economics (2018) 6:10 Page 10 of 23

status between food secure and food insecure farm households (Table 4). This variable
is the educational status of the household head.
Educational status of the household head
The statistical analysis result revealed that 27.4 and 72.6% of the sample households
were found to be literate and illiterate, respectively. Among literate households, 44.4
and 22.9% were found to be food secure and food insecure, respectively, while 55.6 and
77.1% of the illiterate households were found to be food secure and food insecure,
respectively. The chi-square result of this discrete variable is statistically significant at
95% (Table 4). This means that there is a significant association between education and
food security status. This result indicates the significance of education for household
food security improvement because educated household heads are usually practiced
Table 3 Sample household head’s farming experience and their food security status
Years of farmexperience
Food secure (n = 45) Food insecure (n = 170) Total (n = 215)
Frequency Percent Frequency Percent Frequency Percent
1–15 24 53.3 81 47.6 105 48.8
16–30 15 33.3 64 37.7 79 36.8
31–45 4 8.9 22 12.9 26 12.1
> 45 2 4.5 3 1.8 5 2.3
Total 45 100 170 100 215 100
Table 4 Descriptive summary of discrete variables
Variable Food secure (n = 45) Food insecure (n = 170) Chi-square value Asymp. sig (2-sided)
Number Percent Number Percent
Education status of the HH head
Literate 20 44.4 39 22.9 8.26 0.004*
Illiterate 25 55.6 131 77.1
Gender of the HH head
Male 38 84.4 134 78.8 0.703 0.402
Female 7 15.6 36 21.2
Access to PSNP
Yes 10 22.2 37 21.8 0.004 0.947
No 35 77.8 133 78.2
Access to credit service
Yes 31 68.9 135 79.4 2.24 0.135
No 14 31.1 35 20.6
Rainfall reliability
Yes 2 4.4 8 4.7 0.005 0.941
No 43 95.6 162 95.3
Access to off-farm income
Yes 6 13.3 33 19.4 0.885 0.347
No 39 86.7 137 80.6
Government support
Yes 16 35.6 58 34.1 0.033 0.857
No 29 64.4 112 65.9
Source: authors’ survey result, 2016*Indicates significant level at 0.05
Agidew and Singh Agricultural and Food Economics (2018) 6:10 Page 11 of 23

family planning programs thereby limit their family size when compared with their
counterparts and become able to manage food demands of their households. Moreover,
they engage themselves and their family members in various non-farm income-
generating activities. For example, Urassa (2010) argues that households with more
education or other forms of human capital stand a better chance of engaging in non-
farm income or credit, and they, therefore, could be more able to afford inputs and
thereby becomes more efficient in their farming practices. Hence, farming households
with more education had the possibility of obtaining higher yields and become food
secure. The result of this variable is consistent with the study done by Koffio-Tessio et al.
(2005). They reported that in rural areas, education improves agricultural productivity,
leading to food security.
Gender of the household heads
A majority (80%) of the sample households were male-headed, while 20% were female-
headed. This indicates that there are more male-headed sample households than
female-headed households. The chi-square result of this variable indicates that 84.4 and
15.6% of male-headed and female-headed sample households, respectively, are food
secure, whereas 78.8 and 21.2% of male-headed and female-headed households,
respectively, are food insecure. In general, male-headed households are more food se-
cure (22.09%) than female-headed households (16.09%). However, the chi-square result
of this variable was found to be insignificant at 95% level of significance. Hence, there
is no correlation between gender of the household head and food security status of the
rural farm households. This may be because of the empowerment of rural women in
land ownership right and family planning issues because historically, they were marginalized
from agricultural investment and family planning activities despite the work they do. This
situation has been supported by the study done in India by FAO (2012). It reported that
despite rapid economic growth in India, thousands of women and girls still lack food and
nutrition security, largely because of deep-rooted gender inequalities in many areas. These
deep gender inequalities in food security exist even though women constitute the majority
of food producers in the world and are often managing their families’ nutritional needs.
Access to Productive Safety Net Program
In 2005, the government of Ethiopia launched the Food Security Program (FSP), with
the Productive Safety Net Program (PSNP) at its center. The PSNP provides transfers
(cash or food) to 6–8 million chronically food insecure Ethiopians for 6 months each
year, 85% of whom receive transfers as wages for labor on small-scale public works pro-
jects (which are selected by the community and contribute to environmental rehabilita-
tion and local economic development), while 15% are “direct support” beneficiaries
(disabled, elderly, pregnant, or lactating women) who receive unconditional transfers
(DFID 2014). This program is expected to enhance sustainable land management by
supporting farm households in constructing soil and water conservation practices and
increasing farmers’ investment capacities in sustainable land management and other
public works to ensure the long-term food security of the country.
The statistical analysis result revealed that 21.9 and 78.1% of the sample households
have access and have no access to PSNP, respectively. In this regard, 22.2 and 77.8% of the
food secure households have access to PSNP and have no access to PSNP, respectively.
While 21.8 and 78.2% of the food insecure households have access and have no access to
PSNP, respectively. The chi-square result of this variable is statistically insignificant at 95%
Agidew and Singh Agricultural and Food Economics (2018) 6:10 Page 12 of 23

level of significance. Therefore, there is no association between access to PSNP and food
security status of the rural farm households. This could be due to the negligence of the
program by the rural farm households because of the insufficient budget allocated for it.
This means that instead of participating in PSNP, farmers prefer to work as a daily laborer
by migrating to the nearby towns. As a result, PSNP may not help much to improve the
food security status of their households.
Access to credit services
This is the ability of households to obtain credit both in cash and kind for either
consumption or to support production from lending institutions. The survey result of
this study revealed that 77.2 and 22.8% of the sample households have and do not have
access to credit service, respectively. Among these households, 68.9 and 79.4% were
food secure and food insecure, respectively, whereas 31.1 and 20.6% of the households
did not have access to credit service and become food secure and food insecure,
respectively. The chi-square result of this variable is statistically insignificant at 95%
level of significance. Therefore, there is no association between access to credit service
and food security status of the rural households. This could be because of high-interest
rates and farmer’s inability to use the credit received for the intended purpose. This
result is in line with the report of IFPRI (2009a) that many smallholder farmers in
Nigeria are unable to access credit due to the issues of collateral and high-interest rates
as well as the short-term and fixed repayment periods for agricultural loans by lending
institutions. On the contrary, a study carried out by Pappoe (2011) found that access to
credit improves the food security status of farming households among biofuel
producers in the central region of Ghana.
Rainfall reliability
The statistical result of this variable showed that 4.7% of the sample households replied
as rainfall was reliable in the area for the last 10 years, whereas the remaining 95.3%
replied as it was not reliable. The chi-square result of this variable is statistically insig-
nificant at 95% level of significance. Therefore, there is no relation between rainfall
reliability and food security status of the rural farm households. This could be due to
the inability of farmer’s to predict the long-term negative effects of rainfall variability
on their food security status.
Access to off-farm income
Off-farm income includes non-agricultural wages, self-employed income, petty trading,
weaving, remittances, charcoal and firewood selling, and handicraft. The survey result
of this variable revealed that 18.1 and 81.9% of the sample households are with and
without access to off-farm income, respectively. Of these households, 13.3 and 19.4%
were food secure and food insecure, respectively. While 86.7 and 80.6% of the house-
holds do not have access to off-farm income and become food secure and food inse-
cure, respectively. The chi-square result of this variable is statistically insignificant at
95% level of significance. Therefore, there is no relationship between access to off-farm
income and food security status of the rural households. This could be attributed to
the fact that income generated through off-farm activities may not ease the liquidity
constraint needed for food security investments or purchase of food crops for bridging
the food deficiency of their households. The result of this study is in conformity with
the study conducted by Kilic et al. (2009), Goodwin and Mishra (2004), and Chang and
Wen (2011). Their findings showed that off-farm income impacted negatively on-farm
Agidew and Singh Agricultural and Food Economics (2018) 6:10 Page 13 of 23

efficiency in different settings. On the contrary, Frankenberger (1992) noted that
participation in off-farm activities enables households to modernize their production by
giving them an opportunity to apply the necessary inputs and reduces the risk of food
shortage during periods of unexpected crop failures through food purchases.
Government support
Government support includes agricultural extension services, technology transfer (such
as advice on food crop production, cash cropping, livestock production, and soil and
water conservation), irrigation and water harvesting schemes, the education of women
and children, provision of clean water and healthcare, and a stable functioning market
system. The survey result of this discrete variable revealed that 34.4 and 65.6% of the
sample households receive and do not receive adequate government support to allevi-
ate food security problems, respectively. Of these households, 35.6 and 34.1% were food
secure and food insecure, respectively. While 64.4 and 65.9% of the households do not
receive government support and become food secure and food insecure, respectively.
The chi-square result of this variable is statistically insignificant at 95% level of signifi-
cance. Therefore, there is no association between government support and food
security status of the rural farm households. This could be attributed to the fact that
almost all farmers believed that agricultural production is dependent on natural condi-
tions (climate change and rainfall variability), thereby the analysis of influencing factors
of food security is concentrated mainly on such factors than government support. Their
idea is supported by a study done in Niger by Barrett (2006). He revealed that food aid
decreased government support to agriculture in the long run and caused distortion in
the local price of food items.
Determinants of rural household food insecurity: the binary logistic regression model
This section presents the results of the binary logistic regression and explains the
socio-economic, cultural, and physical determinants of rural household food insecurity
in the study area. As analyzed and put in order of significance, the dependent variable
of the study, household food security status, is a dichotomous variable (food secure and
food insecure) and a function of numerous explanatory variables. It assumes that the
dependent variable is linearly related to the predictors. As a result, the following 13
potential explanatory variables were selected and hypothesized based on the literature
and the author’s observation of the study area (Table 5).
Model specification
As indicated in Table 6, one binary-dependent variable (food security status) and 13
explanatory variables (predictors) were selected for this analysis. Then, the binary
logistic regression model was applied to screen out the most significant variables of the
study. Therefore, the model is described as:
ln Y ¼ ln Y=1‐Y½ � ¼ β0 þ β1X1 þ β2X2 þ β3X3 þ……þ βnXn þ ui
where ln = natural logarithm, Y = probability of being food secure, 1-Y = probability of
being food insecure, βn = coefficients of explanatory variables, Xn = predictor variables,
and ui = error term.
The binary logistic regression model was used to investigate determinant causes of
rural household food security. The analysis of the survey revealed that 7 out of 13
Agidew and Singh Agricultural and Food Economics (2018) 6:10 Page 14 of 23
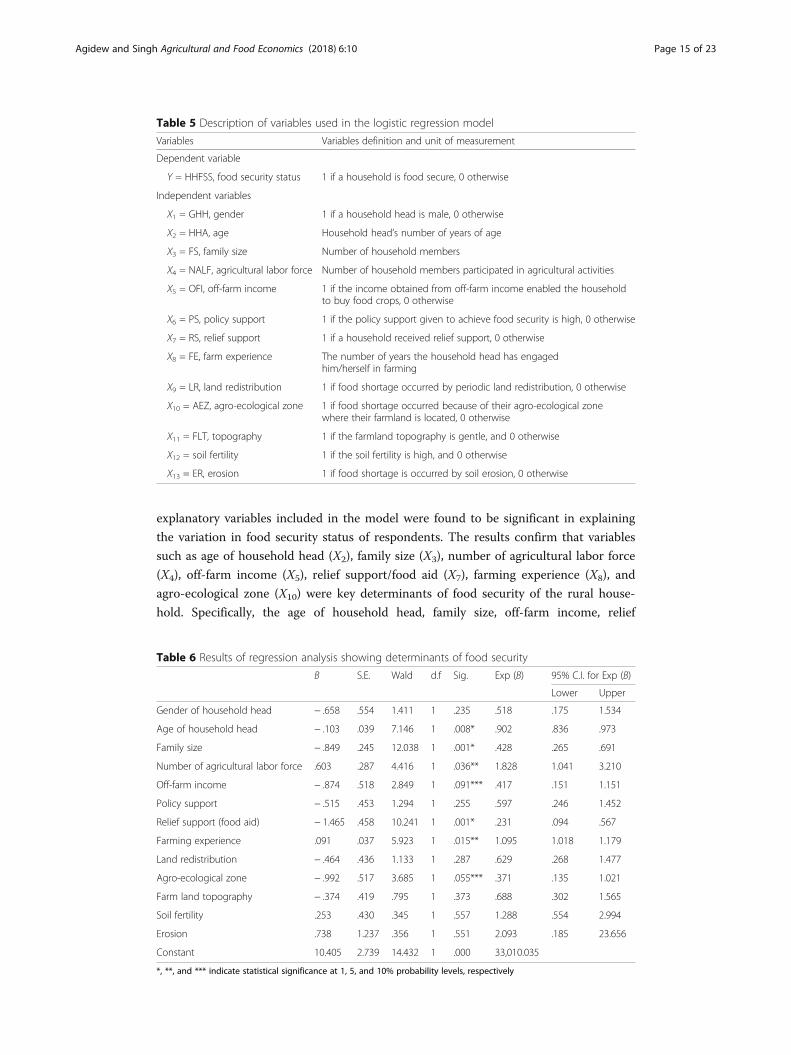
explanatory variables included in the model were found to be significant in explaining
the variation in food security status of respondents. The results confirm that variables
such as age of household head (X2), family size (X3), number of agricultural labor force
(X4), off-farm income (X5), relief support/food aid (X7), farming experience (X8), and
agro-ecological zone (X10) were key determinants of food security of the rural house-
hold. Specifically, the age of household head, family size, off-farm income, relief
Table 5 Description of variables used in the logistic regression model
Variables Variables definition and unit of measurement
Dependent variable
Y = HHFSS, food security status 1 if a household is food secure, 0 otherwise
Independent variables
X1 = GHH, gender 1 if a household head is male, 0 otherwise
X2 = HHA, age Household head’s number of years of age
X3 = FS, family size Number of household members
X4 = NALF, agricultural labor force Number of household members participated in agricultural activities
X5 = OFI, off-farm income 1 if the income obtained from off-farm income enabled the householdto buy food crops, 0 otherwise
X6 = PS, policy support 1 if the policy support given to achieve food security is high, 0 otherwise
X7 = RS, relief support 1 if a household received relief support, 0 otherwise
X8 = FE, farm experience The number of years the household head has engagedhim/herself in farming
X9 = LR, land redistribution 1 if food shortage occurred by periodic land redistribution, 0 otherwise
X10 = AEZ, agro-ecological zone 1 if food shortage occurred because of their agro-ecological zonewhere their farmland is located, 0 otherwise
X11 = FLT, topography 1 if the farmland topography is gentle, and 0 otherwise
X12 = soil fertility 1 if the soil fertility is high, and 0 otherwise
X13 = ER, erosion 1 if food shortage is occurred by soil erosion, 0 otherwise
Table 6 Results of regression analysis showing determinants of food security
B S.E. Wald d.f Sig. Exp (B) 95% C.I. for Exp (B)
Lower Upper
Gender of household head − .658 .554 1.411 1 .235 .518 .175 1.534
Age of household head − .103 .039 7.146 1 .008* .902 .836 .973
Family size − .849 .245 12.038 1 .001* .428 .265 .691
Number of agricultural labor force .603 .287 4.416 1 .036** 1.828 1.041 3.210
Off-farm income − .874 .518 2.849 1 .091*** .417 .151 1.151
Policy support − .515 .453 1.294 1 .255 .597 .246 1.452
Relief support (food aid) − 1.465 .458 10.241 1 .001* .231 .094 .567
Farming experience .091 .037 5.923 1 .015** 1.095 1.018 1.179
Land redistribution − .464 .436 1.133 1 .287 .629 .268 1.477
Agro-ecological zone − .992 .517 3.685 1 .055*** .371 .135 1.021
Farm land topography − .374 .419 .795 1 .373 .688 .302 1.565
Soil fertility .253 .430 .345 1 .557 1.288 .554 2.994
Erosion .738 1.237 .356 1 .551 2.093 .185 23.656
Constant 10.405 2.739 14.432 1 .000 33,010.035
*, **, and *** indicate statistical significance at 1, 5, and 10% probability levels, respectively
Agidew and Singh Agricultural and Food Economics (2018) 6:10 Page 15 of 23

support, and agro-climatic zone had a negative influence on food security of a house-
hold. Other variables of significance, namely number of the agricultural labor force and
farming experience, were found to exert a positive impact on the determinants of food
insecurity. Furthermore, the study identifies food insecurity as a cumulative effect of
several factors like population pressure, shortage of farmland, recurrent drought,
poverty, climate change, and increasing rate of soil erosion (land degradation), and
therefore, policy-makers and other concerned bodies should pay attention to alleviate
the problem. The coefficients of variables in the model were significant at 1% (p < 0.01),
5% (p < 0.05), and 10% (p < 0.1) levels of significance, respectively. This indicates that
the model was a good fit to the data. The summary of the significant key determinants
of food security of rural households is presented in Table 6. However, the gender of
household head (X1), policy support (X6), land redistribution (X9), farmland topography
(X11), soil fertility (X12), and erosion (X13) do not show any significant influence. The
statistical non-significance of these coefficients suggests that these variables are not
important in explaining the causes of rural household food insecurity. Particularly, the
statistical non-significance of the gender of the household head could be because of the
recently introduced women’s land ownership right, which enables them to empower
economically unlike the past times. Therefore, today, women have an equal right with
men on land issues.
The result of the binary logistic regression indicated that age of household head (X2),
family size (X3), number of agricultural labor force (X4), off-farm income (X5), relief
support (X7), farming experience (X8), and agro-ecological zone (X10) are significant
predictors of rural household food insecurity. Especially, the agricultural labor force
has a positive association with the food security status of the household. This implies
that the agricultural labor force is imperative as it determines the number of persons
engaged in the agricultural activities in order to meet the needs of the household food
security.
Age of the household heads
The mean age of sample household heads is 43 years, ranging from 22 to 75 with a
standard deviation of 12.09. The result of the regression analysis for the household
head age (HHA) was found to be statistically significant at 1% level of significance. It is
negatively associated with food security status of the rural household. The negative
association can be explained by the fact that older farmers are less likely to be food
secure. It may be due to the fact that older farmers do not have the required labor force
to produce more food crops than their counterparts. This result is in line with the
study carried out by Bashir et al. (2012) in Pakistan. They found that an increase of
1 year in the age of household head decreases the chances of a household to become
food secure by 3%. Similarly, a study conducted by Omonoma and Agoi (2007) in
Nigeria found an inverse relationship between the age of household head and food
security. A study carried out by Funmilola and Patricia (2014) in Nigeria also found the
same result. They revealed that as the household head advances in age, the probability
of being food secure decreases. In contrast, a study done in the USA by Onianwa and
Wheelock (2006) revealed that increasing age of household head by 1 year reduces the
chances of food insecurity by 2%. A study conducted in Nigeria by Arene and Anyaeji
(2010) also come up with similar results. They conclude that the increased age of the
household head had a positive effect on food security status.
Agidew and Singh Agricultural and Food Economics (2018) 6:10 Page 16 of 23
Family size
The average family size of the sample households was found to be 4.3 ranging from 2
to 10 persons with a standard deviation of 1.3. Based on the result of the regression
analysis, family size (FS) is statistically significant at 1%. It is negatively associated with
rural farm household food security status. The coefficient of this variable explains that
an increase in family size by one member decreases the chances of household food
security by 42.8%. This result is in line with the results of Bashir et al. (2012), who
found that an increase of one member in the household decreases the chances of food
security by 31%. This indicates that households with larger family size are more likely
to be food insecure than their counterparts. The negative association could be due to
an increase in the number of family dependency ratio. This means that households
having many children and old age groups may lack sufficient manpower, which eventu-
ally results in overdependence on limited family resources hence food insecurity. By
taking into account the negative impact of large family size on the food security situ-
ation of rural households, farming households should be educated on the importance
of family planning and the burden that it causes on their livelihood so that they may
bear the number of children which their resources can support. This result is also in
agreement with the study conducted in Nigeria by Funmilola and Patricia (2014). They
reported that households with large size have a higher possibility of being food
insecure than those with smaller size, and vice versa. A study carried out by Robert et
al. (2013) in the Sekyere-Afram Plains District of Ghana also came up with similar re-
sults. They revealed that the probability of food security decreases with the increase in
household size.
Number of agricultural labor forces
Labor is a key asset for smallholder households in rural Ethiopia. In Ethiopia where
farm mechanization is almost non-existent and all farm work is done manually, having
access to necessary labor force for agricultural production directly affects the status of
rural household’s food security. In addition to working on a household’s own farm,
labor force may also be engaged in off-farm economic activities, thus providing
additional income to the household, which could be used for food purchases in times
of food shortage.
The mean household members who participated in the agricultural labor force are 2.2
persons ranging from 1 to 5 with a standard deviation of 0.9. The analysis of this study
indicated that the number of the agricultural labor force (NALF) is statistically significant
at 5%. The number of the agricultural labor force is one of the major predictors of the
causes of rural household food insecurity. It has a positive correlation with food security
status of the rural households. This indicates that households with a large number of the
agricultural labor force are more likely food secure than their counterparts. Lack of labor
force will have an intense impact on agricultural production and household food security.
Because of low mechanization in Ethiopian agriculture, human labor is crucial for land
preparation, weeding, and harvesting processes. However, in the study area, there are
substantial households, whose family members are used to migrate to Arab countries
because they thought that it is the best way that brought wealth to rural areas as a form of
remittance within a short period of time. There is also temporary migration to nearby
towns for daily labor wage benefit. Both of these migration trends can affect agricultural
labor force availability. It is thus important for the policy-makers and local government
Agidew and Singh Agricultural and Food Economics (2018) 6:10 Page 17 of 23
administrators to take into account the diversity of rural livelihoods including the
provision of credit access at a lower interest rate and job creation so as to improve the
food security of the local community in particular and in the region in general. This result
is in line with the study done in Nigeria by Funmilola and Patricia (2014). They stated that
the higher the participation of the family members in farming activities, the higher the
possibility of food security and vice versa.
Off-farm income
As shown in Table 6, the coefficient of off-farm income (OFI) was statistically signifi-
cant at 10% level of significance and exhibited a negative association with food security
status of the rural households. The negative association could be due to lack of non-
farm job opportunities and start-up capital constraints. This result is in conformity with
the findings of Mitik and Legesse (2014). In their study conducted in southwestern
Ethiopia, they indicated that off-farm income is negatively related to household vulner-
ability and to food insecurity. But the result of this study is inconsistent with the study
conducted by Robert et al. (2013) in the Sekyere-Afram Plains District of Ghana. They
stated that the coefficient of the off-farm income was positive indicating that there is a
positive relationship between off-farm work and food security. Studies conducted by
Reardon (1997), Barrett et al. (2001), and Meles et al. (2016) also confirmed similar
results. They reported that the success of households and their members in managing
food insecurity is largely dependent on their ability to get access to off-farm job oppor-
tunities, which could aid as livelihood diversification strategies.
Relief support (food aid)
In this study, relief support (food aid) means the provision of food grains or cash for
food-related purposes to chronically food insecure farm households. This is provided
on grant bases to address critical food needs arising from natural and man-made
disasters. Food aid is frequently part of the international response to a national or
economy-wide extreme crisis. These crises pose an immediate or imminent threat to
the lives, livelihoods, short-term stability, and longer-term development.
The survey result of this variable revealed that 34.9 and 65.1% of the sample house-
holds have and do not have received relief support, respectively. The result of the
binary logistic regression model indicates that relief support (RS) is statistically signifi-
cant at 1% level of significance. It shows a positive association between relief support
and food security status of the rural farm households. This result is in line with the
findings of Barrett and Maxwell (2005). They argued that food aid contributes to
economic development and protects basic human rights, where the aid fills a severe
food gap. Food aid transfers play a safety net role by reducing vulnerability and protecting
productive assets. In contrast, a study conducted in Niger by Seydou et al. (2014) revealed
that food aid influences negatively and significantly the household food security. Similarly,
a study done by Demeke et al. (2006) and Gelan (2006) in Ethiopia suggests that food aid
displaces domestic production and commercial trade by depressing prices in the recipient
countries; it affects the labor supply negatively, enhances market imperfections and
information asymmetries, and this, in turn, affects economic development.
Farming experience
Farming experience is an important factor in determining both productivity and the pro-
duction level in farming. The mean year of sample household heads farming experience is
about 19 years. It ranges from 2 to 60 years having a standard deviation of 12.08. The
Agidew and Singh Agricultural and Food Economics (2018) 6:10 Page 18 of 23
result of the binary logistic regression model indicates that farming experience (FE) is
statistically significant at 5% level of significance. Therefore, there is a positive association
between farming experience and food security status of the rural households. The positive
association could be attributed to the fact that farmers who have many years of experience
in agricultural activities are more likely to be food secure than their counterparts. This
means that as farmers’ agricultural experience is increased, their knowledge and skills
about sustainable land management and effective utilization of the available small
farmlands will be increased as a result able to produce more food crops. This result is in
line with the study conducted in Ghana by Kuwornu et al. (2012). They indicated that an
experienced farmer is expected to have more insight and ability to diversify his or her
production and minimize the risk of food shortage. In addition, an experienced farmer is
more likely to have an adequate knowledge of the pest, disease management, and weather.
Therefore, the effect of farming experience on food security is likely to be positive.
According to Amaza (2006), farming experience on productivity and production may have
either a positive or negative effect on agricultural production. This means that up to a
certain number of years, the farming experience would have a positive effect on agricul-
tural production; after that period, farming experience may have a negative effect.
Agro-ecological zone
Practices based on agro-ecological principles include agro-forestry (agricultural systems
that combine trees, crops, and animals in order to promote intensification and synergies),
water harvesting, livestock integration into farming systems, reduced tillage, composting,
and green manure.
As indicated in Table 6, the coefficient of the agro-ecological zone (AEZ) was statisti-
cally significant at 10% level of significance and revealed a negative correlation with
food security status of the rural farm households. Therefore, there is no correlation
between agro-ecological zone in which sample households farmland is located and their
food security status. The negative correlation could be due to lack of adequate informa-
tion on agro-ecological practices, which can give farmers greater control and enable
them to meet their own food needs and boost their incomes. This result is in line with
the study done in Jigjiga district of Ethiopia by Hussein and Janekarnkij (2013). They
revealed that the agro-ecology stratum in which household’s farmland was located
found to have a negative and statistically significant impact on food security. However,
the integration of trees into annual food crop systems has been adopted by tens of
thousands of farmers in Malawi, Zambia, Burkina Faso, and Niger, leading to the
increases in household and national food security (Garrity 2010). A recent review of
286 projects in 57 countries found that crop productivity rose by 79% where farmers
had adopted agro-ecological practices (Pretty et al. 2006), while an older study
conducted by Pretty and Hine (2001) reported food production rising by 73% for 4.42
million small-scale farmers growing cereals and root crops.
Causes of food insecurity in the Teleyayen sub-watershed
The survey results obtained through interview and focus group discussions identified
several possible causes of food insecurity. These are shortage of water, poverty, shortage
of farmland, drought, population pressure, and shortage of rainfall. Among them,
drought, shortage of rainfall, and shortage of farmland are believed to be the major
Agidew and Singh Agricultural and Food Economics (2018) 6:10 Page 19 of 23

causes of food insecurity. Irregular rainfall and low precipitation are the main limiting
factors of food crop production. Rainfall is very low and erratic, with periods of drought
often followed by devastating flash floods. There are very limited and unevenly distributed
water resources in the sub-watershed. Moreover, they are not easily accessible. On the
other hand, drought often results in increases in the prices of food crops, and most house-
holds who depend only on their own production lack purchasing power to buy food crops
to satisfy the needs of their family members. Besides, unreliable spring rainfall aggravates
the problem of food security of the area. Most of the time, the summer rainfall starts late
and stops early and never resumed. Consequently, such an uneven distribution of the
rainfall gives rise to a serious shortage of water during the dry season particularly in the
midland (Moist-weyna-dega) agro-ecological zone of the sub-watershed. The insufficient
rainfall along with drought usually causes agricultural productivity losses in the sub-
watershed. Seventy-one percent of the respondents reported that food insecurity is closely
related to land degradation. Hence, because of soil fertility and soil erosion problems,
agricultural productivity has lowered to the unexpected rate.
ConclusionsThis study examined the determinants of food insecurity in the rural farm households
of the Teleyayen sub-watershed case study in Ethiopia. Accordingly, the findings
obtained from the study revealed that food insecurity continues to affect the Ethiopian
population in general and the sub-watershed communities in particular. The study has
found that majority (79.1%) of the sample households were found to be food insecure
during the period of the survey. The majority of them were younger household heads,
who own less than 1 ha of farmland per household. On average, male-headed house-
holds are more food secure (22.09%) than female-headed households (16.09%). The
food insecurity situation of the study area is extremely difficult and alarming and needs
an urgent response. Similar tendency is observed from the descriptive statistics of
calorie intake. Several determining factors were identified for the deteriorating food
security situation of the study area. They include the shortage of farmland caused by
population pressure, recurrent drought, poverty, climate change, shortage of rainfall,
and land degradation.
The results of the binary logistic regression confirm that the variables such as age of
household head (X2), family size (X3), number of agricultural labor force (X4), off-farm
income (X5), relief support/food aid (X7), farming experience (X8), and agro-ecological
zone (X10) were key determinant causes of rural household food insecurity. Especially,
the age of household head, family size, off-farm income, relief support (food aid), and
agro-climatic zone had a negative influence on food security of the rural households.
Other variables of significance, namely number of the agricultural labor force and farm
experience, were found to exert a positive impact. This result is also supported by the
data obtained from the surveys of the interview and focus group discussions. Accordingly,
shortage of water, shortage of farmland, drought, poverty, population pressure, and the
shortage of rainfall were identified as possible causes of food insecurity. Irregular rainfall
and low precipitation are the main limiting factors of food crop production. Rainfall is
very low and erratic, with periods of drought often followed by devastating flash floods.
On the other hand, drought often results in increases in the prices of food crops, and
most households who depend only on their own production lack purchasing power to
Agidew and Singh Agricultural and Food Economics (2018) 6:10 Page 20 of 23
buy food crops to satisfy the needs of their family members thereby forced to transitory
migration in search of wage labor as a daily laborer in the nearby towns. Besides, unreli-
able spring rainfall aggravates the problem of food security of the area. Most of the time,
the summer rainfall starts late and stops early and never resumed. Consequently, such an
uneven distribution rainfall gives rise to a serious shortage of water during the dry season
particularly in the midland (Moist-weyna-dega) agro-ecological zone of the sub-
watershed. Therefore, in order to improve the food security situations in Ethiopia in
general and in the Teleyayen sub-watershed in particular, actions should be taken as soon
as possible. These actions may include expand the family planning education to limit the
family size of the rural population, which could ease the problem of overpopulation and
acute farmland scarcity and design a strategy to diversify the livelihoods of the rural
community so as to complement their food gap.
Endnotes1Kebele is the smallest administrative unit of Ethiopia
AbbreviationsAEU: Adult equivalent unit; kcal: Kilocalorie; PSNP: Productive Safety Net Program; SPSS: Statistical Package for Social Sciences
AcknowledgementsThe authors would like to thank both the International Foundation for Science (IFS) and Addis Ababa University for providingfinancial support to the first author. The authors also would like to extend their deep thanks to all the contributors of thisstudy, namely farmers, local administrators, and development agent workers who took part in the survey.
Authors’ contributionsBoth authors read and approved the final manuscript.
Competing interestsBoth authors declare that they have no competing interests.
Publisher’s NoteSpringer Nature remains neutral with regard to jurisdictional claims in published maps and institutional affiliations.
Author details1Department of Geography and Environmental Studies, Wollo University, P.O. Box 1145, Dessie, Ethiopia. 2Departmentof Geography and Environmental Studies, Addis Ababa University, Addis Ababa, Ethiopia.
Received: 7 June 2017 Accepted: 24 April 2018
ReferencesAmaza SP (2006) Determinants and measurements of food insecurity in Nigeria: some empirical policy guide.
Presentation at the International Association of Agricultural Economists Conference, Gold CoastANRS-BFED (2008) Amhara National regional State Bureau of Finanace and Economic Development. Annual Statistical
Bulletin, Bahir Dar, pp. 29-50.Arene C, Anyaeji C (2010) Determinants of food security among households in Nsukka metropolis of Enugu State,
Nigeria. Pak J Soc Sci 30(1):9–16Barnett A (2001) Northern Ethiopia: What’s the menu? Nutr Food Sci 31(1):35–37Barrett BC (2006) Food aid’s intended and unintended consequences background; paper for food and agriculture
organization. Food and Agriculture Organization, RomeBarrett BC, Maxwell DG (2005) Food aid after fifty years-recasting its role. Routledge, LondonBarrett CB, Reardon T, Webb P (2001) Non-farm income diversification and household livelihood strategies in rural
Africa: concepts, dynamics, and policy implications. Food Policy 26(4):315–331Bashir M, Schilizzi S, Pandit R (2012) The determinants of rural food security: the case of landless households of the
Punjab, Pakistan. A school of Agricultural and Resource Economics, the University of Western Australia, CrawleyBouis H (1993) Food consumption surveys: how random are measurement errors? In: Von Braun J, Puet D (eds) Data
needs for food policy in developing countries. International food policy research institute, Washington D.CBukusuba J, Kikafunda KJ, Whitehead GR (2007) Food security status in households of people living with HIV/AIDS
(PLWHA) in a Ugandan Urban setting. British Journal of Nutrition 98 (1):211–217. https://doi.org/10.1017/S0007114507691806.
Chang HH, Wen FI (2011) Off-farm work, Technical efficiency and Rice production risk in Taiwan. Agricultural Economics42(2):269–278. https://doi.org/10.11111/j.1574-0862.2010.00513.x.
Agidew and Singh Agricultural and Food Economics (2018) 6:10 Page 21 of 23
CSA (2007) Summary and statistical report of the 2007 population and housing census of Ethiopia: results at countrylevel. CSA, Addis Ababa
Degefa T (1996) Belg crop production as a strategy of Households' Food security: A comparative study of Belg Growerand non-Belg farmers in Munessa Woreda, Arsi Zone. MA Thesis , Addis Ababa University, Ethiopia
Demeke M, Guta F, Ferede T (2006) “Agricultural development and food security in sub-Saharan; building a case formore public support the case of Ethiopia”, prepared for the policy assistance unit of the FAO sub regional officefor East and Southern Africa
Derrickson J (2000) Face validity of the core food security module with Asians and Pacific Islanders. J Nutr Educ 32(1):21–30DFID (2014) Annual review: Ethiopia Productive Safety Net ProgrammeDoocy S, Teferra S, Norell D, Burnham G (2005) Credit program outcomes: coping capacity and nutritional status in the
food insecure context of Ethiopia. Soc Sci Med 60(10):2371–2382. https://doi.org/10.1016/j.socscimed.2004.10.025Ervin CA, Ervin DE (1982) Factors influencing the use of soil conservation practices: hypotheses, evidence, and policy
implications. Land Econ 58(3):277–292Eshetu B (2000) The underlying causes of household food insecurity and copying strategies. The case of Ligambo
Woreda, South Wollo Zone, Amhara region, Northern Ethioia. MA Thesis, Addis Ababa University, EthiopiaFAO (1984) Ethiopian geomorphology and soils (1:1,000,000 scales). Assistance to Land Use Planning, Addis Ababa npFAO (1996) Rome declaration on World food security and World food summit plan of action. World food summit 13-17
November 1996. FAO, Rome.FAO (2002) International scientific symposium on measurement and assessment of food deprivation and under-nutrition.
Executive summary. June 26–28. FAO/Food Insecurity and Vulnerability Information and Mapping System, RomeFAO (2012) The state of food insecurity in the world: economic growth is necessary but not sufficient to accelerate
reduction of hunger and malnutrition. FAO, Rome http://www.fao.org/docrep/016/i3027e/i3027e.pdf. Accessed 6Nov 2017
FAO/WFP (1995) Can Ethiopia feed itself? Crop and food supply assessment mission: proposed travel itinerary; http://www.africa.upenn.edu/eue_web/assesmis.htm. Accessed 20 Sept 2016
Feleke ST, Kilmer RL, Gladwin CH (2005) Determinants of food security in southern Ethiopia at the household level.Agric Econ 33(3):352–363
Frankenberger T (1992) Indicators and data collection methods for assessing household food security. In: Maxwell S,Frankenberger T (eds) Household food security: concepts, indicators, and measurements: a technical review.UNICEF and IFAD, New York and Rome
Funmilola FA, Patricia OA (2014) Determinanats of food security among low-income households in MaiduguriMetropolis of Borno State, Nigeria. Asian Journal of Social Sciences and Humanities 3(1):74–86. ISSN:2186–8492
Gafsi M, Brossier J (1997) Farm management and protection of natural resources: analysis of adoption process anddependence relationship. Agric Syst 55(1):71–97
Garrity D (2010) Evergreen agriculture: a robust approach to sustainable food security in Africa. Food Security 2:3–20.https://doi.org/10.1007/s12571-010-0070-7
Gelan A (2006) Cash or food aid? A general equilibrium analysis for Ethiopia. Dev Policy Rev 24(5):601–624Gonfa L (1996) Climate classification of Ethiopia. NMSA, Addis Ababa, pp. 15-58.Goodwin B, Mishra A (2004) Farming efficiency and the determinants of multiple job holding by farm operators. Am J
Agric Econ 86(3):722–729Gujarati DN (1995) Basic econometrics. 3rd Edn. McGraw-Hill Inc., New York., ISBN-13:9780070252141, p 838Haileslassie A, Priess J, Veldkamp E, Teketay D, Lensschen JP (2005) Assessment of soil nutrient depletion and its spatial
variability on smallholders’ mixed farming systems in Ethiopia using partial versus full nutrient balances. AgricEcosyst Environ 108(1):1–16
Hofferth SI. (2004) Persistence and change in food security of families with children, 1997–1999. EconomicResearch Institute, USDA, Monograph (EFAN04001). Economic Research Institute, USDA, Monograph(EFAN04001)
Holden S, Shiferaw B, Pender J (2005) Policy analysis for sustainable land management Washington and food securityin Ethiopia: a bioeconomic model with market imperfections. International Food Policy Research Institute, D.C.
Hussein WP, Janekarnkij (2013) Determinants of rural household food security in Jigjiga district of Ethiopia. Kasetsart J34:171–180
IFPRI (2009) Global Hunger Index 2009. International Food Policy Research Institute, Washington, D. CKaluski DN, Ophir E, Amede T (2002) Food security and nutrition—the Ethiopian case for action. Public Health Nutr 5(3):373–381Kilic T, Carletto C, Miluka J, Savastano S (2009) Rural non-farm income and its impact on agriculture: evidence from
Albania. Agric Econ 40(2):139–160Koffio-Tessio EM, YH Tossou, KA Homevor (2005) Impact of education on agricultural productivity in sub-Saharan Africa.
Paper presented at a “Global Conference on Education Research in Developing Countries”, Prague, Czech Republic,31 March–2 April
Kothari CR (2004) Research methodology: methods and techniques. 2nd edition. New age international publishers, New DelhiKuwornu JKM, Suleyman DM, Amegashie DPK (2012) Analysis of food security status of farming households: in the
forest belt of the central region of Ghana. Russ J Agric Socioecon Sci 1(13):26–42Markos E (1997) Demographic response to ecological degradation and food insecurity in drought prone areas in northern
Ethiopia. Ph.D. thesis. the University of Groningen, Amsterday [12], 373, [43] p. (PDOD Publication Series A)Meles T, Meseret, Miruts M (2016) Assessment of food security status and factors influencing food security in Hawi
Guddina district, Ethiopia. Int Sch J 3(3):167–173Messay M (2009) Causes of rural household food insecurity: a case from Kuyu district, central Ethiopia. Clarion University
of Pennsylvania, Clarion, Pennsylvania. J Sustainable Dev Afr 11(4):286–304
Mitik A, Legesse W (2014) The causes and consequences of smallholder farmers’ vulnerability to food insecurity insouth western Ethiopia. J Bus Econ Manag 2(3):040–046. https://doi.org/10.15413/jbem.2013.0150
MoFED (2002) Ethiopia’s sustainable development and poverty reduction program (SDPRD). Ministry of finance and economicdevelopment, Addis Ababa http://siteresources.worldbank.org/INTPRS1/Resources/073102.pdf. Accessed 23 June 2016
Agidew and Singh Agricultural and Food Economics (2018) 6:10 Page 22 of 23

NMSA (1996) Climatic and agro-climatic resources of Ethiopia. Vol. 1, no. 1. National Meteorology Service Agency ofEthiopia, Addis Ababa, p 137
Omonoma B, Agoi G (2007) An analysis of food security situation among Nigerian urban households: evidence fromLagos state, Nigeria. J Cent Eur Agric 8(3):397–406
Onianwa OO, Wheelock GC (2006) An analysis of the determinants of food insecurity with severe hunger in selectedsouthern states. South Rural Sociol 21(1):80–96
Pappoe P (2011) Effect of Biofuel production on household food security in the central region of Ghana. M.Sc. Theis,University of Ghana, Ghana
Paudel GS (2001) Farmers’ land management practices in the hills of Nepal: a comparative study of watershed ‘with’and ‘without’ external intervention. A dissertation submitted in partial fulfillment of the requirement for the awardof doctor of philosophy, Asian Institute of Technology, School of Environment, Resources and Development,Bangkok, Thailand
Phillips T, Taylor (1990) Optimal control of food insecurity: a conceptual framework. Am J Agric Econ 72(5):1304–1330Pretty J, R. Hine (2001) ‘Reducing food poverty with sustainable agriculture: A J. Pretty, A. Noble, D. Bossio, J. Dixon, R.
Hine, F.W.T. Penning de Vries, and JPretty JN, Noble AD, Bossio D, Dixon J, Hine RE, Penning de Vries FWT, Morison JIL (2006) Resource-conserving
agricultural increases yields in developing countries. Environ Sci Technol 40(4):1114-1119. https://doi.org/10.1021/es051670d
Reardon T (1997) Using evidence of household income diversification to inform study of the rural non-farm labourmarket in Africa. World Dev 25(5):735–747
Robert A, James O, Mensah Thomas T (2013) Determinants of household food security in the Sekyere-afram plainsdistrict of Ghana. First Annual International Interdisciplinary Conference, AIIC 2013, 24–26 April, Azores,Portugal—Proceedings
Seydou Z, Liu Y, Baohui S (2014) Factors influencing household food security in West Africa: the case of southern Niger.Sustainability 6:1191–1202. https://doi.org/10.3390/su6031191
UNDP (1994) Emergencies unit for Ethiopia situation report of South Wollo Zone (region 3). http://www.africa.upenn.edu/eue_web/wellomar.htm. Accessed 10 Aug 2015
Urassa JK (2010) Rural household livelihoods, crop production and well-being after a period of trade reforms: a casestudy of Rukwa, Tanzania. Thesis for award of Ph.D degree at University of Sussex, Brighton, p 232
Webb P, von Braun J, Yohannes Y (1992) Famine in Ethiopia: policy implications of coping failure at national andhousehold levels. International food policy research institute. Research report no. 92. IFPRI, Washington, D.C
Woldeamlak B (2009) Rainwater harvesting as a livelihood strategy in the drought-prone areas of the Amhara regions ofEthiopia. Organization for Social Science Research in Southern and Eastern and Southern Africa (OSSREA), Addis Ababa
Agidew and Singh Agricultural and Food Economics (2018) 6:10 Page 23 of 23