Embed Size (px)
Citation preview
YUAN DING, THOMAS JEANJEAN AND HERVÉ STOLOWY
Why Do Firms Opt for Alternative-Format Financial Statements? Some
Evidence from France
YUAN DING is an Associate Professor, THOMAS JEANJEAN an Assistant Professor and HERVÉ STOLOWY a Professor, all in the Department of Accounting and Management Control, HEC School of Management, Paris, France. YUAN DING is also a Core Professor of Accounting, China-Europe International Business School (CEIBS), Shanghai, China. The authors would like to thank Michel Tenenhaus and workshop participants at HEC Montreal and the University of Bordeaux IV (CRECCI) for helpful comments. Any remaining errors or omissions are their own. They would also like to acknowledge the financial support of the HEC Foundation and the Research Center at the HEC School of Management (project F042) as well as the funding received from the Research Alliance in Governance and Forensic Accounting as part of the Initiative on the new economy program of the Social Sciences and Humanities Research Council of Canada (SSHRC). The authors are Members of the GREGHEC, unité CNRS, FRE-2810. Finally, the authors are also indebted to Ann Gallon for her much appreciated editorial help. Hervé Stolowy is the corresponding author: Tel: +33 1 39 67 94 42. E-mail address: [email protected].
1
Why Do Firms Opt for Alternative-Format Financial Statements? Some
Evidence from France
ABSTRACT
Historically, the format of financial statements has varied from one country to another. Recently, due to the attractiveness of their capital markets, the strength of their accounting professions and the influence of their institutional investors, Anglo-American countries have seen the impact of their accounting practices on other nations increase steadily, even influencing the actual format of financial statements. Given that French accounting regulations allow a certain degree of choice in consolidated balance sheet format (‘by nature’ or ‘by term’) and income statement format (‘by nature’ or ‘by function’), this study examines a sample of 199 large French listed firms in an attempt to understand why some of these firms do not use the traditional French formats (‘by nature’ for the balance sheet and ‘by nature” for the income statement), instead preferring Anglo-American practices (‘by term’ format for the balance sheet and ‘by function’ format for the income statement). We first analyze the balance sheet and income statement formats separately using a logit model, then combine the two and enrich the research design with a generalized ordered logit model and a multinomial logit regression. Our results confirm that the major driving factor behind the adoption of one or two alternative formats is the firm’s degree of internationalization, not only financial (auditor type, foreign listing and the decision to apply alternative accounting standards) but also commercial (company size and the internationalization of sales). Key words: Disclosure – Determinants – Financial Statements – Alternative format – France – Logit – Generalized ordered logit – Multinomial logit.
RESUME
Historiquement, le format des états financiers a varié d’un pays à l’autre. Récemment, en raison de l’attractivité de leurs marchés de capitaux, de la force de leurs professions comptables et de l’influence de leurs investisseurs institutionnels, les pays anglo-américains ont connu une croissance de leur impact sur les pratiques comptables d’autres pays, influençant même le format des états financiers. Dans la mesure où la réglementation française offre un certain choix en matière de format de bilan (par nature ou par échéance) et de compte de résultat (par nature ou par fonction), la présente recherche étudie un échantillon de 199 grandes sociétés françaises dans le but de comprendre pourquoi certaines d’entre elles n’utilisent pas le format traditionnel (bilan par nature ou compte de résultat par nature) et préfèrent plutôt des formats anglo-américains (bilan par échéance et compte de résultat par fonction). Nous analysons tout d’abord le format du bilan et du compte de résultat de manière séparée en utilisant un modèle logit. Ensuite, nous combinons ces deux choix pour enrichir la méthodologie de recherche avec un modèle de régression logistique généralisée et une régression logistique multinominale. Nos résultats confirment que le facteur principal expliquant l’adoption d’un ou deux formats alternatifs est le degré d’internationalisation de l’entreprise, cette internationalisation étant non seulement financière (choix de l’auditeur, cotation à l’étranger et application de normes comptables alternatives) mais aussi commerciale (taille de l’entreprise et internationalisation des ventes). Mots clés: Communication financière – Déterminants – Etats financiers – Format alternatif – France – Logit – Régression logistique généralisée – Régression logistique multinominale.
2
Comparability in companies’ financial positions and activities is essential for accounting
information users, but the objective of straightforward comparability is a long way off
achievement. IAS 1 (IASB, 2003, p. 423) allows firms a choice between two formats for the
balance sheet, which differ with regard to the way assets and liabilities are classified: ‘by
term’ (long term versus short term) or ‘by nature’ (intangible, tangible, financial or
operating). The same standard allows two types of classification of expenses for the income
statement: ‘by nature’ (according to type of expenditure or revenue) or ‘by function’
(according to type of operation or segment).
Many countries have required or accepted a range of presentation formats for the key
documents, particularly the balance sheet and income statement (Stolowy and Lebas, 2002, p.
108). For the balance sheet, most countries require ‘by term’ presentation. However, IAS 1,
the 4th EU Directive and national regulations in some countries (including Belgium, France
and Switzerland) allow a ‘by nature’ presentation. The situation is more variable with regard
to the income statement. While the U.S. and Canada, for example, have adopted a ‘by
function’ format, certain countries (e.g. Italy) prefer the ‘by nature’ format. Several others
(e.g. France, and Germany) leave the choice up to the firms themselves, and international
standards (IAS 1, 4th EU directive) do the same. But even in a given country where the
situation seems extremely clear, as is the case for the U.S., there may be exceptions to the
rule. For example, airline accounting in the U.S. is partly governed by the Uniform System of
Accounts and Reports (USAR) issued by the U.S. Department of Transportation (DOT)
(2002). Pursuant to DOT regulations, income statements are normally presented ‘by nature’
rather than ‘by function’.
There has been little research into the formats used for financial statements, although Fjeld
(1936b; 1936a) referred to balance sheet presentation in the U.S. as early as the first half of
the 20th century. To the best of our knowledge, only Ding, Stolowy and Tenenhaus (2003)
have looked at this topic recently, and only as part of an examination of the changes in
presentation over time in France, i.e. without explaining the reasons behind their sample
firms’ choice of format.
This study fills the gap, with an empirical examination of the possible determinants of the
choice of a given format for the balance sheet or income statement.
Of all the countries allowing a range of balance sheet and income statement formats, France
is a particularly interesting example. Individual French companies’ financial statements are
largely influenced by tax considerations, which generate rigid presentation rules: for instance,
both the balance sheet and the income statement are necessarily presented ‘by nature’.
3
However, French standard-setting bodies allow more flexibility in presentation and valuation
for consolidated financial statements, as no income tax is calculated on the basis of
consolidated income. French groups may therefore freely choose between a balance sheet
presented ‘by nature’ (the ‘standard’ format, and the best known because it is compulsory for
individual company financial statements) or ‘by term’ (the ‘alternative’ format), and an
income statement disclosed ‘by nature’ (the ‘standard’ format, for the same reason) or ‘by
function’ (the ‘alternative’ format). The formats we call ‘alternative’ are in fact standard
practice in several other countries, and choosing them is a sign of internationalization for the
French companies concerned (Stolowy and Lebas, 2002; Ding, Stolowy and Tenenhaus,
2003).
From a sample of annual reports for 2002 published by 199 non-financial companies on the
French SBF 250 index, we find that 68 firms choose to publish alternative-format financial
statements. Only 36 publish fully alternative-format financial reporting (both a ‘by function’
income statement and a ‘by term’ balance sheet), whereas another 32 take a ‘mixed’
approach, using an alternative format either for the income statement or their balance sheet.
For that reason we first need to study the determinants for adoption of each ‘alternative’
format (balance sheet ‘by term’ and income statement ‘by function’). We run two separate
logit regressions (one for each financial statement).
It turns out that several variables influence the choice of an alternative balance sheet or
income statement format: ‘Auditor’, ‘Accounting standards’, ‘Foreign listing’ and
‘International sales’. Enhancing the research design with a generalized ordered logit
regression and a multinomial logit regression, we study the combined choice of an alternative
format for the balance sheet and income statement. In both models, it appears that opting for
one alternative format (for either the balance sheet or the income statement) corresponds to
financial internationalization (the ‘Auditor’, ‘Accounting standards’ and ‘Foreign listing’
variables), while ‘going fully-alternative’ (using the alternative format for both the balance
sheet and the income statement) relates more to commercial internationalization (the ‘Size’
and ‘International sales’ variables).
These results are all the more interesting because they lose none of their relevance after the
adoption of international accounting standards/international financial reporting standards
(IAS/IFRS) by listed European (and also Australian and Russian) companies from 2005. As
mentioned above, IAS 1 (IASB, 2003), even in its revised version, remains flexible in
allowing an alternative format. International accounting harmonization will not mean
standardized statement formats.
4
FINANCIAL STATEMENT FORMATS: SOME BACKGROUND
Research into the Determinants of Accounting Choices
Accounting decisions in the broadest sense have been reviewed several times in the literature,
either as part of general studies of financial accounting research (Dumontier and Raffournier,
2002), or through specifically themed reviews (Fields, Lys and Vincent, 2001). Most of the
research lies within the conceptual framework of the political-contractual theory of
accounting (Jensen and Meckling, 1976; Watts and Zimmerman, 1978; Watts and
Zimmerman, 1986), which explains accounting decisions based on agency theory and political
costs.
To borrow the classification drawn up by Dumontier and Raffournier (1999), empirical
studies in the field have principally concerned the choice of accounting method, changes in
accounting method, the positions taken in respect of draft standards, the speed with which
new standards are adopted, earnings manipulation, voluntary disclosure and choice of
auditors.
These accounting choices fall into two broad categories: the way the firm evaluates its
transactions (choices concerning accounting valuation) and the way the firm presents its
accounting information (choices concerning financial statement format). Various accounting
decisions have been examined within this field, mainly concerning the first category: choice
of LIFO in the USA (Kuo, 1993), capitalization of interest cost (Zimmer, 1986), asset
depreciation method (straight-line or declining balance) (Hagerman and Zmijewski, 1979),
goodwill amortization period (Hall, 1993). Dumontier and Raffournier (1998) have shown
that companies listed on foreign markets are more inclined to adopt international standards
voluntarily. Muller III (1999) looked at the recognition of brands acquired by British firms
through mergers. Other authors have surveyed multiple accounting method choices (e.g.,
Inoue and Thomas, 1996; Missonier-Piera, 2004).
As Dumontier and Raffournier (1999) demonstrate, most of these studies conclude that
these decisions are influenced by agency variables (particularly indebtedness, rather than
interest coverage, dividend distribution and working capital ratios) and to a lesser extent by
political costs.
However, to the best of our knowledge, none of these works analyzes the presentation of
financial statements, i.e. the accounting choices concerning financial statement format. Ding,
Stolowy and Tenenhaus (2003) provide evidence of the progressive move away from
traditional accounting practices through a study of the presentation of financial statements of
5
one hundred large French industrial and commercial groups over a ten-year period. Hirshleifer
and Teoh (2003), in a related field, study alternative means of presenting information and the
effect of different presentations on market prices when investors have limited attention and
processing power. But these authors do not explore the determinants of the choice of a given
format.
Balance Sheet Presentation
One of the key choices concerning the balance sheet essentially pertains to the classification
method for assets and liabilities:
- ‘by term’ (short term versus long term) or
- ‘by nature’ (intangible, tangible, financial, operating).
In other words, assets and liabilities can be classified based on either the length of the cycle
for transformation into cash (short term versus long term, or fixed versus current), or the
item’s ‘nature’ (tangible versus intangible, or financial versus operating).
For example, using the ‘by term’ approach, liabilities can be classified into different subsets
(see Table 1, Panel A).
Insert Table 1 about here
A parallel classification must also be applied to assets: long term assets will be recognized as
fixed assets (the stream of economic benefits they create for the firm extends beyond one
year) and will be distinguished from short term assets.
When the format adopted is ‘by nature’, the classification emphasizes the nature of the
assets and liabilities and their role in the operating cycle or operations of the business. For
example, in this approach liabilities can take the structure shown in Table 1, Panel B.
On the asset side a parallel distinction will apply. Financial assets are financial investments
or loans to associates, while trading assets are connected to the cycle of operations.
Inventories and accounts receivable are considered to be trading assets.
IAS 1 (IASB, 2003, § 57, 60) leaves companies a degree of choice, as its definition of
‘current’ (short term) is relatively broad. It may be assessed by reference to the operating
cycle (which corresponds to what we call the ‘by nature’ format) or by reference to the date of
receipt or settlement (which corresponds to our ‘by term’ format). Several countries therefore
allow their companies to choose one of a range of balance sheet formats. But in the U.S. and
Canada, for example, all figures in the balance sheet must be classified ‘by term’ (long term
or short term).
French accounting places the emphasis on the legal form (nature) of the items in the
balance sheet, and for individual company financial statements the French General
6
Accounting Plan (X, 1999a) recommends a balance sheet model where all items are classified
by nature. Since there is a clear separation (in terms of rules) between individual company
and consolidated financial statements, reference must be made to the specific regulation
applicable to consolidated financial statements published from 2000 (X, 1999b). This
regulation does not explicitly refer to the choice between the ‘by nature’ or ‘by term’ formats,
but includes a model balance sheet visibly organized ‘by nature’. In practice, because the
French ‘Methodology’ formerly in application (X, 1986, No. 30) before 2000 did not require a
specific model, many French companies interpreted this as permission to use ‘by term’
presentation for their consolidated balance sheet, and many have carried on doing so.
Income Statement Format
As was the case for the balance sheet, there are several ways of presenting an income
statement. More specifically, there are two methods to classify expenses:
- ‘By nature’ (by type of expenditure or revenue) (see Table 2, Panel A)
- ‘By function’ (by type of operation or segment) (see Table 2, Panel B).
Insert Table 2 about here
In a ‘by nature’ classification (or ‘nature of expenditure method’), expenses are aggregated in
the income statement directly according to their nature (for example purchases of materials,
transportation costs, taxes other than income tax, salaries and social security expenses,
depreciation, etc.). This method is simple to apply, even in small enterprises, because no
allocation of expenses or costs is required.
In a ‘by function’ format (or ‘cost of sales method’), expenses are classified according to
their role in the determination of income (cost of goods sold, commercial, distribution and
administrative expenses are common distinctions in this case).
As classification is an especially thorny issue for operating expenses, Table 2 does not
explore classification patterns beyond those of operating income.
IAS 1 (IASB, 2003, § 88) states that ‘an entity shall present an analysis of expenses using a
classification based on either the nature of expenses or their function within the entity,
whichever provides information that is reliable and more relevant’. As in the case of the
balance sheet, some countries allow companies to choose either format, while others impose
one. The ‘by function’ format is required by U.S. GAAP; the ‘by nature’ format is the
traditional French method for individual company income statements. However, the new
French ‘Regulation’ on consolidation (X, 1999b, § 400) allows companies to choose between
the nature-of-expense and function-of-expense models.
7
As the respective merits of the formats are not the primary concern of this article, they will
not be discussed here. It should simply be noted that each presentation emanates from a
certain vision of the business model financial statements are supposed to describe. Neither
choice is intrinsically better. Each is coherent with a certain philosophy and communication
approach.
As the ‘by nature’ formats for balance sheets and income statements are the ‘traditional’
formats in France, for convenience the rest of this article uses the term ‘alternative balance
sheet’ for the ‘by term’ format and ‘alternative income statement’ for the ‘by function’
income statement. These two alternative formats correspond to an internationalization trend
(Ding, Stolowy and Tenenhaus, 2003).
HYPOTHESIS DEVELOPMENT
As mentioned in the previous section, agency theory is commonly used in the literature to
analyze the determinants of accounting choices. Agency theory argues that there is an
avoidable monitoring cost for shareholders, paid to prevent expected expropriations by
management (Jensen and Meckling, 1976). Since firms are competing against each other in
the capital market to raise funds at the lowest possible cost, there is a high incentive for these
firms to help investors reduce their monitoring cost, by offering them clearer and therefore
more reliable information. In practice, management’s propensity to provide better information
has been shown to vary with certain firm-specific factors such as leverage, firm size, and
dispersion of ownership (Xiao, Yang and Chow, 2004), since there is a constant tradeoff
between the necessity and the possibility of each accounting choice.
The signaling theory may also be relevant. Scott (2003, p. 423) reminds us that the problem
of separating firms of different types has been extensively considered by means of signaling
models, after the seminal work of Spence (1973). More specifically, accounting policy choice
has signaling properties.
In our particular case of choices concerning financial statement format, our general
hypothesis is that the decision made by a French firm not to choose traditional French formats
and instead prefer Anglo-American formats is, in the context of agency and signaling theories,
mainly driven by the internationalization of the firm and made possible by firm’s capacity to
implement such a choice.
Although this study belongs to the family of accounting choices literature, the section on
hypothesis development contains several references to the literature on disclosure studies,
since there are very few previous studies on financial statement format choices. We believe
8
that there are certain similarities between the motives underlying a high disclosure level and
adoption of an alternative format. Both choices require a willingness on the part of the firm to
take on additional work, and depart from common practice.
Size
Size has been positively related to the extent of disclosure (e.g., Raffournier, 1995; Wallace
and Naser, 1995; Giner, 1997; Marston and Robson, 1997; Depoers, 2000). As observed by
Prencipe (2004), the larger the company, the higher the pressure will be to release more
information. Another reason can be derived from Dumontier and Raffournier (1998) who
refer to Singhvi and Desai (1971): disclosing alternative (i.e. ‘different’ or ‘unusual’)
information is costly in general, but less costly for large firms.
So the first hypothesis is:
H1: The adoption of an alternative format for the balance sheet or income statement is
positively related to size.
Auditor Type
The literature has often hypothesized that larger auditors should require more extensive
disclosure from their clients, namely because they have more incentives to maintain their
independence (Xiao, Yang and Chow, 2004). Some research provides evidence of a positive
relationship between the type of auditor (‘big eight’ or ‘big six’ firm, depending on the
period) and the extent of disclosure (Craswell and Taylor, 1992; Giner, 1997; Patton and
Zelenka, 1997).
As the largest audit firms are of Anglo-American origin, they might be expected to
encourage their clients to adopt a balance sheet or income statement format that resembles
international practices. We can now formulate our second hypothesis in the framework of the
signaling theory:
H2: The adoption of an alternative format for the balance sheet or income statement is
positively related to the type of auditor.
Accounting Standards
As explained by Stolowy and Ding (2003), the Commission des Opérations de Bourse (COB,
equivalent to the U.S. SEC) declared in 1995 that since no set of international standards had
been adopted at national level, French companies must prepare their accounts and financial
statements published in France in accordance with French regulations. Consequently, it
decreed that when a French company wants to use a set of international or foreign (in practice,
American) standards for its consolidated financial statements, if the chosen standards are not
9
compatible with French standards, the company is obliged to present two sets of accounts
(COB, 1995, p. 105).
However, since in many cases French accounting rules do not differ greatly from
international or American standards, the COB later stated that it does not object to companies
including a statement in the notes to the effect that their accounts or financial statements,
prepared in accordance with French standards, also comply with international or American
standards (COB, 1998, p. 3).
In this environment, French companies can thus apply ‘alternative’ standards if, in doing
so, they state that these practices are in compliance with the French regulations. We believe
that companies explicitly declaring they have adopted alternative standards (while respecting
French GAAP) will be tempted to take advantage of the leeway left by French regulations
(see above) to opt for alternative balance sheet or income statement formats and will thus
‘signal’ their internationalization.
Our next hypothesis is thus the following:
H3: The adoption of an alternative format for the balance sheet or income statement is
positively related to explicit reference to an alternative set of accounting standards.
Foreign Listing
As Debreceny, Gray and Rahman (2002) point out, foreign listing is sought by firms in order
to have a more competitive cost of capital structure, as it enables them to issue securities in
markets with higher liquidity and lower cost of capital. Foreign listing has numerous other
benefits (Biddle and Saudagaran, 1991; Saudagaran and Biddle, 1995).
Cross (foreign) listing has often been positively associated with disclosure levels (Hossain,
Perera and Rahman, 1995; Meek, Roberts and Gray, 1995).
This leads us to believe that French companies listed outside France will be tempted to
adopt alternative formats that are closer to the formats used in the country of listing, or
internationally.
H4: The adoption of an alternative format for the balance sheet or income statement is
positively related to foreign listing.
Leverage
Dumontier and Raffournier (1998) observe that empirical studies do not generally support the
influence of leverage on the extent of disclosure. But the context is different here. High-
leverage companies should allow efficient monitoring of agency relationships between
shareholders and creditors (Jensen and Meckling, 1976). A ‘by term’ format balance sheet
makes it easier to calculate ratios based on maturities, and distinguish between short term and
10
long term liabilities. This leads to the following hypothesis, which concerns the balance sheet
alone:
H5: The adoption of an alternative format for the balance sheet is positively related to
leverage.
Degree of Internationalization
Raffournier (1995) states that companies are induced to comply with the usual practices of
countries in which they operate. ‘The more international the operations of a firm, the larger is
the inducement’ (1995, p. 266). This author, like Cooke (1989), finds a significant
relationship between internationality and disclosure. In the same vein, Zarzeski (1996) and
Archambault and Archambault (2003) provide evidence that companies with foreign sales
will disclose more information, because they are likely to require the necessary resources.
We think that French companies with international operations will be more inclined to
adopt the alternative format, which as noted above is ‘more international’. This leads to the
following hypothesis:
H6: The adoption of an alternative format for the balance sheet or income statement is
positively related to the degree of internationalization.
This hypothesis, consistent with the signaling theory, is supported by Dumontier and
Raffournier (1998) who explain that because they are more visible on foreign markets, firms
which operate internationally may have an interest in preparing financial statements which
can easily be understood by local customers, suppliers and governments.
Control Variable: Economic Sector
Although several prior studies argue that companies in certain economic sectors will disclose
more information than those in other sectors, only a few studies have proved a relationship
between sector and disclosure (Cooke, 1992; Entwistle, 1999).
Despite these disappointing results, we believe that the sector can influence the choice of
account format, even if only due to mimicry, but we have no prediction to make regarding the
type of influence. We will therefore include the economic sector as a control variable.
SAMPLE AND RESEARCH DESIGN
Sample
Our basic sample comprises all companies in the SBF 250 index at December 31, 2002. The
consolidated financial statements examined for our study are those published for the year
2002.
11
First, the 38 financial and real estate companies were excluded from the sample, as their
account formats are very different from those of the industrial and commercial companies.
Next to be eliminated were six foreign companies which do not mention French GAAP at all
in the reference to a set of accounting standards at the beginning of the notes. These
companies (Adecco, Business Objects, Completel, Lycos Europe, STMicroelectronics, Trader
Classified Media) only apply U.S. GAAP, and we thus considered that they had not made a
real accounting choice but were obliged to use a U.S. format, i.e. balance sheet ‘by term’ and
income statement ‘by function’.
Finally, we faced the problem encountered previously by Raffournier (1995): a few firms
did not disclose a breakdown of sales by geographical area or, when they did, did not provide
figures for sales in France (reporting sales in Europe instead). The following seven companies
were thus withdrawn from the sample: Altadis, Equant, Gemplus International, Michelin,
Schneider Electric, Silicon on Insulator Techs and Zodiac.
Details of determination of the final sample are shown in table 3.
Insert Table 3 about here
Research Design
As stated earlier, the firms in our 199-firm sample that use an alternative format follow either
a policy of fully alternative-format financial reporting (both the income statement and the
balance sheet are in an alternative-format, 36 firms) or a mixed strategy (one and only one
alternative-format financial statement, 32 firms) (see Table 6, Panel A). To fully investigate
the determinants of the presentation of financial statements, we first use a logit model, i.e. we
assume that presentation choices (for the income statement and for the balance sheet) are
independent. We then relax this assumption and consider the two choices as inter-related by
using an ordered logit model.
Logit Model
This study seeks to explain the choice made by French firms as to the balance sheet and
income statement format. As the outcome is categorical (balance sheet ‘by nature’ vs. ‘by
term’, income statement ‘by nature’ vs. ‘by function’), the binary logistic regression model
can be used for our statistical analysis. This method is presented in Hosmer and Lemeshow
(2000).
The logistic regression model can be defined in the following way:
12
)Xexp(
)Xexp()YPr( k
jjj
k
jjj
∑
∑
=
=
++
+==
10
10
11
ββ
ββ (1)
Where:
- Y is a dummy variable which equals 1 if event happens (Probability that a French firm adopts an alternative format [balance sheet or income statement])
- 0β is the coefficient on the constant term
- jβ are the coefficients on the independent variables
- are the independent variables. jX
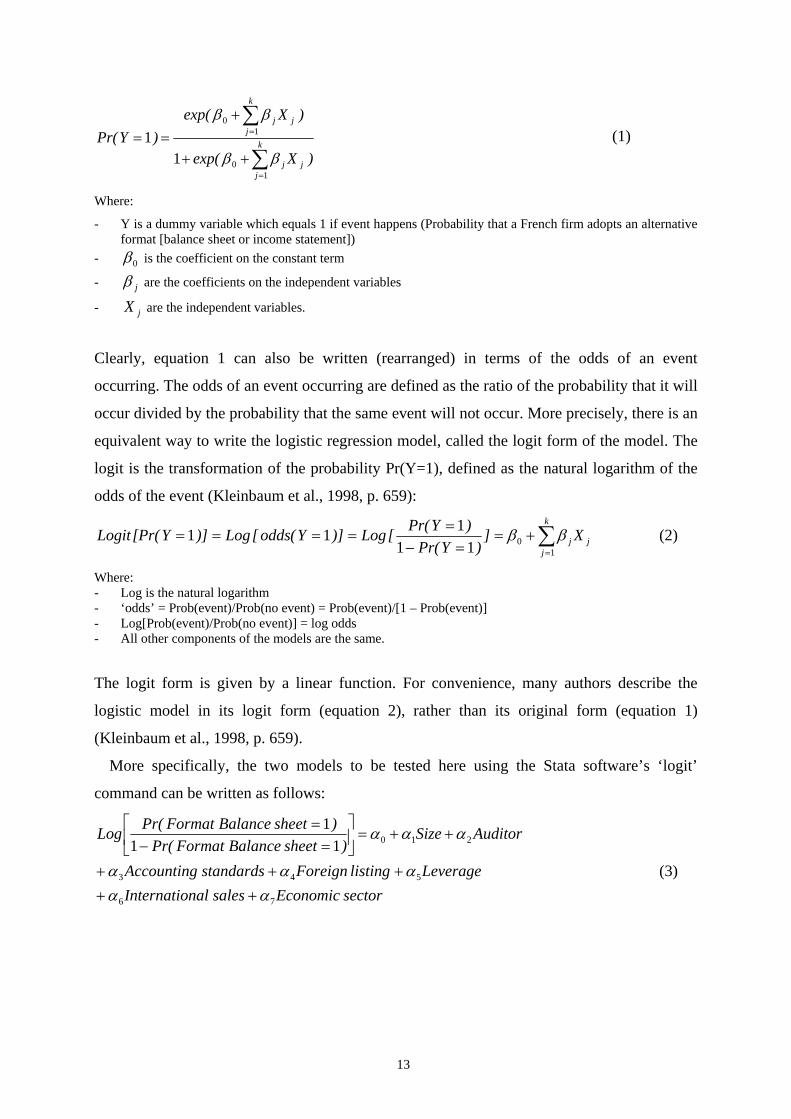
Clearly, equation 1 can also be written (rearranged) in terms of the odds of an event
occurring. The odds of an event occurring are defined as the ratio of the probability that it will
occur divided by the probability that the same event will not occur. More precisely, there is an
equivalent way to write the logistic regression model, called the logit form of the model. The
logit is the transformation of the probability Pr(Y=1), defined as the natural logarithm of the
odds of the event (Kleinbaum et al., 1998, p. 659):
∑=
+==−
=====
k
jjj X]
)YPr()YPr([Log)]Y(odds[Log)]Y[Pr(Logit
1011
111 ββ (2)
Where: - Log is the natural logarithm - ‘odds’ = Prob(event)/Prob(no event) = Prob(event)/[1 – Prob(event)] - Log[Prob(event)/Prob(no event)] = log odds - All other components of the models are the same.
The logit form is given by a linear function. For convenience, many authors describe the
logistic model in its logit form (equation 2), rather than its original form (equation 1)
(Kleinbaum et al., 1998, p. 659).
More specifically, the two models to be tested here using the Stata software’s ‘logit’
command can be written as follows:
sectorEconomic salesnalInternatioLeveragelisting Foreign standardsAccounting
AuditorSize) sheetBalance FormatPr(
) sheetBalance FormatPr(Log
76
543
210111
ααααα
ααα
+++++
++=⎥⎦
⎤⎢⎣
⎡=−
=
(3)
13
sectorEconomic salesnalInternatiolisting Foreign standardsAccounting
AuditorSize) statementIncome FormatPr(
) statementIncome FormatPr(Log
65
43
210111
ββββ
βββ
++++
++=⎥⎦
⎤⎢⎣
⎡=−
=
(4)
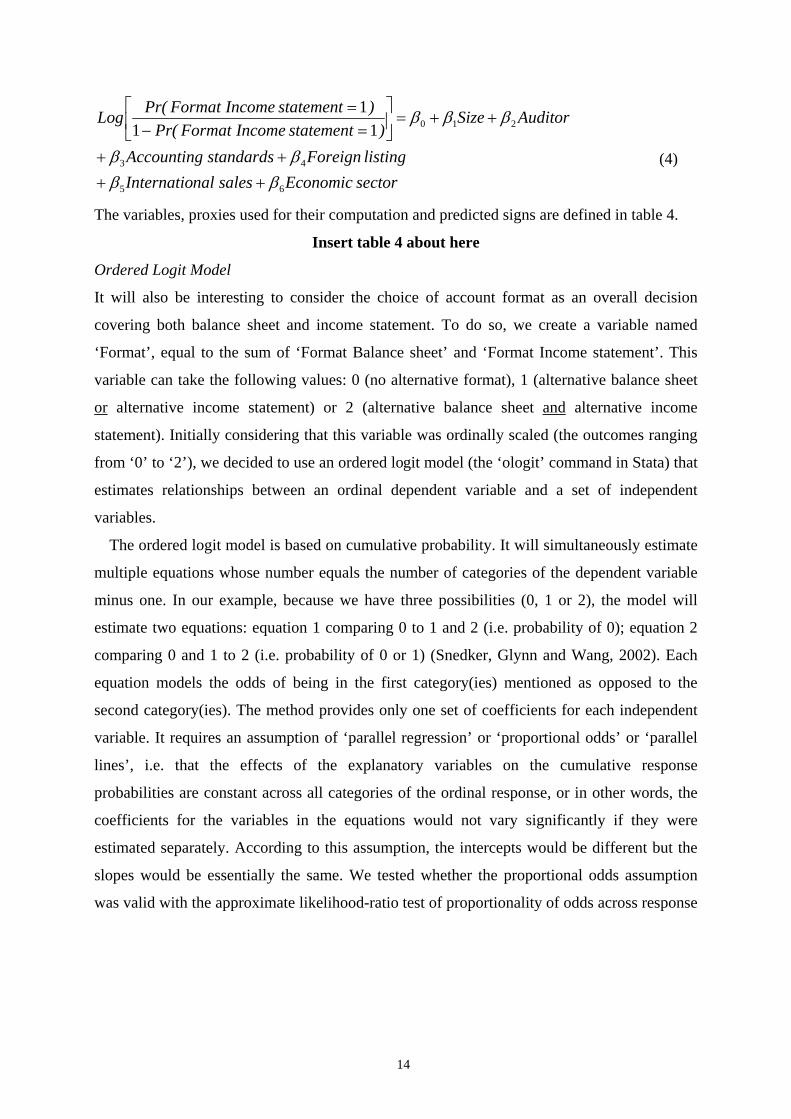
The variables, proxies used for their computation and predicted signs are defined in table 4.
Insert table 4 about here
Ordered Logit Model
It will also be interesting to consider the choice of account format as an overall decision
covering both balance sheet and income statement. To do so, we create a variable named
‘Format’, equal to the sum of ‘Format Balance sheet’ and ‘Format Income statement’. This
variable can take the following values: 0 (no alternative format), 1 (alternative balance sheet
or alternative income statement) or 2 (alternative balance sheet and alternative income
statement). Initially considering that this variable was ordinally scaled (the outcomes ranging
from ‘0’ to ‘2’), we decided to use an ordered logit model (the ‘ologit’ command in Stata) that
estimates relationships between an ordinal dependent variable and a set of independent
variables.
The ordered logit model is based on cumulative probability. It will simultaneously estimate
multiple equations whose number equals the number of categories of the dependent variable
minus one. In our example, because we have three possibilities (0, 1 or 2), the model will
estimate two equations: equation 1 comparing 0 to 1 and 2 (i.e. probability of 0); equation 2
comparing 0 and 1 to 2 (i.e. probability of 0 or 1) (Snedker, Glynn and Wang, 2002). Each
equation models the odds of being in the first category(ies) mentioned as opposed to the
second category(ies). The method provides only one set of coefficients for each independent
variable. It requires an assumption of ‘parallel regression’ or ‘proportional odds’ or ‘parallel
lines’, i.e. that the effects of the explanatory variables on the cumulative response
probabilities are constant across all categories of the ordinal response, or in other words, the
coefficients for the variables in the equations would not vary significantly if they were
estimated separately. According to this assumption, the intercepts would be different but the
slopes would be essentially the same. We tested whether the proportional odds assumption
was valid with the approximate likelihood-ratio test of proportionality of odds across response
14
categories (‘omodel logit’ command in Stata)1 and found that the parallel regression
assumption has been violated, as the chi-square is significant (χ² = 29.92, p-value = 0.0016).
However, independently of the test applied, we have no particular reasons to assume
parallelism. In other words, the factors explaining the transition from 0 to 1 alternative format
are not necessarily the same as those that explain the transition from 1 to 2 alternative
formats.
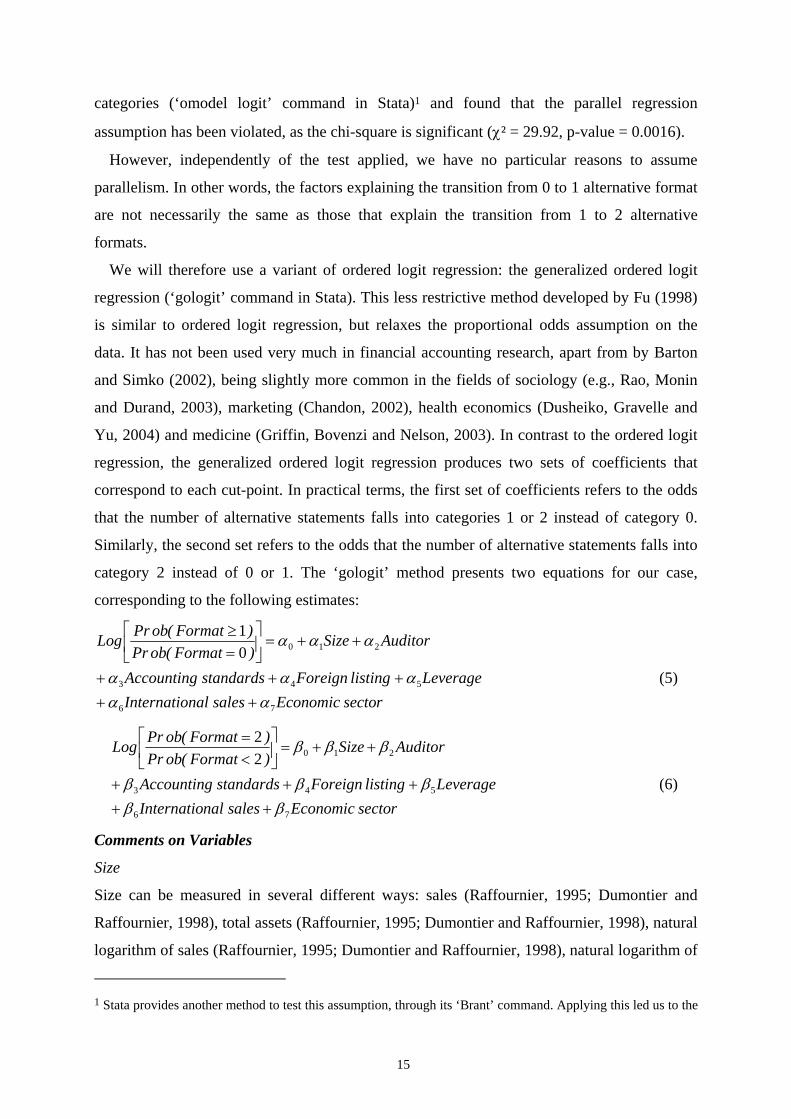
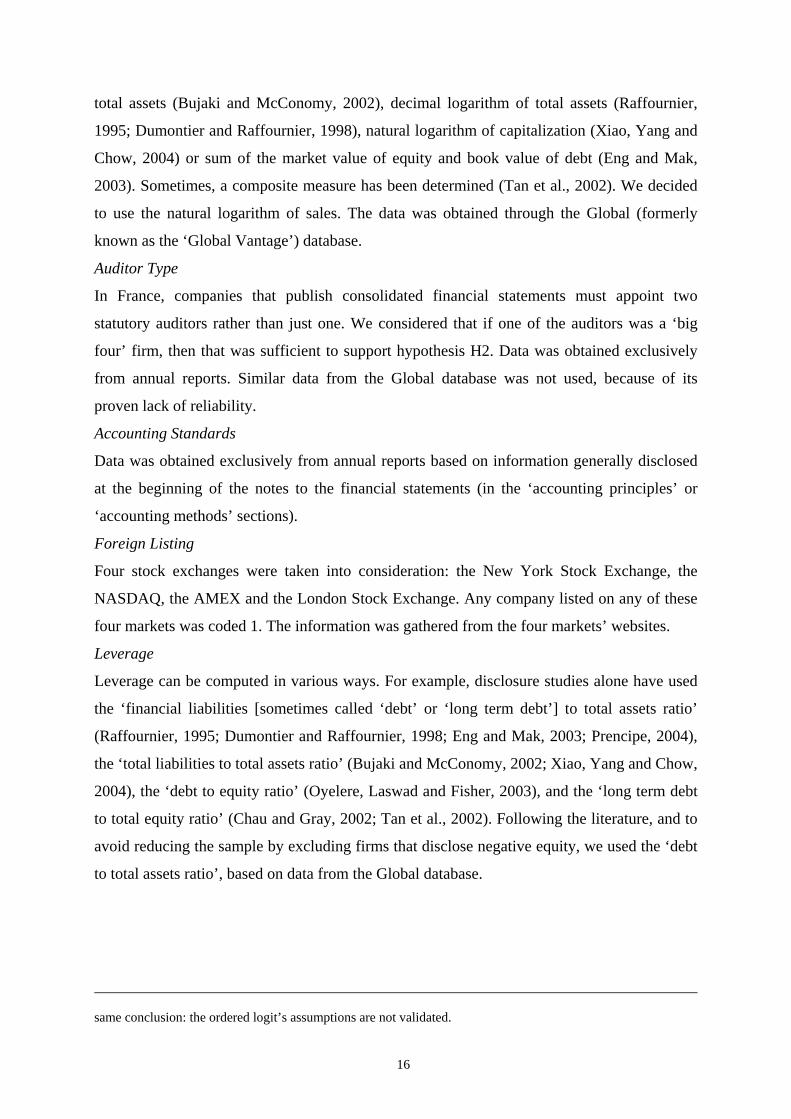
We will therefore use a variant of ordered logit regression: the generalized ordered logit
regression (‘gologit’ command in Stata). This less restrictive method developed by Fu (1998)
is similar to ordered logit regression, but relaxes the proportional odds assumption on the
data. It has not been used very much in financial accounting research, apart from by Barton
and Simko (2002), being slightly more common in the fields of sociology (e.g., Rao, Monin
and Durand, 2003), marketing (Chandon, 2002), health economics (Dusheiko, Gravelle and
Yu, 2004) and medicine (Griffin, Bovenzi and Nelson, 2003). In contrast to the ordered logit
regression, the generalized ordered logit regression produces two sets of coefficients that
correspond to each cut-point. In practical terms, the first set of coefficients refers to the odds
that the number of alternative statements falls into categories 1 or 2 instead of category 0.
Similarly, the second set refers to the odds that the number of alternative statements falls into
category 2 instead of 0 or 1. The ‘gologit’ method presents two equations for our case,
corresponding to the following estimates:
r sectoEconomic salesnalInternatioLeveragelisting Foreign standardsAccounting
AuditorSize) Format(obPr) Format(obPrLog
76
543
21001
ααααα
ααα
+++++
++=⎥⎦
⎤⎢⎣
⎡=≥
(5)
r sectoEconomic salesnalInternatioLeveragelisting Foreign standardsAccounting
AuditorSize) Format(obPr) Format(obPrLog
76
543
21022
βββββ
βββ
+++++
++=⎥⎦
⎤⎢⎣
⎡<=
(6)
Comments on Variables
Size
Size can be measured in several different ways: sales (Raffournier, 1995; Dumontier and
Raffournier, 1998), total assets (Raffournier, 1995; Dumontier and Raffournier, 1998), natural
logarithm of sales (Raffournier, 1995; Dumontier and Raffournier, 1998), natural logarithm of
1 Stata provides another method to test this assumption, through its ‘Brant’ command. Applying this led us to the
15
total assets (Bujaki and McConomy, 2002), decimal logarithm of total assets (Raffournier,
1995; Dumontier and Raffournier, 1998), natural logarithm of capitalization (Xiao, Yang and
Chow, 2004) or sum of the market value of equity and book value of debt (Eng and Mak,
2003). Sometimes, a composite measure has been determined (Tan et al., 2002). We decided
to use the natural logarithm of sales. The data was obtained through the Global (formerly
known as the ‘Global Vantage’) database.
Auditor Type
In France, companies that publish consolidated financial statements must appoint two
statutory auditors rather than just one. We considered that if one of the auditors was a ‘big
four’ firm, then that was sufficient to support hypothesis H2. Data was obtained exclusively
from annual reports. Similar data from the Global database was not used, because of its
proven lack of reliability.
Accounting Standards
Data was obtained exclusively from annual reports based on information generally disclosed
at the beginning of the notes to the financial statements (in the ‘accounting principles’ or
‘accounting methods’ sections).
Foreign Listing
Four stock exchanges were taken into consideration: the New York Stock Exchange, the
NASDAQ, the AMEX and the London Stock Exchange. Any company listed on any of these
four markets was coded 1. The information was gathered from the four markets’ websites.
Leverage
Leverage can be computed in various ways. For example, disclosure studies alone have used
the ‘financial liabilities [sometimes called ‘debt’ or ‘long term debt’] to total assets ratio’
(Raffournier, 1995; Dumontier and Raffournier, 1998; Eng and Mak, 2003; Prencipe, 2004),
the ‘total liabilities to total assets ratio’ (Bujaki and McConomy, 2002; Xiao, Yang and Chow,
2004), the ‘debt to equity ratio’ (Oyelere, Laswad and Fisher, 2003), and the ‘long term debt
to total equity ratio’ (Chau and Gray, 2002; Tan et al., 2002). Following the literature, and to
avoid reducing the sample by excluding firms that disclose negative equity, we used the ‘debt
to total assets ratio’, based on data from the Global database.
same conclusion: the ordered logit’s assumptions are not validated.
16
International Sales
The degree of internationalization has been measured in the past by the exports-on-sales ratio
(Raffournier, 1995) or, for Swiss firms, the percentage of sales realised outside Switerzland
and percentage of sales outside Europe (Dumontier and Raffournier, 1998).
We considered that a good indicator of degree of internationalization would be the ratio of
the percentage of sales outside France to the median percentage sales outside France for the
company’s economic sector overall. It was important to compare companies to their own
sector, as internationalization can be considered as a relative value rather than an absolute
value.
Data was initially obtained from the Infinancials (formerly known as Eurofinancials)
database. Given the number of missing data (for 44 firms), annual reports were then consulted
to complete the sample. Unfortunately, it was not possible to determine sales in France for
seven firms (see above, Sample determination).
Economic Sector
The economic sector is defined as the leftmost two digits of the company’s Primary Global
Industry Classification Standard (GICS) code at fiscal year-end. Data is available in the
Global database. In total, there are 10 Economic Sectors. Table 5 lists these sectors.
Insert Table 5 about here
As mentioned above in the sample description, we excluded financial companies (GICS
code 40). This left nine sectors. A table (not reported) crossing the number of companies in
each sector with the three categories of the ‘Format’ variable shows that some sectors contain
very few firms, or even none at all in certain categories of the variable. We therefore decided
to group sector 10 (‘Energy’) together with 55 (‘Utilities’) (naming the new sector ‘Energy’),
sector 25 (‘Consumer discretionary’) with 30 (‘Consumer staples’) (new sector: ‘Consumer’)
and sector 45 (‘Information technology’) with 50 (‘Telecommunication services’) (new
sector: ‘Information technology’). There were now six sectors2. We then applied the
regression to all but the ‘Industrial’ sector (GICS code 20) which of the six displayed the
lowest frequency of companies publishing two alternative formats – code 2 for the ‘Format’
variable. In a regression concerning a variable that can take several categories (such as
economic sector), the variable must be broken down into a number of indicator (binary)
variables equal to the number of categories less one. The category withdrawn then provides a
benchmark and the coefficients are interpreted in relation to that benchmark.
2 We performed other groupings of sectors and noticed no change in the statistical results.
17
EMPIRICAL FINDINGS
Descriptive Statistics and Univariate Tests
Descriptive Statistics and Normality Tests
Table 6 provides descriptive statistics on independent variables. Panel A provides evidence of
the absence of a link between the choice of alternative balance sheet and an alternative
income statement. This finding is somewhat surprising: while the choice of fully alternative-
format financial reporting can be easily understood, mixed strategies (one and only one
alternative-format financial statement) are less straightforward.
Insert Table 6 about here
Univariate Tests
A Skewness-Kurtosis joint test on the normality assumption of the independent continuous
variables was applied (see Table 6, Panel B). We also applied a Shapiro-Wilk test for
normality and found consistent results. These tests show that the ‘Leverage’ and ‘International
sales’ variables violate the normality assumption at the 0.01 level. Consequently, when we
wanted to see if the continuous variables were different depending on whether the standard or
alternative format was used for the balance sheet or income statement, we decided to apply
the non-parametric Mann-Whitney U-test to these variables. The Student t-test was used for
size. For dichotomous explanatory variables (‘Auditor’, ‘Accounting standards’ and ‘Foreign
Listing’), we used the chi-square test.
Table 7 summarizes the results obtained when comparing firms which adopt an alternative
format for the balance sheet (Panel A) or income statement (Panel B) to those which do not.
Insert Table 7 about here
As table 7 shows, all our hypotheses are validated on the basis of univariate tests, except for
H5 concerning leverage for the Format Balance sheet. There is a significant difference
between companies that use an alternative format and those that do not for ‘Size’ (significant
at the 0.05 level for Balance sheet and 0.01 level for Income statement), and for ‘Auditor’
(H2), ‘Accounting standards’ (H3), ‘Foreign listing’ (H4), ‘International sales’ (H6): all
significant at the 0.01 level for both documents.
Multicollinearity
We established a correlation matrix between the six independent variables (not reported) and
no multicollinearity problem was identified. To confirm this absence of multicollinearity, we
calculated the VIF for the same variables. The VIF measures the degree to which each
explanatory variable is explained by the other explanatory variables. Traditionally,
18
collinearity is not considered to be a problem when the VIF does not exceed 10 (Neter,
Wasserman and Kutner, 1983). In this case (results not tabulated), all the VIFs are lower than
1.5 and the absence of multicollinearity is confirmed.
Multivariate Analysis
Logit Regression
As stated earlier in the ‘research design’ section, we first carried out a logit regression of the
independent variable ‘Format Balance sheet’ on the following dependent variables: ‘Size’,
‘Auditor’, ‘Accounting standards’, ‘Foreign listing’, ‘Leverage’, ‘International sales’ and
‘Economic sector’. We then applied a second logit regression of the independent variable
‘Format Income statement’ on the same dependent variables (excluding ‘Leverage’). Results
for both regressions are presented in Table 8 (Panel A for ‘Format Balance sheet’ and Panel B
for ‘Format Income statement’).
Insert Table 8 about here
The first thing to observe is that the p-value associated with the chi-square of each model is
lower than 0.01. Both models are statistically significant overall. The R-square, for technical
reasons, cannot be computed the same way in logit regression as it is in OLS regression. We
disclose the R-square as defined by Nagelkerke (1991) because this measure is widely used in
practice and often reported in statistical software such as Stata or SPSS3. The resulting R-
squares are relatively high, which is satisfactory. Finally, this model fits the data well if the
Hosmer and Lemeshow test is not significant (significance level of the chi-square statistic:
higher than 0.05). Here, the Hosmer and Lemeshow summary goodness-of-fit statistic
indicates good overall fit (for the balance sheet: χ² = 8.84, 8 df, p-value = 0.3560, for the
income statement: χ² = 4.46, 8 df, p-value = 0.8132).
The logit regression coefficients indicate the amount of change expected in the log odds
when there is a one-unit change in the predictor variable, with all of the other variables in the
model held constant. A coefficient close to zero suggests that there is no change due to the
predictor variable. Column z contains the z-statistic testing the logistic coefficient. In the
Stata ‘logit’ command, z equals the coefficient divided by the standard error (not displayed in
Table 8). The ‘p’ column contains the two-tailed p-value for the z-test.
Table 8 shows that several variables have a positive influence on adoption of an alternative
(‘by term’) balance sheet format: ‘Auditor’ (at the 0.05 level), ‘Accounting standards’ (at the
3 The Nagelkerke R-square is computed in Stata with the ‘fitstat’ command but appears under the name of Cragg & Uhler’s R-square.
19
0.01 level), and ‘Foreign listing’ (at the 0.01 level). Sector has no impact on the choice of an
alternative format. ‘Size’, ‘Leverage’ and ‘International sales’ do not appear to be
significantly related to the adoption of an alternative balance sheet format.
Turning to the income statement, several variables are significantly correlated with the
outcome: ‘Auditor’ (at the 0.05 level), ‘Accounting standards’ (at the 0.10 level), ‘Foreign
listing’ (at the 0.01 level) and ‘International sales’ (at the 0.01 level). These are almost the
same variables as those identified for the balance sheet, but with different significance levels.
One sector seems to have a positive influence on the choice (compared to ‘Industrial’):
‘Information technology’ (at the 0.05 level).
Generalized Ordered Logit Regression
Table 9 shows the results of this regression.
Insert Table 9 about here
The first equation (Panel A) shows that several variables can explain firms’ decisions to opt
for at least one alternative format. The following variables are positively significant:
‘Accounting standards’ and ‘Foreign listing’ (both at the 0.01 level), ‘Auditor’ (at the 0.05
level) and ‘International sales’ (at the 0.10 level). No economic sector has any impact. The
second equation (Panel B) provides further enlightenment on the distinguishing features of
companies that ‘go fully-alternative’. For instance, ‘Size’ emerges for the first time (at the
0.05 level), and ‘International sales’ is even more significant (now at the 0.05 level). The
‘Accounting standards’ variable no longer plays a role. Three economic sectors also emerge
as positively influencing the decision to adopt two alternative formats: ‘Materials’ (influence
compared to the ‘Industrial’ benchmark sector, significant at the 0.10 level), ‘Health care’
(significant at the 0.5 level), and ‘Information technology (significant at the 0.01 level).
Comparing these two equations, it can be surmised that the decision to use at least one
alternative format (Panel A) corresponds to financial internationalization (‘Accounting
standards’, ‘Auditor’ and ‘Foreign listing’), while being ‘fully-alternative’ (Panel B) is more
related to ‘commercial’ internationalization (the ‘Size’ and ‘International sales’ variables).
Additional Tests
So far, we have considered the three outcomes of the ‘format’ variable as ordered.
We will now use another extension of the binary logit regression called multinomial (or
polytomous) logit regression (‘mlogit’ command of Stata). This method assumes that even
though the outcomes are coded 0, 1 and 2, the numerical values are arbitrary. This regression
can be thought of as simultaneously estimating binary logits for all comparisons among the
dependent categories (Snedker, Glynn and Wang, 2002). But these binary logits include
20
redundant information. Consequently, with J outcomes, only J-1 binary logits need to be
estimated by comparison to a baseline category. Further statistical explanations can be found
in Long and Freese (2003). In the present case, we can run a multinomial regression taking
the category 0 as baseline. Categories 1 and 2 will each be respectively compared to category
0. It emerges that in contrast to the ordered logit regression, the comparison group here
remains the same (outcome 0), and is not a moving baseline.
The multinomial logit regression requires several quality assessment tests (Rao, Monin and
Durand, 2003). First, the method makes an assumption known as the ‘independence of
irrelevant alternatives’ (IIA) (Long and Freese, 2003, p. 207) which means that the odds do
not depend on other possible outcomes. In this sense, these alternative outcomes are
‘irrelevant’. Adding or deleting outcomes does not affect the odds for the remaining
outcomes. This assumption can be tested with the Hausman test available in the Spost
estimation commands of Stata (‘mlogtest’ command). Then we must see whether the
outcomes (categories) should be pooled and treated as identical because the coefficients do
not differ (Rao, Monin and Durand, 2003, p. 826). In other words, we will test whether the
outcomes are indistinguishable. We will perform a likelihood-ratio tests for combining
outcome categories (Long and Freese, 2003, p. 203).
The output from the multinomial regression is divided into two panels (see Table 10). The
first panel is labelled ‘A Alternative balance sheet or income statement’ which is the value
label for the second outcome of the dependent variable. The second panel is labelled ‘B
Alternative balance sheet and income statement’, which corresponds to the third outcome. In
this case, the comparison (or baseline) group is the outcome 0 (no alternative statement). In
other words, each panel represents the coefficients from the comparison of each outcome with
0. We chose the 0 category for two reasons:
- it is the most frequent category in the estimation sample
- we are interested in why French firms choose an alternative format.
Insert Table 10 about here
We conducted the Hausman test for independence of irrelevant alternatives and found that the
odds were not influenced by the numbers of categories present. We also performed a
likelihood-ratio test for combining outcome categories and found that the outcomes were
significantly different from each other (p-values ranging from 0.00 to 0.05, according to the
tested pair of outcome categories).
21
The figures reported in table 10 (coefficients, ‘z’ and ‘p’) are interpreted in the same way as
the logit regression earlier. The model is significant overall (p-value of the chi-square =
0.000) and the Nagelkerke R-square is satisfactory (0.471).
If we concentrate on panel A, concerning the decision to use an alternative financial
statement format (for either the balance sheet or income statement), the following variables
appear to have a significant influence on outcome: ‘Accounting standards’ (at the 0.01 level)
and ‘Auditor’ and ‘Foreign listing’ (both at the 0.10 level). If we concentrate on panel B and
the decision to use the alternative format for both statements as opposed to continuing with
the French format (comparison group), a greater number of variables emerges: ‘Foreign
listing’ (at the 0.01 level), and ‘Auditor’, ‘Accounting standards’, and ‘International sales’ (at
the 0.05 level). Concerning the economic sectors, the ‘Materials’ and ‘Information
technology’ sectors have a significant positive impact (at the 0.10 and 0.05 levels
respectively).
The multinomial logit regression confirms the earlier analysis based on generalized ordered
logit regression: the decision to use one alternative format corresponds to financial
internationalization (‘Accounting standards’, ‘Auditor’ and ‘Foreign listing’), whereas using
two alternative formats corresponds to financial and commercial internationalization (given
the presence of the ‘International sales’ variable).
LIMITATIONS AND FUTURE RESEARCH
One limitation of our study is the fact that the data analyzed only covers one year (2002). As a
consequence, the scope of the study does not encompass any changes made by firms in their
financial statement format. In future studies, it would be interesting to explore the
determinants of these changes, such as a change in management team or a transformation of
ownership structure. But many determinant studies (Dumontier and Raffournier, 1998;
Entwistle, 1999; Percy, 2000; Rowbottom, 2002) refer to a single year. The explanatory
power of these one-year determinant studies is no lower, since the sample observations for
this type of study vary very little from one year to the next. The focus of determinant studies
is always on strategic accounting decisions that companies apply continuously, for several
reasons. Firstly, the consistency principle is applied worldwide: firms need a credible reason
to justify any change in accounting policies. Secondly, auditors keep watch over the
continuity of their clients’ methods: any change must be mentioned in the audit report. We
therefore believe that the result of our study using data for 2002 would not be significantly
affected by the addition of one or two more years’ data.
22
Another limitation of our paper is the lack of tested determinants concerning the corporate
governance aspects of the firm because of data unavailability. However, if we assume that the
presence of foreign shareholders may encourage adoption of an alternative format, this factor
is at least partially captured by the ‘Foreign listing’ and ‘Accounting standards’ variables
included in our study.
Finally, we should mention one promising area of research: the effects of the choice of
format on user opinion. In this vein, Maines and McDaniel (2000) have used a psychology-
based framework to study the effects of comprehensive-income format on nonprofessional
investors’ judgments.
CONCLUSION
In this study, we look into the adoption of alternative financial statement formats by large
French listed firms. Our results confirm that opting for one or two alternative formats is
related to internationalization, both financial (auditor type, foreign listing and the decision to
apply alternative accounting standards) and commercial (the role of size and the
internationalization of sales).
We believe that this topic will remain pertinent even after the adoption of the IAS/IFRS in
Europe in 2005, since the revised IAS 1 (IASB, 2003) does not impose one specific financial
statement format. Anecdotal evidence actually suggests that the increasing
internationalization of European and Asian companies will bring about an even wider variety
of financial statement formats in their countries. In China for example, after the accounting
reform in 1992, an American-style balance sheet and income statement format were adopted
in the Middle Kingdom. But with the growing number of companies listed in Hong Kong and
Singapore, certain British financial statement formats have also found their way into Chinese
firms, and some Chinese airlines (principally China Eastern Airlines), now listed in New
York, imitate the practices of their U.S. counterparts by publishing an income statement
presented ‘by nature’.
Meanwhile, the introduction of IAS/IFRS in Europe in 2005 will certainly bring European
companies to focus more attention on alternative accounting practices. Once these
international standards have been implemented, it will be interesting to see whether there is an
increase in the number of firms adopting alternative financial statement formats (which is not
compulsory under the new accounting regulations).
23
REFERENCES
Archambault, J. J. and M. E. Archambault, 'A Multinational Test of Determinants of Corporate Disclosure', The International Journal of Accounting, Vol. 38, No. 2, 2003.
Barton, J. and P. J. Simko, 'The Balance Sheet as an Earnings Management Constraint', The Accounting Review, Vol. 77, Supplement, 2002.
Biddle, G. C. and S. M. Saudagaran, 'Foreign Stock Listings: Benefits, Costs, and the Accounting Policy Dilemma', Accounting Horizons, Vol. 5, No. 3, 1991.
Bujaki, M. and B. J. McConomy, 'Corporate Governance: Factors Influencing Voluntary Disclosure by Publicly Traded Canadian Firms', Canadian Accounting Perspectives, Vol. 1, No. 2, 2002.
Chandon, P., 'Do we Know what we Look at? An Eye-Tracking Study of Visual Attention and Memory for Brands at the Point of Purchase', Working paper, 2002/60/MKT, Insead, 2002.
Chau, G. K. and S. J. Gray, 'Ownership Structure and Corporate Voluntary Disclosure in Hong Kong and Singapore', The International Journal of Accounting, Vol. 37, No. 2, 2002.
COB, Annual report, Commission des opérations de bourse, 1995. COB, Bulletin of the Commission des opérations de bourse, Vol. 321, February, 1998. Cooke, T. E., 'Disclosure in the Corporate Annual Reports of Swedish Companies', Accounting and Business
Research, Vol. 19, No. 74, 1989. Cooke, T. E., 'The Impact of Size, Stock Market Listing and Industry Type on Disclosure in the Annual Reports
of Japanese Listed Corporations', Accounting and Business Research, Vol. 22, No. 87, 1992. Craswell, A. T. and S. L. Taylor, 'Discretionary Disclosure of Reserves by Oil and Gas Companies', Journal of
Business Finance & Accounting, Vol. 19, No. 2, 1992. Debreceny, R., G. L. Gray and A. Rahman, 'The Determinants of Internet Financial Reporting', Journal of
Accounting and Public Policy, Vol. 21, No. 4-5, 2002. Depoers, F., 'A Cost Benefit Study of Voluntary Disclosure: Some Empirical Evidence from French Listed
Companies', European Accounting Review, Vol. 9, No. 2, 2000. Ding, Y., H. Stolowy and M. Tenenhaus, '"Shopping Around" for Accounting Practices: the Financial Statement
Presentation of French Groups', Abacus, Vol. 39, No. 1, 2003. DOT, Uniform System of Accounts and Reports for Large Certificated Air Carriers, Department of
Transportation, http://www.bts.gov/lawlib/docs/Part241cy2000.pdf, Washington, D.C., 2002. Dumontier, P. and B. Raffournier, 'Why Firms Comply Voluntarily with IAS: An Empirical Analysis with Swiss
Data', Journal of International Financial Management and Accounting, Vol. 9, No. 3, 1998. Dumontier, P. and B. Raffournier, 'Vingt ans de recherche positive en comptabilité financière', Comptabilité -
Contrôle - Audit, Supplement: 'Les vingt ans de l'AFC', 1999. Dumontier, P. and B. Raffournier, 'Accounting and Capital Markets: A Survey of the European Evidence',
European Accounting Review, Vol. 11, No. 1, 2002. Dusheiko, M., H. Gravelle and N. Yu, 'The Impact of Budgets for Gatekeeping Physicians on Patient
Satisfaction: Evidence from Fundholding', CHE Technical Paper Series 30, The University of York - Centre for Health Economics, 2004.
Eng, L. L. and Y. T. Mak, 'Corporate Governance and Voluntary Disclosure', Journal of Accounting and Public Policy, Vol. 22, No. 4, 2003.
Entwistle, G. M., 'Exploring the R&D Disclosure Environment', Accounting Horizons, Vol. 13, No. 4, 1999. Fields, T. D., T. Z. Lys and L. Vincent, 'Empirical Research on Accounting Choice', Journal of Accounting and
Economics, Vol. 31, No. 1-3, 2001. Fjeld, E. I., 'Balance-Sheet Form and Classification in Corporate Reports', The Accounting Review, Vol. 11, No.
3, 1936a. Fjeld, E. I., 'Classification and Terminology of Individual Balance-Sheet Items', The Accounting Review, Vol.
11, No. 4, 1936b. Fu, V. K., 'Estimating Generalized Ordered Logit Models', Stata Technical Bulletin Reprints, Vol. 8, 1998. Giner, B., 'The Influence of Company Characteristics and Accounting Regulation on Information Disclosed by
Spanish Firms', European Accounting Review, Vol. 16, No. 1, 1997. Griffin, M. J., M. Bovenzi and C. M. Nelson, 'Dose-Response Patterns for Vibration-Induced White Finger',
Occupational & Environmental Medecine, Vol. 60, 2003. Hagerman, R. L. and M. E. Zmijewski, 'Some Economic Determinants of Accounting Policy Choice', Journal of
Accounting and Economics, Vol. 1, No. 2, 1979. Hall, S. C., 'Determinants of Goodwill Amortization Period', Journal of Business Finance & Accounting, Vol.
20, No. 4, 1993. Hirshleifer, D. and S. H. Teoh, 'Limited Attention, Information Disclosure, and Financial Reporting', Journal of
Accounting and Economics, Vol. 36, No. 1-3, 2003.
24
Hosmer, D. W. and S. Lemeshow, Applied Logistic Regression, John Wiley and Sons, New York, 2nd edition, 2000.
Hossain, M., M. H. B. Perera and A. R. Rahman, 'Voluntary Disclosure in the Annual Reports of New Zealand Companies', Journal of International Financial Management and Accounting, Vol. 6, No. 1, 1995.
IASB, International Accounting Standard (IAS) No. 1: Presentation of Financial Statements (Revised), International Accounting Standards Board, London, 2003.
Inoue, T. and W. Thomas, 'The Choice of Accounting Policy In Japan', Journal of International Financial Management and Accounting, Vol. 7, No. 1, 1996.
Jensen, M. and W. Meckling, 'Theory of the Firm: Managerial Behavior, Agency Costs and Ownership Structure', Journal of Financial Economics, Vol. 3, No. 4, 1976.
Kleinbaum, D. G., L. L. Kupper, K. E. Muller and A. Nizam, Applied Regression Analysis and Other Multivariate Methods, Thomson, Pacific Grove, 1998.
Kuo, H. C., 'How Do Small Firms Make Inventory Accounting Choices?' Journal of Business Finance & Accounting, Vol. 20, No. 3, 1993.
Long, J. S. and J. Freese, Regression Models for Categorical Dependent Variables Using Stata, Stata Press, Revised edition, 2003.
Maines, L. A. and L. S. McDaniel, 'Effects of Comprehensive-Income Characteristics on Nonprofessional Investors' Judgments: The Role of Financial-Statement Presentation Format.' The Accounting Review, Vol. 75, No. 2, 2000.
Marston, C. L. and P. Robson, 'Financial Reporting in India: Changes in Disclosure over the Period 1982 to 1990', Asia-Pacific Journal of Accounting, Vol. 4, No. 1, 1997.
Meek, G. K., C. B. Roberts and S. J. Gray, 'Factors Influencing Voluntary Annual Report Disclosures by U.S., U.K. and Continental European Multinational Corporations', Journal of International Business Studies, Vol. 26, No. 3, 1995.
Missonier-Piera, F., 'Economic Determinants of Multiple Accounting Method Choices in a Swiss Context', Journal of International Financial Management and Accounting, Vol. 15, No. 2, 2004.
Muller III, K. A., 'An Examination of the Voluntary Recognition of Acquired Brand Names in the United Kingdom', Journal of Accounting and Economics, Vol. 26, No. 1-3, 1999.
Nagelkerke, N. J. D., 'A Note on a General Definition of the Coefficient of Determination', Biometrika, Vol. 78, No. 3, 1991.
Neter, J., W. Wasserman and M. Kutner, Applied Linear Regression Models, Irwin, Homewood, 1983. Oyelere, P., F. Laswad and R. Fisher, 'Determinants of Internet Financial Reporting by New Zealand
Companies', Journal of International Financial Management and Accounting, Vol. 14, No. 1, 2003. Patton, J. and I. Zelenka, 'An Empirical Analysis of the Determinants of the Extent of Disclosure in Annual
Reports of Joint Stock Companies in the Czech Republic', European Accounting Review, Vol. 6, No. 4, 1997.
Percy, M., 'Financial Reporting Discretion and Voluntary Disclosure: Corporate Research and Development Expenditure in Australia', Asia-Pacific Journal of Accounting and Economics, Vol. 7, No. 1, 2000.
Prencipe, A., 'Proprietary Costs and Determinants of Voluntary Segment Disclosure: Evidence from Italian Listed Companies', European Accounting Review, Vol. 13, No. 2, 2004.
Raffournier, B., 'The Determinants of Voluntary Financial Disclosure by Swiss Listed Companies', European Accounting Review, Vol. 4, No. 2, 1995.
Rao, H., P. Monin and R. Durand, 'Institutional Change in Toque Ville: Nouvelle Cuisine as an Identity Movement in French Gastronomy', American Journal of Sociology, Vol. 108, No. 4, 2003.
Rowbottom, N., 'The Application of Intangible Asset Accounting and Discretionary Policy Choices in the UK Football Industry', British Accounting Review, Vol. 34, No. 4, 2002.
Saudagaran, S. M. and G. C. Biddle, 'Foreign Listing Location: A Study of MNCs and Stock Exchanges in Eight Countries', Journal of International Business Studies, Vol. 26, No. 2, 1995.
Scott, W. R., Financial Accounting Theory, Pearson Education Canada, Toronto, 3rd edition, 2003. Singhvi, S. and H. Desai, 'An Empirical Analysis of the Quality of Corporate Financial Disclosure', The
Accounting Review, Vol. 46, No. 1, 1971. Snedker, K., P. Glynn and C. Wang, 'Ordered/ordinal Logistic Regression with SAS and Stata',
http://staff.washington.edu/~glynn/olr.pdf, University of Washington, 2002. Spence, M., 'Job Market Signaling', Quarterly Journal of Economics, Vol. 87, No. 3, 1973. Stolowy, H. and Y. Ding, 'Regulatory Flexibility and Management Opportunism in the Choice of Alternative
Accounting Standards: An Illustration Based on Large French Groups', The International Journal of Accounting, Vol. 38, No. 2, 2003.
Stolowy, H. and M. Lebas, Corporate Financial Reporting : A Global Perspective, Thomson, London, 2002. Tan, C. W., G. Tower, P. Hancock and R. Taplin, 'Empires of the Sky: Determinants of Global Airlines'
Accounting-Policy Choices', The International Journal of Accounting, Vol. 37, No. 3, 2002.
25
Wallace, R. S. O. and K. Naser, 'Firm-Specific Determinants of Comprehensiveness of Mandatory Disclosure in the Corporate Annual Reports of Firms Listed on the Stock Exchange of Hong Kong', Journal of Accounting and Public Policy, Vol. 14, No. 4, 1995.
Watts, R. and J. Zimmerman, 'Towards a Positive Theory of the Determination of Accounting Standards', The Accounting Review, Vol. 53, No. 1, 1978.
Watts, R. L. and J. L. Zimmerman, Positive Accounting Theory, Prentice-Hall, Englewood Cliffs, 1986. X, Méthodologie relative aux comptes consolidés - arrêté du 9 décembre 1986 (Methodology relating to
consolidated accounts - Arrêté of December 9, 1986), National Accounting Council, Paris, 1986. X, Plan comptable général 1999 - Arrêté du 22 juin 1999 portant homologation du règlement 99-03 du 29 avril
1999 du Comité de la réglementation comptable (General accounting plan 1999 - Arrêté of June 22, 1999, approving the regulation No. 99-03 of April 29, 1999, of the Accounting Regulation Committee), Accounting Regulation Committee, Paris, 1999a.
X, Règles et méthodes relatives aux comptes consolidés, Arrêté du 22 juin 1999 portant homologation du règlement 99-02 du 29 avril 1999 du Comité de la réglementation comptable (Rules and methods relating to consolidated accounts - Arrêté of June 22, 1999, approving the regulation No. 99-02 of April 29, 1999, of the Accounting Regulation Committee), Accounting Regulation Committee, Paris, 1999b.
Xiao, J. Z., H. Yang and C. W. Chow, 'The Determinants and Characteristics of Voluntary Internet-Based Disclosures by Listed Chinese Companies', Journal of Accounting and Public Policy, Vol. 23, No. 3, 2004.
Zarzeski, M. T., 'Spontaneous Harmonization Effects of Culture and Market Forces on Accounting Disclosure Practices', Accounting Horizons, Vol. 10, No. 1, 1996.
Zimmer, I., 'Accounting for Interest by Real Estate Developers', Journal of Accounting and Economics, Vol. 8, No. 1, 1986.
26
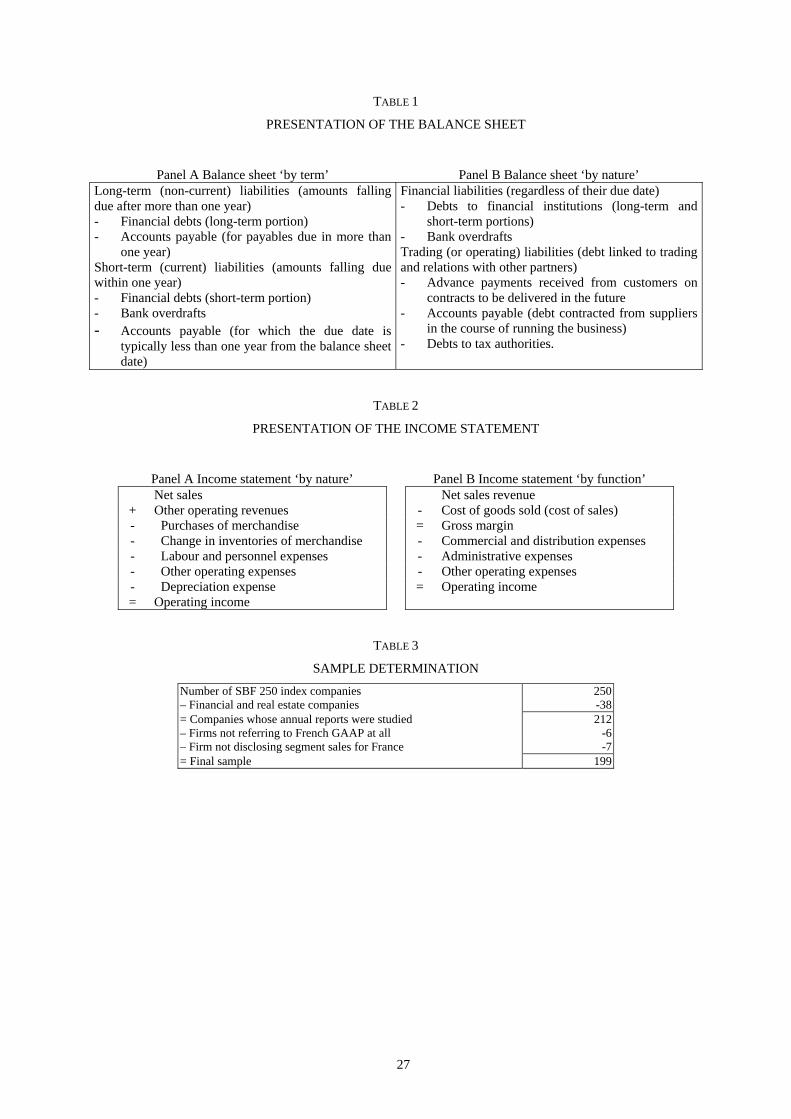
TABLE 1
PRESENTATION OF THE BALANCE SHEET
Panel A Balance sheet ‘by term’ Panel B Balance sheet ‘by nature’
Long-term (non-current) liabilities (amounts falling due after more than one year) - Financial debts (long-term portion) - Accounts payable (for payables due in more than
one year) Short-term (current) liabilities (amounts falling due within one year) - Financial debts (short-term portion) - Bank overdrafts - Accounts payable (for which the due date is
typically less than one year from the balance sheet date)
Financial liabilities (regardless of their due date) - Debts to financial institutions (long-term and
short-term portions) - Bank overdrafts Trading (or operating) liabilities (debt linked to trading and relations with other partners) - Advance payments received from customers on
contracts to be delivered in the future - Accounts payable (debt contracted from suppliers
in the course of running the business) - Debts to tax authorities.
TABLE 2
PRESENTATION OF THE INCOME STATEMENT
Panel A Income statement ‘by nature’ Panel B Income statement ‘by function’
Net sales Net sales revenue + Other operating revenues - Cost of goods sold (cost of sales) - Purchases of merchandise = Gross margin - Change in inventories of merchandise - Commercial and distribution expenses - Labour and personnel expenses - Administrative expenses - Other operating expenses - Other operating expenses - Depreciation expense = Operating income = Operating income
TABLE 3
SAMPLE DETERMINATION
Number of SBF 250 index companies 250 – Financial and real estate companies -38 = Companies whose annual reports were studied 212 – Firms not referring to French GAAP at all -6 – Firm not disclosing segment sales for France -7 = Final sample 199
27
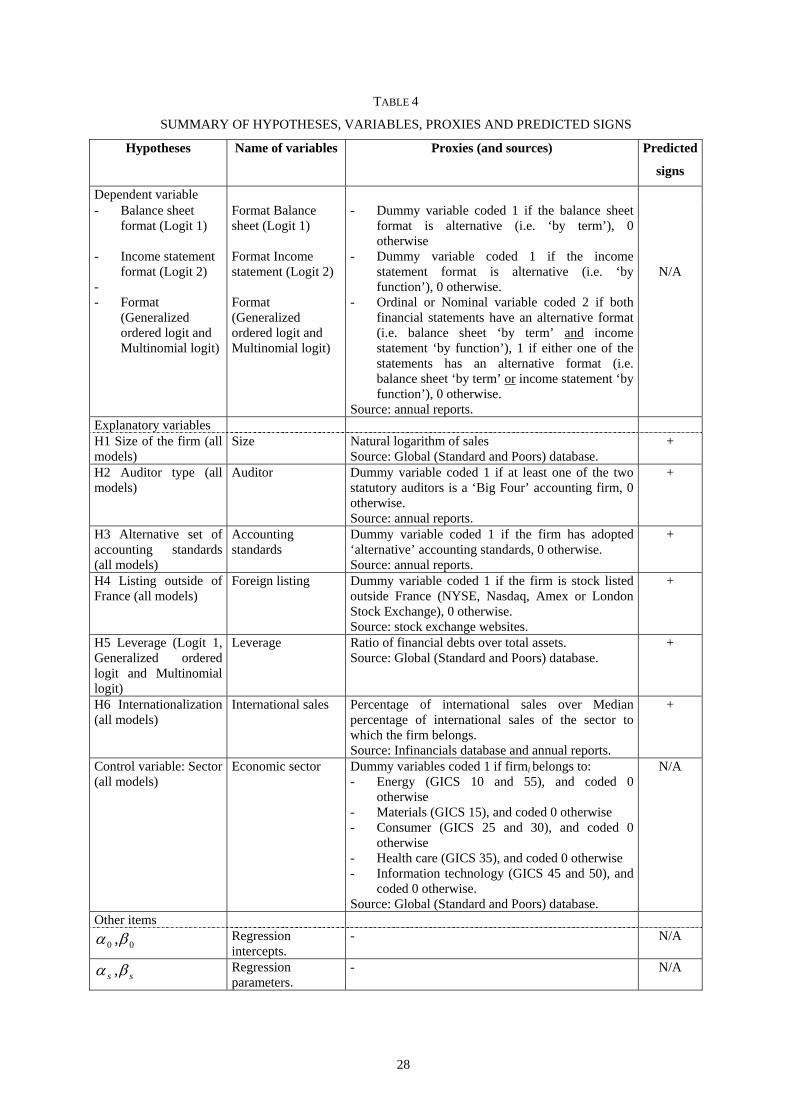
TABLE 4
SUMMARY OF HYPOTHESES, VARIABLES, PROXIES AND PREDICTED SIGNS
Hypotheses Name of variables Proxies (and sources) Predicted
signs
Dependent variable - Balance sheet
format (Logit 1) - Income statement
format (Logit 2) - - Format
(Generalized ordered logit and Multinomial logit)
Format Balance sheet (Logit 1) Format Income statement (Logit 2) Format (Generalized ordered logit and Multinomial logit)
- Dummy variable coded 1 if the balance sheet format is alternative (i.e. ‘by term’), 0 otherwise
- Dummy variable coded 1 if the income statement format is alternative (i.e. ‘by function’), 0 otherwise.
- Ordinal or Nominal variable coded 2 if both financial statements have an alternative format (i.e. balance sheet ‘by term’ and income statement ‘by function’), 1 if either one of the statements has an alternative format (i.e. balance sheet ‘by term’ or income statement ‘by function’), 0 otherwise.
Source: annual reports.
N/A
Explanatory variables H1 Size of the firm (all models)
Size Natural logarithm of sales Source: Global (Standard and Poors) database.
+
H2 Auditor type (all models)
Auditor Dummy variable coded 1 if at least one of the two statutory auditors is a ‘Big Four’ accounting firm, 0 otherwise. Source: annual reports.
+
H3 Alternative set of accounting standards (all models)
Accounting standards
Dummy variable coded 1 if the firm has adopted ‘alternative’ accounting standards, 0 otherwise. Source: annual reports.
+
H4 Listing outside of France (all models)
Foreign listing Dummy variable coded 1 if the firm is stock listed outside France (NYSE, Nasdaq, Amex or London Stock Exchange), 0 otherwise. Source: stock exchange websites.
+
H5 Leverage (Logit 1, Generalized ordered logit and Multinomial logit)
Leverage Ratio of financial debts over total assets. Source: Global (Standard and Poors) database.
+
H6 Internationalization (all models)
International sales Percentage of international sales over Median percentage of international sales of the sector to which the firm belongs. Source: Infinancials database and annual reports.
+
Control variable: Sector (all models)
Economic sector Dummy variables coded 1 if firmi belongs to: - Energy (GICS 10 and 55), and coded 0
otherwise - Materials (GICS 15), and coded 0 otherwise - Consumer (GICS 25 and 30), and coded 0
otherwise - Health care (GICS 35), and coded 0 otherwise - Information technology (GICS 45 and 50), and
coded 0 otherwise. Source: Global (Standard and Poors) database.
N/A
Other items
00 βα , Regression intercepts.
- N/A
ss ,βα Regression parameters.
- N/A
28
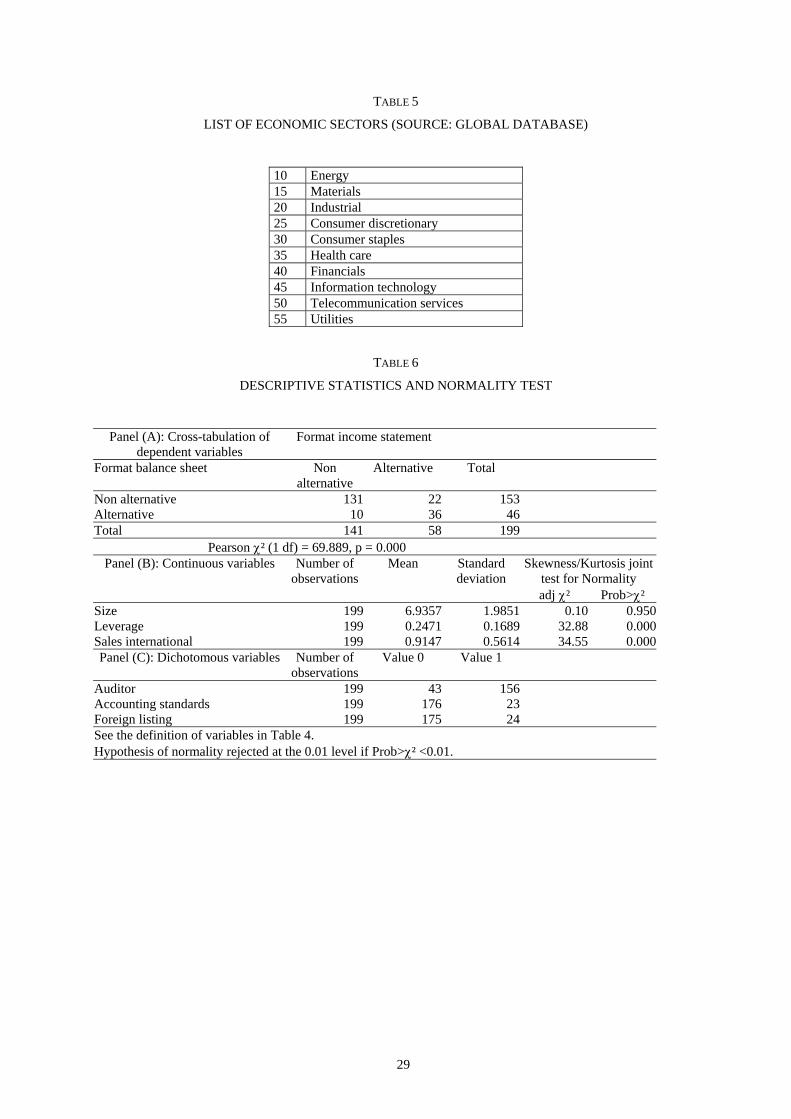
TABLE 5
LIST OF ECONOMIC SECTORS (SOURCE: GLOBAL DATABASE)
10 Energy 15 Materials 20 Industrial 25 Consumer discretionary 30 Consumer staples 35 Health care 40 Financials 45 Information technology 50 Telecommunication services 55 Utilities
TABLE 6
DESCRIPTIVE STATISTICS AND NORMALITY TEST
Panel (A): Cross-tabulation of
dependent variables Format income statement
Format balance sheet Non alternative
Alternative Total
Non alternative 131 22 153 Alternative 10 36 46 Total 141 58 199
Pearson χ² (1 df) = 69.889, p = 0.000 Panel (B): Continuous variables Number of
observationsMean Standard
deviation Skewness/Kurtosis joint
test for Normality adj χ² Prob>χ²
Size 199 6.9357 1.9851 0.10 0.950Leverage 199 0.2471 0.1689 32.88 0.000Sales international 199 0.9147 0.5614 34.55 0.000Panel (C): Dichotomous variables Number of
observationsValue 0 Value 1
Auditor 199 43 156 Accounting standards 199 176 23 Foreign listing 199 175 24 See the definition of variables in Table 4. Hypothesis of normality rejected at the 0.01 level if Prob>χ² <0.01.
29
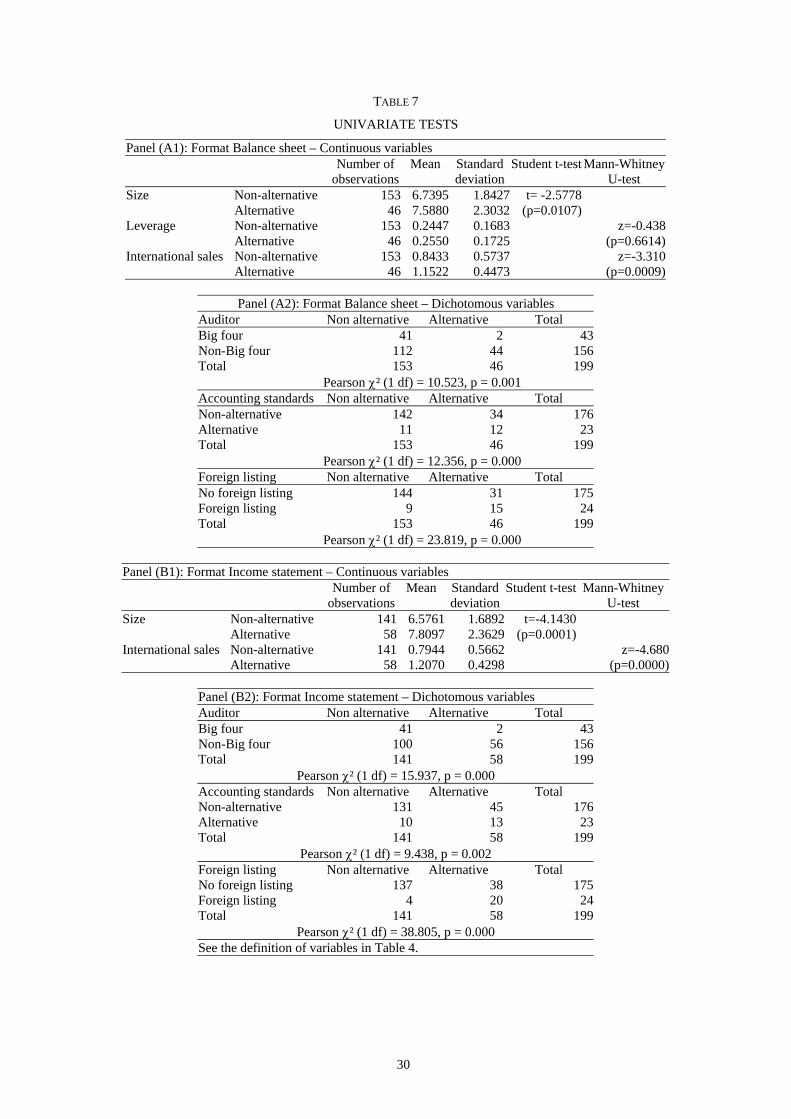
TABLE 7
UNIVARIATE TESTS
Panel (A1): Format Balance sheet – Continuous variables Number of
observationsMean Standard
deviationStudent t-test Mann-Whitney
U-test Size Non-alternative 153 6.7395 1.8427 t= -2.5778 Alternative 46 7.5880 2.3032 (p=0.0107)Leverage Non-alternative 153 0.2447 0.1683 z=-0.438 Alternative 46 0.2550 0.1725 (p=0.6614)International sales Non-alternative 153 0.8433 0.5737 z=-3.310 Alternative 46 1.1522 0.4473 (p=0.0009)
Panel (A2): Format Balance sheet – Dichotomous variables
Auditor Non alternative Alternative Total Big four 41 2 43Non-Big four 112 44 156Total 153 46 199 Pearson χ² (1 df) = 10.523, p = 0.001 Accounting standards Non alternative Alternative Total Non-alternative 142 34 176Alternative 11 12 23Total 153 46 199 Pearson χ² (1 df) = 12.356, p = 0.000 Foreign listing Non alternative Alternative Total No foreign listing 144 31 175Foreign listing 9 15 24Total 153 46 199 Pearson χ² (1 df) = 23.819, p = 0.000
Panel (B1): Format Income statement – Continuous variables
Number of observations
Mean Standard deviation
Student t-test Mann-Whitney U-test
Size Non-alternative 141 6.5761 1.6892 t=-4.1430 Alternative 58 7.8097 2.3629 (p=0.0001)International sales Non-alternative 141 0.7944 0.5662 z=-4.680 Alternative 58 1.2070 0.4298 (p=0.0000)
Panel (B2): Format Income statement – Dichotomous variables Auditor Non alternative Alternative Total Big four 41 2 43Non-Big four 100 56 156Total 141 58 199
Pearson χ² (1 df) = 15.937, p = 0.000 Accounting standards Non alternative Alternative Total Non-alternative 131 45 176Alternative 10 13 23Total 141 58 199
Pearson χ² (1 df) = 9.438, p = 0.002 Foreign listing Non alternative Alternative Total No foreign listing 137 38 175Foreign listing 4 20 24Total 141 58 199
Pearson χ² (1 df) = 38.805, p = 0.000 See the definition of variables in Table 4.
30
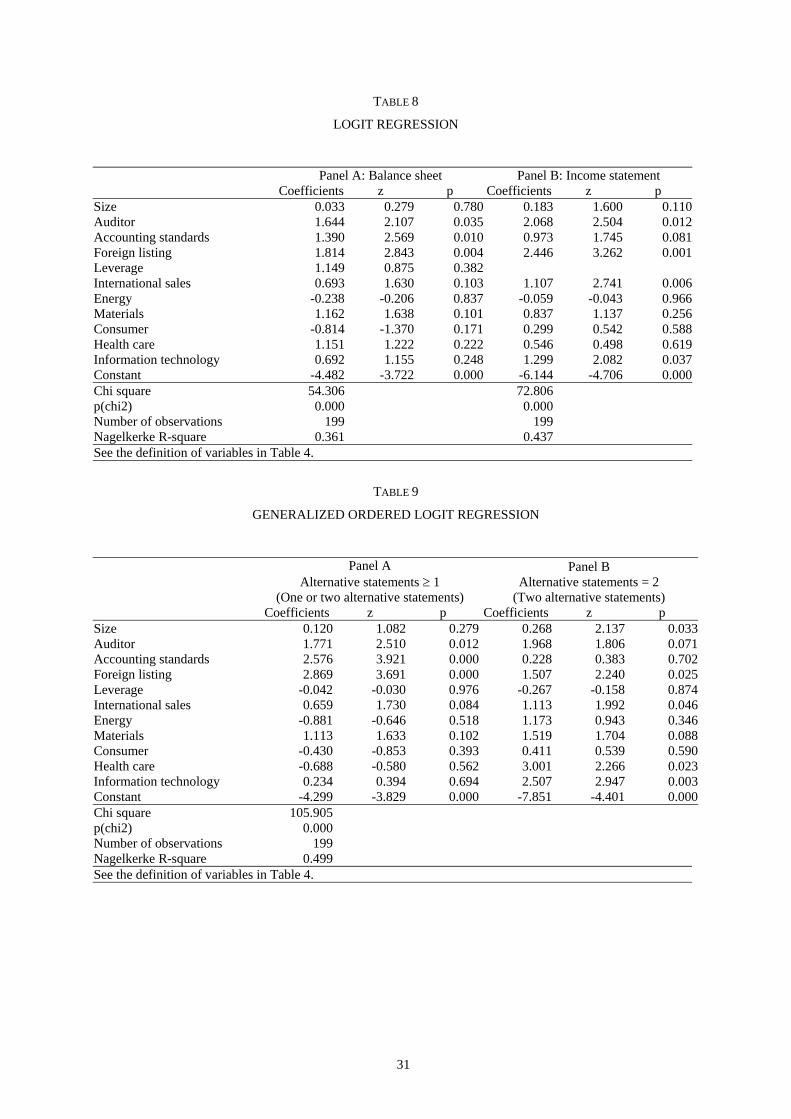
TABLE 8
LOGIT REGRESSION
Panel A: Balance sheet Panel B: Income statement
Coefficients z p Coefficients z p Size 0.033 0.279 0.780 0.183 1.600 0.110Auditor 1.644 2.107 0.035 2.068 2.504 0.012Accounting standards 1.390 2.569 0.010 0.973 1.745 0.081Foreign listing 1.814 2.843 0.004 2.446 3.262 0.001Leverage 1.149 0.875 0.382 International sales 0.693 1.630 0.103 1.107 2.741 0.006Energy -0.238 -0.206 0.837 -0.059 -0.043 0.966Materials 1.162 1.638 0.101 0.837 1.137 0.256Consumer -0.814 -1.370 0.171 0.299 0.542 0.588Health care 1.151 1.222 0.222 0.546 0.498 0.619Information technology 0.692 1.155 0.248 1.299 2.082 0.037Constant -4.482 -3.722 0.000 -6.144 -4.706 0.000Chi square 54.306 72.806 p(chi2) 0.000 0.000 Number of observations 199 199 Nagelkerke R-square 0.361 0.437 See the definition of variables in Table 4.
TABLE 9
GENERALIZED ORDERED LOGIT REGRESSION
Panel A Alternative statements ≥ 1
(One or two alternative statements)
Panel B Alternative statements = 2
(Two alternative statements) Coefficients z p Coefficients z p
Size 0.120 1.082 0.279 0.268 2.137 0.033Auditor 1.771 2.510 0.012 1.968 1.806 0.071Accounting standards 2.576 3.921 0.000 0.228 0.383 0.702Foreign listing 2.869 3.691 0.000 1.507 2.240 0.025Leverage -0.042 -0.030 0.976 -0.267 -0.158 0.874International sales 0.659 1.730 0.084 1.113 1.992 0.046Energy -0.881 -0.646 0.518 1.173 0.943 0.346Materials 1.113 1.633 0.102 1.519 1.704 0.088Consumer -0.430 -0.853 0.393 0.411 0.539 0.590Health care -0.688 -0.580 0.562 3.001 2.266 0.023Information technology 0.234 0.394 0.694 2.507 2.947 0.003Constant -4.299 -3.829 0.000 -7.851 -4.401 0.000Chi square 105.905 p(chi2) 0.000 Number of observations 199 Nagelkerke R-square 0.499 See the definition of variables in Table 4.
31
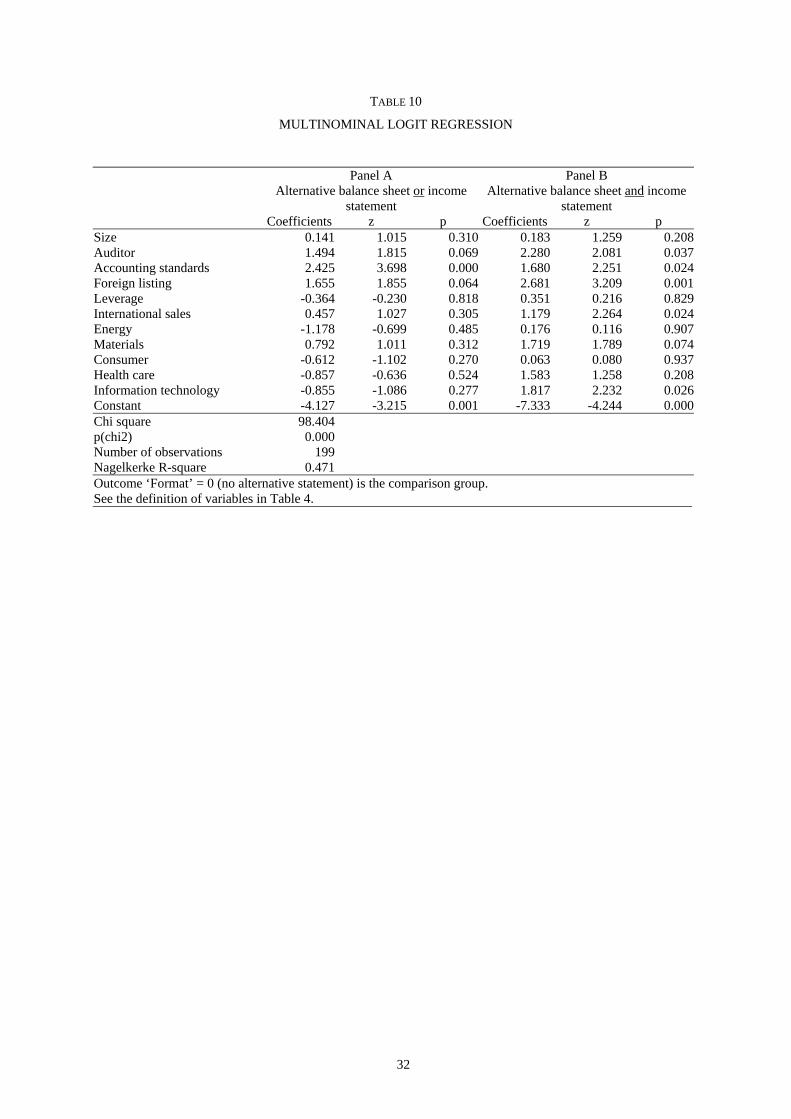
TABLE 10
MULTINOMINAL LOGIT REGRESSION
Panel A
Alternative balance sheet or income statement
Panel B Alternative balance sheet and income
statement Coefficients z p Coefficients z p
Size 0.141 1.015 0.310 0.183 1.259 0.208Auditor 1.494 1.815 0.069 2.280 2.081 0.037Accounting standards 2.425 3.698 0.000 1.680 2.251 0.024Foreign listing 1.655 1.855 0.064 2.681 3.209 0.001Leverage -0.364 -0.230 0.818 0.351 0.216 0.829International sales 0.457 1.027 0.305 1.179 2.264 0.024Energy -1.178 -0.699 0.485 0.176 0.116 0.907Materials 0.792 1.011 0.312 1.719 1.789 0.074Consumer -0.612 -1.102 0.270 0.063 0.080 0.937Health care -0.857 -0.636 0.524 1.583 1.258 0.208Information technology -0.855 -1.086 0.277 1.817 2.232 0.026Constant -4.127 -3.215 0.001 -7.333 -4.244 0.000Chi square 98.404p(chi2) 0.000Number of observations 199Nagelkerke R-square 0.471Outcome ‘Format’ = 0 (no alternative statement) is the comparison group. See the definition of variables in Table 4.
32


![[En] HEC Paris - Web 2.0 - reinventing marketing](https://img.pdfslide.us/doc/110x75/547cfb7d5906b54d378b45fb/en-hec-paris-web-20-reinventing-marketing.jpg)