Embed Size (px)
Citation preview
Australasian Accounting, Business and Finance Journal
Volume 12 | Issue 3 Article 5
Determinants of Financial Derivative Disclosuresin an Emerging Economy: A Stewardship TheoryPerspectiveHima Bindu KotaAmity University, Noida, India., [email protected]
B. CharumathiPondicherry University, India
Follow this and additional works at: https://ro.uow.edu.au/aabfjCopyright ©2018 Australasian Accounting Business and Finance Journal and Authors.
Research Online is the open access institutional repository for the University of Wollongong. For further information contact the UOW Library:[email protected]
Recommended CitationKota, Hima Bindu and Charumathi, B., Determinants of Financial Derivative Disclosures in anEmerging Economy: A Stewardship Theory Perspective, Australasian Accounting, Business andFinance Journal, 12(3), 2018, 62-86. doi:10.14453/aabfj.v12i3.5

Determinants of Financial Derivative Disclosures in an EmergingEconomy: A Stewardship Theory Perspective
AbstractThe accounting system in India is undergoing a significant change. With the notification of Companies(Indian Accounting Standards) Rules 2015, the Ministry of Corporate Affairs in India converged the IndianAccounting Standards (Ind AS) with International Financial Reporting Standards (IFRS) which was appliedin a phased manner from 1 April 2016 beginning with large companies whose net worth was equal to orexceeded INR 5 billion, followed by its implementation for smaller companies with net worth between 2.5billion to 5 billion thereafter. Among other accounting standards, Financial Instruments Standards Ind AS 32,109 and 107 that defines, recognises, measures and specifies disclosure norms of financial instrumentsincluding financial derivatives were introduced. Warren Buffet very famously called derivatives, “financialweapons of mass destruction,” and giving credence to his views, time and again, financial as well as non-financial firms in India and around the world have sustained losses due to the usage of financial derivatives.Over the years, the capital markets have changed, and business models have become more challenging withcomplex sources of risk and uncertainty which has transformed risk management into a sophisticated art. Thiscomplex and ever-changing business environment has brought to the fore the necessity and importance ofdeveloping reliable and relevant disclosure norms to help protect all stakeholders, as derivatives, due to theirunderlying complex nature, can be a significant source of systematic risk. This is also reiterated, withshareholders and investors stepping up the demand for increased financial disclosure. This empirical studymodels the factors that determine Financial Derivative Disclosure of Indian non-financial firms The studydevelops a self-constructed unweighted Financial Derivative Disclosure Index (FDDI) to measure thederivative disclosure. The sample represents companies from Nifty 50, out of which banking and financialservices companies were removed. Using multiple regression model, this study modelled the corporategovernance factors which determine derivative disclosure. The factors identified were presence of usage ofderivatives, size, foreign income, presence of risk management committee, institutional shareholding andbinary variable for family business. The results show that the stewardship theory explains the determinants offinancial derivative disclosure in Indian context, and promoters act as stewards and guide their firms toimprove their financial derivative disclosures.
KeywordsAccounting Standards 32, 109 & 107, Financial Derivative Disclosure Index (FDDI), Financial DerivativeDisclosure Quotient (FDDQ), derivative usage, Nifty 50.
This article is available in Australasian Accounting, Business and Finance Journal: https://ro.uow.edu.au/aabfj/vol12/iss3/5

Determinants of Financial Derivative Disclosures in an Emerging Economy: A Stewardship Theory Perspective Hima Bindu Kota1 and B. Charumathi2 Abstract The accounting system in India is undergoing a significant change. With the notification of Companies (Indian Accounting Standards) Rules 2015, the Ministry of Corporate Affairs in India converged the Indian Accounting Standards (Ind AS) with International Financial Reporting Standards (IFRS) which was applied in a phased manner from 1 April 2016 beginning with large companies whose net worth was equal to or exceeded INR 5 billion, followed by its implementation for smaller companies with net worth between 2.5 billion to 5 billion thereafter. Among other accounting standards, Financial Instruments Standards Ind AS 32, 109 and 107 that defines, recognises, measures and specifies disclosure norms of financial instruments including financial derivatives were introduced. Warren Buffet very famously called derivatives, “financial weapons of mass destruction,” and giving credence to his views, time and again, financial as well as non-financial firms in India and around the world have sustained losses due to the usage of financial derivatives. Over the years, the capital markets have changed, and business models have become more challenging with complex sources of risk and uncertainty which has transformed risk management into a sophisticated art. This complex and ever-changing business environment has brought to the fore the necessity and importance of developing reliable and relevant disclosure norms to help protect all stakeholders, as derivatives, due to their underlying complex nature, can be a significant source of systematic risk. This is also reiterated, with shareholders and investors stepping up the demand for increased financial disclosure. This empirical study models the factors that determine Financial Derivative Disclosure of Indian non-financial firms The study develops a self-constructed unweighted Financial Derivative Disclosure Index (FDDI) to measure the derivative disclosure. The sample represents companies from Nifty 50, out of which banking and financial services companies were removed. Using multiple regression model, this study modelled the corporate governance factors which determine derivative disclosure. The factors identified were presence of usage of derivatives,
1 Hima Bindu Kota, Amity University, India 2 Pondicherry University, India

Kota & Charumathi | Determinants of Financial Derivative Disclosures in an Emerging Economy
63
size, foreign income, presence of risk management committee, institutional shareholding and binary variable for family business. The results show that the stewardship theory explains the determinants of financial derivative disclosure in Indian context, and promoters act as stewards and guide their firms to improve their financial derivative disclosures. JEL Classification: G32
Keywords: Accounting Standards 32, 109 & 107, Financial Derivative Disclosure Index (FDDI), Financial Derivative Disclosure Quotient (FDDQ), derivative usage, Nifty 50.
Introduction According to the former Governor of Federal Reserve Greenspan (1999), the stupendous increase in the usage of financial derivatives by firms, world over, has marked the most extraordinary development in the field of finance. Although firms use derivatives in most of the industries, their usage may be different. For example, non-financial firms in India, as in the rest of the world, hedge themselves against any one or more of the following market risks: adverse movements in interest rates, commodity prices, foreign exchange rates and equity values. On the other hand, banking and financial firms may use derivatives both as dealers and end-users. With the well-publicized losses from derivatives sustained by both financial and non-financial firms in the past, financial boards across the world have come under the pressure of regulators to create new rules for reliable and relevant disclosures. Moreover, shareholders and investors have also demanded increased financial disclosure. With the increasing sophistication of financial products and services and increased use of derivatives for risk mitigation and trading in India, Accounting Standards (AS) 30, 31 and 32 came into effect on or after 1st April 2009. The standards were recommendationsonly for two years and were supposed to be mandatory for accounting periods commencing on or after April 1, 2011, although by 2015, AS 30 and 31 were replace by Ind AS 109 and 107. In the aftermath of the global financial crisis and significant losses on derivatives transactions announced by Indian companies in the past, a study on the disclosure of derivative usage and its determinants is especially significant. LITERATURE REVIEW Annual reports are an important source of information about the derivative activities by any firm. Several users like investors, shareholders, lenders, and analysts of financial statements can use derivative disclosures to understand derivatives activities better and hence take correct decisions. Academics, accountants and analysts have long debated over how to show complex financial instruments like derivatives in the financial statements. Disclosure failure can misrepresent the risk taken by these firms and expose unaware shareholders and investors to huge losses. This phenomenon has been observed in many firms including Proctor & Gamble and Barings Bank. The fact that organizations can display unethical behaviour can be seen by financial scandals of well-known firms like Enron, Arthur Anderson, WorldCom and that of Satyam, in India. These scandals have shaken public confidence in how businesses are managed, creating concern about ethics and corporate governance. With the well-publicized derivative losses sustained by both financial and non-financial firms over the past few years, financial boards across the world have come under the pressure of regulators to create new rules for reliable and relevant disclosures. Additionally, shareholders and investors have demanded increased financial disclosure (Feay &Abdullah, 2001). From another view point, understanding the reason for voluntary disclosure
AABFJ | Volume 12, no. 3, 2018
64
by firms is beneficial to both the preparers and users of accounting information as well as to accounting policymakers (Meek, Gray & Roberts, 1995). To contribute towards better disclosures and transparency, several countries have come up with accounting standards for derivatives. The Financial Accounting Standards Board (FASB) of the United States has issued FASB 133 and 137 and FAS 161, Australia has issued AASB 1033. In addition, FRS 13 in United Kingdom, CICA 3862 in Canada, IAS 32 and 39 in Portugal and MASB ED 24 in Malaysia have been issued to improve the corporate reporting standards in derivatives and hedging instruments. Studies on Derivative Disclosure Complete compliance to disclosure norms is not a world-wide phenomenon. Several studies show that compliance to derivative disclosure norms is incomplete (Chalmers, 2001; Chalmers & Godfrey, 2000; Blankley et at, 2000; Roulsone, 1999; Hafiz, 2003). Among different nations, it was found that disclosures in British and American firms are higher after examining the disclosure of seven countries namely, United States, United Kingdom, France, Japan, Sweden, Netherlands and West Germany (Barrett, 1976),
However, with the implementation of mandatory standards on financial instruments, there had been a marked improvement in the derivative disclosures (Edward & Eller, 1995, 1996; Dunne, Helliar, Power, Mallin, Ow-Yong and Moir, 2004; Woods and Marginson, 2004; and Hassan, Saleh & Rahman, 2007). The usefulness of the compulsory accounting and reporting practice for derivatives has attracted considerable academic attention since they were issued. In the accounting literature, the studies in relation to the assessment of derivative disclosures have developed into two branches. Firstly, some studies (Edwards and Eller, 1996; Roulstone, 1999; Blankley et al., 2000, 2002; Bhamornsiri & Schroeder, 2004; Lajili & Zehgal, 2005; Dunne et al., 2007; Lopes & Rodrigues, 2008) have examined the quality of derivative disclosures by evaluating the response of listed companies to the mandated disclosure requirements for derivatives. These researchers intend to find out the answers about whether the mandated derivative disclosure provisions actually achieve the expectation of accounting authorities, by demanding the listed companies to provide more information regarding derivative related activities in their annual reports. Generally speaking, these studies indicate that the quoted companies are able to prepare both qualitative and quantitative information about the derivative usage and associated market risk in accordance with the basic accounting and reporting rules in their annual reports. Nevertheless, they are unwilling to provide sufficient detailed information such as the assumptions of quantitative techniques and corporate risk management activities. Hence, it can be argued that although the implementation of the compulsory disclosure requirements improves the reported information about use of derivatives, the supervisory authorities still have a task to inspire the reporting companies to disclose more information with greater details. Another strand of studies focuses on the effect of information disclosure on the behaviour of financial market aggregates such as stock price, stock returns and trading volume. These researches (McNally/McAnally, 1996; Nelson, 1996; Barth et al., 1996; Schrand, 997; Rajgopla,

Kota & Charumathi | Determinants of Financial Derivative Disclosures in an Emerging Economy
65
1999; Eccher et al., 1996; Venkatachalam, 1996; Barton, 2001; Seow and Tam, 2002; Jorion, 2002; Liensmeir et al, 2002; Jorion, 2002; Linsmeir et al., 2002; Ahmed et al., 2004; Liu et al., 2004; Eric et al., 2004; Wang et al., 2005; Koonce et al., 2005; Reynolds-Moehrle, 2005; Richie et al, 2005; Chipalkatti and Datar, 2006; Ahmed et al, 2006; Zhang, 2009; Ameer, 2009; and Perignon & Smith, 2010) attempt to explain empirically observed phenomena in the association between the derivative related disclosures and market responses. Overall, the findings of these studies are mixed even contrary. Some researchers (McAnally, 1996; Barth et al., 1996; Eccher et al., 1996; Venkatachalam, 1996; Schrand, 1997; Rajgopal, 1999; Seow and Tam, 2002; Jorion, 2002; Linsmeier et al., 2002; Ahmed et al., 2004; Lin et al., 2004; Eric et al., 2004; Wang et al., 2005; Ahmed et al., 2005; Ameer, 2009; Zhang, 2009) provide the empirical evidence to prove the value relevance of compulsory derivative accounting and reporting regulations to investors' assessment of the corporate risk profile while some empirical studies (Nelson, 1996; Wang et al., 2005; Chipalkatti & Datar, 2006; Perignon and Smith, 2010) demonstrate that there is no relationship between the disclosed derivative information and the market response. Some (Lehn, 1997; AICPA, 1998; Hodder et al., 2001; Kawaller, 2004; Reinstein & Lander, 2000) argue that the complicated accounting and reporting treatments for derivatives have caused difficulties for investors in valuating corporate derivative activities, and even a few studies (Logan & Montgomery, 1997; Koonce et al., 2005) indicate that the disclosures following the mandated derivative related requirements have been misunderstood and adversely affected investors' assessments in a company's risk profile and associated derivative activities. In addition, the restrictive and complex derivative related standards, such as SFAS 133, have made the reporting entities hard to understand and caused a series of significant problems in the use of derivatives and smooth earnings volatility (Osterland, 2000; AFP, 2001; Barton, 2001; Leib, 2001; Richie et al., 2005). Such mixed and contrary results are coincident with the findings achieved by the first stream that the compliance with derivative related standards is mixed and the standard has not adequately achieved the desired level of financial transparency on the use of derivative financial instruments as expected (Bhamornsiri & Schroeder, 2004).
Further, there are some studies that have examined the relationship between the extent of derivative disclosure and certain firm-specific variables. Studies have shown positive and significant association between derivative disclosure and size (Mapurunga, Ponte, Coelho & de Meneses, 2011; Lopes & Rodrigues, 2007; Hassan, Percy & Goodwin-Stewart, 2006-2007, Hassan, Salah & Rahman, 2007 and Hafiz, 2003); type of auditor (Lopes & Rodrigues, 2007); earnings (Mapurunga, Ponte, Coelho & de Meneses, 2011; Hassan, Percy & Goodwin-Stewart, 2006-2007); board characteristics like existence of risk management committee and more independent board composition (Hassan, Salah & Rahman, 2007; Hossain, 2008); listing status (Lopes & Rodrigues, 2007); reputation costs of managers and firms (Chalmers and Godfrey, 2004); debt ratio (Hassan, Percy & Goodwin-Stewart, 2006-2007; Hassan, Salah & Rahman, 2007); and economic sector (Hossain, 2008).

AABFJ | Volume 12, no. 3, 2018
66
Determinants of Derivative Disclosure - A Stewardship Theory Framework Role of a Promoter
Stewardship Theory is a relatively new concept (Karns, 2011) and has been developed to explain the rational behaviour of management (Donaldson & Davis, 1991). According to Hernandez (2012) and Davis et al. (1997), stewardship is the “extent to which an individual willingly subjugates his or her personal interests to act in protection of others’ long‐term welfare.” This theory holds that there is no conflict of interest between managers and owners (Donaldson, 1990), no inherent problem of executive control (Donaldson, 2008) and there is effective coordination between the two parties and the focus is on achieving organisation’s goals rather that self-interests (Van Slyke, 2007). India is a very unique country in its structure of business. In most of the organisations, the promoter or the promoter group is the main decision taker. This is because the financial organisations in India are very passive and do not play any major role in decision taking (Verma, 1997). By this virtue, the promoter and the promoter group become the dominant shareholders and the rest the minority shareholders. The principal-agent problems are virtually non-existent in India and conflicts of interest between the owners and managers are not likely, as the owners are in the helm of their businesses, hiring managers to perform key tasks in their businesses (Ahmed & Nicholls, 1994), showing less difference between those who own and those who manage. They are the Owner-Managers, performing the dual role of also managing their businesses and are the stewards of their businesses. Therefore, theory of stewardship fits well in the Indian context. It is hypothesized that in an emerging economy, owner-managers of large organizations guide their business for higher productivity (Durand and Vargas, 2003), higher performance (Anderson et al., 2003; Anderson & Reeb, 2003; Villalonga & Amit, 2006) and better regulatory compliance in some areas (Chen, Chen & Cheng, 2008). However, Ali, Chen and Radhakrishnan (2007) report that family firms have fewer disclosures about corporate governance practices. Since the sample of the study contains very large organizations in India, it is the duty of the Owner-Manager or the promoter group to have better adherence to regulations and have better disclosures to have better reputation in the financial markets (Skinner, 1994). Therefore, firms with higher promoter or promoter group holding will have higher derivative disclosures. Presence of Institutional Holding The role of institutional investors has become more active since the global financial crises and other controversies like tax avoidance and scarcity of fossil fuels. Several studies have identified the role of investors as stewards who hold the companies, in which they hold a stake, responsible and accountable (Kay, 2012; Myners 2001; Financial Reporting Council, 2012). The literature review on the role of institutional investors is divided into areas concerning their role and behaviour. Several studies have focused on the “monitoring” aspects of institutional investors by engaging with the management to achieve the organizational objectives (Shleifer & Vishny 1986, 1997; Dobrzynski 1993 and Monks & Minow 1995;) which have helped
Kota & Charumathi | Determinants of Financial Derivative Disclosures in an Emerging Economy
67
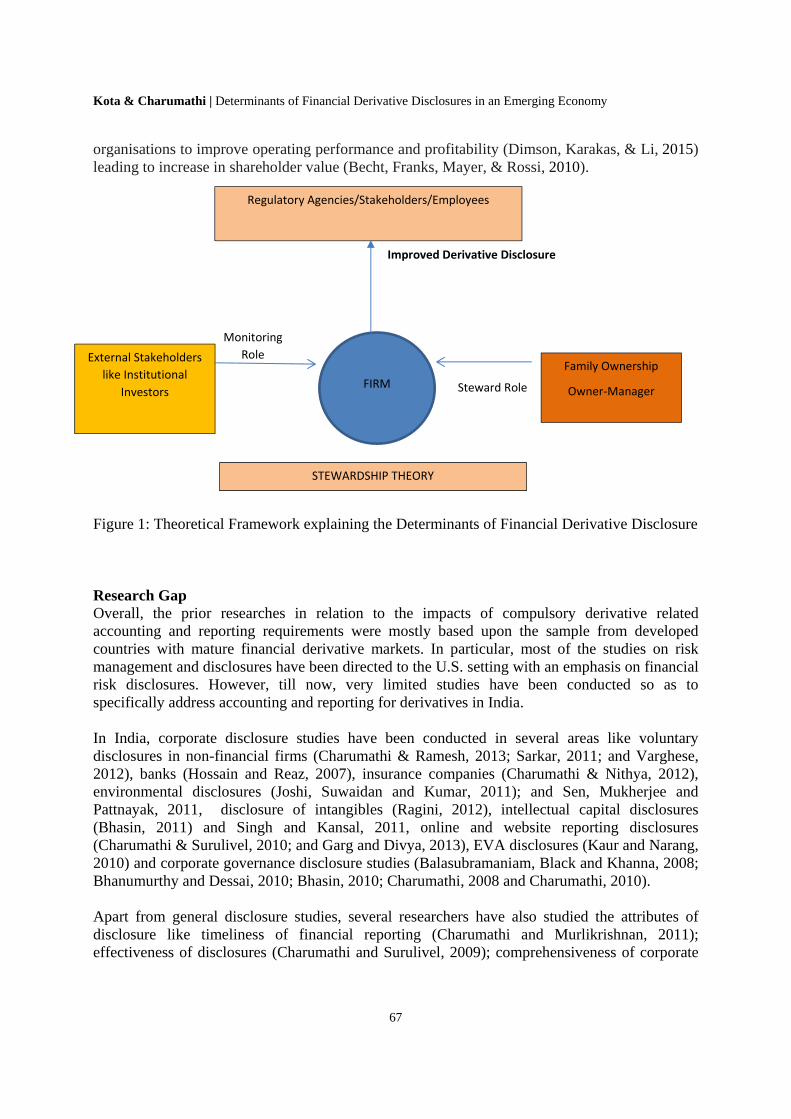
organisations to improve operating performance and profitability (Dimson, Karakas, & Li, 2015) leading to increase in shareholder value (Becht, Franks, Mayer, & Rossi, 2010). Figure 1: Theoretical Framework explaining the Determinants of Financial Derivative Disclosure Research Gap Overall, the prior researches in relation to the impacts of compulsory derivative related accounting and reporting requirements were mostly based upon the sample from developed countries with mature financial derivative markets. In particular, most of the studies on risk management and disclosures have been directed to the U.S. setting with an emphasis on financial risk disclosures. However, till now, very limited studies have been conducted so as to specifically address accounting and reporting for derivatives in India. In India, corporate disclosure studies have been conducted in several areas like voluntary disclosures in non-financial firms (Charumathi & Ramesh, 2013; Sarkar, 2011; and Varghese, 2012), banks (Hossain and Reaz, 2007), insurance companies (Charumathi & Nithya, 2012), environmental disclosures (Joshi, Suwaidan and Kumar, 2011); and Sen, Mukherjee and Pattnayak, 2011, disclosure of intangibles (Ragini, 2012), intellectual capital disclosures (Bhasin, 2011) and Singh and Kansal, 2011, online and website reporting disclosures (Charumathi & Surulivel, 2010; and Garg and Divya, 2013), EVA disclosures (Kaur and Narang, 2010) and corporate governance disclosure studies (Balasubramaniam, Black and Khanna, 2008; Bhanumurthy and Dessai, 2010; Bhasin, 2010; Charumathi, 2008 and Charumathi, 2010). Apart from general disclosure studies, several researchers have also studied the attributes of disclosure like timeliness of financial reporting (Charumathi and Murlikrishnan, 2011); effectiveness of disclosures (Charumathi and Surulivel, 2009); comprehensiveness of corporate
FIRM
Family Ownership
Owner‐Manager
External Stakeholders
like Institutional
Investors Steward Role
Improved Derivative Disclosure
STEWARDSHIP THEORY
Regulatory Agencies/Stakeholders/Employees
Monitoring
Role
AABFJ | Volume 12, no. 3, 2018
68
disclosures (Bhayani, 2012; and Nandi and Ghosh, 2012) and extent of disclosure (Hossain, 2008). On the basis of the literature review done, there seems to be no study on the determinants of disclosure of derivatives by non-financial Indian firms. Hence, the present study intends to fill this gap
OBJECTIVE OF THE STUDY
The objective of the study is to develop an original index viz., Financial Derivative Disclosure Index (FDDI) to empirically measure the disclosure level and model its corporate governance determinants.
RESEARCH METHODOLOGY
Sample: The sample taken for studying the derivative disclosure is 50 companies of CNX Nifty. CNX Nifty is a well-diversified 50 stock index accounting for 22 sectors of the economy. The stocks that make the NIFTY index represent the prime companies in India and they are leaders in the stock exchange in terms of the derivative trading volume and the market capitalization. CNX Nifty stocks represent about 67.2% of the total free float market capitalization of the universe of the stocks traded on NSE as on September 28, 2012 and is a true reflection of the Indian stock market. NSE is India’s largest and world’s third largest stock exchange in terms of transactions. Out of 50 companies chosen as sample, 11 firms are in banking or financial services sector and were removed from the sample. The total of 36 firms was finally studied.
Sources of Data Collection: The study primarily used secondary data. Various secondary resources include annual reports, National Stock Exchange’s official website www.nseindia.com, websites of individual firms, Confederation of Indian Industries (CII) library, databases like Centre for Monitoring Indian Economy (CMIE) Prowess and Business Beacon, annual report library services like Sansco Services. In addition, Accounting Standards (AS) 32, 109 and 107 were studied extensively. A number of research papers, working papers and financial dailies were also referred to.
Variables of the Study
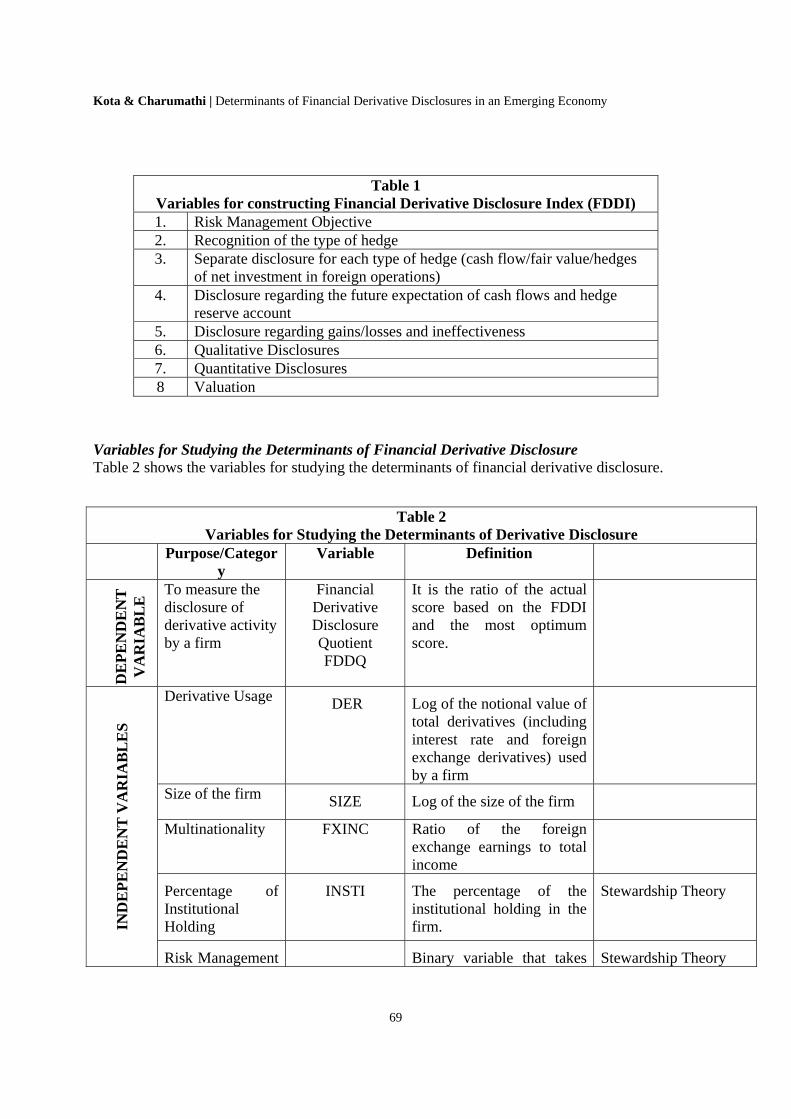
Variables for Constructing Financial Derivative Disclosure Index (FDDI) Table 1 shows the variables of the Financial Derivative Disclosure Index (FDDI).
Kota & Charumathi | Determinants of Financial Derivative Disclosures in an Emerging Economy
69
Table 1 Variables for constructing Financial Derivative Disclosure Index (FDDI) 1. Risk Management Objective 2. Recognition of the type of hedge 3. Separate disclosure for each type of hedge (cash flow/fair value/hedges
of net investment in foreign operations) 4. Disclosure regarding the future expectation of cash flows and hedge
reserve account 5. Disclosure regarding gains/losses and ineffectiveness 6. Qualitative Disclosures 7. Quantitative Disclosures 8 Valuation
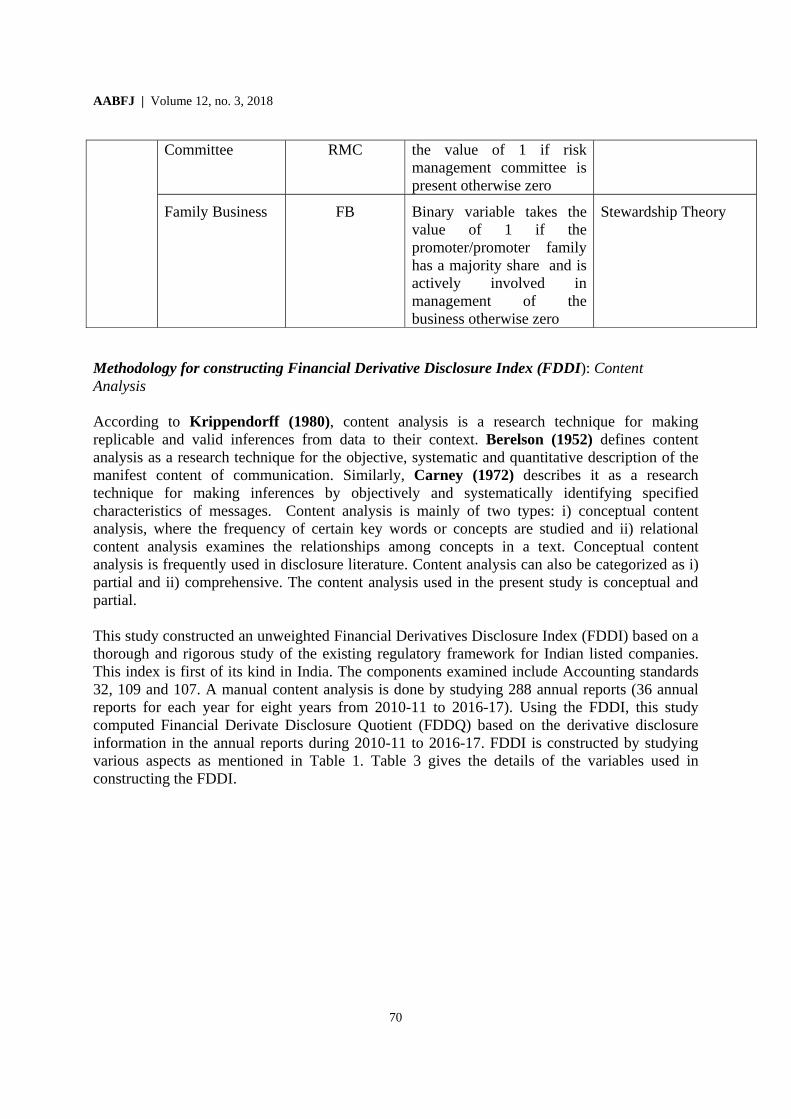
Variables for Studying the Determinants of Financial Derivative Disclosure Table 2 shows the variables for studying the determinants of financial derivative disclosure.
Table 2 Variables for Studying the Determinants of Derivative Disclosure
Purpose/Category
Variable Definition
D
EP
EN
DE
NT
V
AR
IAB
LE
To measure the disclosure of derivative activity by a firm
Financial Derivative Disclosure Quotient FDDQ
It is the ratio of the actual score based on the FDDI and the most optimum score.
IND
EP
EN
DE
NT
VA
RIA
BL
ES
Derivative Usage DER Log of the notional value of total derivatives (including interest rate and foreign exchange derivatives) used by a firm
Size of the firm SIZE Log of the size of the firm
Multinationality FXINC Ratio of the foreign exchange earnings to total income
Percentage of Institutional Holding
INSTI The percentage of the institutional holding in the firm.
Stewardship Theory
Risk Management Binary variable that takes Stewardship Theory
AABFJ | Volume 12, no. 3, 2018
70
Committee RMC the value of 1 if risk management committee is present otherwise zero
Family Business FB Binary variable takes the value of 1 if the promoter/promoter family has a majority share and is actively involved in management of the business otherwise zero
Stewardship Theory
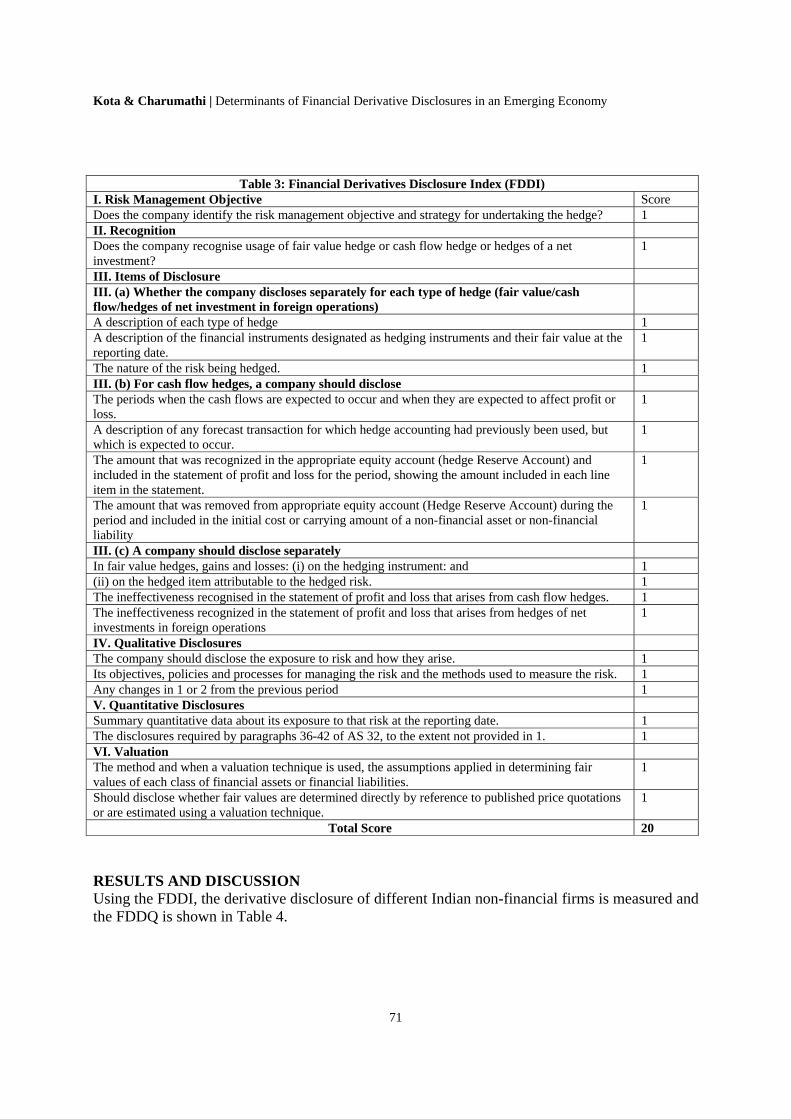
Methodology for constructing Financial Derivative Disclosure Index (FDDI): Content Analysis According to Krippendorff (1980), content analysis is a research technique for making replicable and valid inferences from data to their context. Berelson (1952) defines content analysis as a research technique for the objective, systematic and quantitative description of the manifest content of communication. Similarly, Carney (1972) describes it as a research technique for making inferences by objectively and systematically identifying specified characteristics of messages. Content analysis is mainly of two types: i) conceptual content analysis, where the frequency of certain key words or concepts are studied and ii) relational content analysis examines the relationships among concepts in a text. Conceptual content analysis is frequently used in disclosure literature. Content analysis can also be categorized as i) partial and ii) comprehensive. The content analysis used in the present study is conceptual and partial. This study constructed an unweighted Financial Derivatives Disclosure Index (FDDI) based on a thorough and rigorous study of the existing regulatory framework for Indian listed companies. This index is first of its kind in India. The components examined include Accounting standards 32, 109 and 107. A manual content analysis is done by studying 288 annual reports (36 annual reports for each year for eight years from 2010-11 to 2016-17). Using the FDDI, this study computed Financial Derivate Disclosure Quotient (FDDQ) based on the derivative disclosure information in the annual reports during 2010-11 to 2016-17. FDDI is constructed by studying various aspects as mentioned in Table 1. Table 3 gives the details of the variables used in constructing the FDDI.
Kota & Charumathi | Determinants of Financial Derivative Disclosures in an Emerging Economy
71
Table 3: Financial Derivatives Disclosure Index (FDDI) I. Risk Management Objective Score Does the company identify the risk management objective and strategy for undertaking the hedge? 1 II. Recognition Does the company recognise usage of fair value hedge or cash flow hedge or hedges of a net investment?
1
III. Items of Disclosure III. (a) Whether the company discloses separately for each type of hedge (fair value/cash flow/hedges of net investment in foreign operations)
A description of each type of hedge 1 A description of the financial instruments designated as hedging instruments and their fair value at the reporting date.
1
The nature of the risk being hedged. 1 III. (b) For cash flow hedges, a company should disclose The periods when the cash flows are expected to occur and when they are expected to affect profit or loss.
1
A description of any forecast transaction for which hedge accounting had previously been used, but which is expected to occur.
1
The amount that was recognized in the appropriate equity account (hedge Reserve Account) and included in the statement of profit and loss for the period, showing the amount included in each line item in the statement.
1
The amount that was removed from appropriate equity account (Hedge Reserve Account) during the period and included in the initial cost or carrying amount of a non-financial asset or non-financial liability
1
III. (c) A company should disclose separately In fair value hedges, gains and losses: (i) on the hedging instrument: and 1 (ii) on the hedged item attributable to the hedged risk. 1 The ineffectiveness recognised in the statement of profit and loss that arises from cash flow hedges. 1 The ineffectiveness recognized in the statement of profit and loss that arises from hedges of net investments in foreign operations
1
IV. Qualitative Disclosures The company should disclose the exposure to risk and how they arise. 1 Its objectives, policies and processes for managing the risk and the methods used to measure the risk. 1 Any changes in 1 or 2 from the previous period 1 V. Quantitative Disclosures Summary quantitative data about its exposure to that risk at the reporting date. 1 The disclosures required by paragraphs 36-42 of AS 32, to the extent not provided in 1. 1 VI. Valuation The method and when a valuation technique is used, the assumptions applied in determining fair values of each class of financial assets or financial liabilities.
1
Should disclose whether fair values are determined directly by reference to published price quotations or are estimated using a valuation technique.
1
Total Score 20
RESULTS AND DISCUSSION Using the FDDI, the derivative disclosure of different Indian non-financial firms is measured and the FDDQ is shown in Table 4.

AABFJ | Volume 12, no. 3, 2018
72
Table 4: Disclosure of Derivative Information by Indian Non-Financial Firms
S. No. Firm Name 2010 2011 2012 2013 2014 2015 2016
2017
1 ACC 0 0.2 0.15 0.2 0.05 0.05 0.05 0.05
2 Ambuja Cements 0.05 0 0.05 0.1 0 0 0.05 0.05
3 Bajaj Auto 0.05 0.1 0.25 0.3 0.65 0.65 0.65 0.65
4 BHEL 0.05 0 0 0.05 0 0.1 0.1 0.1
5 BPCL 0.15 0.15 0.1 0.2 0.3 0.2 0.25 0.25
6 Bharti Airtel 0 0.3 0.2 0.25 0.35 0.35 0.4 0.4
7 Cairn 0.2 0 0.15 0.2 0 0.15 0.1 0.1
8 Cipla 0 0.1 0.15 0.1 0.1 0.05 0.1 0.1
9 Dr. Reddy 0.4 0.55 0.4 0.4 0.55 0.7 0.7 0.7
10 GAIL 0 0 0 0 0 0.05 0.1 0.1
11 Grasim 0.2 0.2 0.2 0.2 0.25 0.3 0.3 0.3
12 HCL Tech 0.15 0.45 0.55 0.45 0.5 0.55 0.55 0.55
13 Hero 0 0 0 0.05 0.05 0.15 0.25 0.25
14 Hindalco 0.35 0.4 0.35 0.65 0.65 0.6 0.65 0.65
15 Infosys 0.25 0.35 0.25 0.3 0.25 0.35 0.35 0.45
16 ITC 0.15 0.25 0.2 0.2 0.3 0.2 0.2 0.35
17 Jaiprakash 0 0.2 0.1 0 0.05 0.05 0.05 0.025
18 Jindal Steel 0.05 0.15 0.1 0.2 0.05 0.25 0.05 0.1
19 L&T 0.2 0.45 0.35 0.35 0.35 0.45 0.45 0.45
20 M&M 0.2 0.55 0.35 0.5 0.4 0.3 0.45 0.5
21 Maruti 0.3 0 0 0 0.15 0.55 0.45 0.45
22 NTPC 0 0 0 0 0.05 0.1 0.1 0.1
23 ONGC 0 0 0 0 0 0 0 0.025
24 Power Grid 0 0 0 0 0.05 0.1 0.1 0.075
25 Reliance Comm 0.1 0.2 0.3 0.2 0.1 0.2 0.2 0.175
26 Reliance 0.2 0.3 0.25 0.2 0.25 0.25 0.2 0.2
27 Reliance Infra 0.2 0.25 0.25 0.25 0.15 0.15 0.2 0.2
28 Reliance Power 0 0 0 0 0.05 0.05 0.1 0.1
29 Sesa Goa 0 0 0.35 0 0.2 0.2 0.2 0.25
30 SAIL 0 0 0 0 0 0 0.25 0.2
31 Sun Pharma 0 0 0.05 0.2 0.2 0.05 0.05 0.05
32 TCS 0.4 0.55 0.55 0.5 0.55 0.55 0.55 0.6
33 Tata Motors 0.2 0.2 0.45 0.45 0.35 0.5 0.5 0.55
34 Tata Power 0.25 0.25 0.25 0.15 0.2 0.25 0.25 0.25
35 Tata Steel 0 0.25 0.25 0.3 0.15 0.5 0.55 0.6
36 Wipro 0.25 0.45 0.5 0.4 0.7 0.5 0.5 0.55
N 36 36 36 36 36 36 36 36
Min. 0 0 0 0 0 0 0 0
Max. 0.4 0.55 0.55 0.65 0.7 0.7 0.7 0.65

Kota & Charumathi | Determinants of Financial Derivative Disclosures in an Emerging Economy
73
Mean 0.12 0.19 0.20 0.20 0.22 0.26 0.28 0.30
Std. Dev 0.13 0.18 0.17 0.18 0.21 0.21 0.21 0.21
Note: FDDQ is computed using FDDI.
MEASURING DERIVATIVE DISCLOSURE
To measure the derivative disclosure, this study first develops a Financial Derivative Disclosure Index (FDDI) based on the variables mentioned in Table 1 and Financial Derivative Disclosure Quotient (FDDQ) is computed using the formula mentioned. This section establishes the reliability and validity of FDDI using Cronbach’s Alpha and Pearson’s correlation. Further, this section also finds whether derivative disclosure by firms has increased during the period of study.
Table 5: Testing Reliability of Financial Derivative Disclosure Index (FDDI)
Cronbach’s Alpha 0.872
N 281 Note: Results computed using SPSS 20.0
Reliability and Validity of any index needs to be checked for using the same for any further study. Table 5 shows the reliability test of FDDI. It is found that the Cronbach’s Alpha value is 0.872, suggesting that the FDDI is reliable. Table 6 tests the validity of FDDI. For checking the validity of the FDDI, the study tests the correlation between the disclosure scores measured by FDDQ and the notional value of the derivatives used (TOTALDER). A high correlation between FDDQ and TOTALDER suggests that the FDDI measures the disclosure of derivatives by the firms, which it intends to measure. It is found that the correlation between FDDQ and TOTALDER is high and is also significant at 1% level. This suggests that the FDDI is a valid disclosure index.
Table 6: Testing Validity of FDDI Using Pearson’s Correlation
TOTALDER
FDDQ Pearson Correlationship .648***
Sig. (2 tailed) .000 N 281 ***Correlation is significant at 1% level
Note: Results computed using SPSS 20.0
AABFJ | Volume 12, no. 3, 2018
74
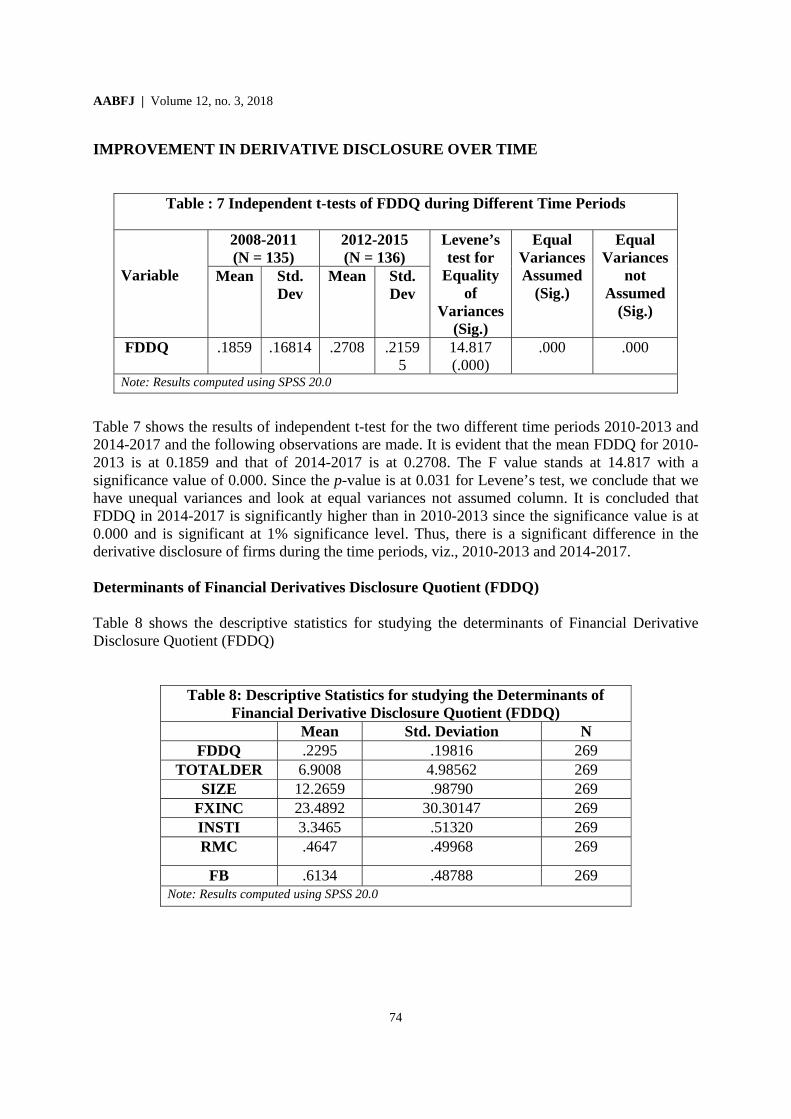
IMPROVEMENT IN DERIVATIVE DISCLOSURE OVER TIME
Table : 7 Independent t-tests of FDDQ during Different Time Periods
Variable
2008-2011 (N = 135)
2012-2015 (N = 136)
Levene’s test for
Equality of
Variances (Sig.)
Equal Variances Assumed
(Sig.)
Equal Variances
not Assumed
(Sig.)
Mean Std. Dev
Mean Std. Dev
FDDQ .1859 .16814 .2708 .21595
14.817 (.000)
.000 .000
Note: Results computed using SPSS 20.0
Table 7 shows the results of independent t-test for the two different time periods 2010-2013 and 2014-2017 and the following observations are made. It is evident that the mean FDDQ for 2010-2013 is at 0.1859 and that of 2014-2017 is at 0.2708. The F value stands at 14.817 with a significance value of 0.000. Since the p-value is at 0.031 for Levene’s test, we conclude that we have unequal variances and look at equal variances not assumed column. It is concluded that FDDQ in 2014-2017 is significantly higher than in 2010-2013 since the significance value is at 0.000 and is significant at 1% significance level. Thus, there is a significant difference in the derivative disclosure of firms during the time periods, viz., 2010-2013 and 2014-2017. Determinants of Financial Derivatives Disclosure Quotient (FDDQ) Table 8 shows the descriptive statistics for studying the determinants of Financial Derivative Disclosure Quotient (FDDQ)
Table 8: Descriptive Statistics for studying the Determinants of Financial Derivative Disclosure Quotient (FDDQ)
Mean Std. Deviation N FDDQ .2295 .19816 269
TOTALDER 6.9008 4.98562 269 SIZE 12.2659 .98790 269
FXINC 23.4892 30.30147 269 INSTI 3.3465 .51320 269 RMC .4647 .49968 269
FB .6134 .48788 269 Note: Results computed using SPSS 20.0
Kota & Charumathi | Determinants of Financial Derivative Disclosures in an Emerging Economy
75
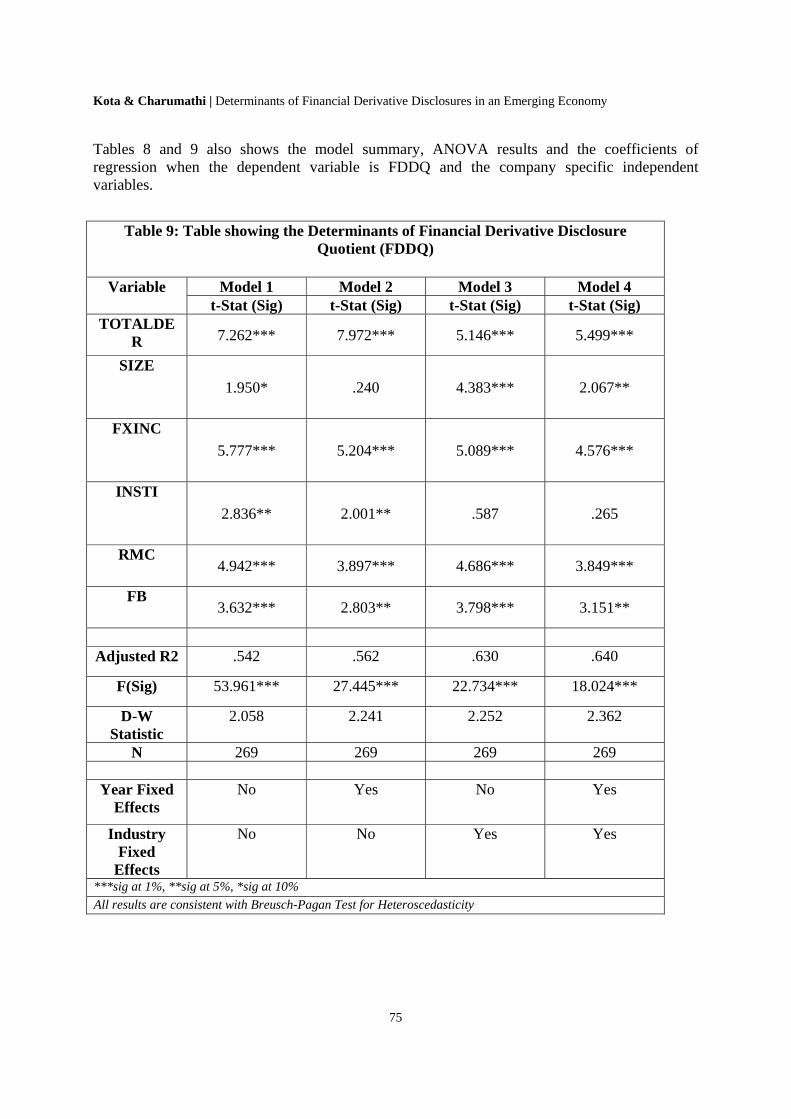
Tables 8 and 9 also shows the model summary, ANOVA results and the coefficients of regression when the dependent variable is FDDQ and the company specific independent variables.
Table 9: Table showing the Determinants of Financial Derivative Disclosure Quotient (FDDQ)
Variable Model 1 Model 2 Model 3 Model 4 t-Stat (Sig) t-Stat (Sig) t-Stat (Sig) t-Stat (Sig)
TOTALDER 7.262*** 7.972*** 5.146*** 5.499***
SIZE
1.950* .240 4.383*** 2.067**
FXINC
5.777*** 5.204*** 5.089*** 4.576***
INSTI
2.836** 2.001** .587 .265
RMC 4.942*** 3.897*** 4.686*** 3.849***
FB 3.632*** 2.803** 3.798*** 3.151**
Adjusted R2 .542 .562 .630 .640
F(Sig) 53.961*** 27.445*** 22.734*** 18.024***
D-W Statistic
2.058 2.241 2.252 2.362
N 269 269 269 269
Year Fixed Effects
No Yes No Yes
Industry Fixed
Effects
No No Yes Yes
***sig at 1%, **sig at 5%, *sig at 10%
All results are consistent with Breusch-Pagan Test for Heteroscedasticity

AABFJ | Volume 12, no. 3, 2018
76
Table 9 shows four different models. Model 1 does not take into account both the industry and year fixed effects; model 2 shows only the year fixed effects; model 3 discusses only the industry fixed effects and model 4 takes into account both industry and year fixed effects. The adjusted R-square for model 1 is fairly high at 54.2% and the model is significant at 1% significance levels. The Durbin-Watson statistic is 2.058 showing that there is no auto-correlation. It can also be seen that there is a positive relationship between FDDQ and TOTALDER. The coefficients of all the four models are positive at 7.262 (p = 0.000), 7.972 (p =0.000), 5.146 (p = 0.003) and 5.499(p= 0.004), respectively and are significant at 1 per cent level. Thus, there is a positive and significant relation between FDDQ and TOTALDER. It can also be seen that there is a positive relationship between FDDQ and Size. The coefficients of all the four models are positive at 1.950 (p = 0.052), 0.240 (p =0.810), 4.383 (p = 0.000) and 2.067 (p= 0.040), respectively. In models 1 and 4, size is significant at 5% and in model 3, it is significant at 1% level. In model 2, size is an insignificant determinant of FDDQ. In general, there is a positive and significant relation between FDDQ and SIZE. The relationship between forex income (FXINC) and FDDQ is also positive and the coefficients of all the four models are positive at 5.777 (p = 0.000), 5.204 (p =0.000), 5.089 (p = 0.000) and 4.576 (p= 0.000), respectively and are significant at 1 per cent level. Thus, there is a positive and significant relation between FDDQ and FXINC. It can be noted that there is a positive and significant relationship between institutional holding (INSTI) and FDDQ in models 1 and 2. The coefficients are positive at 2.836 (p=.005) and 2.001 (p =.046) and are significant at 5% level. Thus, there is a positive and significant relation between FDDQ and INSTI. There is a positive relationship between the presence of risk management committee (RMC) and FDDQ. The coefficients are positive in all the four models at 4.942 (p = 0.000), 3.897 (p =0.000), 4.686 (p = 0.003) and 3.849 (p= 0.004), respectively and are significant at 1 per cent level. Thus, there is a positive and significant relation between FDDQ and RMC. Family owned (FB) business also has a positive and significant relation with FDDQ. The co-efficients are positive in all the four models at 3.632 (p = 0.000), 2.803 (p =0.005), 3.798 (p = 0.000) and 3.151 (p= 0.002), respectively and are significant at both 1 per cent and 5 per cent level. Thus, there is a positive and significant relation between FDDQ and FB Table 10: Table showing the Correlation between Financial Derivative Disclosure Quotient
(FDDQ) and Company Specific Determinants FDDQ TOTADER SIZE FXINC INSTI RMC FB FDDQ 1.000 .657*** .015 .477*** .209*** .276*** .363*** TOTALDER .657*** 1.000 .051 .409*** .260*** .107** .422*** SIZE .015 .051 1.000 -.221*** -.168** .197** -.325*** FXINC .477*** .409*** -.221 1.000 -.054 .104** .191** INSTI .209*** .260*** -.168 -.054 1.000 -.051 .101** RMC .276*** .107** .197 .104** -.051 1.000 -.117** FB .363*** .422*** -.325 .191** .101** -.117** 1.000 ***sig at 1%, **sig at 5%, *sig at 10%
Kota & Charumathi | Determinants of Financial Derivative Disclosures in an Emerging Economy
77
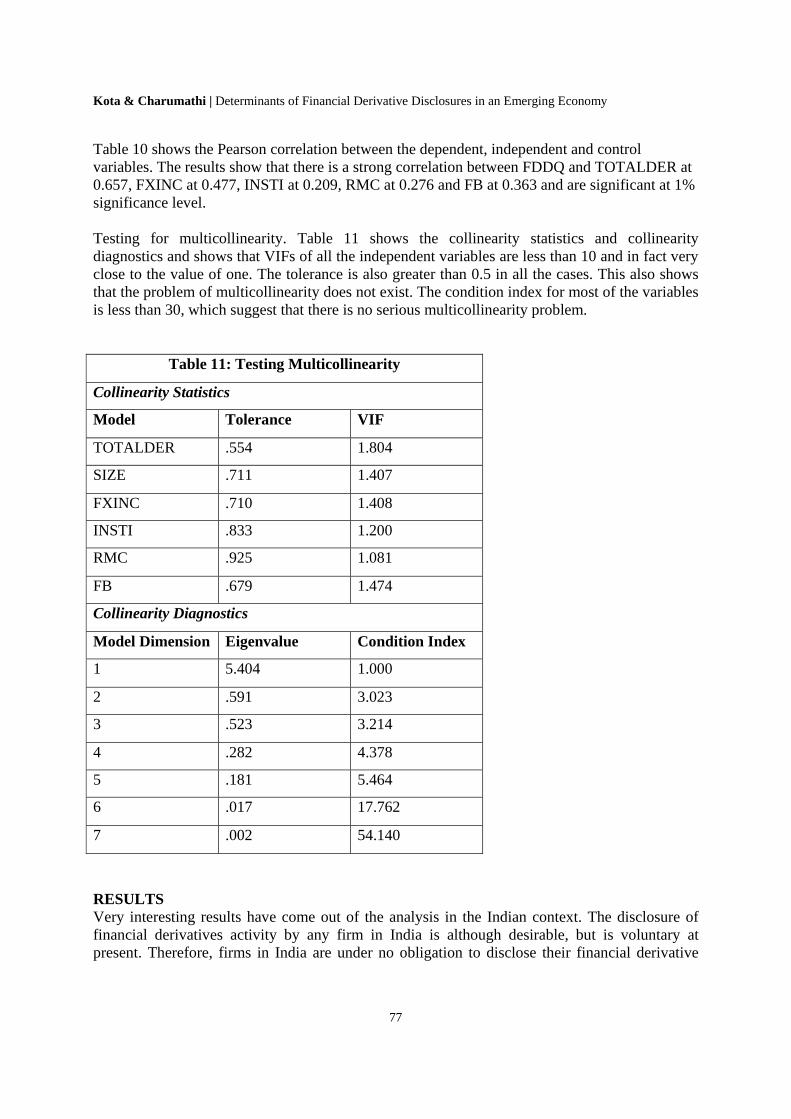
Table 10 shows the Pearson correlation between the dependent, independent and control variables. The results show that there is a strong correlation between FDDQ and TOTALDER at 0.657, FXINC at 0.477, INSTI at 0.209, RMC at 0.276 and FB at 0.363 and are significant at 1% significance level. Testing for multicollinearity. Table 11 shows the collinearity statistics and collinearity diagnostics and shows that VIFs of all the independent variables are less than 10 and in fact very close to the value of one. The tolerance is also greater than 0.5 in all the cases. This also shows that the problem of multicollinearity does not exist. The condition index for most of the variables is less than 30, which suggest that there is no serious multicollinearity problem.
Table 11: Testing Multicollinearity
Collinearity Statistics
Model Tolerance VIF
TOTALDER .554 1.804
SIZE .711 1.407
FXINC .710 1.408
INSTI .833 1.200
RMC .925 1.081
FB .679 1.474
Collinearity Diagnostics
Model Dimension Eigenvalue Condition Index
1 5.404 1.000
2 .591 3.023
3 .523 3.214
4 .282 4.378
5 .181 5.464
6 .017 17.762
7 .002 54.140
RESULTS Very interesting results have come out of the analysis in the Indian context. The disclosure of financial derivatives activity by any firm in India is although desirable, but is voluntary at present. Therefore, firms in India are under no obligation to disclose their financial derivative

AABFJ | Volume 12, no. 3, 2018
78
activities undertaken to manage their risks. Although not mandatory, the study finds that there has been a significant increase of financial derivative disclosures of Indian firms over the years. The results show that the stewardship theory explains the determinants of financial derivative disclosure in Indian context, and promoters act as stewards and guide their firms to improve their financial derivative disclosures. The study shows that the presence of Risk Management Committees in a firm lead to better financial derivative disclosures. In addition, if a firm is a family business (the promoter or promoter group has a majority share in the firm and are actively involved in managing the business), the financial derivative disclosure is better. In addition, external agencies like institutional shareholders/foreign stakeholders have a monitoring effect on a firm. The higher proportion of institutional shareholders in the ownership pattern leads to better derivative disclosure. In addition, when a firm has higher foreign income (a proxy for foreign operations and foreign stakeholders), again, the financial derivative disclosure is better. This conforms to the monitoring role of stewards, in this case, external agencies, in their role to push firms to improve their derivative disclosure. Size of the firm and the value of derivatives used are also significant determinants of financial derivative disclosures in India.
CONCLUSION There have been significant steps by regulatory bodies across the world to increase the effective of governance especially in increasing the transparency of financial reporting. Transparency in financial reporting is imperative as it provides a true picture of an organization to its stakeholders. Transparency in reporting financial derivative holdings of an organisation is essential as the use of financial derivatives has the potential to increase the overall risk of the organization manifold. By far derivatives research has predominately been based on western developed economies; little has been known about reporting and disclosing of derivatives from developing economies. The motivation of this study is to fill the research gap with the primary aim to assessing the determinants of financial derivative disclosures in India – one of the largest developing economies in the world. This empirical study models the factors that determine Financial Derivative Disclosure of Indian non-financial firms The study develops a self-constructed unweighted Financial Derivative Disclosure Index (FDDI) to measure the derivative disclosure. The sample represents companies from Nifty 50, out of which banking and financial services companies were removed. Using multiple regression model, this study modelled the corporate governance factors which determine derivative disclosure. The factors identified were presence of usage of derivatives, size, foreign income, presence of risk management committee, institutional shareholding and binary variable for family business. The results show that the stewardship theory explains the determinants of financial derivative disclosure in Indian context, and promoters act as stewards and guide their firms to improve their financial derivative disclosures.
LIMITATIONS OF THE STUDY The following are limitations of the study: firstly, data availability was a major limitation as many firms did not disclose the notional value of the derivatives used by them. Secondly, the usual limitations of financial statements and annual reports apply to this study as well.

Kota & Charumathi | Determinants of Financial Derivative Disclosures in an Emerging Economy
79
REFERENCES Ahmed, K., & Nicholls, D. (1994). The impact of non-financial company characteristics on
mandatory compliance in developing countries: The case of Bangladesh. The International Journal of Accounting, 29(1), 60-77.
Akhtaruddin, M. (2005). Corporate Mandatory Disclosure Practices in Bangladesh.
International Journal of Accounting, 40(4), 399- 422. https://doi.org/10.1016/j.intacc.2005.09.007 Ali, A., Chen, T-Y., & Radhakrishnan, S. (2007). Corporate Disclosure by Family Firms.
Journal of Accounting and Economics, 44(1-2), 238-286. https://doi.org/10.1016/j.jacceco.2007.01.006 Anderson, R. C., Bates, T. W., Bizjak, J. M., & Lemmon, M. L. (2000). Corporate governance
and firm diversification. Financial Management, 29(1), 5-22 https://doi.org/10.2307/3666358 Anderson, R. C., & Reeb, D. (2003). Founding-Family Ownership, Corporate Diversification,
and Firm Leverage. Journal of Law and Economics, 46(2), 653-84 https://doi.org/10.1086/377115
Balasubramanian, B., Black, B. and Khanna, V. (2008). Firm Level Corporate Governance in Emerging Markets: A Case Study of India. Retrieved from http://papers.ssrn.com/sol3/papers.cfm?abstract_id=992529 on 10.03.2014.
Barrett, M. E. (1976). Financial Reporting Practices: Disclosure and Comprehensiveness in an International Setting. Journal of Accounting Research, 14(1), 10-26.
https://doi.org/10.2307/2490455
Becht, M., & Roell, A. (1999). Blockholding in Europe: An international comparison. European Economic Review, 43(4–6), 1049–1056. https://doi.org/10.1016/S0014-2921(98)00113-5
Belkaoui, A. (1976). The Impact of the Disclosure of the Environmental Effects of Organizational Behaviour on the Market. Financial Management, 5(4), 26-31.
Belkaoui, A., and Kahl, A. (1978). Corporate Financial Disclosure in Canada. Vancouver: Canadian Certified General Accountants Association, 6(2), 44-55.
https://doi.org/10.2307/3665454 Berelson, B. (1952) Content Analysis in Communication Research. New York: The Free Press. Bhanumurthy, I. and Dessai, S. (2010). Corporate Governance and Disclosure Practices: A
Study of SENSEX (Index) Companies. Available at SSRN: http://ssrn.com/abstract=1686650 or http://dx.doi.org/10.2139/ssrn.1686650. (Accessed October 3, 2010).

AABFJ | Volume 12, no. 3, 2018
80
Bhasin, M. (2010). Corporate Governance Disclosure Practices: The Portrait of a Developing
Country. International Journal of Business and Management, 5(4), 150-167. https://doi.org/10.5539/ijbm.v5n4p150 Bhasin, M. (2011). Disclosure of Intellectual Capital in Annual Reports: An Exploratory Study
of Indian IT Corporations. Review of Economics & Finance, 1(August), 63-73. Bhayani, S. (2012). The Relationship between Comprehensiveness of Corporate Disclosure and
Firm Characteristics in India. Asia Pacific Finance and Accounting Review, 1(1), 52-66.
Blankley, A., Lamb, R., & Schroeder, R. (2000). Compliance with SEC Disclosure Requirements about Market Risk. Journal of Derivatives, 7(3), 39-51.
https://doi.org/10.3905/jod.2000.319121 Buzby, S. L. (1975). Company Size, Listed Versus Unlisted Stocks, and the Extent Of Financial
Disclosure. Journal of Accounting Research, 13(1), 16-37. https://doi.org/10.2307/2490647
Carney, T. F. (1972) Content Analysis. Winnipeg: University of Manitoba Press.
Cerf, A. F. (1961) Corporate Reporting and Investment Decisions. Berkeley: The University of California Press.
Chalmers K., Clinch G., & Godfrey J. (2011). Changes in Value Relevance of Accounting Information upon IFRS adoption: Evidence from Australia. Australian Journal of Management, 36(2), 151-173. https://doi.org/10.1177/0312896211404571
Chalmers, K. (2001). The Progression from Voluntary to Mandatory Derivative Instrument Disclosures – Look Who’s Talking. Australian Accounting Review, 11(1), 34-45.
https://doi.org/10.1111/j.1835-2561.2001.tb00178.x Chalmers, K., & Godfrey, J. M. (2000). Practice versus Prescription in the Disclosure and
Recognition of Derivatives. Australian Accounting Review, 11(2), 40-50. https://doi.org/10.1111/j.1835-2561.2000.tb00061.x Chalmers, K., & Godfrey, J.M. (2004). Reputation Costs: The Impetus for Voluntary Derivative
Financial Instruments Reporting. Accounting, Organizations & Society, 29(2), 95-125. https://doi.org/10.1016/S0361-3682(02)00034-X
Chamisa, E. E (2000). The Relevance and Observance of the IASC Standards in Developing Countries and the Particular Case of Zimbabwe. The International Journal of Accounting, 35(2), 267–286. https://doi.org/10.1016/S0020-7063(00)00049-2
Charumathi, B. (2008). Corporate Governance Standards and Practices in Indian Banking Industry – A Comparative Analysis. SMART Journal of Business Management Studies, 4(2), 30-40.
Charumathi, B. (2010). Corporate Governance Standards and Practices in Indian Information
Technology (IT) Industry – An Empirical Study. Journal of Accounting and Finance, 24(2), 61-75.

Kota & Charumathi | Determinants of Financial Derivative Disclosures in an Emerging Economy
81
Charumathi, B., & Muralikrishnan, R. (2009). Corporate Governance and Timeliness of Financial Reporting by Indian Banks - A Comparative Research Analysis. International Journal of Business Management, Economics and Information Technology, 1(2), 267-278.
Charumathi, B., & Nithya, K. (2012).Public Disclosure by Indian Life Insurers – An Empirical
Study. Independent Business Review, 5(2), 47-70. Charumathi, B., & Ramesh, L. (2013). Voluntary Disclosures by Nifty Companies: A Content
Analysis. Indian Accounting Review, 17(2), 67-82. Charumathi, B., & Surulivel, S. T. (2009). Effectiveness of Information Disclosure of Indian
Public Sector Banks in their Websites- An Empirical Study. SMART Journal of Business Management Studies, 5(2), 5-12.
Charumathi, B., & Surulivel, S. T (2009). Quantitative Evaluation of Indian Public Sector
Banks’ Websites – An Empirical Study. International Journal of Computer Science, System Engineering and Information Technology, 2(2), 101-106.
Chau, G.K., & Gray, S. J. (2002). Ownership Structure and Corporate Voluntary Disclosure in Hong Kong and Singapore. The International Journal of Accounting, 37(2), 247–265.
https://doi.org/10.1016/S0020-7063(02)00153-X
Chen, S., Chen, X., & Cheng, Q. (2008). Do Family Firms Provide more or Less Voluntary
Disclosure? Journal of Accounting Research, 46(3), 499-536. https://doi.org/10.1111/j.1475-679X.2008.00288.x
Chow, C. W., & Wong-Boren, A. (1987). Voluntary Financial Disclosure by Mexican Corporations. The Accounting Review, 62(3), 533-541.
Cooke, T. E. (1992). The Impact of Size, Stock market listing, and Industry type on Disclosure in the Annual Reports of Japanese Listed Corporations. Accounting and Business Research, 22(87), 229-237. https://doi.org/10.1080/00014788.1992.9729440
Dimson, E., Karakas, O., & Li, X. (2015). Active ownership. Review of Financial Studies, 28(12), 3225–3268. https://doi.org/10.1093/rfs/hhv044
Dobrzynski, J. (1993). Relationship investing. Business Week, March 15, 68–75. Donaldson, L. (2008). Ethics Problems and Problems with Ethics: Toward a Pro-Management
Theory. Journal of Business Ethics, 78(3), 299-311. https://doi.org/10.1007/s10551-006-9336-6 Donaldson, L. (1990). The ethereal hand: Organizational economics and management theory.
Academy of Management Review, 15(3), 369-381. https://doi.org/10.5465/amr.1990.4308806
Donaldson, L., & Davis, J. H. (1991). Stewardship theory or agency theory: CEO governance and shareholder returns. Australian Journal of Management, 16(1), 49–64.
https://doi.org/10.1177/031289629101600103
AABFJ | Volume 12, no. 3, 2018
82
Dunne, T., Helliar, C., Power, D., Mallin, C., Ow-Yong, K., & Moir, L. (2004). The Introduction of Derivatives Reporting in the UK: A Content Analysis of FRS13 Disclosures. Journal of Derivatives Accounting, 1(2), 205-219. https://doi.org/10.1142/S0219868104000166
Durand, R., & Vargas, V. (2003). Ownership, organization, and private firms' efficient use of resources. Strategic Management Journal, 24(7), 667-675. https://doi.org/10.1002/smj.321
Edwards, G., & Eller, G. (1995). Overview of Derivatives Disclosures by Major U. S. Banks. Federal Reserve Bulletin. September, 817-831.
Edwards, G., & Eller, G. (1996). Derivatives Disclosures by Major U. S. Banks. Federal Reserve Bulletin. September, 792-801.
Feay, W. F., & Abdullah, F. A. (2001). Impact of New Derivative Disclosures on Multinational Firms’ Financing Strategies. Multinational Business Review, 9(1), 1-8.
Financial Reporting Council (2012). The UK stewardship code: September 2012. London: FRC.
Firth, M. (1979). The Impact of Size, Stock Market Listing and Auditors on Voluntary Disclosure in Corporate Annual Reports. Accounting and Business Research, 9(36), 273-280. https://doi.org/10.1080/00014788.1979.9729168
Freedman, M., & Jaggi, B. (2005). Global Warming, Commitment to the Kyoto Protocol and Accounting Disclosures by the Largest Global Public Firms from Polluting Industries. International Journal of Accounting, 40(3), 215-232.
https://doi.org/10.1016/j.intacc.2005.06.004 Garg, M., & Divya. (2013). Accounting Standard Disclosure Compliance in Online Reporting by
Indian Companies. Asia-Pacific Journal of Management Research and Innovation, 5(2), 141-153.
Glaum, M., & Street, D. L. (2003). Compliance with the Disclosure Requirements of Germany’s
New Market: IAS Versus US GAAP. Journal of International Financial Management and Accounting, 41(1), 64-100. https://doi.org/10.1111/1467-646X.00090
Greenspan, A. (1999). Remarks by Chairman Alan Greenspan before the Futures Industry
Association, Boca Raton, Florida, March 19, 1999, available at http://www.federalreserve.gov/boarddocs/speeches/1999/19990319.htm
Hafiz, N. B. (2003). Voluntary Disclosures Level: A Study on Disclosure of Derivatives Financial Instruments, Company Size and Foreign Activity Level. Unpublished Master of Accounting Dissertation. Universiti Kebangsaan Malaysia.
Hassan, M. S., Percy, M., & Goodwin-Stewart, J. (2006-2007). The Transparency of Derivative Disclosures by Australian Firms in Extractive Industries. Corporate Ownership and Control, 4(2), 257-270.
Hassan, M. S., Saleh, N. M., & Rahman, M. R. (2007). Determinants of Financial Instruments Disclosure Quality among listed firms in Malaysia. Retrieved from http://ssrn.com/abstract=1157788 on 09.03.2014.
Hernandez, M. (2012). Toward an Understanding of the Psychology of Stewardship. Academy of Management Review, 37(2), 172–193. https://doi.org/10.5465/amr.2010.0363

Kota & Charumathi | Determinants of Financial Derivative Disclosures in an Emerging Economy
83
Hossain, M. (2008). The Extent of Disclosure in Annual Reports of Banking Companies – The Case of India. European Journal of Scientific Research, 23(4), 659-680.
Hossain, M. A. (2008). The Extent of Disclosure in Annual Reports of Banking Companies: The Case of India. European Journal of Scientific Research, 23(4), 659-680.
Hossain, M. A., Tan, L. M., & Adams, M. (1994). Voluntary Disclosure in an Emerging Capital Market: Some Empirical Evidence from Companies Listed on the Kuala Lumpur Stock Exchange. The International Journal of Accounting, 29(4), 334-351.
Hossain, M., & Reaz, M. (2007). The Determinants and Characteristics of Voluntary Disclosure
by Indian Banking Companies. Corporate Social Responsibility and Environmental Management, 14(5), 274-288. https://doi.org/10.1002/csr.154
Hossain, M., & Hammami, H. (2009). Voluntary Disclosure in the Annual Reports of an Emerging Country: The Case of Qatar. Advances in Accounting, Incorporating Advances in International Accounting, 25(2), 255-265. https://doi.org/10.1016/j.adiac.2009.08.002
Iatridis, G. (2008). Accounting Disclosure and Firms' Financial Attributes: Evidence from the UK Stock Market. International Review of Financial Analysis, 17(2), 219-241.
https://doi.org/10.1016/j.irfa.2006.05.003 Ingram, R. W., & Frazier. K. B. (1983). Narrative Disclosures and Annual Reports. Journal of
Business Research, 11(1), 49-60. https://doi.org/10.1016/0148-2963(83)90038-3 Joshi, P., Suwaidan, M., & Kumar, R. (2012). Determinants of Environmental Disclosures by
Indian Industrial Listed Companies in their Websites: Empirical Study. International Journal of Accounting and Finance, 3(2), 109-130. https://doi.org/10.1504/IJAF.2011.043843
Karim, A. K. M. W., & Ahmad, J. U. (2005). Determinants of IAS Disclosure Compliance in Emerging Economies: Evidence from Exchange Listed Companies in Bangladesh. Working Paper No. 21, Victoria University of Wellington.
Karns, G. (2011). Stewardship: A new vision for the purpose of business. Corporate Governance. 11(4). 337-347. https://doi.org/10.1108/14720701111159190
Kaur, M., & Narang, S. (2010). EVA Disclosures in the Annual Report of Indian Companies: An
Empirical Study. Global Business Review, 11(3), 395-420. https://doi.org/10.1177/097215091001100306 Kay, J. (2012). The Kay review of UK equity markets and long‐term decision making. Retrieved
from http://www.bis.gov.uk/assets/BISCore/business-law/docs/K/12-917-kay-review-of-equity-markets-final-report.pdf
Krippendorff, K. (1980). Content Analysis: An Introduction to its Methodology. Beverly Hills,
CA: Sage Lopes, P. T., & Rodrigues, L. L. (2007). Accounting for Financial Instruments: An Analysis of
the Determinants of Disclosure in the Portuguese Stock Exchange. The International Journal of Accounting, 42(1), 25-56. https://doi.org/10.1016/j.intacc.2006.12.002
AABFJ | Volume 12, no. 3, 2018
84
Malone, D., Fries, C., & Jones, T. (1993). An Empirical Investigation of the Extent of Corporate Financial Disclosure in the Oil and Gas Industry. Journal of Accounting, Auditing and Finance, 8(3), 249-273. https://doi.org/10.1177/0148558X9300800306
Mapuranga, P. V., Ponte, V., Coelho, A., & Meneses, A. F. (2011). Determinantes do nível de disclosre de instrumentos financeiros derivatives em firmas brasileiras’, Revista Contabilidade & Finanças, 22(57), 263-278.
https://doi.org/10.1590/S1519-70772011000300003 McNally, G. M., Eng, L. H., & Hasseldine, C. R. (1982).Corporate Financial Reporting in New
Zealand: An Analysis of User Preferences, Corporate Characteristics and Disclosure Practices for Discretionary Information. Accounting and Business Research, 13(49), 11-20.
https://doi.org/10.1080/00014788.1982.9729725
Meek, G. C., Roberts, B., & Gray, J. (1995). Factors Influencing Voluntary Annual Report Disclosures by U.S., U.K. and Continental European Multinational Corporations. Journal of International Business Studies, 26(3), 555-572. https://doi.org/10.1057/palgrave.jibs.8490186
Mohamed, Z. M., & Janggu, T. (2006). Corporate Social Disclosure of Construction Companies in Malaysia. Malaysian Accounting Review, 5(1), 85-114.
Monks, R., & Minow, N. (1995). Corporate governance. Cambridge, MA: Blackwell.
Myners, P. (2001). Institutional investment in the UK: A review. London: HM Treasury. Nandi, S., & Ghosh, S. (2012). Corporate governance attributes, firm characteristics and the level
of corporate disclosure: Evidence from the Indian listed firms. Decision Science Letters, 2(2), 45-58.
Naser, K., Al-Khatib, K., & Karbhari, Y. (2002). Empirical Evidence on the Depth of Corporate Information Disclosure in Developing Countries: The Case of Jordan. International Journal of Commerce and Management, 12(3), 122-155. https://doi.org/10.1108/eb047456
Ng, E. J., & Koh, H. C. (1993). Companies with Non-Mandatory Accounting Pronouncements: The Singapore Experience. Singapore Management Review, 15(1), 41-55.
Owusu-Ansah, S., & Yeoh, J. (2005). The Effect of Legislation on Corporate Disclosure Practices. ABACUS, 41(1), 92 - 109. https://doi.org/10.1111/j.1467-6281.2005.00171.x
Popova, T., Georgakopoulos, G., Sotiropoulos, I., & Vasileiou, K. Z. (2013). Mandatory Disclosure and its Impact on the Company Disclosure. International Business Research, 6(5), 1-16.
Ragini, (2012). Corporate Disclosure of Intangibles: A Comparative Study of Practices among
Indian, US and Japanese Companies. Vikalpa, 37(3), 51-72. https://doi.org/10.1177/0256090920120305 Roulstone, D. (1999). Effect of SEC Fnancial Reporting Release No. 48 on Derivative and
Market Risk Disclosures. Accounting Horizons, 13(4), 343-363. https://doi.org/10.2308/acch.1999.13.4.343
Kota & Charumathi | Determinants of Financial Derivative Disclosures in an Emerging Economy
85
Sarkar, P. (2011). Disclosures in Corporate Annual Reports – A Case Study of some selected Public Limited Companies in India. The Chartered Accountant, October. Retrieved from http://220.227.161.86/24518cajournal_oct2011_14.pdf on 10.03.2014.
Sen, M., Mukherjee, K., & Pattanayak, J. K. (2011). Corporate environmental disclosure
practices in India. Journal of Applied Accounting Research, 12(2), 139 – 156. https://doi.org/10.1108/09675421111160709 Shleifer, A., & Vishny, R. (1986). Large shareholders and corporate control. Journal of Political
Economy, 94(3), 461–48. https://doi.org/10.1086/261385 Shleifer, A., & Vishny, R. (1997). A survey of corporate governance. The Journal of
Finance, 52(2), 737–783. https://doi.org/10.1111/j.1540-6261.1997.tb04820.x Singh, S., & Kansal, M. (2011). Voluntary disclosures of intellectual capital: An Empirical
Analysis. Journal of Intellectual Capital, 12(2), 301 – 318. https://doi.org/10.1108/14691931111123430
Singhvi, S. S. (1968). Corporate Disclosure through Annual Reports in the United States of America and India. The Journal of Finance, 23(3), 551-552.
Skinner, D. J. (1994). Why firms voluntarily disclose bad news? Journal of Accounting Research, 32(1), 38-60. https://doi.org/10.2307/2491386
Soliman, M. M. (2013). Firm Characteristics and the Extent of Voluntary Disclosures: The Case of Egypt. Research Journal of Finance and Accounting, 4(17), 71-80.
Spero, L. L. (1979). The Extent and Causes of Voluntary Disclosure of Financial Information in
Three European Capital Markets: An Exploratory Study. A doctoral dissertation, Harvard University Graduate School of Business.
Van Slyke, D. (2007). Agents or Stewards: Using Theory to Understand the Government-
Nonprofit Social Service Contracting Relationship. Journal of Public Administration Research and Theory, 17(2), 157–187. https://doi.org/10.1093/jopart/mul012
Varghese, R. (2012). Voluntary Corporate Disclosures by Indian Companies. Indian Journal of
Finance, 6(7), 4-12. Varma, J. R. (1997). Corporate Governance in India: Disciplining the Dominant Shareholder.
IIMB Management Review, 9(4), 5-16 Villalonga, B., and Amit, R. H. (2006). How Do Family Ownership, Control and Management
Affect Firm Value? Journal of Financial Economics, 80(2), 385-417. https://doi.org/10.1016/j.jfineco.2004.12.005
Wallace, R. S. O. (1988). Corporate Financial Reporting in Nigeria. Accounting and Business Research, 18(72), 352-362. https://doi.org/10.1080/00014788.1988.9729382

AABFJ | Volume 12, no. 3, 2018
86
Wallace, R. S. O., & Naser, K. (1995). Firm Specific Determinants of the Comprehensiveness of Mandatory Disclosure in the Corporate Annual Reports and Firm Characteristics in Spain. Accounting and Business Research, 25(7), 41-53.
Watson, A., Shrives, P., & Marston, C. (2002). Voluntary Disclosure of Accounting Ratios in the U.K.’, British Accounting Review, 34(2), 289-313. https://doi.org/10.1006/bare.2002.0213
Woods, M., & Marginson, D. (2004). Accounting for Derivatives: An Evaluation of Reporting
Practice by UK Banks. European Accounting Review, 13(2), 373-391. https://doi.org/10.1080/0963818032000138215