Embed Size (px)
Citation preview

i
Determinants of Continuance Intention in
Wearables
Bruno Alexandre Pinto Dimas Nascimento
The Case of Smartwatches
Dissertation presented as partial requirement for obtaining
the Master’s degree in Information Management

ii
NOVA Information Management School
Instituto Superior de Estatística e Gestão de Informação
Universidade Nova de Lisboa
DETERMINANTS OF CONTINUANCE INTENTION IN WEARABLES: THE
CASE OF SMARTWATCHES
by
Bruno Alexandre Pinto Dimas Nascimento
Dissertation presented as partial requirement for obtaining the Master’s degree in Information
Management, with a specialization in Marketing Intelligence
Advisor: Prof. Doutor. Tiago André Gonçalves Félix de Oliveira
February 2016

iii
DEDICATION
To the two pillars in my life, Mom and Dad, for providing me with the tools and conditions to learn,
grow, and thrive. To my Mom – thank you for your never ending support, and for all the things you
had to give up in order to see me succeed. I’ll make sure that this success is long lasting. To my Dad –
I wish you were still here to see me reach the potential you always knew I was capable of. Thank you
for giving me the strenght to overcome all the adversities, even from up there.
To my friends – without your encouragement and non-judgmentalism, the road would have seemed
a lonely place.
To Nataša – my eternal cheerleader. You held me high at my lowest, celebrated my small
achievements, made me believe that everything is possible. My heart will always be with you.
Words cannot express how much I love you all.
“Não tenhamos pressa, mas não percamos tempo.”

iv
ACKNOWLEDGEMENTS
To the ancestors who paved the path before me upon whose shoulders I stand.
To Prof. Dr. Tiago Oliveira for his extreme patience in the face of numerous obstacles, and for the
generosity with his personal time, mentorship, and unwavering support. Thank you for pushing me
forward.
To NOVA IMS for allowing me to conduct my research and providing any assistance requested.
To everyone who walked alongside me during the last 10 years, who guided me, and showed me the doors that can be opened.

v
ABSTRACT
Smartwatch sales have been growing for the past few years, but their regular use is still sub-par.
Understanding the primary determinants of smartwatch continuance intention is thus important for
brands, researchers, and users alike. Therefore, a conceptual model was developed that combines
the expectation-confirmation model (ECM) with habit, perceived usability, and perceived enjoyment,
to explain the continuance intention of smartwatches. To test the conceptual model, we collected
data from the U.S.A. (574 valid cases). Our results support the relationships of ECM, such as
confirmation, perceived usefulness, and satisfaction, and also the role of habit and perceived
usability. Habit was the most important factor to explain the continuance intention of smartwatches.
KEYWORDS
Smartwatches, Wearables, Continuance Intention, Expectation-Confirmation Model (ECM), Habit,
Perceived Usability, Perceived Enjoyment
vi
SUBMISSION
SUBMISSION RESULTING FROM THIS DISSERTATION
PAPER
Nascimento, B. & Oliveira, T. DETERMINANTS OF CONTINUANCE INTENTION IN WEARABLES:
THE CASE OF SMARTWATCHES (submission to a Journal)

vii
INDEX
1. Introduction .................................................................................................................. 1
2. Theoretical Background ................................................................................................ 2
2.1. The concepts of wearable technology and smartwatches .................................... 2
2.2. Continuance Theory .............................................................................................. 3
2.3. Expectation-Confirmation Theory and Expectation-Confirmation Model ............ 3
3. Research Model ............................................................................................................ 6
3.1. Confirmation .......................................................................................................... 6
3.2. Perceived Usefulness ............................................................................................. 7
3.3. Satisfaction ............................................................................................................ 7
3.4. Habit ...................................................................................................................... 7
3.5. Perceived Usability ................................................................................................ 8
3.6. Perceived Enjoyment ............................................................................................. 9
4. Methods...................................................................................................................... 10
4.1. Measurement Instruments ................................................................................. 10
4.2. Data Collection .................................................................................................... 10
5. Results......................................................................................................................... 12
5.1. Measurement Model ........................................................................................... 12
5.2. Structural Model .................................................................................................. 13
6. Discussion ................................................................................................................... 15
6.1. Theoretical Implications ...................................................................................... 15
6.2. Managerial Implications ...................................................................................... 15
6.3. Limitations and Future Research ......................................................................... 16
7. Conclusions ................................................................................................................. 18
8. Bibliography ................................................................................................................ 19
9. Annexes ...................................................................................................................... 26

viii
LIST OF FIGURES
Figure 1 - Expectation-Confirmation Theory process ................................................................ 3
Figure 2 - Expectation-Confirmation Model (Bhattacherjee, 2001b) ........................................ 4
Figure 3 - Research model .......................................................................................................... 6
Figure 4 - Model with results ................................................................................................... 14
Figure 5 - Continuance intention - Moderation between Habit and Satisfaction ................... 16

ix
LIST OF TABLES
Table 1 - Summary of previous research related to the continuance intention to use
smartwatches ..................................................................................................................... 5
Table 2 - Demographic data of responses ................................................................................ 11
Table 3 - Correlation matrix, composite reliability (CR), and square root of AVEs .................. 12
Table 4 - Loadings and cross-loadings for the measurement model ....................................... 13
Table 5 - Comparison between Bhattacherjee's (2001b) ECM and the research model ........ 15

x
LIST OF ABBREVIATIONS AND ACRONYMS
ECT Expectation-Confirmation Theory
EDT Expectation-Disconfirmation Theory
ECM Expectation-Confirmation Model
TAM Technology Acceptance Model
DOI Diffusion of Innovations
UI User Interface
IS Information System
IT Information Technology
SEM Structured Equation Modeling
AVE Average Variance Extracted
PLS Partial Least Squares

1
1. INTRODUCTION
The global market has witnessed sustained growth in the acceptance of wearable devices in the last
few years. By Q4 2014, one in every five Americans were already owning some wearable device
(PwC, 2014, p. 11). Wearable technology has a big potential and a growing acceptance as a novelty
technology, but it is essential to study the intention of users to continue using it so that both
companies and consumers can benefit. According to Juniper Research (Moar, 2016), an estimated
17.1 million smartwatches were shipped in 2015. Wearables, and in particular, smartwatches, do
show potential benefits but are still far from reaching mainstream acceptance that is similar to that
of smartphones (Danova, 2014). In fact, according to the PwC report (PwC, 2014), only one in ten
Americans uses a wearable device every day.
In 2015, North America accounted for roughly 40% of the global wearables market (Cisco, 2016).
With a global revenue of $750M in 2012 (Ak, 2014), the smartwatch market is expected to reach
$32.9B in 2020, growing at a compound annual growth rate of 67.6% (Kohli, 2015). Despite this
growth, consumers still show some reluctance towards smartwatches (Danova, 2014; PwC, 2014).
Wearable technology and, in particular, smartwatch technology, are exciting new technologies to be
researched because they allow for the continuous and reliable collection of data (Rawassizadeh,
Price, & Petre, 2015), and the augmentation of human abilities and capabilities (Starner, 2001). This
collected data has a significant potential in, for example, mobile health (mHealth) applications, not
only for a healthier lifestyle but especially with the elderly care. At the same time, studies on this
topic are relatively small in quantity, and mostly done by non-independent third-parties; hence the
importance of an independent study to understand the continuance intention of IT.
The contribution of this research is fourfold. First most, extensive research has been conducted on
the topic of technology acceptance, but the topic of technology continuance intention has a greater
impact on the long-term viability of an information system (Bhattacherjee, 2001b). For this reason,
this study thus aims to extend the knowledge on the latter topic. Secondly, empirical work regarding
wearables and, in particular, smartwatches is very scarce. To the best of our knowledge, no
published work was found on the topic of smartwatch continuance intention. A big contribution of
this study is, in fact, the extension of knowledge on this topic. Third, this study takes an existing
empirically validated post-acceptance theoretical model (the expectation-confirmation model
(Bhattacherjee, 2001b)), extends it with perceived enjoyment (due to the hedonic component of
wearable technology (Wakefield & Whitten, 2006)), perceived usability (due to the small screen of
the device (Budiu, 2015, sec. Focus on the Essential)), and habit factors (due to the novelty of the
technology (Polites & Karahanna, 2012)), and tests it with the topic of smartwatches for the first
time. Fourth, as a new technology, smartwatches are still understudied. This study may, therefore,
help brands with understanding the determinant factors that influence the continued use of the
technology, and, ultimately, to develop products that deliver the most value to retain customers.
The structure of the paper is as follows. In the next section, the concepts of wearables,
smartwatches, continuance theory, and expectation-confirmation model are presented. Then, the
research model is conceptualized. Posteriorly, the design, methodology, and results of this research
are presented. Finally, the results of this study are discussed, including its implications for theory and
practice, and further possible research directions are outlined.

2
2. THEORETICAL BACKGROUND
2.1. THE CONCEPTS OF WEARABLE TECHNOLOGY AND SMARTWATCHES
Wearable technology is a form of ubiquitous computing, according to Mark Weiser (1991), as “it
weaves itself into the fabric of everyday life until it is indistinguishable from it” (p. 94). It translates
the concept of having computing everywhere and anywhere, and also extends the mobile concept as
it can appear on any device, format, and location. Regarded as the father of wearable computing,
Steve Mann (1998) defines it as a computer that is always on and always accessible. Some of the
most common integrations of wearable technology include clothing (Kosir, 2015), glasses/goggles
(such as the Google Glass and the Oculus Rift), bracelets (such as the Fitbit and Jawbone brands), and
watches (such as the Apple Watch or the Samsung Galaxy Gear S).
Wearable technology is revolutionary in the sense that it is present at all times, and therefore, it
allows an augmented interaction with the world around the user. According to Mann (1998), by
definition, wearables have a constancy characteristic, meaning that they do not need to be turned on
or opened up before use. In this way, according to Salah, MacIntosh, & Rajakulendran (2014),
wearable devices have greater potential than smartphones “in any industry where hands-free data
collection is highly valued” (p. 8) or “whenever information or communication is required, a hands-
free interface is helpful, and consistent monitoring is beneficial” (p. 10). Besides having important
application in, for example, the medical industry (Pentland, 2004; Salah et al., 2014; Sungmee Park &
Jayaraman, 2003), wearables are also important in one’s work and personal lives as ways to manage
information (Billinghurst & Starner, 1999) and connect in new ways (PwC, 2014).
According to the Smartwatch Group (“What is a smartwatch? Definition,” 2015), a smartwatch is
defined by being worn on the wrist, able to indicate time and wirelessly connect to the internet. For
Rawassizadeh et al. (2015), a smartwatch is not just a device that tells time, but a “general-purpose,
networked computer with an array of sensors”. This study narrows those definitions and considers a
smartwatch a device that is worn on the wrist, has a screen, is wirelessly connected to the internet
on its own or through a smartphone, contains sensors (such as accelerometers, IR sensors, etc.), and
can run either proprietary or third-party apps.
Smartwatches, according to Business Intelligence (Danova, 2014), will make up 59% of all wearable
device shipments in 2015, and over 70% by 2019, making them the most relevant wearable devices.
They liberate us from the hassle caused by smartphones themselves (Marks, 2013), as they can
“provide relevant information within a very short interaction period” (Bieber, Kirste, & Urban, 2012,
p. 1). Not only that, smartwatches might be easier to operate in certain work conditions due to them
being mostly water resistant, having a battery life that spans a couple of days to years, and sensors
that enable possible gesture interactions (Bieber et al., 2012).
As a platform, a smartwatch is only as good as the quality of the apps it has at its disposal (O’Reilly,
2015). Apple is slightly ahead of other major players in the market due to, not only, the number
(Curry, 2015), but also the quality of apps (Mitroff, 2012). According to the PwC (2014) report on
wearables, the Apple Watch is the sleek device that “will help mainstream the entire wearable
category” (p. 11), and users will adopt this technology, but only if “it’s useful, interesting and/or fun”
(p. 25).

3
2.2. CONTINUANCE THEORY
Technology acceptance and use has been covered extensively by the information systems (IS)
literature (Davis, 1989; Venkatesh, Morris, Davis, & Davis, 2003). The continuance intention of
information technology (IT) is, however, the hot topic right now in the field of IS (Bhattacherjee,
2001b; Hoehle & Venkatesh, 2015; Venkatesh, Thong, Chan, Hu, & Brown, 2011). This topic has been
researched with different technologies, including e-learning (K. M. Lin, 2011), internet banking
(Eriksson & Nilsson, 2007), social networking (Cheung, Jin, Lee, Lee, & Chen, 2009), and personal IT
devices (Chen & Koufair, 2014).
Bhattacherjee (2001b) argues that when considering IS success, the initial acceptance of IS plays a
significant role, but ultimately, it is the continued used that will determine its long-term viability.
Previous studies have also primordially considered the importance of continuance intention, like
Rogers' (2003) five-stage diffusion of innovations (DOI) theory. The DOI theory incorporates the
decision to continue or discontinue the use of technology in its final confirmation stage. However,
Rogers’s (2003) study, like other previous studies, uses the same “pre-acceptance variables to explain
both acceptance and continuance decisions” (Bhattacherjee, 2001b, p. 352), and thus, does not
account for users who discontinue IS usage after previously accepting it.
2.3. EXPECTATION-CONFIRMATION THEORY AND EXPECTATION-CONFIRMATION MODEL
The expectation-confirmation theory (ECT) or expectation-disconfirmation theory (EDT) provides an
explanation for consumers repurchase intention through satisfaction, typically used in the marketing
field. This theory demonstrates that consumers reach a repurchase intention in the following way.
Before purchase, consumers have expectations about specific products or services (Oliver, 1980),
that is based on existing knowledge and prior experience (Zeithaml, Parasuraman, & Berry, 1990).
This existing knowledge can be attained through interactions with different branches of the
communication channels (Rogers, 2003), whether they are represented by mass-media or one-to-
one marketing, but also from feedback from previous users and discussions amidst peer consumers
(Premkumar & Bhattacherjee, 2008; Rogers, 2003). Thus, the extent of the expectations can vary for
different customers for the same product (Tse & Wilton, 1988), depending on the factors mentioned
above.
Consumers might form perceptions about the performance of a product or service. However, if the
information about the product or service is misleading, expectations will not be realistic (Boulding,
Lee, & Staelin, 1994; Oliver, 1980). Figure 1 represents the expectation-confirmation theory process
which, ultimately, leads to a level of satisfaction.
Figure 1 - Expectation-Confirmation Theory process
Traditional ECT, however, is limited when explaining the formation process of IS expectation (Khalifa
& Liu, 2004). Consumers might want to purchase a product even without having formed strong
4
expectations. Moreover, an IS that has an element of novelty may cause a different set of
expectations that varies from user to user. Also, ECT deals with beliefs and attitudes toward a
product’s attributes or performance (Olson & Dover, 1979), but does not capture its quality factors.
In response to this, IS researchers have adapted the ECT to overcome its limitations.
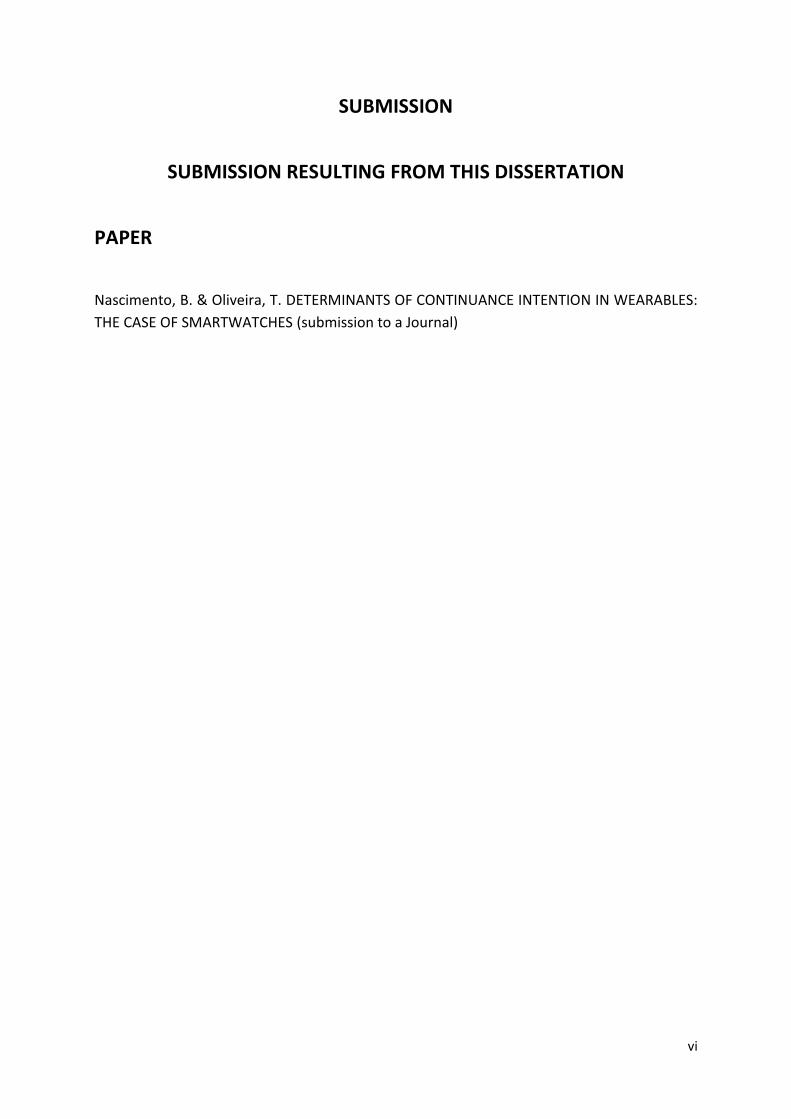
The most popular adaptation is the one of Bhattacherjee (2001b): the expectation-confirmation
model (ECM). The ECM (see, Figure 2) resolves around the assumptions of the IS continuance theory,
where satisfied IT users are also more likely to use the technology continuously (Bhattacherjee,
2001b; Deng, Turner, Gehling, & Prince, 2010). It improved the ECT and previous models by focusing
on post acceptance variables like perceived usefulness, a post-usage expectation, rather than on
pre—usage expectations. The ECM postulates that “the effects of any pre-acceptance variables are
already captured within the confirmation and satisfaction constructs” (Bhattacherjee, 2001b, p. 355).
Figure 2 - Expectation-Confirmation Model (Bhattacherjee, 2001b)
For reference, the perceived usefulness in Davis' (1989) technology acceptance model (TAM) refers
to a pre-usage usefulness, but in Bhattacherjee's (2001b) ECM, it refers to a post-usage usefulness
which reflects a long-term belief as a result of accumulated usefulness perceptions. The ECM builds
on the ECT and adapts it to the context of IT continuance not only by replacing ECT’s expectation
with post-usage perceived usefulness but also by replacing ECT’s repurchase intention with
continued usage intention. Bhattacherjee's (2001b) model also removes the performance construct
of ECT because it assumes that the influence of perceived performance is explained by confirmation,
which is defined as “the congruence between expectation and actual performance” (Bhattacherjee,
2001b, p. 359).
The ECM has been well researched and validated in several technologies such as mobile banking
(Susanto, Chang, Zo, & Park, 2012), microblogging (Barnes & Böhringer, 2011), and mobile internet
(S. Hong, Thong, & Tam, 2006). When it comes to wearable technology and smartwatches, however,
research on the continuance intention of the technology is seemingly non-existent. Nonetheless,
smartphones share quite a few characteristics with wearables/smartwatches (mobility, always-on
connection, type of applications, etc.), so parallels could be drawn between both. Yet, research on
the continuance intention to use smartphones is also scarce. Notwithstanding, the major findings of
each investigation on this topic and its predictive power in explaining the continuance intention to
use the technology are presented in Table 1.

5
Main Theory Additional Constructs
Context Main Findings References
Expectation Confirmation Model (ECM)
User Resistance
Subjective Norm
Smartphone Continuance Intention
ECM hypothesis were confirmed
User Resistance and Subjective Norm impacted the Continuance Intention
Choi & Yoo (2015)
IS Continuance Theory
Perceived Playfulness
Individual Mobility
Temporal Dissociation
Focused Immersion
Smartphone Continuance Intention
Satisfaction positively impacted Continuance Intention
Perceived Playfulness positively impacted Continuance Intention and Satisfaction
Focused Immersion was not supported as a moderator between Satisfaction and Continuance Intention
Temporal Dissociation impacted the relationship between Satisfaction and Continuance Intention
Tan, Lee, & Hsu (2015)
TAM Utilitarian Value
Pleasure
Hedonic Value
Past Usage
Smartphone Functions Continuance Intention
Perceived Usefulness was a strong predictor of Continuance Intention
Utilitarian value moderated the relationships between antecedents and Continuance Intention
Xu, Lin, & Chan (2012)
IS Continuance Theory
Affective appraisal
Cognitive appraisal
Task complexity
Flexibility of Multiple Personal IT Device Use
Personal IT Device Continuance Intention
N/A (Research-in-Progress) Chen (2014)
IS Continuance Theory
Push-Pull-Mooring Model (PPM)
Switching Intention
Smartphone Continuance/Switching Intention
Alternative Attractiveness (Pull effect), Attitude Towards Switching and Variety Seeking (Mooring effect) were the most significant influencers of Switching Intention
Sung (2013)
IS Continuance Theory
Network Quality
System Quality
Contents Quality
Customer Support
Compatibility
Smartphone Continuance Intention
All of the additional constructs only showed a significant relationship with Satisfaction and not with Continuance Intention
Role of Satisfaction as a mediator was verified
M. Kim, Chang, Park, & Lee (2015)
Table 1 - Summary of previous research related to the continuance intention to use smartwatches

6
3. RESEARCH MODEL
This research encompasses a technology that accompanies the user throughout the day and is more
immediate than the smartphone. As such, a level of enjoyment must be necessary for the
continuance intention to exist. Information and user interface (UI) density in the small screen of the
smartwatch might pose a potential problem when considering its continuance intention, and thus,
the usability of the device must also be taken into consideration. Since this is a relatively new
technology, using it may not be immediate, and overcoming certain less positive aspects of the
device may require a degree of habit. Therefore, it is proposed to test Bhattacherjee's (2001b) ECM
with the added constructs of perceived enjoyment, perceived usability, and habit. In this section,
each of the determinants of the ECM, perceived enjoyment, perceived usability, and habit are
defined, and the role of key moderators are specified. Figure 3 present the research model.
Figure 3 - Research model
3.1. CONFIRMATION
If users’ pre-acceptance usefulness perceptions are not confirmed in the post-purchase period, a
phenomena called cognitive dissonance may occur (Bhattacherjee, 2001b; Festinger, 1957). To
minimize this dissonance, users might adjust their perceptions of usefulness to match reality.
According to research, confirmation leads to an increased perception of usefulness, while
disconfirmation, to a decreased one (Chiu, Hsu, Sun, Lin, & Sun, 2005; Roca, Chiu, & Martínez, 2006;
Thong, Hong, & Tam, 2006). Although the level of performance is captured by confirmation, as
posited by the ECM (Bhattacherjee, 2001b), it is likely that confirmation will also significantly
influence the post-acceptance perceived usability and perceived enjoyment (as expected benefits),
which in turn motivate users to continuously use (Bhattacherjee & Barfar, 2011). According to C. S.
Bhattacherjee, 2001b

7
Lin, Wu, & Tsai (2005), it is indeed expected that confirmation has an impact on perceived
enjoyment. In this way, it is hypothesized:
H1. Confirmation (CONF) will have a positive impact on Perceived Usefulness (PU).
H2. Confirmation (CONF) will have a positive impact on Perceived Usability (USAB).
H3. Confirmation (CONF) will have a positive impact on Perceived Enjoyment (ENJ).
Both the research of Bhattacherjee (2001b) and Limayem et al. (2007) show that the level of users’
confirmation positively impacts their satisfaction with the technology. If the initial expectation is
more analogous with, or lower than the user’s actual experience, it is expected that they have more
satisfaction. In contrast, if the initial expectation is superior to the user’s actual experience,
dissatisfaction will occur. As such, it is hypothesized:
H4. Confirmation (CONF) will have a positive impact on Satisfaction (SAT).
3.2. PERCEIVED USEFULNESS
According to Davis (1989), perceived usefulness represents users’ perceptions of the expected
benefits of using an IS. It is connected with the aspect of performance of IS use (Bhattacherjee,
2001b; Venkatesh et al., 2011). Not only Bhattacherjee's (2001b) study establishes a positive
relationship between perceived usefulness and satisfaction, and perceived usefulness and
continuance intention, but subsequent studies (Limayem et al., 2007; C. S. Lin et al., 2005; Venkatesh
et al., 2011) also reinforce that relationship. The more benefits users get from smartwatches, the
more they are satisfied, and thus, more likely to continue using them. In this way, it is hypothesized:
H5. Perceived Usefulness (PU) will have a positive impact on Satisfaction (SAT).
H6. Perceived Usefulness (PU) will have a positive impact on Continuance Intention (INT).
3.3. SATISFACTION
Satisfaction is regarded as a critical factor when considering customer loyalty in marketing literature.
In marketing literature, satisfaction is considered key to building and retaining a loyal base of long-
term consumers. Similarly, that relation is also expected in the context of IS “where satisfaction with
an IS tends to reinforce a user’s intention to continue using the system” (Limayem et al., 2007, p.
708). Bhattacherjee’s body of work (Bhattacherjee & Barfar, 2011; Bhattacherjee, 2001b; C.-P. Lin &
Bhattacherjee, 2008) indicates that satisfaction is indeed a fundamental determinant in post-
acceptance behavior. Although there is a certain cost of switching, it is expected that satisfied
smartwatch users will continue to use them. Therefore, it is posited:
H7. Satisfaction (SAT) will have a positive impact on Continuance Intention (INT).
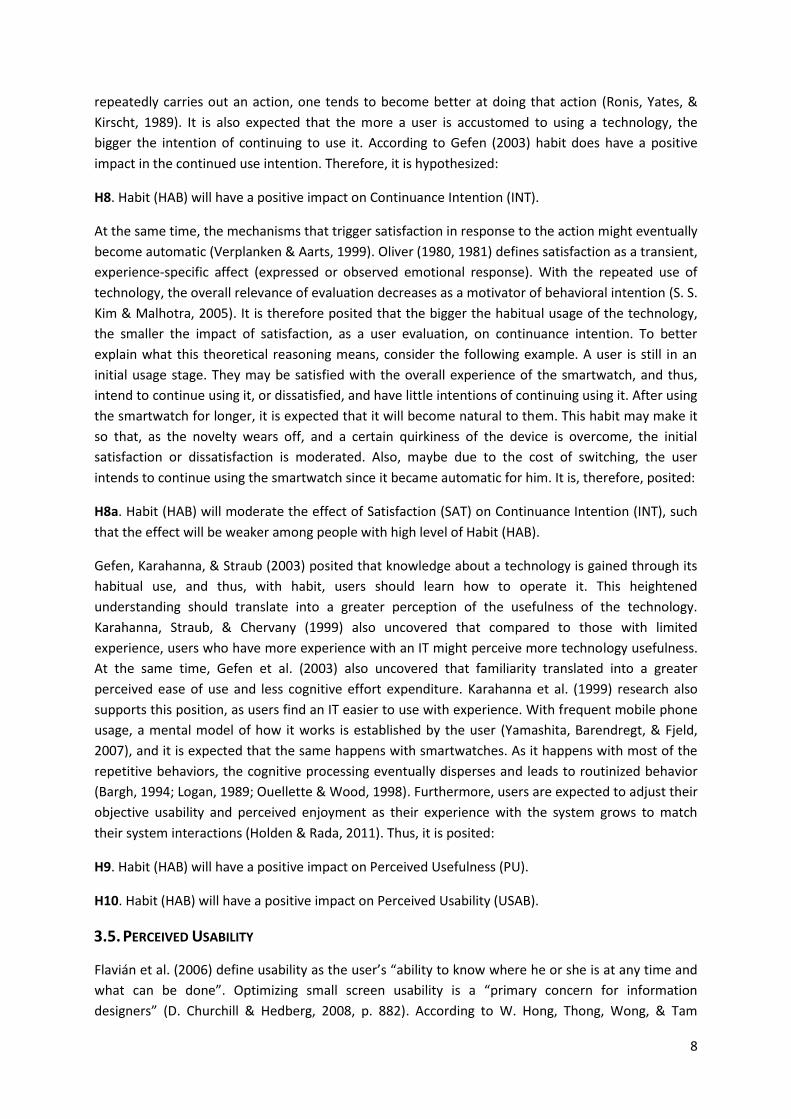
3.4. HABIT
Limayem et al. (2007) define IS habit as “the extent to which people tend to perform behaviors (use
IS) automatically because of learning” (p. 709). Although conscious intention (motivated both by
emotional and cognition responses) is reiterated by top IS researchers, “they are well aware that
some or much continuing IT use may be habitual” (De Guinea & Markus, 2009, p. 437). As one
8
repeatedly carries out an action, one tends to become better at doing that action (Ronis, Yates, &
Kirscht, 1989). It is also expected that the more a user is accustomed to using a technology, the
bigger the intention of continuing to use it. According to Gefen (2003) habit does have a positive
impact in the continued use intention. Therefore, it is hypothesized:
H8. Habit (HAB) will have a positive impact on Continuance Intention (INT).
At the same time, the mechanisms that trigger satisfaction in response to the action might eventually
become automatic (Verplanken & Aarts, 1999). Oliver (1980, 1981) defines satisfaction as a transient,
experience-specific affect (expressed or observed emotional response). With the repeated use of
technology, the overall relevance of evaluation decreases as a motivator of behavioral intention (S. S.
Kim & Malhotra, 2005). It is therefore posited that the bigger the habitual usage of the technology,
the smaller the impact of satisfaction, as a user evaluation, on continuance intention. To better
explain what this theoretical reasoning means, consider the following example. A user is still in an
initial usage stage. They may be satisfied with the overall experience of the smartwatch, and thus,
intend to continue using it, or dissatisfied, and have little intentions of continuing using it. After using
the smartwatch for longer, it is expected that it will become natural to them. This habit may make it
so that, as the novelty wears off, and a certain quirkiness of the device is overcome, the initial
satisfaction or dissatisfaction is moderated. Also, maybe due to the cost of switching, the user
intends to continue using the smartwatch since it became automatic for him. It is, therefore, posited:
H8a. Habit (HAB) will moderate the effect of Satisfaction (SAT) on Continuance Intention (INT), such
that the effect will be weaker among people with high level of Habit (HAB).
Gefen, Karahanna, & Straub (2003) posited that knowledge about a technology is gained through its
habitual use, and thus, with habit, users should learn how to operate it. This heightened
understanding should translate into a greater perception of the usefulness of the technology.
Karahanna, Straub, & Chervany (1999) also uncovered that compared to those with limited
experience, users who have more experience with an IT might perceive more technology usefulness.
At the same time, Gefen et al. (2003) also uncovered that familiarity translated into a greater
perceived ease of use and less cognitive effort expenditure. Karahanna et al. (1999) research also
supports this position, as users find an IT easier to use with experience. With frequent mobile phone
usage, a mental model of how it works is established by the user (Yamashita, Barendregt, & Fjeld,
2007), and it is expected that the same happens with smartwatches. As it happens with most of the
repetitive behaviors, the cognitive processing eventually disperses and leads to routinized behavior
(Bargh, 1994; Logan, 1989; Ouellette & Wood, 1998). Furthermore, users are expected to adjust their
objective usability and perceived enjoyment as their experience with the system grows to match
their system interactions (Holden & Rada, 2011). Thus, it is posited:
H9. Habit (HAB) will have a positive impact on Perceived Usefulness (PU).
H10. Habit (HAB) will have a positive impact on Perceived Usability (USAB).
3.5. PERCEIVED USABILITY
Flavián et al. (2006) define usability as the user’s “ability to know where he or she is at any time and
what can be done”. Optimizing small screen usability is a “primary concern for information
designers” (D. Churchill & Hedberg, 2008, p. 882). According to W. Hong, Thong, Wong, & Tam
9
(2002), the characteristics of a system are a fundamental aspect that impacts users’ continuance of a
system. Tractinsky (1997) established that UI aspects that lead to an increased perceived usability
could produce an increased acceptance of the technology. Davis (1989) and Parikh & Verma (2002)
indeed defend that certain system features of user interfaces like menus and icons are precisely
designed to augment usability. Branscomb & Thomas (1984) suggest that a good user interface might
enable various ways for users to access a specific function, and such user interface would enhance
the perceived usefulness of the technology. At the same time, Scott, Gudea, Golden, & Acton (2004)
argue that not only the usability of a system is fully connected to the user acceptance of a UI through
mediation, but at the same time comprises user satisfaction. In fact, Park & Hwan Lim (1999)
proposed that the usability of user interfaces is one of the factors that impacts user satisfaction.
Therefore, it is posited:
H11. Perceived Usability (USAB) will have a positive impact on Perceived Usefulness (PU).
H12. Perceived Usability (USAB) will have a positive impact on Satisfaction (SAT).
3.6. PERCEIVED ENJOYMENT
Motivation theorists distinguish between two types of motivation - extrinsic and intrinsic - with
extrinsic motivation being related to the activity as an instrument to attain a valued outcome (Ryan &
Deci, 2000). Perceived usefulness is an example of this extrinsic motivation, according to Davis,
Bagozzi, & Warshaw (1992). Perceived enjoyment, on the other hand, is an example of intrinsic
motivation, as it refers to the satisfaction of the activity itself, according to Davis et al. (1992). Meso,
Musa, & Mbarika (2005) consider that ubiquitous technologies like smartphones can be used for
business or social functions. Thong et al. (2006) postulate that perceived enjoyment could indeed
affect user satisfaction since some technologies “are used for fun and enjoyment rather than for
performance enhancement (e.g., iPod, Playstation, surfing the World Wide Web)” (p.803). Previous
research highlighted the importance of perceived enjoyment as a determinant of IT usage, especially
in TAM studies (Agarwal & Karahanna, 2000; Davis, 1989; Heijden, 2004; Venkatesh et al., 2003).
Particularly, Davis et al. (1992) uncovered perceived enjoyment as the key motivator of PC usage
intention. These validated and positive relationships between perceived enjoyment and IT usage are
not expected to change in the case of wearable technology, and in particular, smartwatches. Users
may want to use smartwatches to increase their productivity while also having an enjoyable
experience when doing so. Therefore, it is proposed:
H13. Perceived Enjoyment (ENJ) will have a positive impact on Satisfaction (SAT).
H14. User’s Perceived Enjoyment (ENJ) will have a positive impact on their Continuance Intention
(INT).

10
4. METHODS
4.1. MEASUREMENT INSTRUMENTS
All measurement items were adapted, with slight modifications, from the literature. CONF and SAT
were adapted from Bhattacherjee (2001b); PU from Venkatesh et al. (2011) and Thong et al. (2006);
HAB from Limayem et al. (2007); USAB from Kirakowski et al. (1998), H. X. Lin et al. (1997), Roy et al.
(2001), Flavián et al. (2006), and Zviran et al. (2006); ENJ from C.-P. Lin & Bhattacherjee (2008); INT
from Bhattacherjee & Barfar (2011), Venkatesh & Goyal (2010) and Venkatesh et al. (2011). The
items for all constructs are included in the Appendix 1.
The questionnaire was developed in English and hosted on a free platform. Most items were
measured through a seven-point quantitative scale, ranging from “totally disagree” (1) to “totally
agree” (7). The items for satisfaction (SAT) were the exception by being based on seven-point
semantic differential scales, as per Bhattacherjee & Barfar (2011).
4.2. DATA COLLECTION
Firstly, a pilot survey with 80 answers was conducted to refine the questions and obtain further
comments about the content and structure. The most significant change was in the items of
perceived usefulness (PU), which initially were from Bhattacherjee & Barfar (2011). These generated
misunderstandings and the simulation of the PLS estimation with a few answers, gave statistically
poor results. The original items from the theory were “Using OBD improves my performance in
managing personal finances”, “Using OBD increases my productivity in managing personal finances”,
“Using OBD enhances my effectiveness in managing personal finances” and “Overall, OBD is useful in
managing personal finances”. When adapted to the context of this study, the questions lost the
object (“in managing personal finances”, in the original), and thus resulted in loose items such as
“Using smartwatches improves my performance” or “Using smartwatches increases my
productivity”. These items were replaced by similar, but more adequate, items from Venkatesh et al.
(2011) and Thong et al. (2006). The main survey excluded data from the pilot survey.
To obtain the main survey the link to the questionnaire was shared with online discussion boards and
social networks, among smartwatch users. Of the 1271 users who visited the survey, 922 replied,
representing a 73% completion rate. Of the 922 responses, 574 were validated, corresponding to
smartwatch users in the U.S.A.
Concerning demographic data (Table 2), 93% of the respondents are male, and the average age is 27
years. Their education level corresponds to “Some college” for 32% of individuals, with 16% below
that and 52% above.

11
Age Gender Education
< 18 36 6.3% Male 532 92.7% No schooling completed 1 0.2%
18 - 24 233 40.6% Female 42 7.3% Elementary 6 1.0%
25 - 34 217 37.8% High school (no degree) 46 8.0%
35 - 44 59 10.3% High school graduate 40 7.0%
45 - 54 23 4.0% Some college 186 32.4%
55 - 64 3 0.5% Associate's degree 38 6.6%
64 > 3 0.5% Bachelor's degree 187 32.6%
Master's degree 44 7.7%
Professional school degree 17 3.0%
Doctorate degree 9 1.6%
Table 2 - Demographic data of responses

12
5. RESULTS
Structural equation modeling (SEM) is a statistical method for testing and estimating causal relations
using a mix of statistical data and qualitative causal assumptions. Careful researchers acknowledge
the possibilities of distinguishing between measurement and structural models and explicitly take
measurement error into account (Henseler, Ringle, & Sinkovics, 2009). Two families of SEM methods
can be highlighted: covariance based methods and variance based methods. Partial least squares
(PLS) is a variance-based method, and the one used in this study considering that some of the items
in the data are not distributed normally (p < 0.01 based on the Kolmogorov-Smirnov test), the
research model has not yet been tested in the literature, and the research model is regarded as
complex. Smart PLS v. 3.2.3 (Ringle, Wende, & Becker, 2014) was the software used to analyze the
relationships defined by the theoretical model.
In the next two subsections, we first examine the measurement model to assess internal consistency,
indicator reliability, convergent validity, and discriminant validity and then test the structural model.
5.1. MEASUREMENT MODEL
Construct reliability was tested using the composite reliability coefficient. PLS prioritizes indicator
according to their individual reliability. As demonstrated in Table 3, all the constructs have a
composite reliability above 0.7, which suggests that the constructs are reliable (Straub, 1989).
Constructs Mean SD CR CONF PU SAT HAB USAB ENJ INT
Confirmation 5.37 1.29 0.84 0.85
Perceived Usefulness 5.41 1.31 0.90 0.52 0.83
Satisfaction 5.77 1.08 0.94 0.68 0.65 0.90
Habit 5.66 1.38 0.87 0.46 0.62 0.61 0.83
Perceived Usability 5.38 1.28 0.89 0.58 0.52 0.65 0.51 0.77
Perceived Enjoyment 5.82 1.15 0.94 0.44 0.47 0.60 0.39 0.49 0.91
Continuance Intention 6.45 1.01 0.98 0.42 0.59 0.62 0.64 0.44 0.44 0.96
Table 3 - Correlation matrix, composite reliability (CR), and square root of AVEs
Indicator reliability was assessed based on the criteria that the loadings should be greater than 0.7
and that every loading less than 0.4 should be excluded (G. A. Churchill, 1979; Henseler et al., 2009).
As shown in Table 4, the loadings (in bold) are greater than 0.7 with the exception of two items
(USAB3 and USAB4), which are lower than 0.7 but greater than 0.4. Items USAB1 and USAB2 were
eliminated due to a low loading. Overall, the instrument presented a good indicator reliability. To
test convergent validity, average variance extracted (AVE) was used as the criterion. The AVE should
be higher than 0.5 so that the latent variable explains more than half of the variance of its indicators
(Fornell & Larcker, 1981; Hair, Sarstedt, Ringle, & Mena, 2012; Henseler et al., 2009). As shown in
Table 3, all constructs have an AVE higher than 0.5, meeting this criterion.
Discriminant validity of the constructs was assessed using two measures: Fornell-Larcker criteria and
cross-loadings. The first criterion postulates that the square root of AVE should be greater that the
correlations between the construct (Fornell & Larcker, 1981). The second criterion requires that the
loading of each indicator should be greater than all cross-loadings (Chin, 1998; Götz, Liehr-Gobbers,
& Krafft, 2010; Grégoire & Fisher, 2006). As seen in Table 3, the square roots of AVEs (diagonal

13
elements) are higher than the correlation between each pair of constructs (off-diagonal elements).
Table 4 shows that the patterns of loading are greater than cross-loading. Thus, both measures are
satisfied.
Construct ITEM CONF PU SAT HAB USAB ENJ INT
Confirmation CONF1 0.87 0.48 0.61 0.39 0.52 0.40 0.39
CONF2 0.83 0.40 0.54 0.39 0.47 0.34 0.32
Perceived Usefulness PU1 0.51 0.86 0.66 0.59 0.49 0.46 0.62
PU2 0.41 0.84 0.50 0.49 0.41 0.35 0.45
PU3 0.39 0.83 0.45 0.49 0.39 0.36 0.42
PU4 0.39 0.78 0.47 0.45 0.41 0.36 0.43
Satisfaction SAT1 0.64 0.61 0.92 0.59 0.62 0.54 0.62
SAT2 0.63 0.59 0.93 0.59 0.59 0.54 0.58
SAT3 0.57 0.55 0.87 0.50 0.54 0.48 0.47
SAT4 0.59 0.56 0.88 0.50 0.58 0.57 0.54
Habit HAB1 0.39 0.53 0.54 0.89 0.41 0.34 0.62
HAB2 0.43 0.52 0.55 0.88 0.46 0.33 0.53
HAB3 0.31 0.49 0.41 0.72 0.40 0.30 0.43
Perceived Usability USAB3 0.36 0.33 0.42 0.32 0.66 0.31 0.28
USAB4 0.38 0.30 0.39 0.30 0.69 0.27 0.26
USAB5 0.47 0.42 0.52 0.43 0.81 0.43 0.34
USAB6 0.49 0.44 0.53 0.41 0.84 0.42 0.37
USAB7 0.48 0.40 0.51 0.40 0.81 0.38 0.34
USAB8 0.47 0.46 0.57 0.44 0.78 0.40 0.39
Perceived Enjoyment ENJ1 0.33 0.34 0.47 0.30 0.38 0.89 0.36
ENJ2 0.39 0.46 0.54 0.36 0.45 0.92 0.39
ENJ3 0.46 0.48 0.61 0.38 0.49 0.93 0.44
Continuance Intention INT1 0.42 0.57 0.60 0.60 0.42 0.42 0.95
INT2 0.42 0.58 0.59 0.60 0.43 0.43 0.97
INT3 0.39 0.56 0.59 0.63 0.42 0.42 0.97
INT4 0.40 0.57 0.58 0.62 0.40 0.40 0.95
Table 4 - Loadings and cross-loadings for the measurement model
The assessments of construct reliability, indicator reliability, convergent validity, and discriminant
validity of the constructs were satisfactory, indicating that the constructs can be used to test the
conceptual model.
5.2. STRUCTURAL MODEL
The structural model was estimated using R2 measures and path coefficients' level of significance.
Figure 4 shows the model results. The R2 of dependent variables are 0.47, 0.41, 0.19, 0.66 and 0.59
for perceived usefulness, perceived usability, perceived enjoyment, satisfaction, and continuance
intention, respectively. The significance of the path coefficients was assessed using a bootstrapping
procedure (Hair, Ringle, & Sarstedt, 2011; Henseler et al., 2009) with 5000 iterations of resampling
(Chin, 1998). Figure 4 also shows the path coefficients and t-value (in parenthesis) results.

14
Figure 4 - Model with results
The model explains 47.1% of the variation in perceived usefulness, and all variables are statistically
significant, namely, confirmation ( = 0.23; p < 0.01), habit ( = 0.43; p < 0.01), and perceived
usability ( = 0.17; p < 0.01). Respectively, hypothesis H1, H9 and H11 are confirmed.
The model explains 40.9% of the variation in perceived usability, with the effects of confirmation (
= 0.44; p < 0.01) and habit ( = 0.30; p < 0.01) being statistically significant. Respectively, hypothesis
H2 and H10 are confirmed.
Perceived enjoyment is explained through confirmation ( = 0.44; p < 0.01), which is statistically
significant and explains 19.0% of the variation in perceived enjoyment; therefore, hypothesis H3 is
confirmed. As for satisfaction, 65.7% of its variation is explained through confirmation ( = 0.31; p <
0.01), perceived usefulness ( = 0.26; p < 0.01), perceived usability ( = 0.26; p < 0.01), and
perceived enjoyment ( = 0.23; p < 0.01), which are all statistically significant; respectively,
hypothesis H4, H5, H12 and H13 are confirmed.
Finally, 59.1% of the variation in continuance intention is explained through perceived usefulness (
= 0.19; p < 0.01), satisfaction ( = 0.19; p < 0.01), habit ( = -0.25; p < 0.001), and the moderation
effect of habit in the relationship between satisfaction and continuance intention is statistically
significant ( = -0.20; p < 0.001), which are statistically significant, but perceived enjoyment ( =
0.05; p > 0.10), is not; respectively, hypothesis H6, H7, H8, and H8a are confirmed, but H14 is not.
In sum, out of the fifteen hypothesis, only one is not confirmed.

15
6. DISCUSSION
6.1. THEORETICAL IMPLICATIONS
This study’s results suggest that, theoretically, habit (HAB), perceived usability (USAB), and perceived
enjoyment (ENJ) increase the predictive power of the ECM model in explaining continuance intention
(INT). Perceived usefulness (PU), confirmation (CONF), and satisfaction (SAT) explain 44% of the
variation in continuance intention (INT) in Bhattacherjee's (2001b) ECM; however, by coupling it with
HAB, USAB and ENJ, variance explained increased in 15 p.p., thus providing a better explanatory
power (Table 5). Not only is this a significant modification of the ECM for the context of
smartwatches, but also an extension of its generalizability from a general IS use to the smartwatch
technology. The survey instrument was tested for validity and reliability of the scales, and it can be
easily used by future researchers in other countries.
In line with Bhattacherjee's (2001b) research, the effects of SAT and PU in INT were substantial,
meaning that users value their satisfaction with the smartwatch, as well as its perceived usefulness
when considering its continued use. Some studies examined the role of usability on satisfaction
(Legris, Ingham, & Collerette, 2003; Liu, Liao, & Pratt, 2009; Zviran et al., 2006), but this study
extended it to the continuance intention to use smartwatches. The effect that perceived usability has
on satisfaction presents an important contribution that is often overlooked in the topic of IS
continuance. Interestingly, perceived enjoyment did not have a significant direct nor total effect on
continuance intention, but had a significant effect on satisfaction. This indicates that smartwatch
users are more likely to value its utilitarian component than the hedonic one when considering its
continued use (Batra & Ahtola, 1991). Lastly, prior studies in IS have also focused on habit as a
moderation between continuance intention and actual continued usage (Bhattacherjee & Barfar,
2011; Limayem, Cheung, & Chan, 2003; Limayem et al., 2007). However, this study also demonstrates
the significant effect of habit on IS continuance intention on the specific context of smartwatches.
6.2. MANAGERIAL IMPLICATIONS
The findings of this study revealed that satisfaction is an important factor affecting a user’s intention
to continue using a smartwatch, especially for those users with a low level of habit. Therefore, in
order to retain them, managers need to focus on the users’ satisfaction (Bhattacherjee, 2001a). The
focus should therefore be, as previously noted, on confirmation, perceived usefulness, perceived
usability, and perceived enjoyment. Selling a smartwatch that delivers on its promise, or, on the
other hand, under-promises and over-delivers, will result in a higher confirmation level, and likewise,
satisfaction (Limayem et al., 2007; Oliver, 1980). Product managers should improve their market
Bhattacherjee's (2001b) ECM Research model
Construct R2 R
2 Adj. Construct R
2 R
2 Adj.
Continuance Intention 0.45 0.44 Continuance Intention 0.59 0.59
Perceived Usefulness 0.27 0.27 Perceived Usefulness 0.47 0.47
Satisfaction 0.57 0.57 Satisfaction 0.66 0.65
Perceived Usability 0.41 0.41
Perceived Enjoyment 0.19 0.19
Table 5 - Comparison between Bhattacherjee's (2001b) ECM and the research model

16
researches and employ a culture of design thinking in order to ensure that the smartwatch has
characteristics and functions that fits users’ needs, and implement such characteristics and functions
in a usable way. Likewise, a smartwatch that displays information clearly, does not have a cluttered
user interface, is easy to understand, and is generally usable, will bring a bigger satisfaction to the
user (Park & Hwan Lim, 1999). Improving the perceived enjoyment factor of the smartwatch will also
lead to a higher satisfaction. This does not necessarily imply the addition of games to the
smartwatch, but rather making the experience as a whole enjoyable.
However, habit was the most significant factor affecting a user’s intention to continue using a
smartwatch, and at the same time, an effect moderator of satisfaction on the continuance intention.
Managers and marketers should focus on strengthening the habitual use of a smartwatch, by,
proactively reinforcing the relationship with its users and giving them exclusive benefits, or
promoting experimentation with new or more advanced features (Limayem et al., 2007). Based on
Figure 5 we can conclude that satisfaction has higher impact on continuance intention for user that
have a low habit level.
Figure 5 - Continuance intention - Moderation between Habit and Satisfaction
6.3. LIMITATIONS AND FUTURE RESEARCH
While this study adds to the current body of knowledge, it also recognizes its limitations. The first,
concerns the sampling. The respondents of this study were mostly male, and thus, what they value
might partially differ from the population average. For example, PwC’s (2014) report revealed that on
social media conversations about wearable technology, gaming is the most referred subject by men,
but women are more likely to talk about fitness. At the same time, according to research (Buenaflor
& Kim, 2013; Epps, Doty, Knott, & Vokshi, 2013; Salah et al., 2014), wearable technology users are
equally distributed between men and women with an average age of 36. The distribution of the
survey among online discussion board and social network users are likely one of the reasons for both
the relatively small percentage of female respondents and the lower age average when compared to
other market research. The second limitation concerns the lack of inclusion of a model/operative
system (OS) variable. Considering that smartwatches vary in their characteristics according to the
model and OS, it can also be said that they vary in their levels of usability and perceived usefulness.
These differences might have slightly impacted the variance of our sample. Lastly, this study only

17
considered one stage of post adoption, and past research has shown that usefulness and attitude
perceptions fluctuate over time (Bhattacherjee & Premkumar, 2004; Venkatesh et al., 2011).
It is recommended that future research tests both segments of men and women, in order to uncover
significant differences (if any), just like past studies in different areas (Moores & Chang, 2006; Morris
& Venkatesh, 2000). Future research can also take this study as a starting point, and build on it by
testing this model on different smartwatch models or OSs in order to understand their differences
and similarities. Furthermore, future research should take the assumptions of this study and apply
them to a two-stage IS continuance model, such as the one developed by Venkatesh et al. (2011).
Lastly, it would also be of interest to apply this model to the same topic in other regions, especially in
Asia/Pacific, which is predicted to become the highest revenue generating geography by 2020 in the
smartwatch market (Kohli, 2015).

18
7. CONCLUSIONS
Plenty of research on the IS area has focused on IT acceptance, but IT continuance was found to have
a bigger impact on an IS’s long-term viability. The topic of smartwatches, to the best of our
knowledge, had not been studied in an IS context yet. To address this gap, this study contributed to
the continuance theory, developing a conceptual framework that combines the ECM with habit,
perceived usability, and perceived enjoyment factors were combined. Satisfaction and perceived
usefulness were found to have a significant effect on continuance intention – and thus, confirming
the ECM’s results – also habit and the moderation effect of habit on satisfaction to explain
continuance intention had the biggest impact. Thus, by including habit, perceived usability, and
perceived enjoyment in the proposed framework, a stronger predictive power was added to the
existing ECM.

19
8. BIBLIOGRAPHY
Agarwal, R., & Karahanna, E. (2000). Time flies when you’re having fun: Cognitive absorption and beliefs about information technology usage. MIS Quarterly, 24(4), 665–694. http://doi.org/10.2307/3250951
Ak, S. (2014). Global wearable technology market research report 2018. Retrieved from http://www.prweb.com/releases/2014/01/prweb11478994.htm
Bargh, J. A. (1994). The four horsemen of automaticity: Awareness, intention, efficiency, and control in social cognition. In R. S. Wyer & T. K. Srull (Eds.), Handbook of Social Cognition (2nd ed., pp. 1–40). Lawrence Erlbaum Associates.
Barnes, S. J., & Böhringer, M. (2011). Modeling use continuance behavior in microblogging services: The case of twitter. Journal of Computer Information Systems, 51(4), 1–10. http://doi.org/10.1080/08874417.2011.11645496
Batra, R., & Ahtola, O. T. (1991). Measuring the hedonic and utilitarian sources of consumer attitudes. Marketing Letters, 2(2), 159–170. http://doi.org/10.1007/BF00436035
Bhattacherjee, A. (2001a). An empirical analysis of the antecedents of electronic commerce service continuance. Decision Support Systems, 32(2), 201–214. http://doi.org/10.1016/s0167-9236(01)00111-7
Bhattacherjee, A. (2001b). Understanding information systems continuance: An expectation-confirmation model. MIS Quarterly, 25(3), 351–370. http://doi.org/10.2307/3250921
Bhattacherjee, A., & Barfar, A. (2011). Information technology continuance research: current state and future directions. Asia Pacific Journal of Information, 21(2), 1–18.
Bhattacherjee, A., & Premkumar, G. (2004). Understanding changes in belief and attitude toward information technology usage: A theoretical model and longitudinal test. MIS Quarterly, 28(2), 229–254. http://doi.org/10.1111/j.1365-2575.2007.00265.x
Bieber, G., Kirste, T., & Urban, B. (2012). Ambient interaction by smart watches. In Proceedings of the 5th International Conference on PErvasive Technologies Related to Assistive Environments - PETRA ’12 (p. 1). New York, New York, USA: ACM Press. http://doi.org/10.1145/2413097.2413147
Billinghurst, M., & Starner, T. (1999). Wearable devices: new ways to manage information. Computer, 32(1), 57–64. http://doi.org/10.1109/2.738305
Boulding, W., Lee, E., & Staelin, R. (1994). Mastering the mix: Do advertising, promotion, and sales force activities lead to differentiation? Journal of Marketing Research, 31(2), 159. http://doi.org/10.2307/3152191
Branscomb, L. M., & Thomas, J. C. (1984). Ease of use: A system design challenge. IBM Systems Journal, 23(3), 224–235. http://doi.org/10.1147/sj.233.0224
Budiu, R. (2015, May). The Apple Watch: User-Experience Appraisal. Retrieved from https://www.nngroup.com/articles/smartwatch/
Buenaflor, C., & Kim, H. C. (2013). Six human factors to acceptability of wearable computers. International Journal of Multimedia and Ubiquitous Engineering, 8(3), 103–114.
20
Chen, C.-W., & Koufair, M. (2014). BYOD flexibility : The effects of flexibility of multiple it device use on users’ attitudes and continuance intention. In The 20th Americas Conference on Information Systems (AMCIS). Savannah, Georgia, USA.
Cheung, C. M. K., Jin, X. L., Lee, M. K. O., Lee, M. K. O., & Chen, H. P. (2009). How to keep members using the information in a computer-supported social network. Computers in Human Behavior, 25(5), 1172–1181. http://doi.org/10.1016/j.chb.2009.04.008
Chin, W. W. (1998). The partial least squares approach to structural equation modeling. In G. A. Marcoulides (Ed.), Modern Methods for Business Research (pp. 295–336).
Chiu, C. M., Hsu, M. H., Sun, S. Y., Lin, T. C., & Sun, P. C. (2005). Usability, quality, value and e-learning continuance decisions. Computers and Education, 45(4), 399–416. http://doi.org/10.1016/j.compedu.2004.06.001
Choi, S., & Yoo, J. (2015). Roles of user resistance and social influence in continued use of smartphone. In 2015 17th International Conference on Advanced Communication Technology (ICACT) (pp. 287–291). IEEE. http://doi.org/10.1109/ICACT.2015.7224805
Churchill, D., & Hedberg, J. (2008). Learning object design considerations for small-screen handheld devices. Computers & Education, 50(3), 881–893. http://doi.org/10.1016/j.compedu.2006.09.004
Churchill, G. A. (1979). A paradigm for developing better measures of marketing constructs. Journal of Marketing Research, 16(1), 64–73. http://doi.org/10.2307/3150876
Cisco. (2016). Cisco visual networking index: Global mobile data traffic forecast update, 2015–2020. Cisco Systems.
Curry, D. (2015). Apple Watch hits 10,000 apps: How do Android Wear, Pebble, and Samsung compare? Retrieved December 12, 2015, from http://www.digitaltrends.com/wearables/apple-watch-apps-comparison/
Danova, T. (2014). The wearable computing market report: Growth trends, consumer attitudes, and why smartwatches will dominate. BI Intelligence.
Davis, F. D. (1989). Perceived usefulness, perceived ease of use, and user acceptance of information technology. MIS Quarterly, 13(3), 319–340. http://doi.org/10.2307/249008
Davis, F. D., Bagozzi, R. P., & Warshaw, P. R. (1992). Extrinsic and intrinsic motivation to use computers in the workplace. Journal of Applied Social Psychology, 22(14), 1111–1132. http://doi.org/10.1111/j.1559-1816.1992.tb00945.x
De Guinea, A. O., & Markus, M. L. (2009). Why break the habit of a lifetime? Rethinking the roles of intention, habit, and emotion in continuing information technology use. MIS Quarterly, 33(3), 433–444. http://doi.org/10.2307/20650303
Deng, L., Turner, D. E., Gehling, R., & Prince, B. (2010). User experience, satisfaction, and continual usage intention of IT. European Journal of Information Systems, 19(1), 60–75. http://doi.org/10.1057/ejis.2009.50
Epps, S. R., Doty, C. A., Knott, J., & Vokshi, A. (2013). Fitness wearables - Many products, few customers.
Eriksson, K., & Nilsson, D. (2007). Determinants of the continued use of self-service technology: The

21
case of Internet banking. Technovation, 27(4), 159–167. http://doi.org/10.1016/j.technovation.2006.11.001
Festinger, L. (1957). A theory of cognitive dissonance (1st ed.). Stanford University Press.
Flavián, C., Guinalíu, M., & Gurrea, R. (2006). The role played by perceived usability, satisfaction and consumer trust on website loyalty. Information and Management, 43(1), 1–14. http://doi.org/10.1016/j.im.2005.01.002
Fornell, C., & Larcker, D. F. (1981). Evaluating structural equation models with unobservable variables and measurement error. Journal of Marketing Research, 18(1), 39–50. http://doi.org/10.2307/3151312
Gefen, D. (2003). TAM or just plain habit. Journal of Organizational and End User Computing, 15(3), 1–13. http://doi.org/10.4018/joeuc.2003070101
Gefen, D., Karahanna, E., & Straub, D. W. (2003). Trust and TAM in online shopping: An integrated model. MIS Quarterly, 27(1), 51–90.
Götz, O., Liehr-Gobbers, K., & Krafft, M. (2010). Evaluation of Structural Equation Models Using the Partial Least Squares (PLS) Approach. In Handbook of Partial Least Squares (pp. 691–711). Berlin, Heidelberg: Springer Berlin Heidelberg. http://doi.org/10.1007/978-3-540-32827-8_30
Grégoire, Y., & Fisher, R. J. (2006). The effects of relationship quality on customer retaliation. Marketing Letters, 17(1), 31–46. http://doi.org/10.1007/s11002-006-3796-4
Hair, J. F., Ringle, C. M., & Sarstedt, M. (2011). PLS-SEM: Indeed a silver bullet. Journal of Marketing Theory and Practice, 19(2), 139–152. http://doi.org/10.2753/MTP1069-6679190202
Hair, J. F., Sarstedt, M., Ringle, C. M., & Mena, J. A. (2012). An assessment of the use of partial least squares structural equation modeling in marketing research. Journal of the Academy of Marketing Science, 40(3), 414–433. http://doi.org/10.1007/s11747-011-0261-6
Heijden, H. van der. (2004). User acceptance of hedonic information. MIS Quarterly, 28(4), 695–704.
Henseler, J., Ringle, C. M., & Sinkovics, R. R. (2009). The use of partial least squares path modeling in international marketing. In R. R. Sinkovics & P. N. Ghauri (Eds.), Advances in International Marketing (Vol. 20, pp. 277 – 319). Emerald Group Publishing Limited. http://doi.org/10.1108/S1474-7979(2009)0000020014
Hoehle, H., & Venkatesh, V. (2015). Mobile Application Usability: Conceptualization and Instrument Development. MIS Quarterly, 39(2), 435–472.
Holden, H., & Rada, R. (2011). Understanding the influence of perceived usability and technology self-efficacy on teachers’ technology acceptance. Journal of Research on Technology in Education, 43(4), 343–367. http://doi.org/10.1080/15391523.2011.10782576
Hong, S., Thong, J. Y. L., & Tam, K. Y. (2006). Understanding continued information technology usage behavior: A comparison of three models in the context of mobile internet. Decision Support Systems, 42(3), 1819–1834. http://doi.org/10.1016/j.dss.2006.03.009
Hong, W., Thong, J. Y. L., Wong, W.-M., & Tam, K. Y. (2002). Determinants of user acceptance of digital libraries: An empirical examination of individual differences and system characteristics. Journal of Management Information Systems, 18(3), 97–124.
Karahanna, E., Straub, D. W., & Chervany, N. L. (1999). Information technology adoption across time:

22
A cross-sectional comparison of pre-adoption and post-adoption beliefs. MIS Quarterly, 23(2), 183–213. http://doi.org/10.2307/249751
Khalifa, M., & Liu, V. (2004). The State of Research on Information System Satisfaction. Journal of Information Technology Theory and Application JITTA, 5(4), 37–49.
Kim, M., Chang, Y., Park, M.-C., & Lee, J. (2015). The effects of service interactivity on the satisfaction and the loyalty of smartphone users. Telematics and Informatics, 32(4), 949–960. http://doi.org/10.1016/j.tele.2015.05.003
Kim, S. S., & Malhotra, N. K. (2005). Predicting system usage from intention and past use: Scale issues in the predictors. Decision Sciences, 36(1), 187–196. http://doi.org/10.1111/j.1540-5915.2005.00070.x
Kirakowski, J., Claridge, N., & Whitehand, R. (1998). Human centered measures of success in website design. In Proceedings of the Fourth Conference on Human Factors and the Web.
Kohli, B. (2015). World smartwatch market - Opportunities and forecasts, 2013 - 2020.
Kosir, S. (2015). A look at smart clothing for 2015. Retrieved August 4, 2015, from https://www.wearable-technologies.com/2015/03/a-look-at-smartclothing-for-2015/
Legris, P., Ingham, J., & Collerette, P. (2003). Why do people use information technology? A critical review of the technology acceptance model. Information and Management, 40(3), 191–204. http://doi.org/10.1016/S0378-7206(01)00143-4
Limayem, M., Cheung, C., & Chan, G. (2003). Explaining information systems adoption and post-adoption: Toward an integrative model. In Proceedings of the International Conference on Information Systems, ICIS 2003. Seattle, Washington, USA.
Limayem, M., Hirt, S. G., & Cheung, C. M. K. (2007). How habit limits the predictive power of intention: The case of information systems continuance. MIS Quarterly, 31(4), 705–737.
Lin, C. S., Wu, S., & Tsai, R. J. (2005). Integrating perceived playfulness into expectation-confirmation model for web portal context. Information and Management, 42(5), 683–693. http://doi.org/10.1016/j.im.2004.04.003
Lin, C.-P., & Bhattacherjee, A. (2008). Elucidating individual intention to use interactive information technologies: The role of network externalities. International Journal of Electronic Commerce, 13(1), 85–108. http://doi.org/10.2753/JEC1086-4415130103
Lin, H. X., Choong, Y.-Y., & Salvendy, G. (1997). A proposed index of usability: A method for comparing the relative usability of different software systems. Behaviour & Information Technology, 16(4-5), 267–277. http://doi.org/10.1080/014492997119833
Lin, K. M. (2011). e-Learning continuance intention: Moderating effects of user e-learning experience. Computers and Education, 56(2), 515–526. http://doi.org/10.1016/j.compedu.2010.09.017
Liu, S. H., Liao, H. L., & Pratt, J. A. (2009). Impact of media richness and flow on e-learning technology acceptance. Computers and Education, 52(3), 599–607. http://doi.org/10.1016/j.compedu.2008.11.002
Logan, G. D. (1989). Automaticity and cognitive control. In J. S. Uleman & J. A. Bargh (Eds.), Unintended Thought (pp. 52–74). Guilford Press.
Mann, S. (1998). Wearable computing as means for personal empowerment. Retrieved June 16,

23
2015, from http://wearcomp.org/wearcompdef.html
Marks, P. (2013). Samsung launch kickstarts the smartwatch boom. Retrieved October 3, 2015, from https://www.newscientist.com/article/dn24154-samsung-launch-kickstarts-the-smartwatch-boom/
Meso, P., Musa, P., & Mbarika, V. (2005). Towards a model of consumer use of mobile information and communication technology in LDCs: the case of sub-Saharan Africa. Information Systems Journal, 15(2), 119–146. http://doi.org/10.1111/j.1365-2575.2005.00190.x
Mitroff, S. (2012). Android is bigger, but here’s why Apple is still the undisputed app cash king. Retrieved October 4, 2015, from http://www.wired.com/2012/12/ios-vs-android/
Moar, J. (2016). Smartwatches - Clocking the trend. Juniper Research.
Moores, T., & Chang, J. (2006). Ethical decision making in software piracy: Initial development and test of a four-component model. MIS Quarterly, 30(1), 167–180.
Morris, M. G., & Venkatesh, V. (2000). Age Differences in Technology Adoption Decisions: Implications For a Changing Work Force. Personnel Psychology, 53(2), 375–403. http://doi.org/10.1111/j.1744-6570.2000.tb00206.x
O’Reilly, Q. (2015). This is what we know (and need to know) about the Apple Watch. Retrieved September 13, 2015, from http://businessetc.thejournal.ie/apple-watch-preview-1980956-Mar2015/
Oliver, R. L. (1980). A Cognitive Model of the Antecedents and Consequences of Satisfaction Decisions. Journal of Marketing Research, 17(4), 460–469. http://doi.org/10.2307/3150499
Oliver, R. L. (1981). Measurement and evaluation of satisfaction processes in retail settings. Journal of Retailing, 57(3), 25–48.
Olson, J. C., & Dover, P. A. (1979). Disconfirmation of consumer expectations through product trial. Journal of Applied Psychology, 64(2), 179–189. http://doi.org/10.1037/0021-9010.64.2.179
Ouellette, J. A., & Wood, W. (1998). Habit and intention in everyday life: The multiple processes by which past behavior predicts future behavior. Psychological Bulletin, 124(1), 54–74. http://doi.org/10.1037/0033-2909.124.1.54
Parikh, M. A., & Verma, S. (2002). Utilizing internet technologies to support learning: an empirical analysis. International Journal of Information Management, 22(1), 27–46. http://doi.org/10.1016/S0268-4012(01)00038-X
Park, K. S., & Hwan Lim, C. (1999). A structured methodology for comparative evaluation of user interface designs using usability criteria and measures. International Journal of Industrial Ergonomics, 23(5), 379–389. http://doi.org/10.1016/S0169-8141(97)00059-0
Pentland, A. (2004). Healthwear: medical technology becomes wearable. Computer, 37(5), 42–49. http://doi.org/10.1109/MC.2004.1297238
Polites, G. L., & Karahanna, E. (2012). Shackled to the status quo: The inhibiting effects of incumbent system habit, switching costs, and inertia on new system acceptance. MIS Quarterly, 36(1), 21–42.
Premkumar, G., & Bhattacherjee, A. (2008). Explaining information technology usage: A test of competing models. Omega, 36(1), 64–75. http://doi.org/10.1016/j.omega.2005.12.002

24
PwC. (2014). The Wearable Future. Consumer Intelligence Series.
Rawassizadeh, R., Price, B. a., & Petre, M. (2015). Wearables: has the age of smartwatches finally arrived? Communications of the ACM, 58(1), 45–47. http://doi.org/10.1145/2629633
Ringle, C. M., Wende, S., & Becker, J. M. (2014). SmartPLS 3. Hamburg: SmartPLS.
Roca, J. C., Chiu, C.-M. M., & Martínez, F. J. (2006). Understanding e-learning continuance intention: An extension of the technology acceptance model. International Journal of Human-Computer Studies, 64(8), 683–696. http://doi.org/10.1016/j.ijhcs.2006.01.003
Rogers, E. M. (2003). Diffusion of Innovations, 5th Edition. Free Press.
Ronis, D. L., Yates, J. F., & Kirscht, J. P. (1989). Attitudes, decisions, and habits as determinants of repeated behavior. In A. R. Pratkanis & S. J. Breckler (Eds.), Attitude Structure and Function (pp. 213–240). Psychology Press.
Roy, M. C., Dewit, O., & Aubert, B. A. (2001). The impact of interface usability on trust in Web retailers. Internet Research, 11(5), 388–398. http://doi.org/10.1108/10662240110410165
Ryan, R., & Deci, E. (2000). Intrinsic and extrinsic motivations: Classic definitions and new directions. Contemporary Educational Psychology, 25(1), 54–67. http://doi.org/10.1006/ceps.1999.1020
Salah, H., MacIntosh, E., & Rajakulendran, N. (2014). MaRS Market Insights Wearable Tech : Leveraging Canadian Innovation to Improve Health. MaRS Discovery District.
Scott, M., Gudea, S., Golden, W., & Acton, T. (2004). Usability and acceptance in small-screen information systems. In Collecter - Conference on Electronic Commerce.
Starner, T. (2001). The challenges of wearable computing: Part 2. IEEE Micro, 21(4), 54–67.
Straub, D. W. (1989). Validating Instruments in MIS Research. MIS Quarterly, 13(2), 147–169. http://doi.org/10.2307/248922
Sung, W. (2013). Understanding the switching behaviors of smartphone users: A model comparison approach. KAIST.
Sungmee Park, & Jayaraman, S. (2003). Enhancing the quality of life through wearable technology. IEEE Engineering in Medicine and Biology Magazine, 22(3), 41–48. http://doi.org/10.1109/MEMB.2003.1213625
Susanto, A., Chang, Y., Zo, H., & Park, M. C. (2012). The role of trust and security in Smartphone banking continuance. In 2012 IEEE International Conference on Systems, Man, and Cybernetics (SMC) (pp. 2133–2138). IEEE. http://doi.org/10.1109/ICSMC.2012.6378055
Tan, W. K., Lee, P. W., & Hsu, C. W. (2015). Investigation of temporal dissociation and focused immersion as moderators of satisfaction-continuance intention relationship: Smartphone as an example. Telematics and Informatics, 32(4), 745–754. http://doi.org/10.1016/j.tele.2015.03.007
Thong, J. Y. L., Hong, S.-J., & Tam, K. Y. (2006). The effects of post-adoption beliefs on the expectation-confirmation model for information technology continuance. International Journal of Human-Computer Studies, 64(9), 799–810. http://doi.org/10.1016/j.ijhcs.2006.05.001
Tractinsky, N. (1997). Aesthetics and apparent usability. In Proceedings of the SIGCHI conference on Human factors in computing systems - CHI ’97 (pp. 115–122). New York, New York, USA: ACM

25
Press. http://doi.org/10.1145/258549.258626
Tse, D. K., & Wilton, P. C. (1988). Models of consumer satisfaction formation: An extension. Journal of Marketing Research, 25(2), 204–210. http://doi.org/10.2307/3172652
Venkatesh, V., & Goyal, S. (2010). Expectation disconfirmation and technology adoption: Polynomial modeling and response surface analysis. MIS Quarterly, 34(2), 281–303.
Venkatesh, V., Morris, M., Davis, G., & Davis, F. (2003). User acceptance of information technology: Toward a unified view. MIS Quarterly, 27(3), 425–478.
Venkatesh, V., Thong, J. Y. L., Chan, F. K. Y., Hu, P. J.-H., & Brown, S. A. (2011). Extending the two-stage information systems continuance model: incorporating UTAUT predictors and the role of context. Information Systems Journal, 21(6), 527–555. http://doi.org/10.1111/j.1365-2575.2011.00373.x
Verplanken, B., & Aarts, H. (1999). Habit, attitude, and planned behaviour: Is habit an empty construct or an interesting case of goal-directed automaticity? European Review of Social Psychology, 10(1), 101–134. http://doi.org/10.1080/14792779943000035
Wakefield, R. L., & Whitten, D. (2006). Mobile computing: a user study on hedonic/utilitarian mobile device usage. European Journal of Information Systems, 15(3), 292–300. http://doi.org/10.1057/palgrave.ejis.3000619
Weiser, M. (1991, September). The computer for the 21 st century. Scientific American, 265(3), 94–104.
What is a smartwatch? Definition. (2015). Retrieved October 23, 2015, from http://www.smartwatchgroup.com/smartwatch-definition/
Xu, L., Lin, J., & Chan, H. C. (2012). The moderating effects of utilitarian and hedonic values on information technology continuance. ACM Transactions on Computer-Human Interaction, 19(2), 1–26. http://doi.org/10.1145/2240156.2240160
Yamashita, A. F., Barendregt, W., & Fjeld, M. (2007). Exploring potential usability gaps when switching mobile phones: An empirical study. British Computer Society.
Zeithaml, V. A., Parasuraman, A., & Berry, L. L. (1990). Delivering quality service: Balancing customer perceptions and expectations. New York: Free Press.
Zviran, M., Glezer, C., & Avni, I. (2006). User satisfaction from commercial web sites: The effect of design and use. Information and Management, 43(2), 157–178. http://doi.org/10.1016/j.im.2005.04.002

26
9. ANNEXES
Annex 1 – The items
Constructs Items Source
Confirmation (CONF)
CONF1 My experience with using the smartwatch is better than what I expected. Bhattacherjee (2001b)
CONF2 Overall, most of my expectations from using the smartwatch were confirmed.
Perceived Usefulness (PU)
PU1 I find the smartwatch useful in my daily life. S. Hong et al. (2006); Venkatesh et al. (2011)
PU2 Using the smartwatch helps me accomplish things more quickly.
PU3 Using the smartwatch increases my productivity.
PU4 Using the smartwatch helps me to perform many things more conveniently.
Satisfaction (SAT)
SAT1 How do you feel about your overall experience of smartwatch use: Very dissatisfied/Very satisfied.
Bhattacherjee (2001b)
SAT2 Very displeased/Very pleased.
SAT3 Very frustrated/Very contented.
SAT4 Absolutely terrible/Absolutely delighted.
Habit (HAB)
HAB1 Using the smartwatch has become automatic to me.
Limayem et al. (2007)
HAB2 Using the smartwatch is natural to me.
HAB3 When faced with a particular task, using the smartwatch is an obvious choice for me.
Perceived Usability (USAB)
USAB1* Every feature and function in the smartwatch is easy to understand.
Flavián et al. (2006); Kirakowski et al. (1998); H. X. Lin et al. (1997); Roy et al. (2001); Zviran et al. (2006) - Adapted
USAB2* The smartwatch is simple to use, even when using it for the first time.
USAB3 The contents of the smartwatch are organized in such a way that makes it easy for me to know where I am when navigating it.
USAB4 The amount of information displayed in the smartwatch is appropriate.
USAB5 Searching and checking the information that I need from the smartwatch is quick.
USAB6 It is easy to find the information I need from the smartwatch.
USAB7 It is easy to find the functions I need from the smartwatch.
USAB8 The smartwatch provides accurate information and functions that I need.
Perceived Enjoyment (ENJ)
ENJ1 I have fun interacting with the smartwatch. C.-P. Lin & Bhattacherjee (2008)
ENJ2 Using the smartwatch provides me with a lot of enjoyment.
ENJ3 I enjoy using the smartwatch.
Continuance Intention (INT)
INT1 I intend to continue using the smartwatch, rather than discontinue its use. Bhattacherjee (2001b); Venkatesh & Goyal (2010); Venkatesh et al. (2011)
INT2 I plan to continue using the smartwatch.
INT3 I will continue using the smartwatch.
INT4 I predict I will continue using the smartwatch in the future.