Embed Size (px)
Citation preview
NONPROFIT MANAGEMENT & LEADERSHIP, vol. 18, no. 4, Summer 2008 © 2008 Wiley Periodicals, Inc. 435Published online in Wiley InterScience (www.interscience.wiley.com). DOI: 10.1002/nml.197
Determinants of Compensation:A Study of Pay, Performance,and Gender Differences forFundraising Professionals
Debra J. Mesch, Patrick M. RooneyThis study examines the determinants of compensation forfundraising professionals by addressing the following researchquestions: (1) Is there a significant pay-performance relation-ship? (2) What are the factors that affect bonus and salary? (3) Is there a gender-pay gap for individuals who are in the roleof fundraisers? Data were collected over a four-year period froma national sample of fundraising professionals employed acrossall industry classifications. Amount of money raised was the primary performance variable of interest. Bivariate tests for differences between males and females, as well as two-stagesimultaneous regressions, were used to determine the effects offundraising performance on the pay of fundraisers. Results indi-cated a significant and positive pay-performance linkage acrossall fundraising positions, particularly for chief development offi-cers, as well as a consistent gender-pay gap across fundraisingpositions.
ALTHOUGH THERE HAS BEEN some theoretical work on compen-sation in nonprofits (for example, Hallock, 2000; Ruhm andBorkoski, 2003; Steinberg, 1990; Weisbrod, 1988), we have
little understanding of the actual determinants of compensation innonprofits from an empirical point of view (Hallock, 2000). One rea-son for the lack of empirical testing is that given the constraints andcharacteristics of the nonprofit sector, examining pay is problematic(Hallock, 2000). However, without a body of research that specifically
Note: We thank our research assistants, Brian Denton and Yuan Ding, master’sdegree students in economics, for their assistance in the empirical analysis. We also thank an anonymous reviewer for the suggestion of using two-stage simul-taneous regressions. Finally, we are indebted to Partha Deb of Hunter College forinsights and suggestions in solving the technical problems associated with usinginstrumental variables and two-stage simultaneous regressions.
nml184_06-435-464.qxd 4/8/08 9:27 PM Page 435
Nonprofit Management & Leadership DOI: 10.1002/nml
436 ME S C H, RO O N E Y
focuses on compensation in the nonprofits, it is difficult to deter-mine whether incentive systems that are found to be successful inthe private sector will have their intended effects in the nonprofitarena.
There are several reasons that the lack of empirical research andvalidation of compensation systems in the nonprofit sector is trou-bling. First, compensation packages have exploded for many chiefexecutives in the nonprofit sector (Schwinn and Wilhelm, 2003).Salaries paid in 2003 to the top executives of the nation’s largest non-profits rose by twice the inflation rate, and the salaries of CEOs ofthe largest charities and foundations more than doubled from 1997to 2002; in fact, they received higher percentage raises than did theircounterparts in the corporate world (Schwinn and Wilhelm, 2003).Second, although use of performance-based compensation plans isa relatively new practice in nonprofits, such practices are becomingmore prevalent and are expected to increase in the future (Alvarado,1996; Bailey and Risher, 1996; Deckop and Cirka, 2000). Some stud-ies have found that 25 percent of nonprofits offer managers theopportunity to earn cash compensation—usually tied to achievementof performance measures (Rocco, 1991, 1992). Third, managementpay in the nonprofit world is becoming more highly scrutinized.New legislation requires nonprofits to document how much they paytheir top management as well as require that boards justify and out-line the compensation determination process (Preston, 2004). “If thesalaries are found to be higher than expected and higher than thosefound in similar charities,” fines could be levied and boards couldbe required to return the amount overpaid (Hallock, 2002a, p. 378).
Our study uses compensation survey data from a large nationalmembership association—the Association of Fundraising Profes-sionals (AFP)—a professional society responsible for generating phil-anthropic support for a wide variety of nonprofits. Its mission is toadvance philanthropy by enabling people and organizations to prac-tice ethical and effective fundraising—activities that include educa-tion, training, mentoring, research, credentialing and advocacy.
Membership associations may be defined as “mutual benefitorganizations, incorporated to serve their members’ interests”(Tschirhart, 2006, p. 523), formally organized and usually not rec-ompensed for their participation (Knoke, 1986). Although mem-bership associations make up a significant component of thenonprofit sector—consisting of 33 percent of the nonprofits regis-tered in the United States (Tschirhart, 2006)—there is a paucity ofresearch on this sector and virtually no examination of executive payin this type of nonprofit.
Purpose of the StudyThe purpose of our study is to address the following research ques-tions: (1) What are the significant determinants of compensation for
Compensationpackages haveexploded formany chief
executives in thenonprofit sector.
nml184_06-435-464.qxd 4/8/08 9:27 PM Page 436
DE T E R M I N A N T S O F CO M P E N S AT I O N 437
Nonprofit Management & Leadership DOI: 10.1002/nml
individuals who are employed as fundraising professionals in non-profits? More specifically, does performance have a significant effecton compensation for these professionals? (2) What are the key deter-minants of bonus and salary for these individuals? (3) Is there agender-pay gap for individuals who are in the role of fundraisers fornonprofits?
First, we test to see whether there is a relationship betweenfundraiser performance and compensation. We selected fundraisingprofessionals because of the implicit relationship between their rolein the organization and performance (that is, “contributions raised”)to better test the pay-performance relationship. Performance can beappropriately rewarded only if it can be accurately measured anddirectly related to employee efforts. Presumably we would expect tosee a more direct linkage between job content or job responsibilitiesand performance for individuals who are in the role of fundrais-ing rather than other types of positions in nonprofits. In fact, fundraisinghas been described as a profession that is mission driven, offering cleargoals, advancement based on results, and work performance that isquantifiable (Tifft, 1992). In our study, we use “money raised,” aquantifiable measure of performance that directly relates to the effortsof fundraisers and is a measure of success. Furthermore, fundraisingprofessionals are unique to the nonprofit sector and traditionally notfound in for-profit firms. Few studies have been conducted that lookat determinants of compensation for these individuals.
Second, we disaggregate compensation into bonus and salary inorder to examine the pay-performance relationship more fully. Is thepay-performance relationship for fundraisers significant for bonus,for salary, or both? Studies comparing for-profit and nonprofit orga-nizations have found that nonprofits paid greater base salaries, lowerbonuses, and lower total compensation than for-profits, ceterisparibus (Roomkin and Weisbrod, 1999; Weisbrod, 1983). However,for fundraisers, where the measure of performance is objective andmeasurable (as is primarily the case in for-profit firms), there may bea more contingent relationship between performance and bonusbecause it is a reliable way to reward achievement of goals. Unlikeother pay-performance studies, under these conditions we may actu-ally find a relationship between performance and bonuses.
It is important to note that there is nothing illegal about beingpaid for performance as a fundraiser—and, in fact, this may be a wayto motivate employees to increase performance (Harrison, 1995).According to ethical guidelines, fundraisers are allowed to acceptperformance-based compensation (Sczudlo, 2003). Although wewould expect to see a stronger relationship between pay and perfor-mance for fundraisers than perhaps other individuals, we need tobear in mind the ethical standards facing fundraisers in nonprofitsand the importance of upholding the public trust. “In fact, nowhereis ethical behavior more essential, or its absence more damaging, thanin philanthropic fundraising” (Sczudlo, 2003, p. 30). As such,
There is nothingillegal about
being paid forperformance as afundraiser—and
this may be a wayto motivate
employees toincrease
performance
nml184_06-435-464.qxd 4/8/08 9:27 PM Page 437
the pay-for-performance relationship for fundraisers may be some-what suppressed, where a “commission” or percentage-based pay forperformance is prohibited.
Third, we focus on issues of gender equity in the fundraisingworkforce. Over the past decade, there has been an increase in thememberships of the top three professional organizations representingfundraisers, to the point now where the majority of professionalsare women (Conry, 1998). Furthermore, more women than men areentering this profession as paid employees where women occupy allfundraising job categories across all types of nonprofit organizations(Conry, 1998). Conry (1991) refers to this phenomenon as “the fem-inization of fundraising” and cautions that this could have negativeimplications on the salaries, prestige, and status of a previouslymale-dominated occupation in which fundraising is seen as“women’s work.”
Much research has been conducted on the gender-pay gap in theprivate sector (for example, Bertrand and Hallock, 2001; Blau andFerber, 1992; Chauvin and Ash, 1994; Gerhart, 1990; Groshen, 1991;Harris, Gilbreath, and Sunday, 2002; Mohan and Ruggiero, 2003;Rose and Hartmann, 2004; Wood, Corcoran, and Courant, 1993),indicating that women are paid significantly less than men, evenwhen controlling for the industry, firm size, occupation, human cap-ital, performance, and organizational structural factors that are tra-ditionally associated with pay differentials. Although the nonprofitsector is dominated by women, very little research addresses wagedifferences between men and women (Hallock, 2000; Steinberg andJacobs, 1994). In our study, we investigate whether this finding per-sists in the nonprofit sector, in a profession where there is a quan-tifiable measure of performance as well as a preponderance of womenrecently entering the profession.
Compensation in Nonprofit OrganizationsMuch has been written regarding the theoretical reasons for differ-ences between compensation in the for-profit and nonprofit sectorand why compensation systems found in for-profit firms may notgeneralize to nonprofits (see Ballou and Weisbrod, 2003; Hallock,2000; Leete, 2001; Preston, 1989; Steinberg, 1990; Weisbrod, 1986,1988; Young and Steinberg, 1995 for discussion of this literature). Aprimary difference is that nonprofits operate under the “nondistribu-tion constraint” (Hansmann, 1980), thereby prohibiting distributionof profits to owners, and thus restricting organizations as to the type ofcompensation practices as well as the form of compensation thatcan be offered to its managers and employees. Given the nondistrib-ution constraint, “performance pay in nonprofits has historically notbeen very significant,” even though nonprofits are not precludedlegally from engaging in this practice (Hallock, 2000, p. 259). Severalrecent studies, however, have found a strong, positive link between
438 ME S C H, RO O N E Y
Nonprofit Management & Leadership DOI: 10.1002/nml
nml184_06-435-464.qxd 4/8/08 9:27 PM Page 438
the assets of a nonprofit and the pay of its top manager (for example,Brickley and Van Horn, 2002; Hallock, 2002a). Gray and Benson(2003) found that when resource efficiency was used as an indicatorof performance, nonprofit executive compensation was based, at leastin part, on organizational performance, although client satisfactionhad no effect. A recent study by Carroll, Hughes, and Luksetich(2005) found a positive relationship between executive compensa-tion and performance when performance was measured as revenueper dollar of noncompensation expenditure. However, this analysisrevealed that compensation and performance were simultaneouslydetermined.
The nondistribution constraint in the nonprofit sector leads to a“sorting” of managers among the two sectors where “managers withthe least aversion to risk and the weakest preference for leading anorganization that has goals other than profit maximization” are moreattracted to the for-profit rather than the nonprofit sector (Roomkinand Weisbrod, 1999, p. 778). Given that the nondistribution con-straint restricts managerial discretion—particularly regarding com-pensation decisions—managers, as well as other employees, may sortthemselves according to the type of organization that they find mostcompatible with their preferences. That is, individuals may be will-ing to “donate” their paid labor to a nonprofit cause that they careabout by accepting less compensation (Frank, 1996).
A second significant difference between compensation in the for-profit and nonprofit sectors has to do with the way in which perfor-mance is measured. Unlike for-profit firms where the bottom-lineperformance is focused on making a profit and demonstration ofresults, nonprofits conduct business in pursuit of a social mission,where ideal information on performance is often unobtainable, costly,abstract, and not easily quantified (Weisbrod, 1988). Finding appro-priate performance metrics to satisfy stakeholders, as well as deter-mining which performance indicators should be tied to pay, is muchmore difficult (Hallock, 2000; Handy and Katz, 1998; Steinberg,1990). Consequently, nonprofit boards often rely on more indirect andimperfect measures of performance, such as activity or process mea-sures (Weisbrod, 1988). As such, nonprofits must choose betweenrewarding what is easily measured—even though this may not rewardthe desired outcomes—incurring costs by devising better measures orby not rewarding performance at all (Weisbrod, 1988).
However, in comparison to other types of positions in nonprof-its, fundraising actually is results oriented, and outcomes can be mea-sured (Duronio and Loessin, 1991). This is not to imply thatorganizations providing fundraisers with specific goals are engagingin unethical behavior—or that they will be more ethical and pro-ductive if the focus is on process rather than on the results achieved.Instead, the role of fundraisers requires an understanding of the bal-ance between “concern for results with concern for how results areachieved” (Durnio and Loessin, 1991, p. 129). In fact, fundraisers
DE T E R M I N A N T S O F CO M P E N S AT I O N 439
Nonprofit Management & Leadership DOI: 10.1002/nml
Several recentstudies have founda strong, positivelink between the
assets of anonprofit and the
pay of its topmanager.
nml184_06-435-464.qxd 4/8/08 9:27 PM Page 439
who do not have specific, measurable goals and are not judged bywhat they accomplish may leave more room for unethical behaviorthan if evaluated on actual performance (Duronio and Loessin,1991). However, it has been suggested that “incentive contracts forfundraisers may lead to a perception among donors that their con-tributions are being diverted away from the organization’s major pur-pose and toward fundraiser compensation” (Carroll, Hughes, andLuksetich, 2005, p. 20).
Gender and PayResearch efforts over the past three decades “have attempted to disen-tangle factors that account for the gender-pay gap” (Renner, Rives, andBowlin, 2002, p. 332), and a great deal of theoretical work has beendeveloped in explaining the reasons that these differences occur (forexample, Blau, 1998; Blau and Ferber, 1992; Blau, Ferber, and Winkler,1998; Weichselbaumer, 2004). Reports in the popular press give anaccount of surveys that indicate senior female executives as well asother top positions of our nation’s nonprofits are routinely paid lessthan men in similar jobs: as high as a 50 percent gender differentialexists for CEOs (Lewin, 2001; Lipman, 2002). The pay gap is greatestamong the largest nonprofits (Lipman, 2002; GuideStar, 2005), per-sisting even across comparable job titles and responsibilities (Williams,2003), controlling for organization size (GuideStar, 2005).
Recent empirical research on nonprofits has found similar results.Although a few studies have found that CEO gender was not signifi-cantly related to compensation of nonprofits (for example, Oster, 1998;Preston, 1989), the majority of studies have found just the opposite(for example, Hallock, 2002b; Gibelman, 2000; Gray and Benson,2003; Werner, Konopaske, and Gemeinhardt, 2000; Williams, 2003;Ye and Manzo, 2004). Given that the nonprofit labor force is domi-nated by women, these results are even more troubling. According tothe Bureau of Labor Statistics, more than two-thirds of nonprofit work-ers are women, compared with about 43 percent of the employed civil-ian labor force as a whole (Johnston and Rudney, 1987).
MethodsIn terms of fundraising professionals, Conry (1998) summarizes sev-eral surveys that conclude female fundraisers have not made equalprogress in compensation rates. These findings indicate that (1)although overall salaries are climbing for fundraisers, women’s payconsistently lags behind that of men, and (2) women holding seniormanagement positions in fundraising are still a fraction of their over-all numbers as a group. These surveys, however, did not control forthe human capital factors traditionally associated with compensa-tion. The purpose of our study is to test whether a pay gap exists,controlling for organizational and human capital variables.
440 ME S C H, RO O N E Y
Nonprofit Management & Leadership DOI: 10.1002/nml
The pay gap[between malesand females in
top positions] isgreatest among
the largestnonprofits.
nml184_06-435-464.qxd 4/8/08 9:27 PM Page 440
Sample and DataA national cross-sectional sample consisting of 2,439 fundraising pro-fessionals across all subsectors of the nonprofit field was collectedthrough the AFP’s Compensation and Benefits Survey that wasadministered once a year for four years. The sample consists of pro-fessionals who are members of the AFP and are currently employedin fundraising roles in a nonprofit organization. AFP was founded in1960 and has approximately twenty-six thousand members in 171chapters throughout the world.
The respondents are employed in the following types of non-profits: 27 percent are from education, 5 percent from religious orga-nizations, 9 percent from social services, 23 percent from arts andculture, 20 percent from health, and 11 percent are other; 68 percentare employed full time, 26 percent more than half time, and 2 per-cent less than half time; 43 percent are in positions as chief develop-ment officer (CDO), 23 percent deputy director, 20 percent staff, and8 percent consultant. Mean age of respondents is forty-four; 69 per-cent of the sample is female, 94 percent white; 24 percent have abachelor’s degree, and 49 percent have postgraduate education. Theaverage number of years employed as a fundraising professional is14. Most of the respondents (58 percent) have one or more profes-sional certificates. The average salary in the sample was $70,000 andranged as high as $850,000. Bonuses tended to be a small share ofcompensation, averaging only 1.2 percent, but they went as high as25 percent. Most (81 percent) responding organizations did not paya bonus. While the average fundraising experience overall is 14 years,the average with the current particular nonprofit is only 4.5 years, sug-gesting considerable churning among fundraisers. This turnover maybe a way that fundraisers, particularly women, seek pay equity giventhat pay raises occur with job changes. While 24 percent have a con-tract, only 3 percent received a signing bonus at the time of hire.
Four years of survey data were obtained for the period from 2002to 2005 from AFP. Each year, AFP conducts a compensation and ben-efits survey of all its members. The survey asks questions about con-tributions raised, the organization’s operating budget, bonus andsalary information, and demographic information.
Dependent VariableThe dependent variable was compensation. CEO compensation wasoperationalized in two ways: base salary and bonus only (over atwelve-month period). These measures represent total cash providedto the incumbent and are widely used in the executive compensationliterature. In theory, base salary is used to represent a fixed compo-nent of total compensation, whereas bonuses vary according to somemeasure of performance (Gomez-Mejia, 1994). To adjust for the widerange of salaries and more closely approximate a normal distribution,we use logSalary as the measure of salary in the analysis. Bonus isexpressed as the percentage of total compensation.
DE T E R M I N A N T S O F CO M P E N S AT I O N 441
Nonprofit Management & Leadership DOI: 10.1002/nml
The dependentvariable was
compensation.
nml184_06-435-464.qxd 4/8/08 9:27 PM Page 441
Independent VariablePerformance was operationalized as the amount of money raised bythe organization in contributed gifts from all sources in a particularfiscal year. We use logMoney in the analysis.
Control VariablesThe control variables were as follows:
Type of organization. Organizations were coded as (1) educational,(2) religious, (3) consulting firm, partnership, or sole entrepre-neurship, (4) health, (5) social service, (6) arts and culture, (7)other.
Geographic scope. This was coded as (1) international, (2) national,(3) state, provincial, regional, or (4) local.
Organizational size. Organizational size was (1) operating budgetcoded as the log(Budget) for the fiscal year and (2) number offundraising support staff.
Region. The location of the organization was coded as (1) UnitedStates or (2) other.
Size of the metropolitan area was a categorical variable indicating pop-ulation of the metropolitan area, coded as (1) 0 to 500,000, (2)500,000 to 1 million, (3) 1 million to 3 million, or (4) more than3 million.
Position in the organization was coded as (1) chief development offi-cer, (2) deputy director, (3) staff, or (4) consultant.
Experience was coded as the number of years employed as a fundrais-ing professional as well as experience squared, and number of yearswith current employer.
Contract was whether the fundraising professional was under anemployment contract.
Signing bonus was whether the fundraising professional had a sign-ing bonus when hired.
Recruiter was whether the fundraising professional worked with anexecutive recruiter to secure their position.
Age was coded as age and age squared.Gender was coded as 1 � female.Race was white, black, or other. Black was coded � 1 if the respon-
dent self-identified s as black. “Other” was coded � 1 if therespondent indicated that they were a member of a nonblackminority group.
Education was (1) high school, (2) some college, (3) baccalaureatedegree, or (4) more than the baccalaureate.
Certification was coded as having at least one of the following pro-fessional certifications: Certified Fundraising Executive (CFRE),Advanced Certified Fundraising Executive (ACFRE), or Fellow forthe Association of Healthcare Philanthropy (FAHP), or other.
Year was coded as year of the survey. Year 1 is the comparison measure.
442 ME S C H, RO O N E Y
Nonprofit Management & Leadership DOI: 10.1002/nml
nml184_06-435-464.qxd 4/8/08 9:27 PM Page 442
Analysis and ResultsThe Carroll, Hughes, and Luksetich (2005) study raises the questionof the causality between pay and performance: Do employees workharder when they are paid more, or do harder-working employees getpaid more? Given this issue of simultaneity and endogeneity, the esti-mation process is less clear-cut than might be desired. To account forthis, we use a two-stage simultaneous estimation process (2SLS).
Model Used for AnalysisWe first estimate compensation using pooled time-series cross-sectional ordinary least squares (OLS) to find the impact of produc-tivity and other variables on salary and bonus among differentfundraising positions. We have an unbalanced panel with unmatchedsurvey respondents each year. Therefore, in order to maximize thepower of the regressions, we include all respondents in each year foreach position and control for year-specific effects, which would cap-ture differences in the overall macroeconomic effects in a given year.
In order to estimate the effects of performance on pay, we needto find a measure of performance or productivity that is exogenousor independent of compensation. To do this, we estimate productiv-ity (money raised) based on the size of the development budget andthe development staff, as well as the other independent variables weused to estimate compensation. We use the size of the developmentbudget and the development staff as instrumental variables to esti-mate productivity (money raised), because these variables arearguably related to the amounts raised but unrelated directly to com-pensation. In the second stage, we use the independently estimatedvalue of productivity (money raised) as an independent variable toestimate the pay-for-performance relationship and the effects of theother independent variables on compensation.
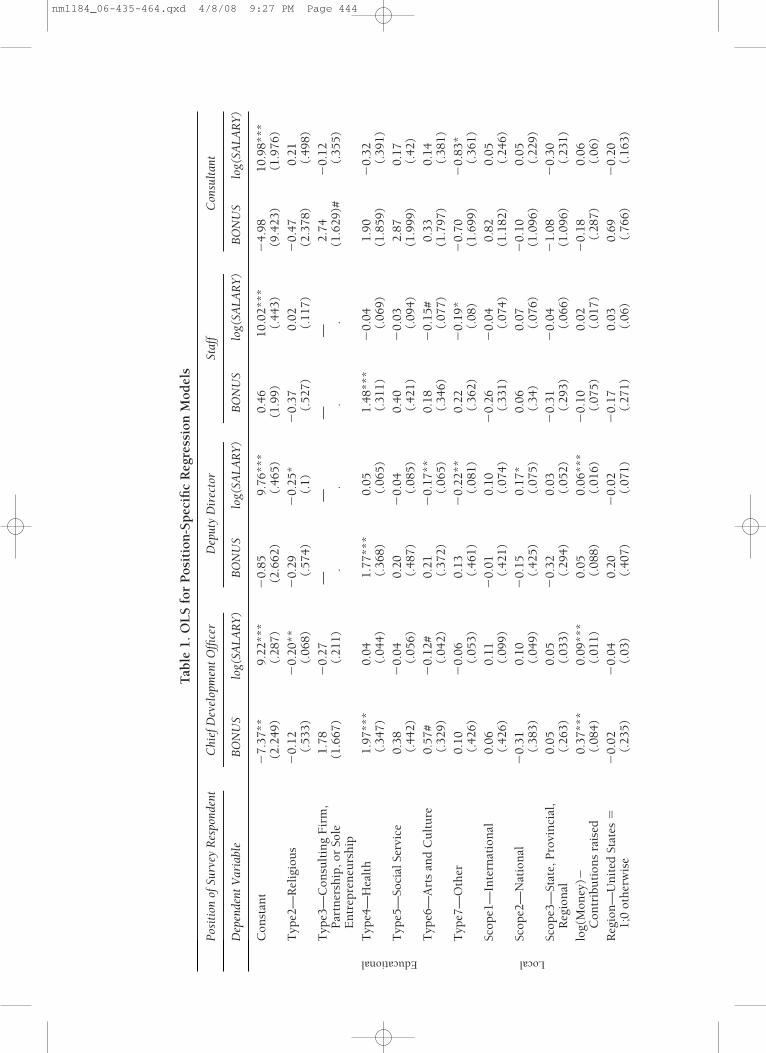
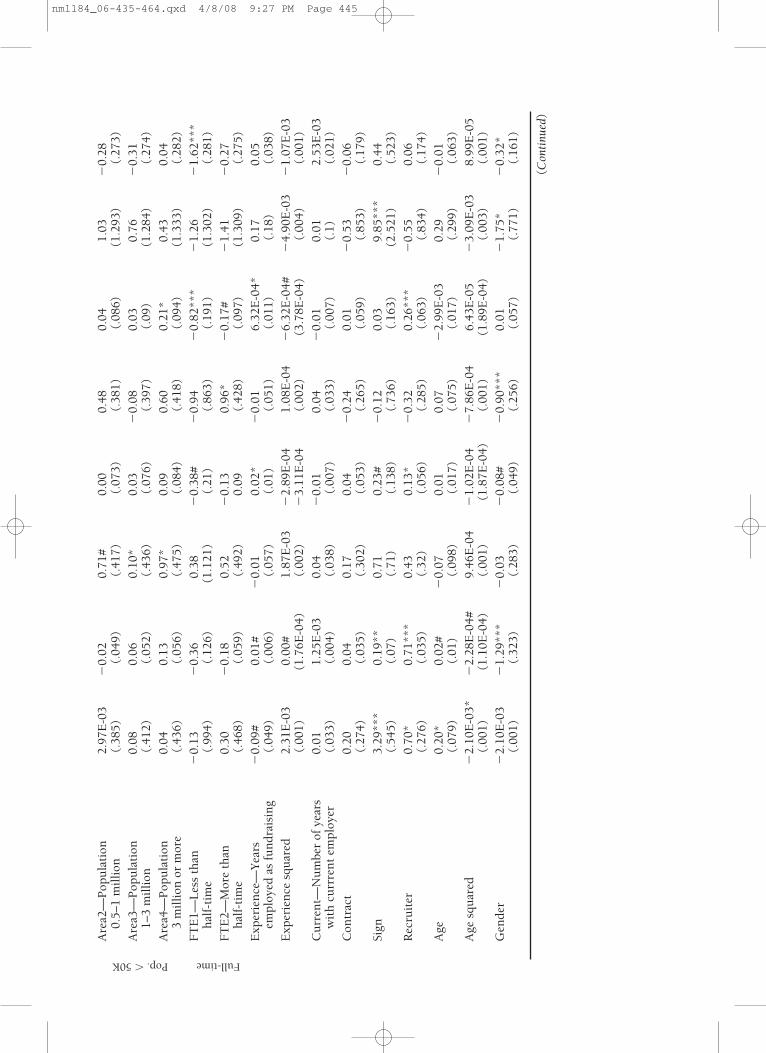
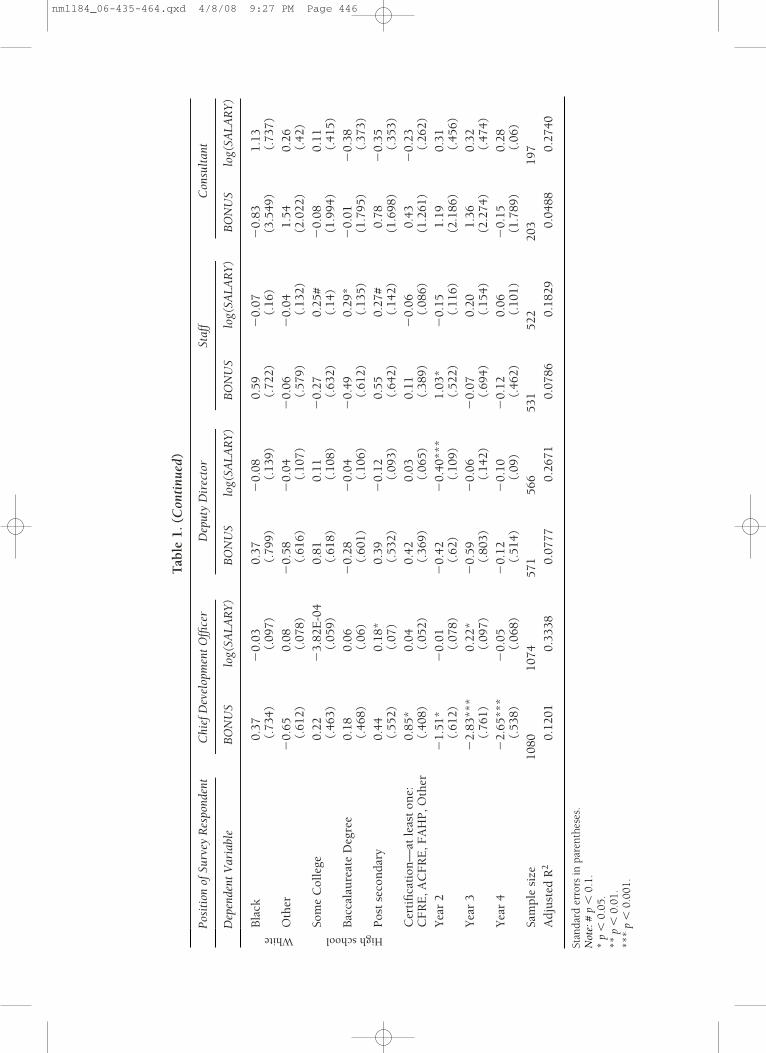
We first examine the relationship between pay and performancefor fundraising professionals and refer to the pooled OLS regressionresults in Table 1. Looking first at the results for each position only(see Table 1), we find that a 10 percent increase in funds raised bythe organization is significantly associated with a 0.9 percent raise insalary, as well as a significant increase in bonuses for the CDOs. Inaddition, deputy directors earned approximately a 0.6 percentincrease in salary for a 10 percent increase in funds raised. Dollarsraised is not significantly related to either of the compensation vari-ables for staff or consultant, which might be a reflection of either theindirect effects of these positions or the less precise meaning of con-sultants.
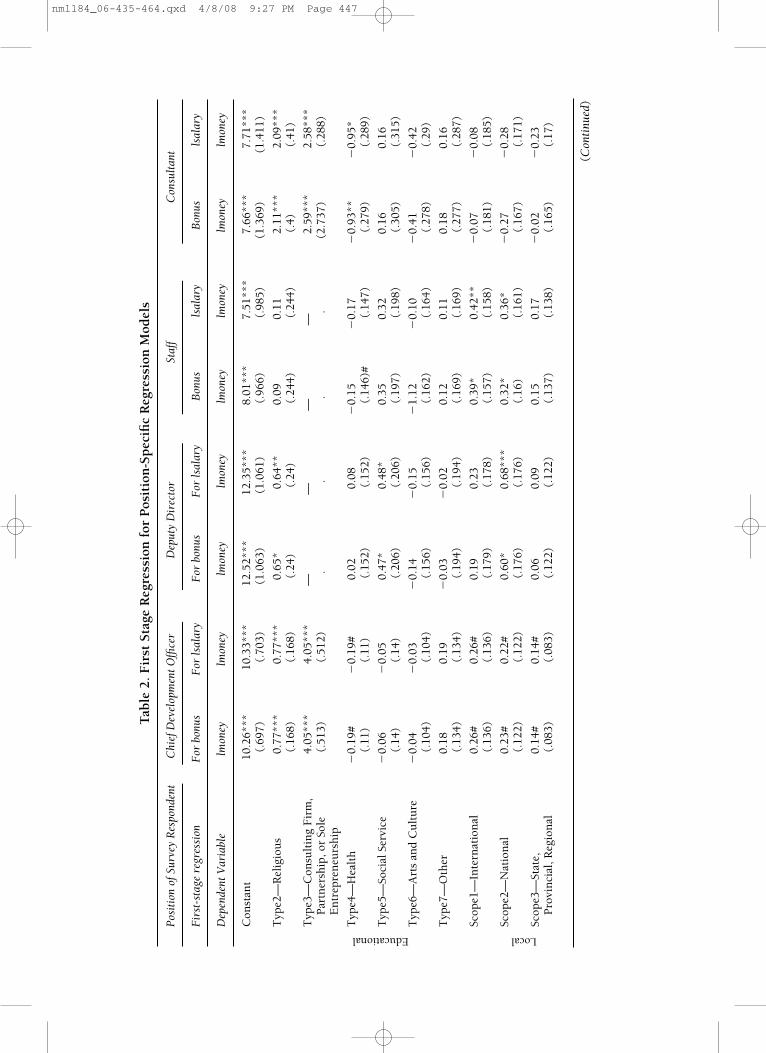
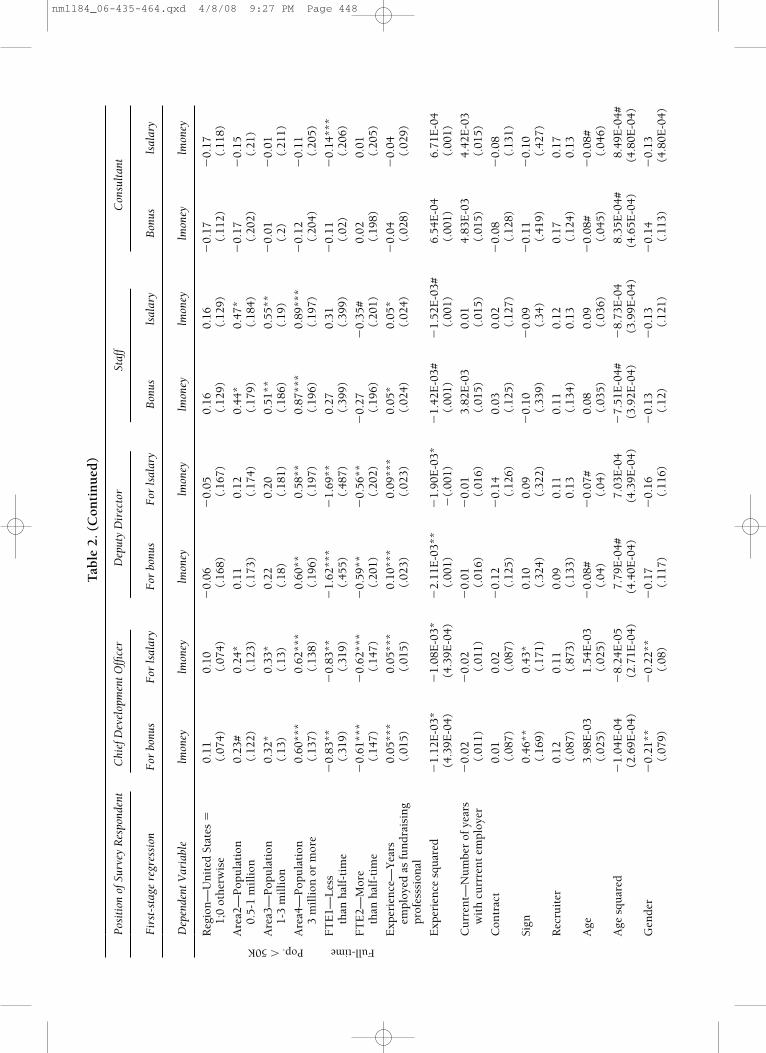
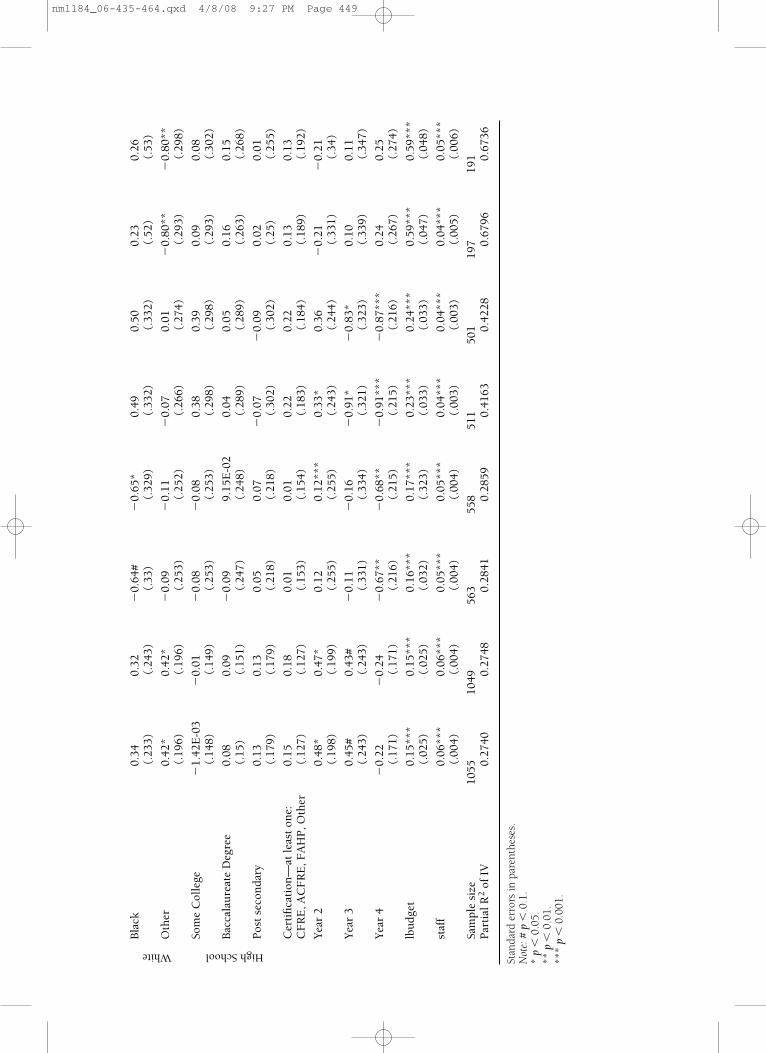
In Table 2, we provide the estimates of our measure of produc-tivity (money raised) using LnBudget and Staff (size) as instrumentalvariables that are independent of compensation but valid explanatoryvariables for productivity. We find that both LnBudget and Staff arehighly significant variables in explaining productivity (money raised)
DE T E R M I N A N T S O F CO M P E N S AT I O N 443
Nonprofit Management & Leadership DOI: 10.1002/nml
Do employeeswork harder
when they arepaid more, or doharder-workingemployees get
paid more?
nml184_06-435-464.qxd 4/8/08 9:27 PM Page 443
Tab
le 1
. OL
S fo
r P
osit
ion
-Sp
ecifi
c R
egre
ssio
n M
odel
s
Posi
tion
of S
urve
y R
espo
nden
tC
hief
Dev
elop
men
t Offi
cer
Dep
uty
Dir
ecto
rSt
aff
Con
sult
ant
Dep
ende
nt V
aria
ble
BO
NU
Slo
g(SA
LAR
Y)
BO
NU
Slo
g(SA
LAR
Y)
BO
NU
Slo
g(SA
LAR
Y)
BO
NU
Slo
g(SA
LAR
Y)
Con
stan
t�
7.37
**9.
22**
*�
0.85
9.76
***
0.46
10.0
2***
�4.
9810
.98*
**(2
.249
)(.
287)
(2.6
62)
(.46
5)(1
.99)
(.44
3)(9
.423
)(1
.976
)T
ype2
—R
elig
iou
s�
0.12
�0.
20**
�0.
29�
0.25
*�
0.37
0.02
�0.
470.
21(.
533)
(.06
8)(.
574)
(.1)
(.52
7)(.
117)
(2.3
78)
(.49
8)T
ype3
—C
onsu
ltin
g F
irm
,1.
78�
0.27
——
——
2.74
�0.
12P
artn
ersh
ip, o
r So
le
(1.6
67)
(.21
1).
..
.(1
.629
)#(.
355)
E
ntr
epre
neu
rsh
ipT
ype4
—H
ealt
h1.
97**
*0.
041.
77**
*0.
051.
48**
*�
0.04
1.90
�0.
32
(.34
7)(.
044)
(.36
8)(.
065)
(.31
1)(.
069)
(1.8
59)
(.39
1)T
ype5
—So
cial
Ser
vice
0.38
�0.
040.
20�
0.04
0.40
�0.
032.
870.
17(.
442)
(.05
6)(.
487)
(.08
5)(.
421)
(.09
4)(1
.999
)(.
42)
Typ
e6—
Art
s an
d C
ult
ure
0.57
#�
0.12
#0.
21�
0.17
**0.
18�
0.15
#0.
330.
14(.
329)
(.04
2)(.
372)
(.06
5)(.
346)
(.07
7)(1
.797
)(.
381)
Typ
e7—
Oth
er0.
10�
0.06
0.13
�0.
22**
0.22
�0.
19*
�0.
70�
0.83
*(.
426)
(.05
3)(.
461)
(.08
1)(.
362)
(.08
)(1
.699
)(.
361)
Scop
e1—
Inte
rnat
ion
al0.
060.
11�
0.01
0.10
�0.
26�
0.04
0.82
0.05
(.42
6)(.
099)
(.42
1)(.
074)
(.33
1)(.
074)
(1.1
82)
(.24
6)Sc
ope2
—N
atio
nal
�0.
310.
10�
0.15
0.17
*0.
060.
07�
0.10
0.05
(.38
3)(.
049)
(.42
5)(.
075)
(.34
)(.
076)
(1.0
96)
(.22
9)Sc
ope3
—St
ate,
Pro
vin
cial
, 0.
050.
05�
0.32
0.03
�0.
31�
0.04
�1.
08�
0.30
Reg
ion
al
(.26
3)(.
033)
(.29
4)(.
052)
(.29
3)(.
066)
(1.0
96)
(.23
1)lo
g(M
oney
)�0.
37**
*0.
09**
*0.
050.
06**
*�
0.10
0.02
�0.
180.
06
Con
trib
uti
ons
rais
ed
(.08
4)(.
011)
(.08
8)(.
016)
(.07
5)(.
017)
(.28
7)(.
06)
Reg
ion
—U
nit
ed S
tate
s �
�0.
02�
0.04
0.20
�0.
02�
0.17
0.03
0.69
�0.
20
1;0
oth
erw
ise
(.23
5)(.
03)
(.40
7)(.
071)
(.27
1)(.
06)
(.76
6)(.
163)
Educational Local
nml184_06-435-464.qxd 4/8/08 9:27 PM Page 444
Are
a2—
Pop
ula
tion
2.
97E
-03
�0.
020.
71#
0.00
0.48
0.04
1.03
�0.
28
0.5–
1 m
illi
on
(.38
5)(.
049)
(.41
7)(.
073)
(.38
1)(.
086)
(1.2
93)
(.27
3)A
rea3
—P
opu
lati
on
0.08
0.06
0.10
*0.
03�
0.08
0.03
0.76
�0.
311–
3 m
illi
on
(.41
2)(.
052)
(.43
6)(.
076)
(.39
7)(.
09)
(1.2
84)
(.27
4)A
rea4
—P
opu
lati
on
0.04
0.13
0.97
*0.
090.
600.
21*
0.43
0.04
3 m
illi
on o
r m
ore
(.43
6)(.
056)
(.47
5)(.
084)
(.41
8)(.
094)
(1.3
33)
(.28
2)F
TE
1—L
ess
than
�
0.13
�0.
360.
38�
0.38
#�
0.94
�0.
82**
*�
1.26
�1.
62**
*h
alf-
tim
e (.
994)
(.12
6)(1
.121
)(.
21)
(.86
3)(.
191)
(1.3
02)
(.28
1)F
TE
2—M
ore
than
0.
30�
0.18
0.52
�0.
130.
96*
�0.
17#
�1.
41�
0.27
hal
f-ti
me
(.46
8)(.
059)
(.49
2)0.
09(.
428)
(.09
7)(1
.309
)(.
275)
Exp
erie
nce
—Y
ears
�
0.09
#0.
01#
�0.
010.
02*
�0.
016.
32E
-04*
0.17
0.05
empl
oyed
as
fun
drai
sin
g (.
049)
(.00
6)(.
057)
(.01
)(.
051)
(.01
1)(.
18)
(.03
8)E
xper
ien
ce s
quar
ed2.
31E
-03
0.00
#1.
87E
-03
�2.
89E
-04
1.08
E-0
4�
6.32
E-0
4#�
4.90
E-0
3�
1.07
E-0
3(.
001)
(1.7
6E-0
4)(.
002)
�3.
11E
-04
(.00
2)(3
.78E
-04)
(.00
4)(.
001)
Cu
rren
t—N
um
ber
of y
ears
0.01
1.25
E-0
30.
04�
0.01
0.04
�0.
010.
012.
53E
-03
wit
h c
urr
ren
t em
ploy
er(.
033)
(.00
4)(.
038)
(.00
7)(.
033)
(.00
7)(.
1)(.
021)
Con
trac
t0.
200.
040.
170.
04�
0.24
0.01
�0.
53�
0.06
(.27
4)(.
035)
(.30
2)(.
053)
(.26
5)(.
059)
(.85
3)(.
179)
Sign
3.29
***
0.19
**0.
710.
23#
�0.
120.
039.
85**
*0.
44(.
545)
(.07
)(.
71)
(.13
8)(.
736)
(.16
3)(2
.521
)(.
523)
Rec
ruit
er0.
70*
0.71
***
0.43
0.13
*�
0.32
0.26
***
�0.
550.
06(.
276)
(.03
5)(.
32)
(.05
6)(.
285)
(.06
3)(.
834)
(.17
4)A
ge0.
20*
0.02
#�
0.07
0.01
0.07
�2.
99E
-03
0.29
�0.
01(.
079)
(.01
)(.
098)
(.01
7)(.
075)
(.01
7)(.
299)
(.06
3)A
ge s
quar
ed�
2.10
E-0
3*�
2.28
E-0
4#9.
46E
-04
�1.
02E
-04
�7.
86E
-04
6.43
E-0
5�
3.09
E-0
38.
99E
-05
(.00
1)(1
.10E
-04)
(.00
1)(1
.87E
-04)
(.00
1)(1
.89E
-04)
(.00
3)(.
001)
Gen
der
�2.
10E
-03
�1.
29**
*�
0.03
�0.
08#
�0.
90**
*0.
01�
1.75
*�
0.32
*(.
001)
(.32
3)(.
283)
(.04
9)(.
256)
(.05
7)(.
771)
(.16
1)
Pop. �50K Full-time
(Con
tinu
ed)
nml184_06-435-464.qxd 4/8/08 9:27 PM Page 445
Bla
ck0.
37�
0.03
0.37
�0.
080.
59�
0.07
�0.
831.
13(.
734)
(.09
7)(.
799)
(.13
9)(.
722)
(.16
)(3
.549
)(.
737)
Oth
er�
0.65
0.08
�0.
58�
0.04
�0.
06�
0.04
1.54
0.26
(.61
2)(.
078)
(.61
6)(.
107)
(.57
9)(.
132)
(2.0
22)
(.42
)So
me
Col
lege
0.22
�3.
82E
-04
0.81
0.11
�0.
270.
25#
�0.
080.
11(.
463)
(.05
9)(.
618)
(.10
8)(.
632)
(.14
)(1
.994
)(.
415)
Bac
cala
ure
ate
Deg
ree
0.18
0.06
�0.
28�
0.04
�0.
490.
29*
�0.
01�
0.38
(.46
8)(.
06)
(.60
1)(.
106)
(.61
2)(.
135)
(1.7
95)
(.37
3)P
ost
seco
nda
ry0.
440.
18*
0.39
�0.
120.
550.
27#
0.78
�0.
35(.
552)
(.07
)(.
532)
(.09
3)(.
642)
(.14
2)(1
.698
)(.
353)
Cer
tifi
cati
on—
at le
ast
one:
0.85
*0.
040.
420.
030.
11�
0.06
0.43
�0.
23C
FR
E, A
CF
RE
, FA
HP
, Oth
er(.
408)
(.05
2)(.
369)
(.06
5)(.
389)
(.08
6)(1
.261
)(.
262)
Yea
r 2
�1.
51*
�0.
01�
0.42
�0.
40**
*1.
03*
�0.
151.
190.
31(.
612)
(.07
8)(.
62)
(.10
9)(.
522)
(.11
6)(2
.186
)(.
456)
Yea
r 3
�2.
83**
*0.
22*
�0.
59�
0.06
�0.
070.
201.
360.
32(.
761)
(.09
7)(.
803)
(.14
2)(.
694)
(.15
4)(2
.274
)(.
474)
Yea
r 4
�2.
65**
*�
0.05
�0.
12�
0.10
�0.
120.
06�
0.15
0.28
(.53
8)(.
068)
(.51
4)(.
09)
(.46
2)(.
101)
(1.7
89)
(.06
)Sa
mpl
e si
ze10
8010
7457
156
653
152
220
319
7A
dju
sted
R2
0.12
010.
3338
0.07
770.
2671
0.07
860.
1829
0.04
880.
2740
Tab
le 1
. (C
onti
nued
)
Posi
tion
of S
urve
y R
espo
nden
tC
hief
Dev
elop
men
t Offi
cer
Dep
uty
Dir
ecto
rSt
aff
Con
sult
ant
Dep
ende
nt V
aria
ble
BO
NU
Slo
g(SA
LAR
Y)
BO
NU
Slo
g(SA
LAR
Y)
BO
NU
Slo
g(SA
LAR
Y)
BO
NU
Slo
g(SA
LAR
Y)
White High school
Stan
dard
err
ors
in p
aren
thes
es.
Not
e: #
p�
0.1.
* p
�0.
05.
** p
�0.
01.
***
p�
0.00
1.
nml184_06-435-464.qxd 4/8/08 9:27 PM Page 446
Tab
le 2
. Fir
st S
tage
Reg
ress
ion
for
Pos
itio
n-S
pec
ific
Reg
ress
ion
Mod
els
Posi
tion
of S
urve
y R
espo
nden
tC
hief
Dev
elop
men
t Offi
cer
Dep
uty
Dir
ecto
rSt
aff
Con
sult
ant
Fir
st-s
tage
reg
ress
ion
For
bon
usF
or ls
alar
yF
or b
onus
For
lsal
ary
Bon
usls
alar
yB
onus
lsal
ary
Dep
ende
nt V
aria
ble
lmon
eylm
oney
lmon
eylm
oney
lmon
eylm
oney
lmon
eylm
oney
Con
stan
t10
.26*
**10
.33*
**12
.52*
**12
.35*
**8.
01**
*7.
51**
*7.
66**
*7.
71**
*(.
697)
(.70
3)(1
.063
)(1
.061
)(.
966)
(.98
5)(1
.369
)(1
.411
)
Typ
e2—
Rel
igio
us
0.77
***
0.77
***
0.65
*0.
64**
0.09
0.11
2.11
***
2.09
***
(.16
8)(.
168)
(.24
)(.
24)
(.24
4)(.
244)
(.4)
(.41
)
Typ
e3—
Con
sult
ing
Fir
m,
4.05
***
4.05
***
——
——
2.59
***
2.58
***
Par
tner
ship
, or
Sole
(.
513)
(.51
2).
..
.(2
.737
)(.
288)
En
trep
ren
eurs
hip
Typ
e4—
Hea
lth
�0.
19#
�0.
19#
0.02
0.08
�0.
15�
0.17
�0.
93**
�0.
95*
(.11
)(.
11)
(.15
2)(.
152)
(.14
6)#
(.14
7)(.
279)
(.28
9)
Typ
e5—
Soci
al S
ervi
ce�
0.06
�0.
050.
47*
0.48
*0.
350.
320.
160.
16(.
14)
(.14
)(.
206)
(.20
6)(.
197)
(.19
8)(.
305)
(.31
5)
Typ
e6—
Art
s an
d C
ult
ure
�0.
04�
0.03
�0.
14�
0.15
�1.
12�
0.10
�0.
41�
0.42
(.10
4)(.
104)
(.15
6)(.
156)
(.16
2)(.
164)
(.27
8)(.
29)
Typ
e7—
Oth
er0.
180.
19�
0.03
�0.
020.
120.
110.
180.
16(.
134)
(.13
4)(.
194)
(.19
4)(.
169)
(.16
9)(.
277)
(.28
7)
Scop
e1—
Inte
rnat
ion
al0.
26#
0.26
#0.
190.
230.
39*
0.42
**�
0.07
�0.
08(.
136)
(.13
6)(.
179)
(.17
8)(.
157)
(.15
8)(.
181)
(.18
5)
Scop
e2—
Nat
ion
al0.
23#
0.22
#0.
60*
0.68
***
0.32
*0.
36*
�0.
27�
0.28
(.12
2)(.
122)
(.17
6)(.
176)
(.16
)(.
161)
(.16
7)(.
171)
Scop
e3—
Stat
e,
0.14
#0.
14#
0.06
0.09
0.15
0.17
�0.
02�
0.23
Pro
vin
cial
, Reg
ion
al(.
083)
(.08
3)(.
122)
(.12
2)(.
137)
(.13
8)(.
165)
(.17
)
Educational Local
(Con
tinu
ed)
nml184_06-435-464.qxd 4/8/08 9:27 PM Page 447
Reg
ion
—U
nit
ed S
tate
s�
0.11
0.10
�0.
06�
0.05
0.16
0.16
�0.
17�
0.17
1;0
oth
erw
ise
(.07
4)(.
074)
(.16
8)(.
167)
(.12
9)(.
129)
(.11
2)(.
118)
Are
a2—
Pop
ula
tion
0.
23#
0.24
*0.
110.
120.
44*
0.47
*�
0.17
�0.
150.
5-1
mil
lion
(.12
2)(.
123)
(.17
3)(.
174)
(.17
9)(.
184)
(.20
2)(.
21)
Are
a3—
Pop
ula
tion
0.
32*
0.33
*0.
220.
200.
51**
0.55
**�
0.01
�0.
011-
3 m
illi
on(.
13)
(.13
)(.
18)
(.18
1)(.
186)
(.19
)(.
2)(.
211)
Are
a4—
Pop
ula
tion
0.
60**
*0.
62**
*0.
60**
0.58
**0.
87**
*0.
89**
*�
0.12
�0.
113
mil
lion
or
mor
e(.
137)
(.13
8)(.
196)
(.19
7)(.
196)
(.19
7)(.
204)
(.20
5)
FT
E1—
Les
s �
0.83
**�
0.83
**�
1.62
***
�1.
69**
0.27
0.31
�0.
11�
0.14
***
than
hal
f-ti
me
(.31
9)(.
319)
(.45
5)(.
487)
(.39
9)(.
399)
(.02
)(.
206)
FT
E2—
Mor
e �
0.61
***
�0.
62**
*�
0.59
**�
0.56
**�
0.27
�0.
35#
0.02
0.01
than
hal
f-ti
me
(.14
7)(.
147)
(.20
1)(.
202)
(.19
6)(.
201)
(.19
8)(.
205)
Exp
erie
nce
—Y
ears
0.
05**
*0.
05**
*0.
10**
*0.
09**
*0.
05*
0.05
*�
0.04
�0.
04em
ploy
ed a
s fu
ndr
aisi
ng
(.01
5)(.
015)
(.02
3)(.
023)
(.02
4)(.
024)
(.02
8)(.
029)
prof
esss
ion
al
Exp
erie
nce
squ
ared
�1.
12E
-03*
�1.
08E
-03*
�2.
11E
-03*
*�
1.90
E-0
3*�
1.42
E-0
3#�
1.52
E-0
3#6.
54E
-04
6.71
E-0
4(4
.39E
-04)
(4.3
9E-0
4)(.
001)
�(.
001)
(.00
1)(.
001)
(.00
1)(.
001)
Cu
rren
t—N
um
ber
of y
ears
�0.
02�
0.02
�0.
01�
0.01
3.82
E-0
30.
014.
83E
-03
4.42
E-0
3w
ith
cu
rrre
nt
empl
oyer
(.01
1)(.
011)
(.01
6)(.
016)
(.01
5)(.
015)
(.01
5)(.
015)
Con
trac
t0.
010.
02�
0.12
�0.
140.
030.
02�
0.08
�0.
08(.
087)
(.08
7)(.
125)
(.12
6)(.
125)
(.12
7)(.
128)
(.13
1)
Sign
0.46
**0.
43*
0.10
0.09
�0.
10�
0.09
�0.
11�
0.10
(.16
9)(.
171)
(.32
4)(.
322)
(.33
9)(.
34)
(.41
9)(.
427)
Rec
ruit
er0.
120.
110.
090.
110.
110.
120.
170.
17(.
087)
(.87
3)(.
133)
0.13
(.13
4)0.
13(.
124)
0.13
Age
3.98
E-0
31.
54E
-03
�0.
08#
�0.
07#
0.08
0.09
�0.
08#
�0.
08#
(.02
5)(.
025)
(.04
)(.
04)
(.03
5)(.
036)
(.04
5)(.
046)
Age
squ
ared
�1.
04E
-04
�8.
24E
-05
7.79
E-0
4#7.
03E
-04
�7.
51E
-04#
�8.
73E
-04
8.35
E-0
4#8.
49E
-04#
(2.6
9E-0
4)(2
.71E
-04)
(4.4
0E-0
4)(4
.39E
-04)
(3.9
2E-0
4)(3
.99E
-04)
(4.6
5E-0
4)(4
.80E
-04)
Gen
der
�0.
21**
�0.
22**
�0.
17�
0.16
�0.
13�
0.13
�0.
14�
0.13
(.07
9)(.
08)
(.11
7)(.
116)
(.12
)(.
121)
(.11
3)(4
.80E
-04)
Pop. � 50K Full-timeT
able
2. (
Con
tin
ued
)
Posi
tion
of S
urve
y R
espo
nden
tC
hief
Dev
elop
men
t Offi
cer
Dep
uty
Dir
ecto
rSt
aff
Con
sult
ant
Fir
st-s
tage
reg
ress
ion
For
bon
usF
or ls
alar
yF
or b
onus
For
lsal
ary
Bon
usls
alar
yB
onus
lsal
ary
Dep
ende
nt V
aria
ble
lmon
eylm
oney
lmon
eylm
oney
lmon
eylm
oney
lmon
eylm
oney
nml184_06-435-464.qxd 4/8/08 9:27 PM Page 448
Bla
ck0.
340.
32�
0.64
#�
0.65
*0.
490.
500.
230.
26(.
233)
(.24
3)(.
33)
(.32
9)(.
332)
(.33
2)(.
52)
(.53
)
Oth
er0.
42*
0.42
*�
0.09
�0.
11�
0.07
0.01
�0.
80**
�0.
80**
(.19
6)(.
196)
(.25
3)(.
252)
(.26
6)(.
274)
(.29
3)(.
298)
Som
e C
olle
ge�
1.42
E-0
3�
0.01
�0.
08�
0.08
0.38
0.39
0.09
0.08
(.14
8)(.
149)
(.25
3)(.
253)
(.29
8)(.
298)
(.29
3)(.
302)
Bac
cala
ure
ate
Deg
ree
0.08
0.09
�0.
099.
15E
-02
0.04
0.05
0.16
0.15
(.15
)(.
151)
(.24
7)(.
248)
(.28
9)(.
289)
(.26
3)(.
268)
Pos
t se
con
dary
0.13
0.13
0.05
0.07
�0.
07�
0.09
0.02
0.01
(.17
9)(.
179)
(.21
8)(.
218)
(.30
2)(.
302)
(.25
)(.
255)
Cer
tifi
cati
on—
at le
ast
one:
0.15
0.18
0.01
0.01
0.22
0.22
0.13
0.13
CF
RE
, AC
FR
E, F
AH
P, O
ther
(.12
7)(.
127)
(.15
3)(.
154)
(.18
3)(.
184)
(.18
9)(.
192)
Yea
r 2
0.48
*0.
47*
0.12
0.12
***
0.33
*0.
36�
0.21
�0.
21(.
198)
(.19
9)(.
255)
(.25
5)(.
243)
(.24
4)(.
331)
(.34
)
Yea
r 3
0.45
#0.
43#
�0.
11�
0.16
�0.
91*
�0.
83*
0.10
0.11
(.24
3)(.
243)
(.33
1)(.
334)
(.32
1)(.
323)
(.33
9)(.
347)
Yea
r 4
�0.
22�
0.24
�0.
67**
�0.
68**
�0.
91**
*�
0.87
***
0.24
0.25
(.17
1)(.
171)
(.21
6)(.
215)
(.21
5)(.
216)
(.26
7)(.
274)
lbu
dget
0.15
***
0.15
***
0.16
***
0.17
***
0.23
***
0.24
***
0.59
***
0.59
***
(.02
5)(.
025)
(.03
2)(.
323)
(.03
3)(.
033)
(.04
7)(.
048)
staf
f0.
06**
*0.
06**
*0.
05**
*0.
05**
*0.
04**
*0.
04**
*0.
04**
*0.
05**
*(.
004)
(.00
4)(.
004)
(.00
4)(.
003)
(.00
3)(.
005)
(.00
6)
Sam
ple
size
1055
1049
563
558
511
501
197
191
Par
tial
R2
of I
V0.
2740
0.27
480.
2841
0.28
590.
4163
0.42
280.
6796
0.67
36
White High School
Stan
dard
err
ors
in p
aren
thes
es.
Not
e:#
p �
0.1
.*
p �
0.0
5.**
p �
0.0
1.**
* p
� 0
.001
.
nml184_06-435-464.qxd 4/8/08 9:27 PM Page 449
450 ME S C H, RO O N E Y
Nonprofit Management & Leadership DOI: 10.1002/nml
across all types of fundraising positions. Given this and the theoret-ical distinction between their roles in explaining productivity directlybut that they are arguably independent from explaining compensa-tion directly, we determine that they are valid instrumental variables.Therefore, we include them in the second stage of our analysis.
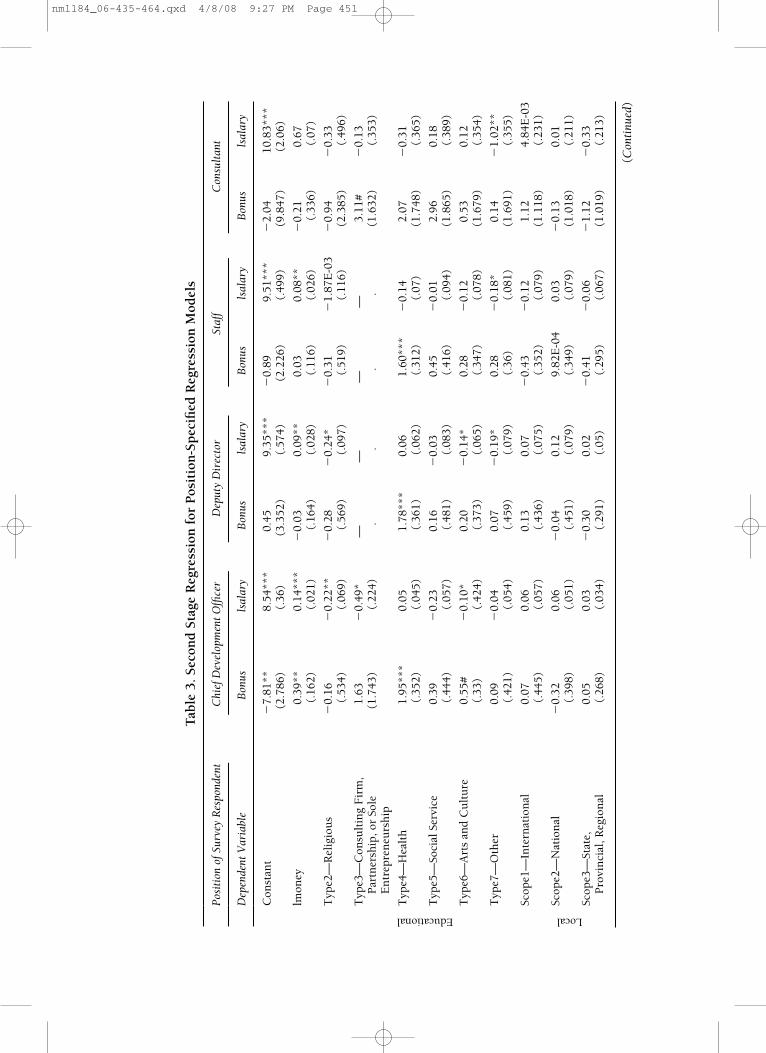
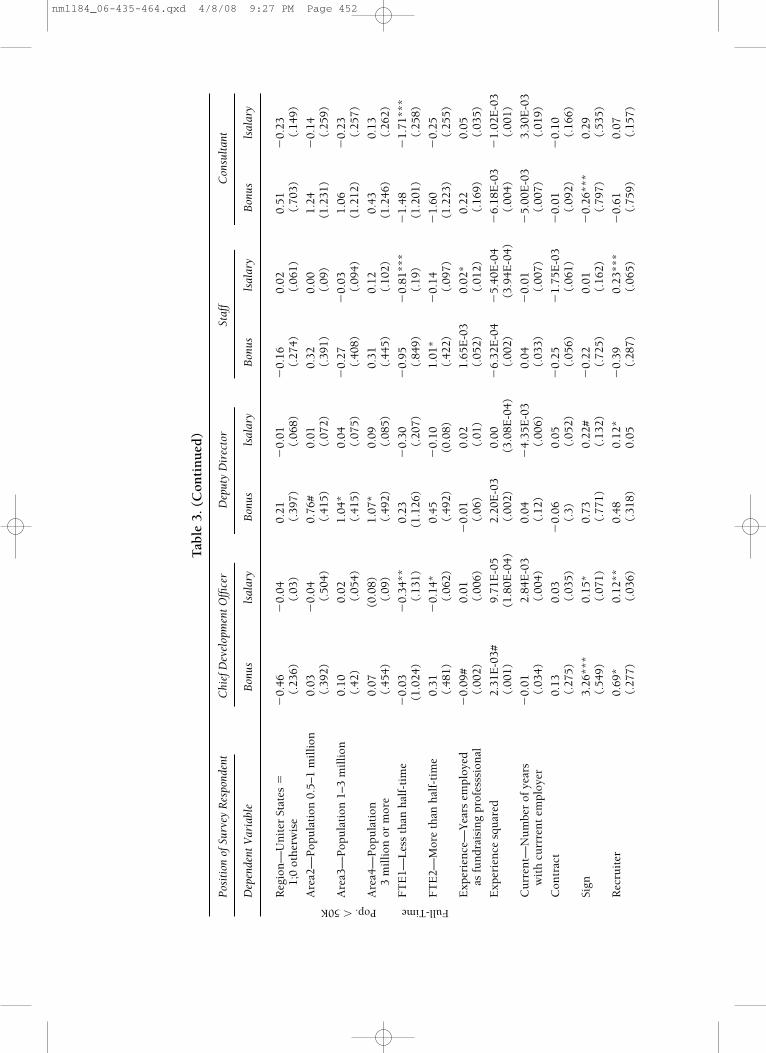
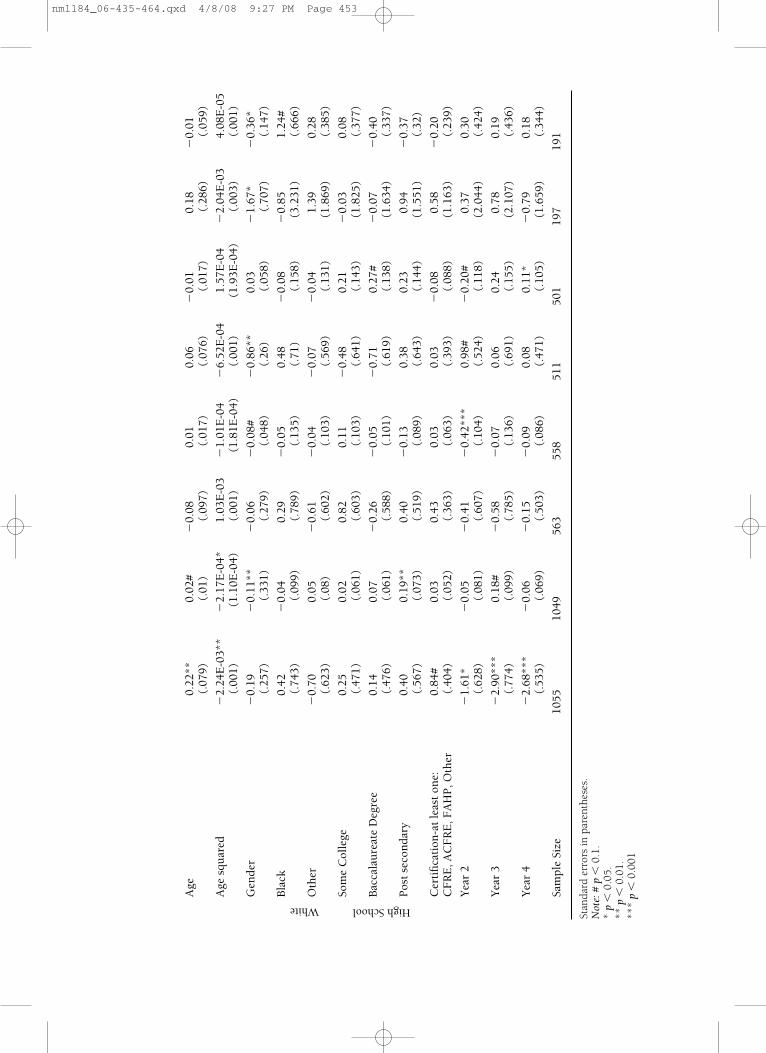
Table 3 presents the results of our 2SLS simultaneous estimates.In this estimate, we find that productivity (LnMoney) has a positiveand significant effect on the salary of each type of fundraising posi-tion. The strongest effect is for chief development officers, for whoma 10 percent increase in money raised is associated with a 1.4 percentincrease in salary. Fundraising productivity (LMoney raised) is notassociated with a significant increase in bonuses—except for CDOs.This may not be too surprising: if any position would have a variablecompensation component, it would be the CDO, who is chieflyresponsible for all aspects of fundraising at the organization. For thedeputy directors, a 10 percent increase in productivity is associatedwith a 0.9 percent increase in salary. Staff experienced a similarchange (0.8 percent); there was not a significant association betweenpay and performance for consultants.
Our results indicate a statistically significant relationshipbetween pay and performance for most fundraising positions. Con-trolling for differences in mission, geographic scope, geographicalpopulation, size of the nonprofit, and so forth, as well as severalhuman capital variables, we find evidence supportive of the notionof pay for performance among fundraisers.
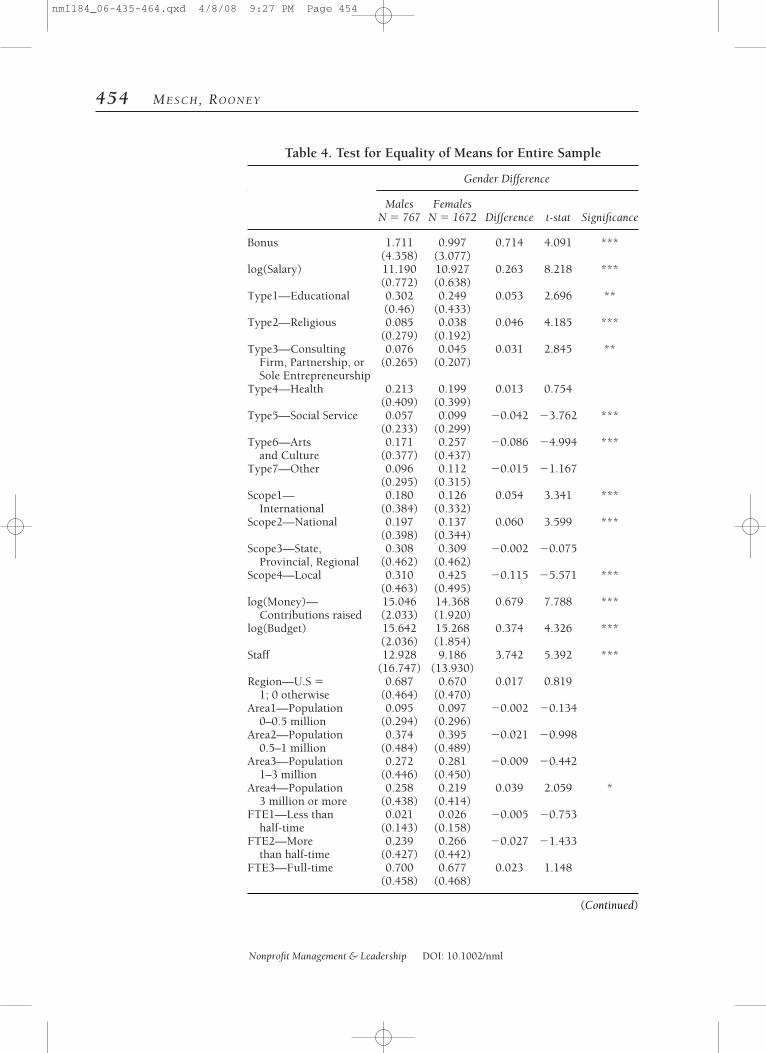
Are There Gender Differences in Compensation?We performed a series of t tests for differences between the meansfor men (n � 767) and women (n � 1,672) fundraisers. Noteworthyresults presented in Table 4 indicate that men have significantlyhigher average salaries and larger shares of income from bonuses.(Men’s bonuses are, on average, over 70 percent higher than those ofwomen.) Men are more likely than women to serve in educational,religious, and consulting organizations, whereas women are morelikely to serve in social services and arts and cultural nonprofits. Geo-graphically men are more likely to work in international and nationalnonprofits, and women are more likely to work in local nonprofits.Men raised significantly more money and worked for organizationswith larger development staffs and budgets. Men also had signifi-cantly more overall experience as fundraisers (four more years) buthad similar tenures with the current employer. Men were slightlyolder (3.6 years) and were almost twice as likely as females to havebeen hired through a recruiter. Men were more likely to have signif-icantly more education than women. Hence, if it were not possibleto refine our analysis further, we might conclude that men are paidmore than women, but they perhaps had earned higher compensa-tion because, on average, they raise more money, work in larger, morecomplex organizations, and have more education than women.
Fundraisingproductivity isnot associated
with a significantincrease in
bonuses—exceptfor chief
developmentofficers.
We find evidencesupportive of thenotion of pay for
performanceamong
fundraisers.
nml184_06-435-464.qxd 4/8/08 9:27 PM Page 450
Tab
le 3
. Sec
ond
Sta
ge R
egre
ssio
n f
or P
osit
ion
-Sp
ecifi
ed R
egre
ssio
n M
odel
s
Posi
tion
of S
urve
y R
espo
nden
tC
hief
Dev
elop
men
t Offi
cer
Dep
uty
Dir
ecto
rSt
aff
Con
sult
ant
Dep
ende
nt V
aria
ble
Bon
usls
alar
yB
onus
lsal
ary
Bon
usls
alar
yB
onus
lsal
ary
Con
stan
t�
7.81
**8.
54**
*0.
459.
35**
*�
0.89
9.51
***
�2.
0410
.83*
**(2
.786
)(.
36)
(3.3
52)
(.57
4)(2
.226
)(.
499)
(9.8
47)
(2.0
6)
lmon
ey0.
39**
0.14
***
�0.
030.
09**
0.03
0.08
**�
0.21
0.67
(.16
2)(.
021)
(.16
4)(.
028)
(.11
6)(.
026)
(.33
6)(.
07)
Typ
e2—
Rel
igio
us
�0.
16�
0.22
**�
0.28
�0.
24*
�0.
31�
1.87
E-0
3�
0.94
�0.
33(.
534)
(.06
9)(.
569)
(.09
7)(.
519)
(.11
6)(2
.385
)(.
496)
Typ
e3—
Con
sult
ing
Fir
m,
1.63
�0.
49*
——
——
3.11
#�
0.13
Par
tner
ship
, or
Sole
(1
.743
)(.
224)
..
..
(1.6
32)
(.35
3)E
ntr
epre
neu
rsh
ip
Typ
e4—
Hea
lth
1.95
***
0.05
1.78
***
0.06
1.60
***
�0.
142.
07�
0.31
(.35
2)(.
045)
(.36
1)(.
062)
(.31
2)(.
07)
(1.7
48)
(.36
5)
Typ
e5—
Soci
al S
ervi
ce0.
39�
0.23
0.16
�0.
030.
45�
0.01
2.96
0.18
(.44
4)(.
057)
(.48
1)(.
083)
(.41
6)(.
094)
(1.8
65)
(.38
9)
Typ
e6—
Art
s an
d C
ult
ure
0.55
#�
0.10
*0.
20�
0.14
*0.
28�
0.12
0.53
0.12
(.33
)(.
424)
(.37
3)(.
065)
(.34
7)(.
078)
(1.6
79)
(.35
4)
Typ
e7—
Oth
er0.
09�
0.04
0.07
�0.
19*
0.28
�0.
18*
0.14
�1.
02**
(.42
1)(.
054)
(.45
9)(.
079)
(.36
)(.
081)
(1.6
91)
(.35
5)
Scop
e1—
Inte
rnat
ion
al0.
070.
060.
130.
07�
0.43
�0.
121.
124.
84E
-03
(.44
5)(.
057)
(.43
6)(.
075)
(.35
2)(.
079)
(1.1
18)
(.23
1)
Scop
e2—
Nat
ion
al�
0.32
0.06
�0.
040.
129.
82E
-04
0.03
�0.
130.
01(.
398)
(.05
1)(.
451)
(.07
9)(.
349)
(.07
9)(1
.018
)(.
211)
Scop
e3—
Stat
e,
0.05
0.03
�0.
300.
02�
0.41
�0.
06�
1.12
�0.
33P
rovi
nci
al, R
egio
nal
(.26
8)(.
034)
(.29
1)(.
05)
(.29
5)(.
067)
(1.0
19)
(.21
3)
Educational Local
(Con
tinu
ed)
nml184_06-435-464.qxd 4/8/08 9:27 PM Page 451
Reg
ion
—U
nit
er S
tate
s �
�0.
46�
0.04
0.21
�0.
01�
0.16
0.02
0.51
�0.
231;
0 ot
her
wis
e(.
236)
(.03
)(.
397)
(.06
8)(.
274)
(.06
1)(.
703)
(.14
9)
Are
a2—
Pop
ula
tion
0.5
–1 m
illi
on0.
03�
0.04
0.76
#0.
010.
320.
001.
24�
0.14
(.39
2)(.
504)
(.41
5)(.
072)
(.39
1)(.
09)
(1.2
31)
(.25
9)
Are
a3—
Pop
ula
tion
1–3
mil
lion
0.10
0.02
1.04
*0.
04�
0.27
�0.
031.
06�
0.23
(.42
)(.
054)
(.41
5)(.
075)
(.40
8)(.
094)
(1.2
12)
(.25
7)
Are
a4—
Pop
ula
tion
0.
07(0
.08)
1.07
*0.
090.
310.
120.
430.
133
mil
lion
or
mor
e(.
454)
(.09
)(.
492)
(.08
5)(.
445)
(.10
2)(1
.246
)(.
262)
FT
E1—
Les
s th
an h
alf-
tim
e�
0.03
�0.
34**
0.23
�0.
30�
0.95
�0.
81**
*�
1.48
�1.
71**
*(1
.024
)(.
131)
(1.1
26)
(.20
7)(.
849)
(.19
)(1
.201
)(.
258)
FT
E2—
Mor
e th
an h
alf-
tim
e0.
31�
0.14
*0.
45�
0.10
1.01
*�
0.14
�1.
60�
0.25
(.48
1)(.
062)
(.49
2)(0
.08)
(.42
2)(.
097)
(1.2
23)
(.25
5)
Exp
erie
nce
—Y
ears
em
ploy
ed�
0.09
#0.
01�
0.01
0.02
1.65
E-0
30.
02*
0.22
0.05
as f
un
drai
sin
g pr
ofes
ssio
nal
(.00
2)(.
006)
(.06
)(.
01)
(.05
2)(.
012)
(.16
9)(.
035)
Exp
erie
nce
squ
ared
2.31
E-0
3#9.
71E
-05
2.20
E-0
30.
00�
6.32
E-0
4�
5.40
E-0
4�
6.18
E-0
3�
1.02
E-0
3(.
001)
(1.8
0E-0
4)(.
002)
(3.0
8E-0
4)(.
002)
(3.9
4E-0
4)(.
004)
(.00
1)
Cu
rren
t—N
um
ber
of y
ears
�0.
012.
84E
-03
0.04
�4.
35E
-03
0.04
�0.
01�
5.00
E-0
33.
30E
-03
wit
h c
urr
ren
t em
ploy
er(.
034)
(.00
4)(.
12)
(.00
6)(.
033)
(.00
7)(.
007)
(.01
9)
Con
trac
t0.
130.
03�
0.06
0.05
�0.
25�
1.75
E-0
3�
0.01
�0.
10(.
275)
(.03
5)(.
3)(.
052)
(.05
6)(.
061)
(.09
2)(.
166)
Sign
3.26
***
0.15
*0.
730.
22#
�0.
220.
01�
0.26
***
0.29
(.54
9)(.
071)
(.77
1)(.
132)
(.72
5)(.
162)
(.79
7)(.
535)
Rec
ruit
er0.
69*
0.12
**0.
480.
12*
�0.
390.
23**
*�
0.61
0.07
(.27
7)(.
036)
(.31
8)0.
05(.
287)
(.06
5)(.
759)
(.15
7)
Pop. �50K Full-Time
Tab
le 3
. (C
onti
nu
ed)
Posi
tion
of S
urve
y R
espo
nden
tC
hief
Dev
elop
men
t Offi
cer
Dep
uty
Dir
ecto
rSt
aff
Con
sult
ant
Dep
ende
nt V
aria
ble
Bon
usls
alar
yB
onus
lsal
ary
Bon
usls
alar
yB
onus
lsal
ary
nml184_06-435-464.qxd 4/8/08 9:27 PM Page 452
Age
0.22
**0.
02#
�0.
080.
010.
06�
0.01
0.18
�0.
01(.
079)
(.01
)(.
097)
(.01
7)(.
076)
(.01
7)(.
286)
(.05
9)
Age
squ
ared
�2.
24E
-03*
*�
2.17
E-0
4*1.
03E
-03
�1.
01E
-04
�6.
52E
-04
1.57
E-0
4�
2.04
E-0
34.
08E
-05
(.00
1)(1
.10E
-04)
(.00
1)(1
.81E
-04)
(.00
1)(1
.93E
-04)
(.00
3)(.
001)
Gen
der
�0.
19�
0.11
**�
0.06
�0.
08#
�0.
86**
0.03
�1.
67*
�0.
36*
(.25
7)(.
331)
(.27
9)(.
048)
(.26
)(.
058)
(.70
7)(.
147)
Bla
ck0.
42�
0.04
0.29
�0.
050.
48�
0.08
�0.
851.
24#
(.74
3)(.
099)
(.78
9)(.
135)
(.71
)(.
158)
(3.2
31)
(.66
6)
Oth
er�
0.70
0.05
�0.
61�
0.04
�0.
07�
0.04
1.39
0.28
(.62
3)(.
08)
(.60
2)(.
103)
(.56
9)(.
131)
(1.8
69)
(.38
5)
Som
e C
olle
ge0.
250.
020.
820.
11�
0.48
0.21
�0.
030.
08(.
471)
(.06
1)(.
603)
(.10
3)(.
641)
(.14
3)(1
.825
)(.
377)
Bac
cala
ure
ate
Deg
ree
0.14
0.07
�0.
26�
0.05
�0.
710.
27#
�0.
07�
0.40
(.47
6)(.
061)
(.58
8)(.
101)
(.61
9)(.
138)
(1.6
34)
(.33
7)
Pos
t se
con
dary
0.40
0.19
**0.
40�
0.13
0.38
0.23
0.94
�0.
37(.
567)
(.07
3)(.
519)
(.08
9)(.
643)
(.14
4)(1
.551
)(.
32)
Cer
tifi
cati
on-a
t le
ast
one:
0.84
#0.
030.
430.
030.
03�
0.08
0.58
�0.
20C
FR
E, A
CF
RE
, FA
HP
, Oth
er(.
404)
(.05
2)(.
363)
(.06
3)(.
393)
(.08
8)(1
.163
)(.
239)
Yea
r 2
�1.
61*
�0.
05�
0.41
�0.
42**
*0.
98#
�0.
20#
0.37
0.30
(.62
8)(.
081)
(.60
7)(.
104)
(.52
4)(.
118)
(2.0
44)
(.42
4)
Yea
r 3
�2.
90**
*0.
18#
�0.
58�
0.07
0.06
0.24
0.78
0.19
(.77
4)(.
099)
(.78
5)(.
136)
(.69
1)(.
155)
(2.1
07)
(.43
6)
Yea
r 4
�2.
68**
*�
0.06
�0.
15�
0.09
0.08
0.11
*�
0.79
0.18
(.53
5)(.
069)
(.50
3)(.
086)
(.47
1)(.
105)
(1.6
59)
(.34
4)
Sam
ple
Size
1055
1049
563
558
511
501
197
191
White High School
Stan
dard
err
ors
in p
aren
thes
es.
Not
e: #
p�
0.1.
* p
�0.
05.
** p
�0.
01.
***
p�
0.00
1
nml184_06-435-464.qxd 4/8/08 9:27 PM Page 453
454 ME S C H, RO O N E Y
Nonprofit Management & Leadership DOI: 10.1002/nml
Table 4. Test for Equality of Means for Entire Sample
Gender Difference
Males FemalesN � 767 N � 1672 Difference t-stat Significance
Bonus 1.711 0.997 0.714 4.091 ***(4.358) (3.077)
log(Salary) 11.190 10.927 0.263 8.218 ***(0.772) (0.638)
Type1—Educational 0.302 0.249 0.053 2.696 **(0.46) (0.433)
Type2—Religious 0.085 0.038 0.046 4.185 ***(0.279) (0.192)
Type3—Consulting 0.076 0.045 0.031 2.845 **Firm, Partnership, or (0.265) (0.207)Sole Entrepreneurship
Type4—Health 0.213 0.199 0.013 0.754(0.409) (0.399)
Type5—Social Service 0.057 0.099 �0.042 �3.762 ***(0.233) (0.299)
Type6—Arts 0.171 0.257 �0.086 �4.994 ***and Culture (0.377) (0.437)
Type7—Other 0.096 0.112 �0.015 �1.167(0.295) (0.315)
Scope1— 0.180 0.126 0.054 3.341 ***International (0.384) (0.332)
Scope2—National 0.197 0.137 0.060 3.599 ***(0.398) (0.344)
Scope3—State, 0.308 0.309 �0.002 �0.075Provincial, Regional (0.462) (0.462)
Scope4—Local 0.310 0.425 �0.115 �5.571 ***(0.463) (0.495)
log(Money)— 15.046 14.368 0.679 7.788 ***Contributions raised (2.033) (1.920)
log(Budget) 15.642 15.268 0.374 4.326 ***(2.036) (1.854)
Staff 12.928 9.186 3.742 5.392 ***(16.747) (13.930)
Region—U.S � 0.687 0.670 0.017 0.8191; 0 otherwise (0.464) (0.470)
Area1—Population 0.095 0.097 �0.002 �0.1340–0.5 million (0.294) (0.296)
Area2—Population 0.374 0.395 �0.021 �0.9980.5–1 million (0.484) (0.489)
Area3—Population 0.272 0.281 �0.009 �0.4421–3 million (0.446) (0.450)
Area4—Population 0.258 0.219 0.039 2.059 *3 million or more (0.438) (0.414)
FTE1—Less than 0.021 0.026 �0.005 �0.753half-time (0.143) (0.158)
FTE2—More 0.239 0.266 �0.027 �1.433than half-time (0.427) (0.442)
FTE3—Full-time 0.700 0.677 0.023 1.148(0.458) (0.468)
(Continued)
nml184_06-435-464.qxd 4/8/08 9:27 PM Page 454
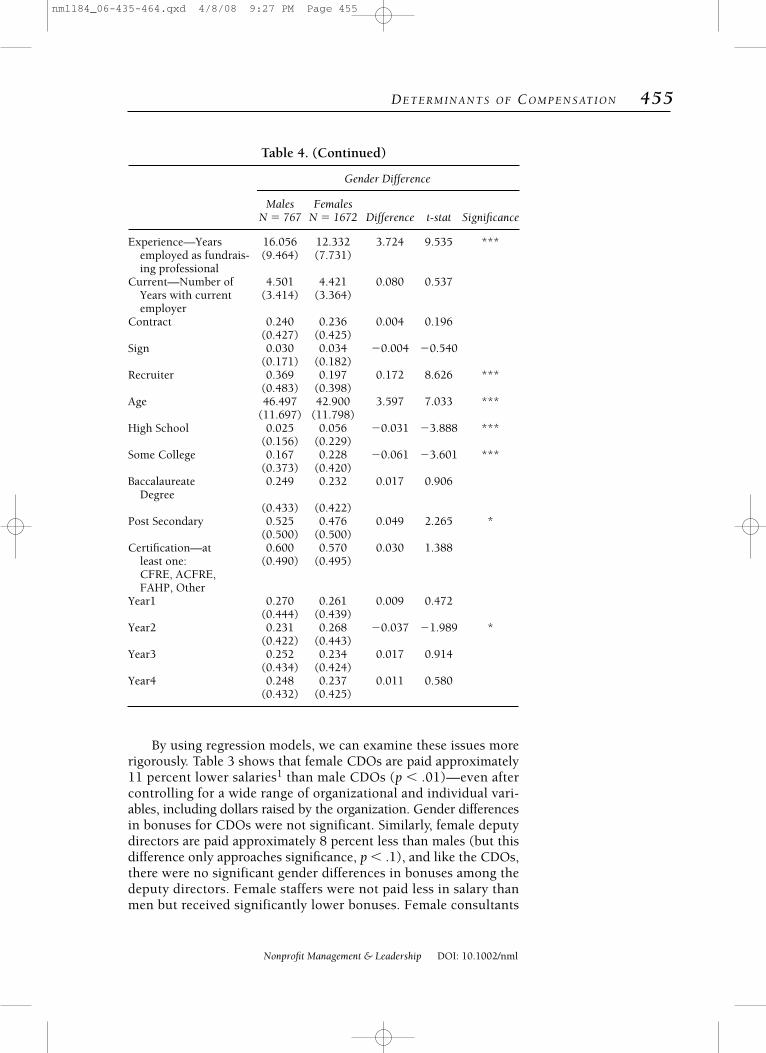
By using regression models, we can examine these issues morerigorously. Table 3 shows that female CDOs are paid approximately11 percent lower salaries1 than male CDOs (p � .01)—even aftercontrolling for a wide range of organizational and individual vari-ables, including dollars raised by the organization. Gender differencesin bonuses for CDOs were not significant. Similarly, female deputydirectors are paid approximately 8 percent less than males (but thisdifference only approaches significance, p � .1), and like the CDOs,there were no significant gender differences in bonuses among thedeputy directors. Female staffers were not paid less in salary thanmen but received significantly lower bonuses. Female consultants
DE T E R M I N A N T S O F CO M P E N S AT I O N 455
Nonprofit Management & Leadership DOI: 10.1002/nml
Experience—Years 16.056 12.332 3.724 9.535 ***employed as fundrais- (9.464) (7.731)ing professional
Current—Number of 4.501 4.421 0.080 0.537Years with current (3.414) (3.364)employer
Contract 0.240 0.236 0.004 0.196(0.427) (0.425)
Sign 0.030 0.034 �0.004 �0.540(0.171) (0.182)
Recruiter 0.369 0.197 0.172 8.626 ***(0.483) (0.398)
Age 46.497 42.900 3.597 7.033 ***(11.697) (11.798)
High School 0.025 0.056 �0.031 �3.888 ***(0.156) (0.229)
Some College 0.167 0.228 �0.061 �3.601 ***(0.373) (0.420)
Baccalaureate 0.249 0.232 0.017 0.906Degree
(0.433) (0.422)Post Secondary 0.525 0.476 0.049 2.265 *
(0.500) (0.500)Certification—at 0.600 0.570 0.030 1.388
least one: (0.490) (0.495)CFRE, ACFRE, FAHP, Other
Year1 0.270 0.261 0.009 0.472(0.444) (0.439)
Year2 0.231 0.268 �0.037 �1.989 *(0.422) (0.443)
Year3 0.252 0.234 0.017 0.914(0.434) (0.424)
Year4 0.248 0.237 0.011 0.580(0.432) (0.425)
Table 4. (Continued)
Gender Difference
Males FemalesN � 767 N � 1672 Difference t-stat Significance
nml184_06-435-464.qxd 4/8/08 9:27 PM Page 455
received approximately 36 percent lower salaries than male consul-tants and were given significantly lower bonuses as well.
Other Determinants of Bonus and SalaryThe following is a description of other factors that affect bonus andsalary for fundraising professionals. To simplify our presentation, wediscus only those in our final estimation of the 2SLS process in Table 3and the results that are statistically significant.
Mission of the Nonprofit. We used education as the referencegroup for this set of variables. We found that CDOs in religious non-profits earn approximately 22 percent lower salaries compared toeducation, and deputy directors earn approximately 24 percent less.Health care fundraisers earn approximately the same salaries as theirpeers in education, but health care fundraisers earn significantlyhigher bonuses than their counterparts in education. CDOs in artsand culture nonprofits earn approximately 10 percent less and deputydirectors earn approximately 14 percent less than their educationalcounterparts. Deputy directors, staff, and consultants in other sub-sectors earn substantially less than those in education. CDOs in con-sulting firms earn less than their educational peers, but there are notenough consultants in the deputy directors and staff categories to iso-late an independent effect. Perhaps most surprising is that fundrais-ers in social services do not earn significantly different salaries orbonuses than their counterparts in education.
Population of Base City. After controlling for all other factors, wefound no significant differences in the base salaries of fundraisers inany city size. However, deputy directors in various city sizes werepaid significantly higher bonuses than those living in the smallesttowns (population less than fifty thousand).
Full-Time Status. We find a substantial earnings penalty for thoseworking less than half-time. For example, CDOs who work less thanhalf-time earn approximately 34 percent less than full-time CDOs.While it is somewhat surprising that the pay penalty for those work-ing less than half-time is less than 50 percent, it may be that CDOswho are permitted to work less than half-time are highly productiveor very successful, or both. It may be necessary to pay them a pre-mium relative to the estimated share of salary in order to retain them.The penalties are even larger for staff and consultants. CDOs whowork more than half-time (but less than full time) are paid approxi-mately 14 percent less than full-timers. Staff who work more thanhalf-time are paid substantially higher bonuses.
Hiring Practices. The existence of an employment contract hadno effect for fundraisers’ compensation after holding constant othervariables. Payment of a signing bonus has positive and significanteffect for the base salary of CDOs and approached significance fordeputy directors. Signing bonuses also had a positive and large effecton the bonuses of CDOs and a small but negative effect on thebonuses of consultants. Those CDOs, deputy directors, and staffers
456 ME S C H, RO O N E Y
Nonprofit Management & Leadership DOI: 10.1002/nml
We find asubstantial
earnings penaltyfor those working
less than half-time.
nml184_06-435-464.qxd 4/8/08 9:27 PM Page 456
who were hired through a recruiter experienced a significant bumpup in salaries (12 to 23 percent), and CDOs also experienced a sig-nificant increase in their bonus if they were hired through a recruiter.
Human Capital EffectsWe control for and describe here several human capital effects: age,race, education, certification, and fundraising experience.
Age. Age captures general human capital for experience, which isnot captured in other human capital variables, and tends to have apositive and significant effect on both salary and bonuses for allpositions. Age squared is negative and significant, which suggestsa curvilinear effect (diminishing returns).
Race. Race is generally not significant (either black or other) for anyof the positions.
Education. While having some college or even a B.A. or B.S. did notenhance one’s salary relative to high school graduates (or less),having postsecondary training has a positive effect on the basesalary of CDOs.
Certification. Having one or more fundraising-related certificationdoes not have much of an effect on compensation.
Fundraising experience. Surprisingly, fundraising experience has onlya marginally significant and small effect on the bonuses of CDOs,and that effect is negative while experience squared is positive. Staffexperience is small but positive and significant with respect to basesalary. Tenure with current employer is also somewhat surprisinglyunimportant for both salary and bonus and does not attain statis-tical significance.
Discussion and ConclusionThe focus of our study was to ascertain the critical factors thatdetermine compensation for individuals who are employed asfundraising professionals in nonprofit organizations. In general, ourresults indicate that when we control for organizational character-istics and human capital variables, performance does play a positiveand significant role in determining both salary and bonus, particu-larly for individuals employed as CDOs. We used instrumental vari-ables and simultaneous 2SLS to control for the endogeneitybetween pay and performance. Our instrumental variables providedgood estimates of productivity, which enabled us to estimate theexogenous effects of productivity on compensation, holding con-stant all other variables. Thus, we can be more confident in ourresults that suggest performance has a strong and significant effecton compensation.
Contrary to the conclusions drawn from previous reviews ofthe pay-performance relationship in the for-profit sector (for exam-ple, Barkema and Gomez-Mejia, 1998; Tosi, Werner, Katz, and
DE T E R M I N A N T S O F CO M P E N S AT I O N 457
Nonprofit Management & Leadership DOI: 10.1002/nml
nml184_06-435-464.qxd 4/8/08 9:27 PM Page 457
Gomez-Mejia, 2000), indicating a weak pay-performance correlation,our study found a significant and positive relationship betweenmoney raised and compensation. This finding is especially com-pelling in that the ethical standards for fundraising professionals pre-clude these individuals from being paid on a commission basis.Although we were not able to ascertain whether the fundraising pro-fessionals in our sample were operating under explicit performance-based compensation systems, our results indicate that there appearsto be a pay-performance linkage, suggesting at least implied contractsrewarding performance based on money raised.
Our finding of a significant pay-performance linkage for fundrais-ers employed in nonprofits is somewhat unusual. The theoretical lit-erature suggests that managers and other stakeholders would bereluctant to tie pay to performance for the following reasons: (1) it isdifficult to measure results in nonprofits, (2) managers self-select towork in nonprofits and may be more risk averse in terms of compen-sation, and (3) the trust of donors may be in jeopardy if compensa-tion is perceived as being too high. Empirical research conducted onexecutive pay in nonprofits provides general support for these theo-retical explanations—where managerial pay is more strongly relatedto organizational size than managerial performance (for example,Hallock, 2002a; Oster, 1998; Pink and Leatt, 1991).
There may be several explanations for our findings. First, forfundraisers, where a financial measure of performance relates directlyto job responsibilities, pay and performance are more likely to berelated—unlike most managerial positions in nonprofits, where payand performance have not found much support in the empirical lit-erature. Second, individuals who self-select into fundraising rolesmay behave more like those in the private sector—less risk averse interms of linking their pay to performance. Fundraisers may be act-ing more like workers in the for-profit sector due to the nature oftheir job responsibilities and not sorting in the ways that typicallyhave been found in nonprofits. These findings suggest the impor-tance of examining the roles that individuals play in the nonprofitsector in terms of self-selection.
Our results also indicate a gender-pay gap, even after controllingfor all factors traditionally associated with pay differentials betweenmales and females. Women fundraising professionals who are CDOsearn significantly lower salaries then men, female staff earn signifi-cantly lower bonuses, and consultants earn significantly lower bonusand salary.
Our research is consistent with the most recent survey conductedon nonprofit pay that found (1) compensation differences acrosstypes of nonprofits (fundraising professionals employed in the edu-cation and health areas tend to pay their executives more than othertypes of nonprofits), (2) geographical location does not appear toaffect compensation, and (3) size of the nonprofit does not affectcompensation as much as the gender of employees (GuideStar,
458 ME S C H, RO O N E Y
Nonprofit Management & Leadership DOI: 10.1002/nml
Our study founda significant and
positiverelationship
between moneyraised and
compensation.
nml184_06-435-464.qxd 4/8/08 9:27 PM Page 458
2005). Interestingly, the human capital variables one would expectto be significantly related to compensation did not have much of aneffect. Fundraising experience was only marginally related to com-pensation, and tenure with employer had no effect. Race and educa-tion appear to have little impact as well.
Although the issue of incentive pay for fundraisers is controver-sial, compensation based on money raised is a relevant and timelysubject for those in the fundraising field. Incentive pay plans are stillrelatively rare, but they are becoming more common, especially atlarge nonprofits (Gose, 2002). According to results of an onlineethics and compensation survey sent to members of the AFP, 57 per-cent had reported that they had been asked to consider raising char-itable funds on a commission basis—even though this practice isprohibited under the AFP Code of Ethical Principles and Standardsof Professional Practice (Sczudlo, 2003). Furthermore, reports in thephilanthropic and nonprofit field give account of organizations thatuse incentive pay to retain top fundraisers on the job (for example,Gose, 2002). Our study suggests that the pay-performance relation-ship is present, even though it may not be made explicit in compen-sation policy. Future research should attempt to quantify whether thelack of a performance-based system depresses fundraising and focuson issues of efficiency rather than solely on the ethical concerns—particularly as pay-for-performance systems are beginning to beadopted in more nonprofits.
Finally, it is important to understand that “fundraising does nottake place in a vacuum; it is one of the central elements of a largersystem of philanthropy” and is misunderstood if reduced to simplythe act of raising money (Payton, Russo, and Tempel, 1991, p. 4).Fundraisers rely on the mission of the nonprofit in justifying theirfundraising role and hold themselves accountable to the publicthrough ethical fundraising practices tied to the mission of the orga-nization. As such, “fundraising is a moral action . . . that engagesfund raisers in the lives of other people for their benefit or for somelarger public benefit as well as for the benefit of the fund raisersthemselves” (Payton, Russo, and Tempel, 1991, p. 9). Future researchexamining the pay-performance relationship for fundraisers needs tokeep in mind the context in which this occurs.
Notes1. For variables that are logged, we use the elasticities directly from the tables to
facilitate interpretation by the readers. In a log-log or log-level regression model, theestimates of the regression coefficients can provide an approximation of the per-centage change of the dependent variable. This approximation is quite accurate if theregression coefficient is small, but if the coefficient is large, the approximation canbecome increasingly inaccurate. This approximation in our results varies from thetrue estimate by less than one percentage point in nearly all cases (except a coupleof cases with very large percentage changes) and would not involve a change in eithersign or level or significance.
DE T E R M I N A N T S O F CO M P E N S AT I O N 459
Nonprofit Management & Leadership DOI: 10.1002/nml
nml184_06-435-464.qxd 4/8/08 9:27 PM Page 459
DEBRA J. MESCH is an associate professor of public and nonprofit man-agement and philanthropic studies in the School of Public and Environ-mental Affairs at Indiana University–Purdue University, Indianapolis.
PATRICK M. ROONEY is professor of economics and philanthropic studiesat Indiana University–Purdue University, Indianapolis, and director ofresearch at the Center on Philanthropy at Indiana University.
References
Alvardo, E. I. “The Validity of Supplementary Pay Systems in NonprofitOrganizations.” Nonprofit Management and Leadership, 1996, 6,291–304.
Bailey, S. B., and Risher, H. “Not-for-Profits Try Out New Compen-sation Plans.” Compensation and Benefits Review, 1996, 47–57.
Ballou, J. P., and Weisbrod, B. A. “Managerial Rewards and the Behav-ior of For-Profit, Governmental, and Nonprofit Organizations: Evi-dence from the Hospital Industry.” Journal of Public Economics,2003, 87, 1895–1920.
Barkema, H. G., and Gomez-Mejiz, L. R. “Managerial Compensationand Firm Performance: A General Research Framework.” Academyof Management Journal, 1998, 47, 135–145.
Bertrand, M., and Hallock, K. F. “The Gender Gap in Top CorporateJobs.” Industrial and Labor Relations Review, 2001, 55, 3–21.
Blau, F. D. “Trends in the Well-Being of American Women,1970–1995.” Journal of Economic Literature, 1998, 36, 112–165.
Blau, F., and Ferber, M. The Economics of Women, Men and Work. (2nded.) Upper Saddle River, N.J.: Prentice Hall, 1992.
Blau, F., Ferber, M., and Winkler. The Economics of Women, Men andWork. (3rd ed.) Upper Saddle River, N.J.: Prentice Hall, 1998.
Brickley, J. S., and Van Horn, R. L. “Managerial Incentives in Non-profit Organizations: Evidence from Hospitals.” Journal of Law andEconomics, 2002, 45, 227–249.
Carroll, T., Hughes, P., and Luksetich, W. “Managers of NonprofitOrganizations Are Rewarded for Performance.” Nonprofit Manage-ment and Leadership, 2005, 16, 19–41.
Chauvin, K. W., and Ash, R. A. “Gender Earnings Differentials inTotal Pay, Base Pay, and Contingent Pay.” Industrial and Labor Rela-tions Review, 1994, 47, 634–649.
Conry, J. C. “The Feminization of Fund Raising.” In D. F. Burlingameand L. J. Hulse (eds.), Taking Fund Raising Seriously. San Francisco:Jossey-Bass, 1991.
Conry, J. C. “Gender and Pay Equity in the Fundraising Workforce:Implications for Practice and Policy.” New Directions for PhilanthropicFundraising, 1998, 19, 73–91.
Deckop, J. R., and Cirka, C. C. “The Risk and Reward of a Double-Edged Sword: Effects of a Merit Pay Program on Intrinsic Motiva-tion.” Nonprofit and Voluntary Sector Quarterly, 2000, 29, 400–418.
460 ME S C H, RO O N E Y
Nonprofit Management & Leadership DOI: 10.1002/nml
nml184_06-435-464.qxd 4/8/08 9:27 PM Page 460
Duronio, M. A., and Loessin, B. A. “Effective Business Practices inFund Raising.” In D. F. Burlingame and L. J. Hulse (eds.), TakingFund Raising Seriously. San Francisco: Jossey-Bass, 1991.
Frank, R. H. “What Price the Moral High Ground?” Southern EconomicJournal, 1996, 63, 1–17.
Gerhart, B. “Gender Differences in Current and Starting Salaries: TheRole of Performance, College Major, and Job Title.” Industrial andLabor Relations Review, 1990, 43, 418–443.
Gibelman, M. “The Nonprofit Sector and Gender Discrimination:A Preliminary Investigation into the Glass Ceiling.” NonprofitManagement and Leadership, 2000, 10, 251–269.
Gomez-Mejia, L. G. “Executive Compensation: A Reassessment anda Future Research Agenda.” In G. Ferris (ed.), Research in Person-nel and Human Resources Management. Greenwich, Conn.: JAIPress, 1994.
Gose, B. “Incentive Pay Helps Keep Some Top Fund Raisers on theJob.” Chronicle of Philanthropy, Dec. 4, 2002. Retrieved Aug. 9, 2005,from http://www.philanthropy.com/jobs/2002/12/12/20021212-356099.htm.
Gray, S. R., and Benson, P. G. “Determinants of Executive Compensa-tion in Small Business Development Centers.” Nonprofit Managementand Leadership, 2003, 13(3), 213–227.
Groshen, E. L. “The Structure of the Female/Male Wage Differential:Is It Who You Are, What You Do, or Where You Work?” Journal ofHuman Resources, 1991, 26, 457–472.
GuideStar. “Gender, Geography, and Nonprofit Compensation.”Williamsburg, Va.: Philanthropic Research, Oct. 2005.
Hallock, K. “Compensation in Nonprofit Organizations.” Research inPersonnel and Human Resource Management, 2000, 19, 243–294.
Hallock, K. F. “Managerial Pay and Governance in American Non-profits.” Industrial Relations, 2002a, 41, 377–406.
Hallock, K. R. “The Gender Pay and Employment Gaps for Top Man-agers in U.S. Nonprofits.” Working paper, University of Illinois,2002b.
Handy, F., and Katz, E. “The Wage Differential Between Nonprofit Insti-tutions and Corporations: Getting More by Paying Less?” Journal ofComparative Economics, 1998, 26, 246–261.
Hansmann, H. “The Role of Nonprofit Enterprise.” Yale Law Journal,1980, 89, 835–901.
Harris, M. M., Gilbreath, B., and Sunday, J. A. “Why Are Women PaidLess Than Men, But Given Higher Raises?” Journal of Business andPsychology, 2002, 16, 499–514.
Harrison, B. J. “Is Percentage-Based Compensation Unethical?” FundRaising Management, Dec. 1995, pp. 26–29.
Johnston, D., and Rudney, G. “Characteristics of Workers inNonprofit Organizations.” Monthly Labor Review, July 1987,pp. 28–33.
Knoke, D. “Associations and Interest Groups.” Annual Review of Soci-ology, 1986, 12, 1–21.
DE T E R M I N A N T S O F CO M P E N S AT I O N 461
Nonprofit Management & Leadership DOI: 10.1002/nml
nml184_06-435-464.qxd 4/8/08 9:27 PM Page 461
Leete, L. “Whither the Nonprofit Wage Differential? Estimates fromthe 1990 Census.” Journal of Labor Economics, 2001, 19, 136–170.
Lewin, T. “Women Profit Less Than Men in the Nonprofit World,Too.” New York Times, June 3, 2001, p. 26.
Lipman, H. “Charities Pay Women Less Than Men, Study Finds.”Chronicle of Philanthropy, July 25, 2002. Retrieved Aug. 17, 2002, fromhttp://philanthropy.com/premium/articles/v14/i19/19004001.htm.
Mohan, N., and Ruggiero, J. “Compensation Differences Between Maleand Female CEOs for Publicly Traded Firms: A Nonparametric Analy-sis.” Journal of the Operational Research Society, 2003, 54, 1242–1248.
Oster, S. M. “Executive Compensation in the Nonprofit Sector.” Non-profit Management and Leadership, 1998, 8, 207–221.
Payton, R. L., Russo, H. A., and Tempel, E. R. “Toward a Philosophyof Fund Raising.” In D. F. Burlingame and L. J. Hulse (eds.), Tak-ing Fund Raising Seriously. San Francisco: Jossey-Bass, 1991.
Pink, G. H., and, Leatt, P. “Are Managers Compensated for HospitalFinancial Performance?” Health Care Management Review, 1991, 16,37–45.
Preston, A. E. “The Nonprofit Worker in a For-Profit World.” Jour-nal of Labor Economics, 1989, 7, 438–463.
Preston, A. E. “Compensation in Nonprofit Organizations.” In D. R.Young (ed.), Effective Economic Decision Making in Nonprofit Orga-nizations. New York: Foundation Center, 2004.
Renner, C., Rives, J. M., and Bowlin, W. F. “The Significance of Gen-der in Explaining Senior Executive Pay Variations: An ExploratoryStudy.” Journal of Managerial Issues, 2002, 14, 331–345.
Rocco, J. E. “Making Incentive Compensation Plans Work in Non-profit Organizations.” Nonprofit World, 1991, 9, 13–15.
Rocco, J. E. “Latest Trends in Nonprofit Compensation: How toAttract the Brightest People.” Nonprofit World, 1992, 10, 20–22.
Roomkin, M. J., and Weisbrod, B. S. “Managerial Compensation andIncentives in For-Profit and Nonprofit Hospitals.” Journal of Law,Economics and Organization, 1999, 15, 750–781.
Rose, S. J., and Hartmann, H. I. “Still a Man’s Labor Market: TheLong-Term Earnings Gap.” Washington, D.C.: Institute forWomen’s Policy Research, 2004.
Ruhm, C. J., and Borkoski, C. “Compensation in the Nonprofit Sec-tor.” Journal of Human Resources, 2003, 38, 992–1021.
Schwinn, E., and Wilhelm, I. “Nonprofit CEOs See Salaries Rise: PayRaises Beat Inflation Rate Despite Economic Squeeze.” Chronicle ofPhilanthropy, Oct. 2, 2003. Retrieved Aug. 9, 2005, from http://www.philanthropy.com/free/articles/v15/i24/24002701.htm.
Sczudlo, W. “Motivation: Mission or Money?” Advancing Philanthropy,Sept.–Oct. 2003, pp. 30–32.
Steinberg, R. “Profits and Incentive Compensation in NonprofitFirms.” Nonprofit Management and Leadership, 1990, 1, 137–151.
Steinberg, R., and Jacobs, J. A. “Pay Equity in Nonprofit Organiza-tions: Making Women Work Visible.” In T. Odendahl and
462 ME S C H, RO O N E Y
Nonprofit Management & Leadership DOI: 10.1002/nml
nml184_06-435-464.qxd 4/8/08 9:27 PM Page 462
M. O’Neill (eds.), Women and Power in the Nonprofit Sector. SanFrancisco: Jossey-Bass, 1994.
Tifft, S. E. “Asking for a Fortune.” Working Woman, Nov. 1992,pp. 66–94.
Tosi, H. L., Werner, S., Katz, J. P., and Gomez-Mejia, L. R. “HowMuch Does Performance Matter? A Meta-Analysis of CEO PayStudies.” Journal of Management, 2000, 26, 301–339.
Tschirhart, M. “Nonprofit Membership Associations.” In W. W. Powelland R. Steinberg (eds.), The Nonprofit Sector: A Research Handbook.(2nd ed.) New Haven, Conn.: Yale University Press, 2006.
Weichselbaumer, D. “Is It Sex or Personality? The Impact of SexStereotypes on Discrimination in Applicant Selection.” Eastern Eco-nomic Journal, 2004, 30, 159–186.
Weisbrod, B. A. “Nonprofit and Proprietary Sector Behavior: WageDifferential Among Lawyers.” Journal of Labor Economics, 1983, 1,246–263.
Weisbrod, B. “Toward a Theory of the Voluntary Nonprofit Sector ina Three Sector Economy.” In S. Rose-Ackerman (ed.), The Eco-nomics of Nonprofit Institutions: Studies in Structure and Policy. NewYork: Oxford University Press, 1986.
Weisbrod, B. A. The Nonprofit Economy. Cambridge, Mass.: HarvardUniversity Press, 1988.
Werner, S., Konopaske, R., and Gemeinhardt, G. “The Effects ofUnited Way Membership on Employee Pay in Nonprofit Organi-zations.” Nonprofit Management and Leadership, 2000, 11, 35–48.
Williams, S. “Gender Inequities Persist in CEO Compensation.” Asso-ciation Management, 2003, 55, 22.
Wood, R. G., Corcoran, M. E., and Courant, P. N. “Pay DifferencesAmong the Highly Paid: The Male-Female Earnings Gap inLawyers’ Salaries.” Journal of Labor Economics, 1993, 11, 417–441.
Ye, M., and Manzo, P. B. “Gender Compensation Disparity AmongExecutives: Examining California Nonprofits.” Paper presented atthe ARNOVA Conference, Los Angeles, Nov. 2004.
Young, D., and Steinberg, R. Economics for Nonprofit Managers. NewYork: Foundation Center, 1995.
DE T E R M I N A N T S O F CO M P E N S AT I O N 463
Nonprofit Management & Leadership DOI: 10.1002/nml
nml184_06-435-464.qxd 4/8/08 9:27 PM Page 463

nml184_06-435-464.qxd 4/8/08 9:27 PM Page 464