Embed Size (px)
Citation preview
Determinants of child poverty and policy responses in the European Union
András GábosTÁRKI Social Research Institute
8th ESPAnet Conference 2010
Social Policy and the Global Crisis: Consequences and ResponsesStream 2 Poverty and Social Exclusion
Budapest, 2-4 September 2010

The „Study on child poverty” project
Commissioned by: DG Employment of the European Commission, Unit E2
Consortium: Tárki Social Research Institute, Budapest Applica sprl, Brussels
Steering Committee:
Terry Ward (chair) ApplicaMichael F. Förster OECDHugh Frazer National Univ. of IrelandPetra Hoelscher UNICEFEric Marlier CEPS/INSTEADHolly Sutherland University of EssexIstván György Tóth TÁRKI
Tasks within the project
Task 1. „An in-depth empirical analysis of child poverty and the related key challenges for each Member State, starting from the analytical framework developed up by the EU Task-Force report.”
Task 2. „An assessment of the effectiveness of policies for combating child poverty and promoting social inclusion among children and the identification of policy mixes that seem to be most effective in tackling the specific factors underlying child poverty.”
Task 3. Recommendations for a limited set of child well-being indicators
Aim and methodology
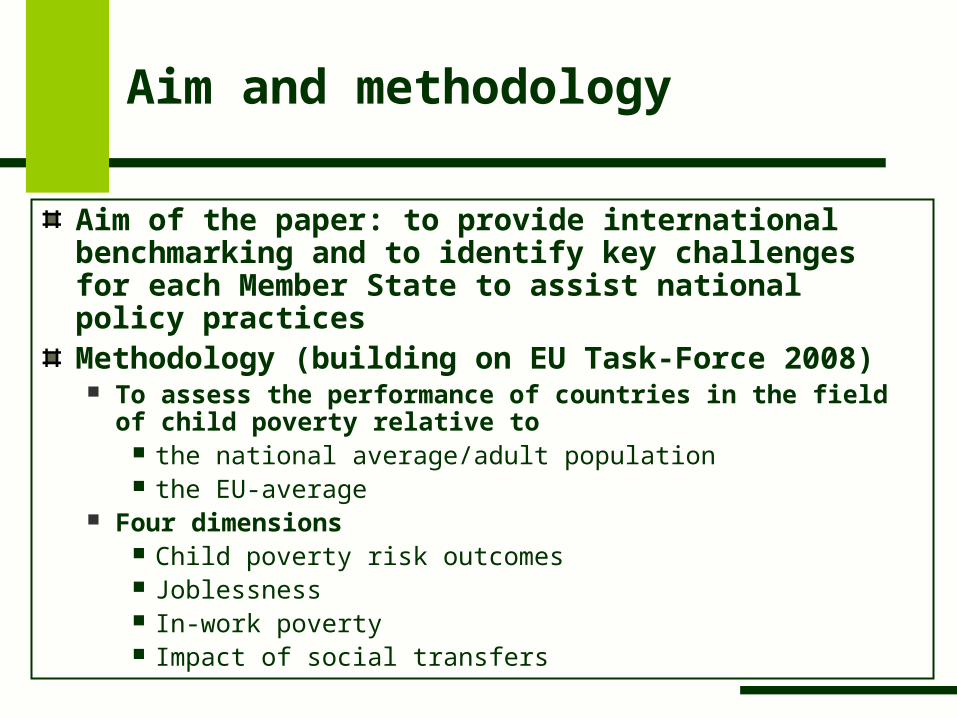
Aim of the paper: to provide international benchmarking and to identify key challenges for each Member State to assist national policy practicesMethodology (building on EU Task-Force 2008) To assess the performance of countries in the field of child
poverty relative to the national average/adult population the EU-average
Four dimensions Child poverty risk outcomes Joblessness In-work poverty Impact of social transfers
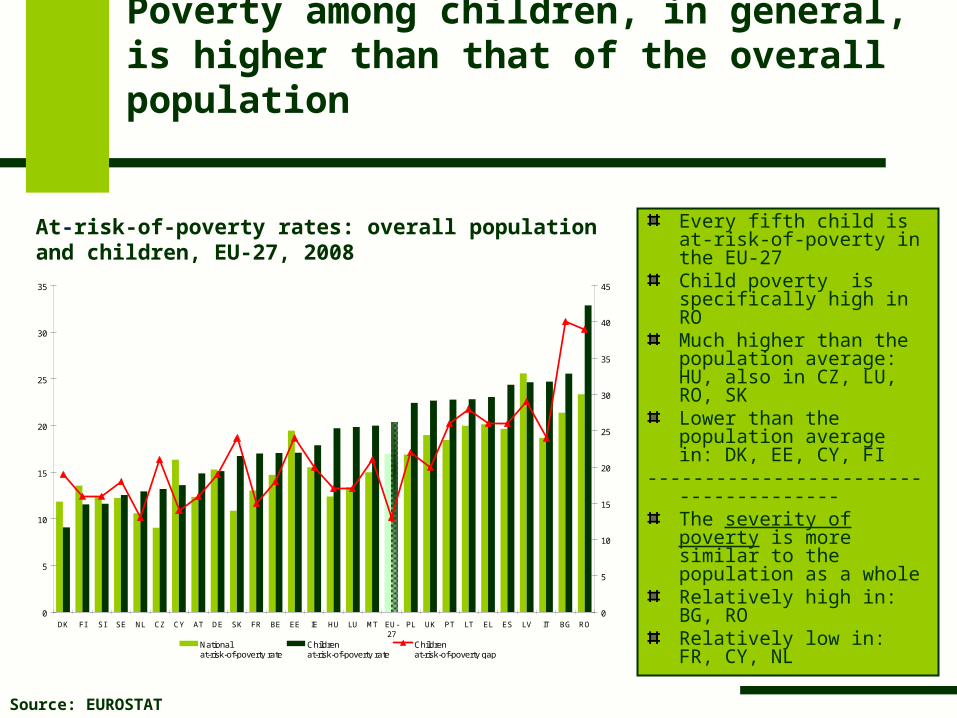
Poverty among children, in general, is higher than that of the overall population
Every fifth child is at-risk-of-poverty in the EU-27Child poverty is specifically high in ROMuch higher than the population average: HU, also in CZ, LU, RO, SKLower than the population average in: DK, EE, CY, FI
--------------------------------------The severity of poverty is more similar to the population as a wholeRelatively high in: BG, RORelatively low in: FR, CY, NL
At-risk-of-poverty rates: overall population and children, EU-27, 2008
Source: EUROSTAT
0
5
10
15
20
25
30
35
DK FI SI SE NL CZ CY AT DE SK FR BE EE IE HU LU MT EU-27
PL UK PT LT EL ES LV IT BG RO0
5
10
15
20
25
30
35
40
45
National at-risk-of-poverty rate
Children at-risk-of-poverty rate
Children at-risk-of-poverty gap
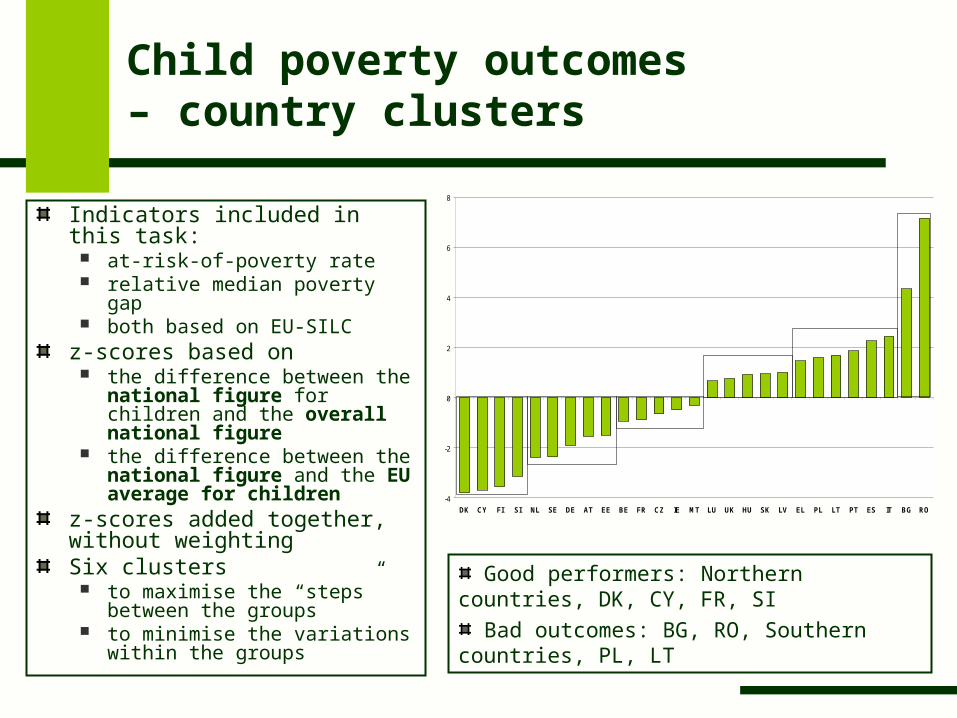
Child poverty outcomes – country clusters
Indicators included in this task: at-risk-of-poverty rate relative median poverty gap both based on EU-SILC
z-scores based on the difference between the
national figure for children and the overall national figure
the difference between the national figure and the EU average for children
z-scores added together, without weightingSix clusters
to maximise the “steps” between the groups
to minimise the variations within the groups
Good performers: Northern countries, DK, CY, FR, SI
Bad outcomes: BG, RO, Southern countries, PL, LT
-4
-2
0
2
4
6
8
DK CY FI SI NL SE DE AT EE BE FR CZ IE MT LU UK HU SK LV EL PL LT PT ES IT BG RO
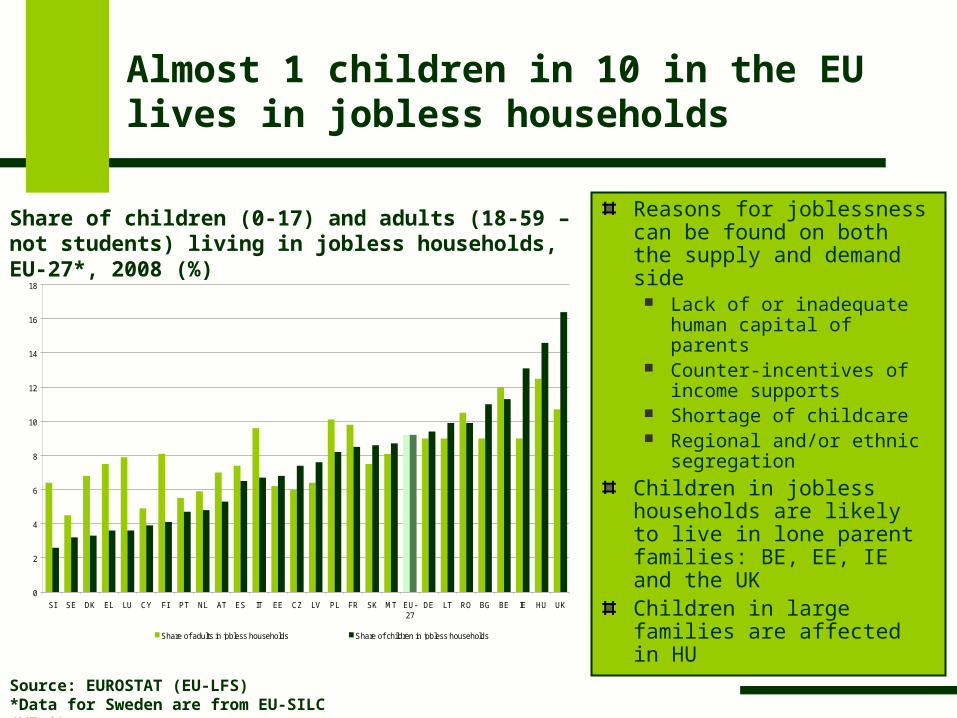
Almost 1 children in 10 in the EU lives in jobless households
Reasons for joblessness can be found on both the supply and demand side
Lack of or inadequate human capital of parents
Counter-incentives of income supports
Shortage of childcare Regional and/or ethnic
segregation
Children in jobless households are likely to live in lone parent families: BE, EE, IE and the UKChildren in large families are affected in HU
Share of children (0-17) and adults (18-59 – not students) living in jobless households, EU-27*, 2008 (%)
Source: EUROSTAT (EU-LFS)*Data for Sweden are from EU-SILC (WI=0)
0
2
4
6
8
10
12
14
16
18
SI SE DK EL LU CY FI PT NL AT ES IT EE CZ LV PL FR SK MT EU-27
DE LT RO BG BE IE HU UK
Share of adults in jobless households Share of children in jobless households
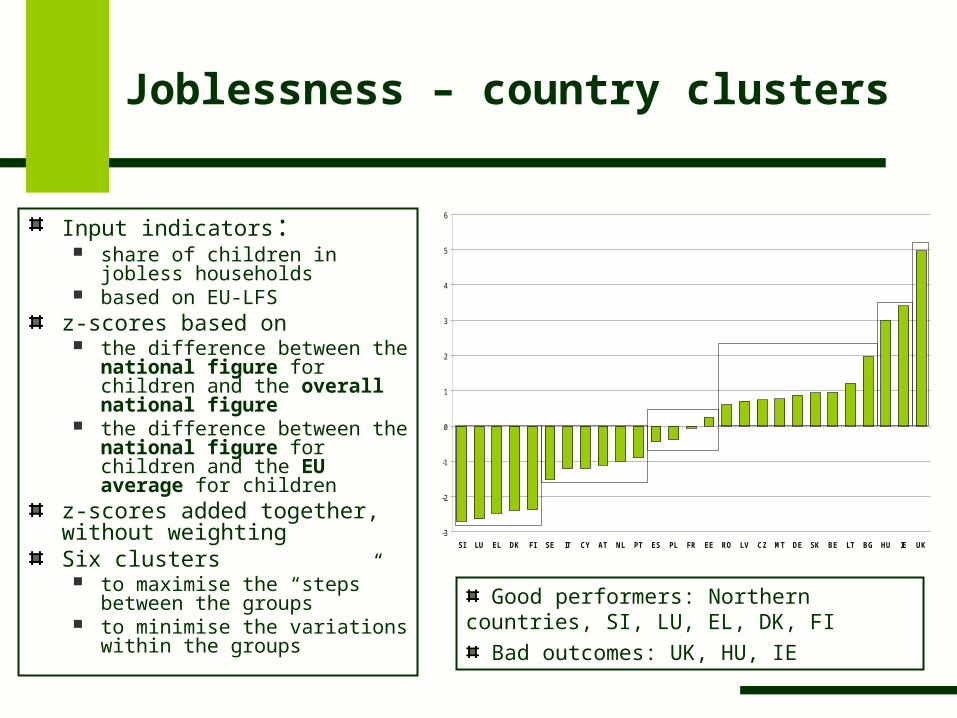
Joblessness – country clusters
Input indicators: share of children in jobless
households based on EU-LFS
z-scores based on the difference between the
national figure for children and the overall national figure
the difference between the national figure for children and the EU average for children
z-scores added together, without weightingSix clusters
to maximise the “steps” between the groups
to minimise the variations within the groups
Good performers: Northern countries, SI, LU, EL, DK, FI
Bad outcomes: UK, HU, IE
-3
-2
-1
0
1
2
3
4
5
6
SI LU EL DK FI SE IT CY AT NL PT ES PL FR EE RO LV CZ MT DE SK BE LT BG HU IE UK
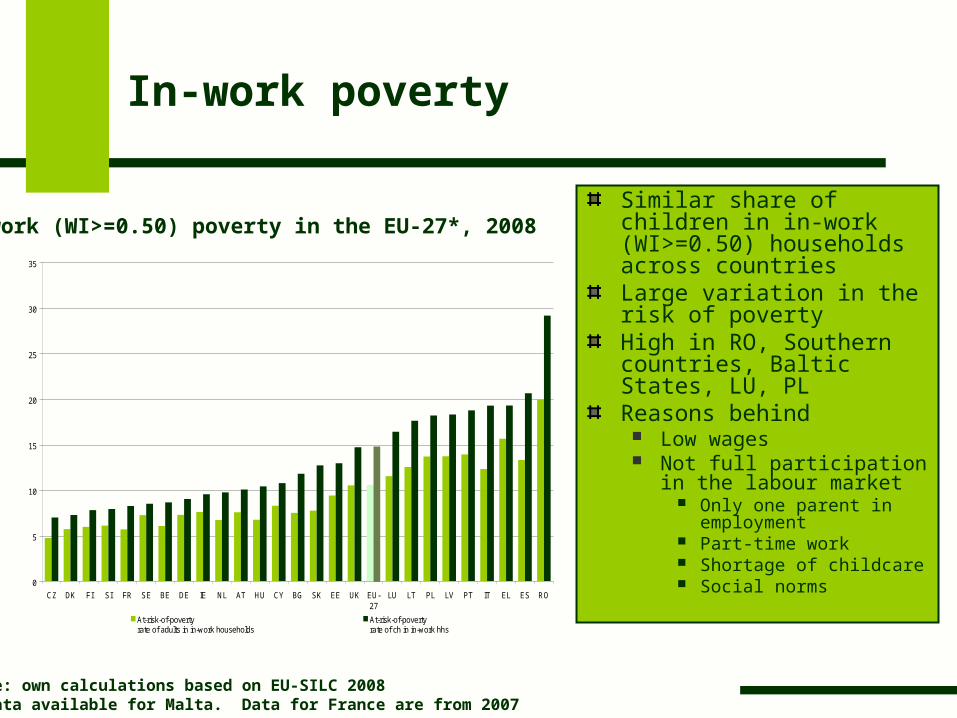
In-work poverty
Similar share of children in in-work (WI>=0.50) households across countriesLarge variation in the risk of povertyHigh in RO, Southern countries, Baltic States, LU, PLReasons behind
Low wages Not full participation in the
labour market Only one parent in
employment Part-time work Shortage of childcare Social norms
Source: own calculations based on EU-SILC 2008*No data available for Malta. Data for France are from 2007
In-work (WI>=0.50) poverty in the EU-27*, 2008
0
5
10
15
20
25
30
35
CZ DK FI SI FR SE BE DE IE NL AT HU CY BG SK EE UK EU-27
LU LT PL LV PT IT EL ES RO
At-risk-of-poverty rate of adults in in-work households
At-risk-of-poverty rate of ch in in-work hhs
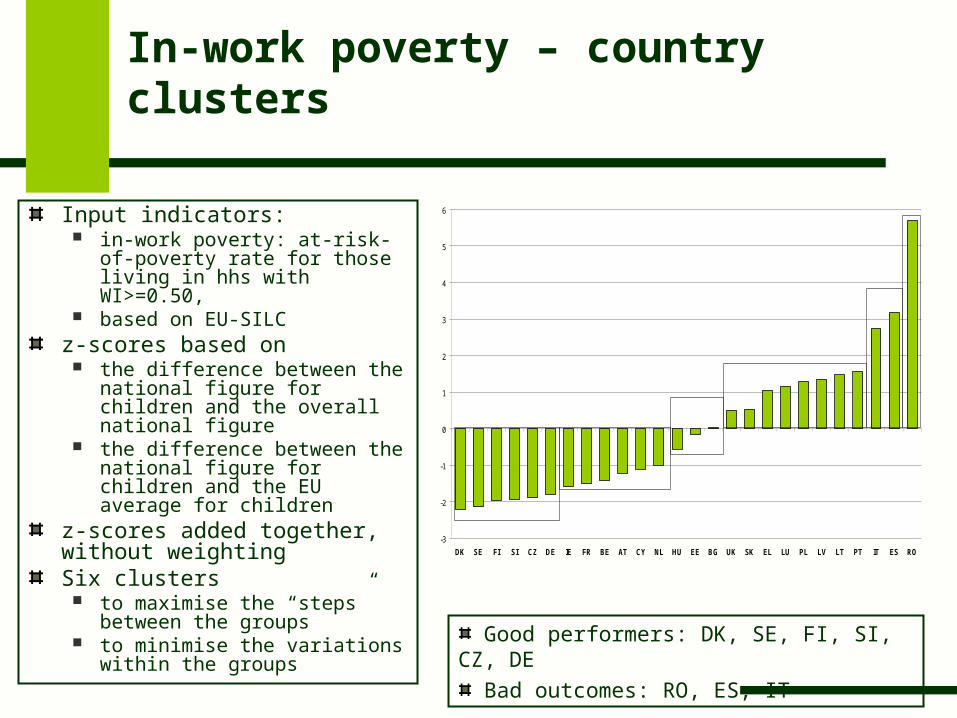
In-work poverty – country clusters
Input indicators: in-work poverty: at-risk-of-
poverty rate for those living in hhs with WI>=0.50,
based on EU-SILCz-scores based on
the difference between the national figure for children and the overall national figure
the difference between the national figure for children and the EU average for children
z-scores added together, without weightingSix clusters
to maximise the “steps” between the groups
to minimise the variations within the groups Good performers: DK, SE, FI, SI, CZ, DE
Bad outcomes: RO, ES, IT
-3
-2
-1
0
1
2
3
4
5
6
DK SE FI SI CZ DE IE FR BE AT CY NL HU EE BG UK SK EL LU PL LV LT PT IT ES RO
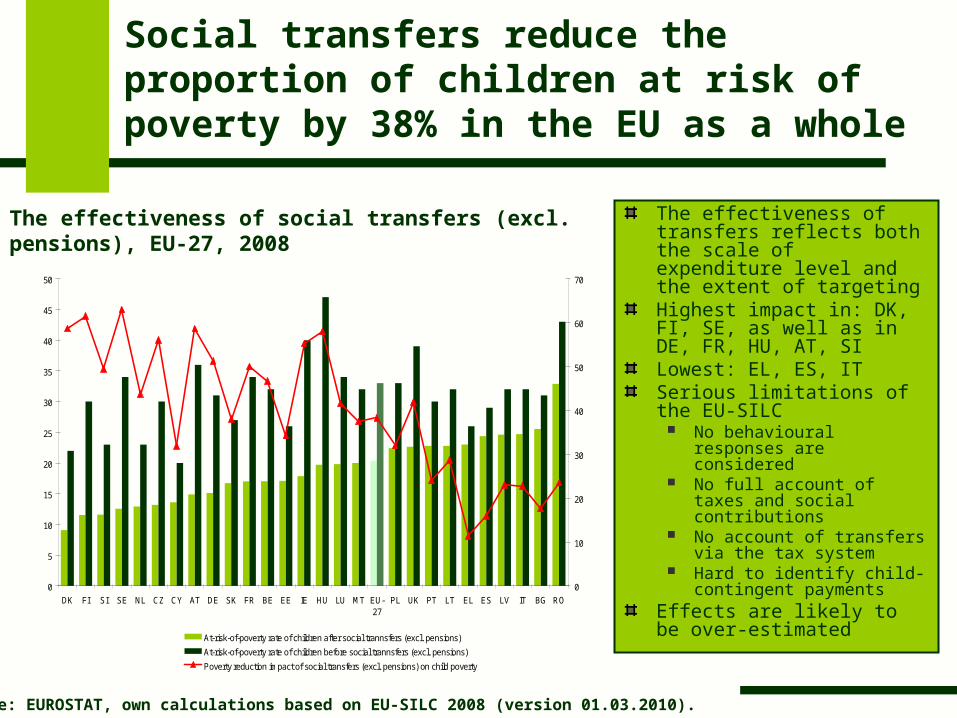
Social transfers reduce the proportion of children at risk of poverty by 38% in the EU as a whole
The effectiveness of transfers reflects both the scale of expenditure level and the extent of targetingHighest impact in: DK, FI, SE, as well as in DE, FR, HU, AT, SILowest: EL, ES, ITSerious limitations of the EU-SILC
No behavioural responses are considered
No full account of taxes and social contributions
No account of transfers via the tax system
Hard to identify child-contingent payments
Effects are likely to be over-estimated
Source: EUROSTAT, own calculations based on EU-SILC 2008 (version 01.03.2010).
The effectiveness of social transfers (excl. pensions), EU-27, 2008
0
5
10
15
20
25
30
35
40
45
50
DK FI SI SE NL CZ CY AT DE SK FR BE EE IE HU LU MT EU-27
PL UK PT LT EL ES LV IT BG RO
0
10
20
30
40
50
60
70
At-risk-of-poverty rate of children after social trannsfers (excl. pensions)
At-risk-of-poverty rate of children before social trannsfers (excl. pensions)
Poverty reduction impact of social transfers (excl. pensions) on child poverty
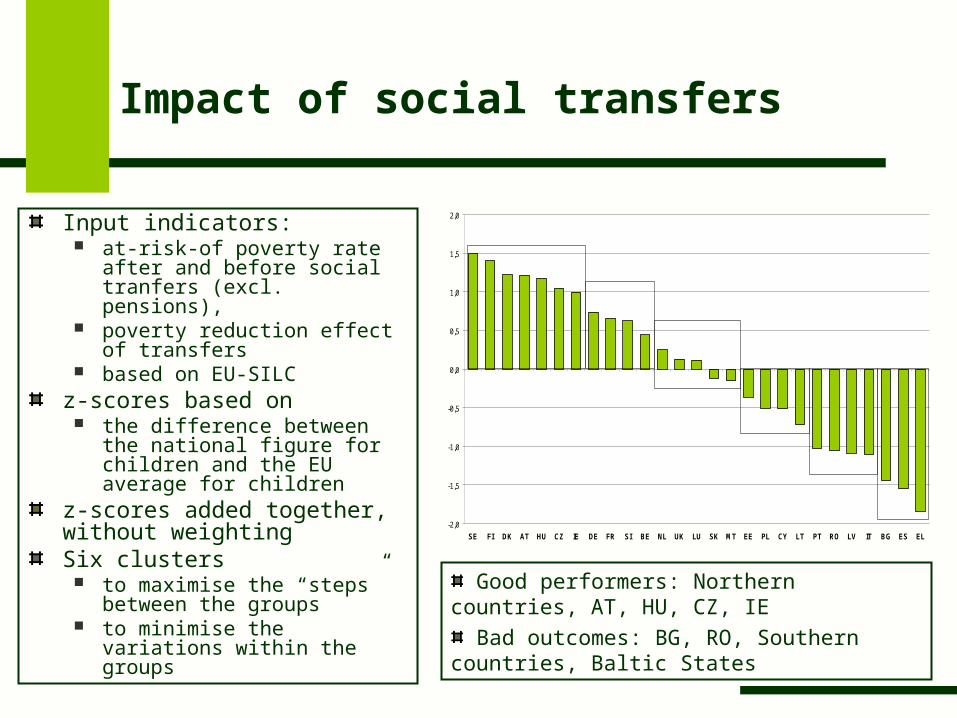
Impact of social transfers
Input indicators: at-risk-of poverty rate after and
before social tranfers (excl. pensions),
poverty reduction effect of transfers
based on EU-SILCz-scores based on
the difference between the national figure for children and the EU average for children
z-scores added together, without weightingSix clusters
to maximise the “steps” between the groups
to minimise the variations within the groups
Good performers: Northern countries, AT, HU, CZ, IE
Bad outcomes: BG, RO, Southern countries, Baltic States
-2,0
-1,5
-1,0
-0,5
0,0
0,5
1,0
1,5
2,0
SE FI DK AT HU CZ IE DE FR SI BE NL UK LU SK MT EE PL CY LT PT RO LV IT BG ES EL
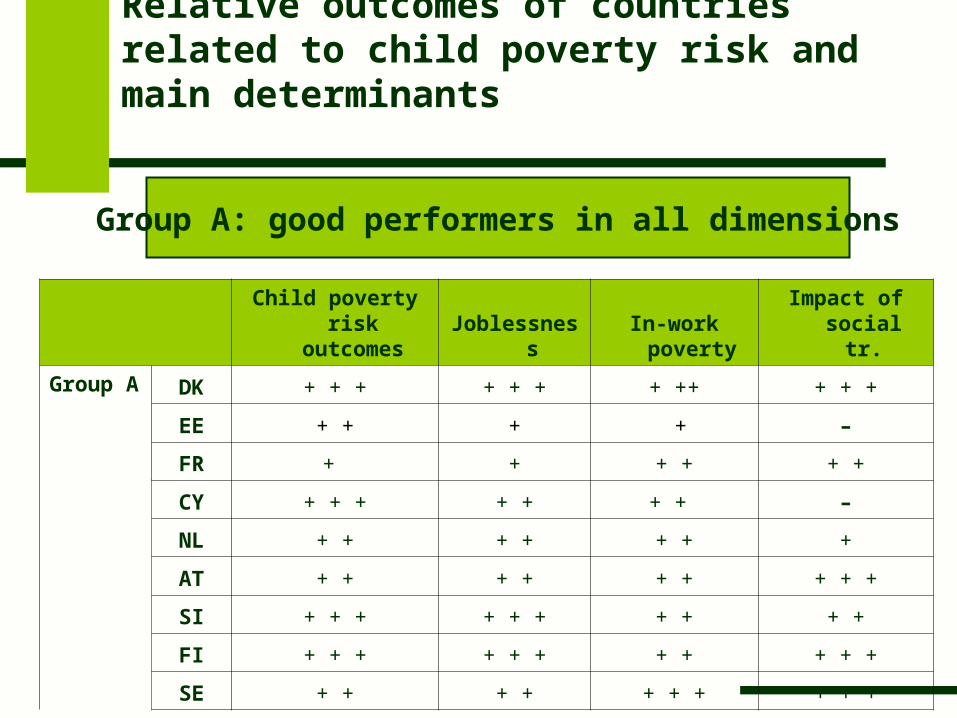
Relative outcomes of countries related to child poverty risk and main determinants
Group A: good performers in all dimensions
Child poverty risk outcomes Joblessness
In-work poverty
Impact of social tr.
Group A DK + + + + + + + ++ + + +
EE + + + + –
FR + + + + + +
CY + + + + + + + –
NL + + + + + + +
AT + + + + + + + + +
SI + + + + + + + + + +
FI + + + + + + + + + + +
SE + + + + + + + + + +
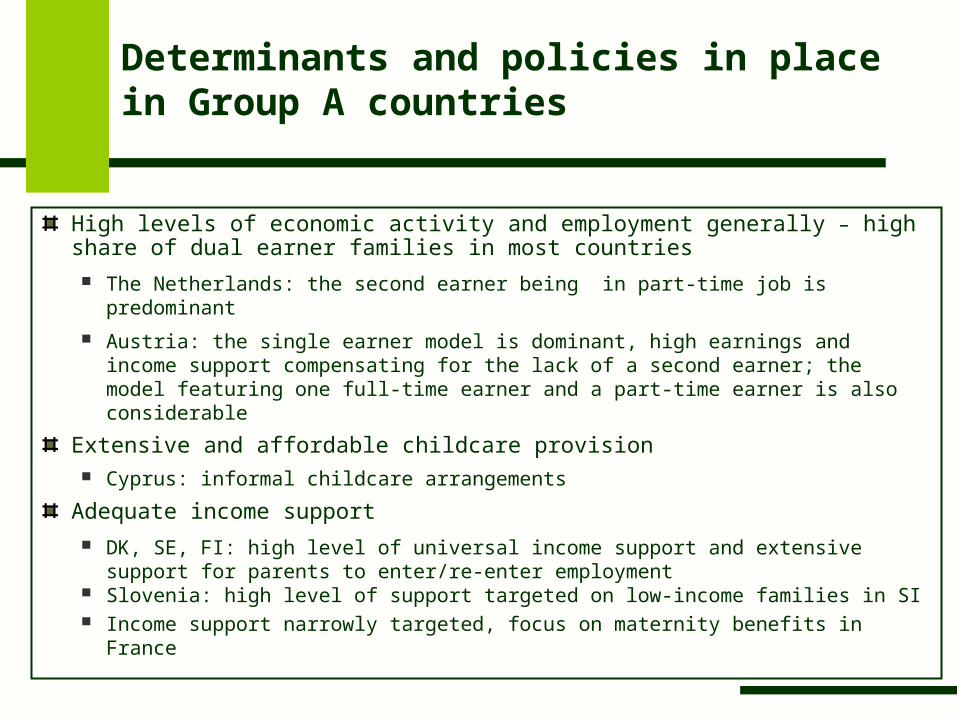
Determinants and policies in place in Group A countries
High levels of economic activity and employment generally – high share of dual earner families in most countries
The Netherlands: the second earner being in part-time job is predominant
Austria: the single earner model is dominant, high earnings and income support compensating for the lack of a second earner; the model featuring one full-time earner and a part-time earner is also considerable
Extensive and affordable childcare provision Cyprus: informal childcare arrangements
Adequate income support
DK, SE, FI: high level of universal income support and extensive support for parents to enter/re-enter employment
Slovenia: high level of support targeted on low-income families in SI Income support narrowly targeted, focus on maternity benefits in France
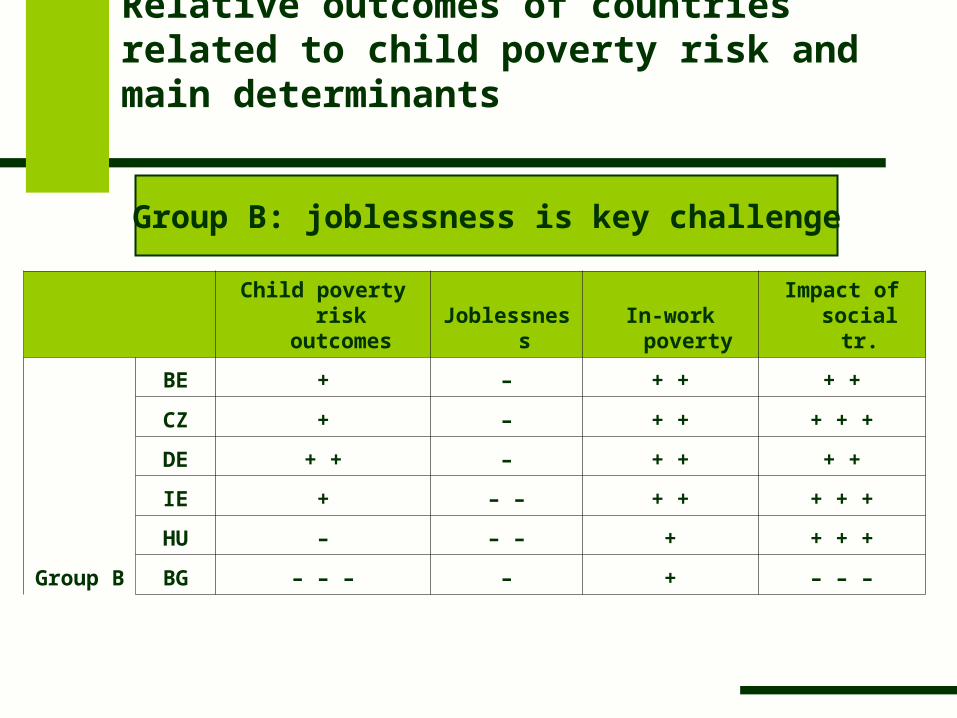
Relative outcomes of countries related to child poverty risk and main determinants
Child poverty risk
outcomes JoblessnessIn-work
povertyImpact of
social tr.
Group B
BE + – + + + +
CZ + – + + + + +
DE + + – + + + +
IE + – – + + + + +
HU – – – + + + +
BG – – – – + – – –
Group B: joblessness is key challenge
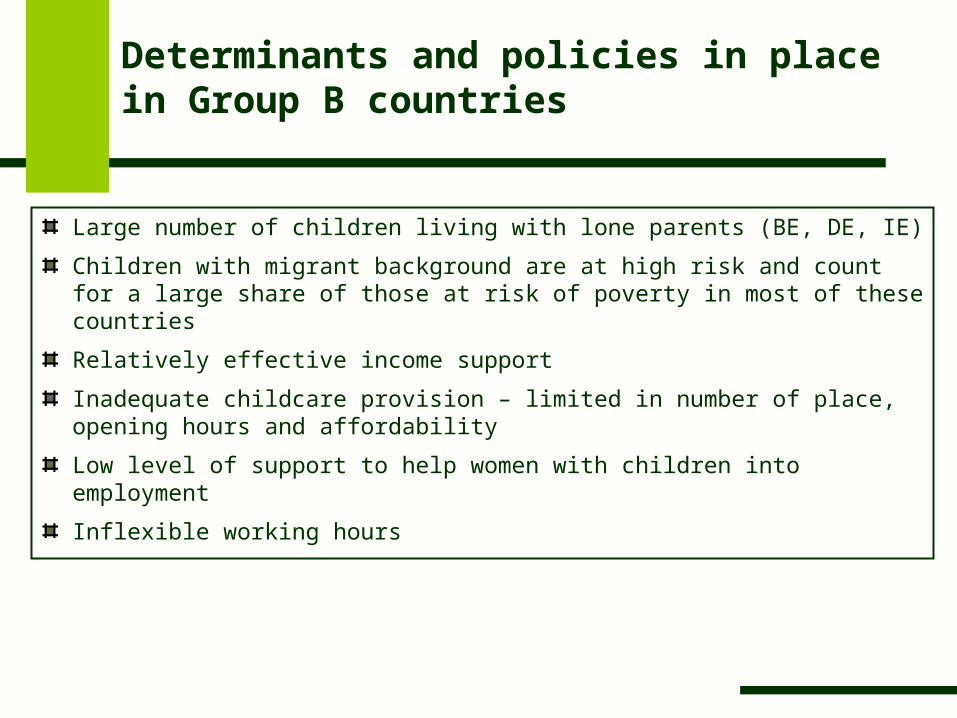
Determinants and policies in place in Group B countries
Large number of children living with lone parents (BE, DE, IE)
Children with migrant background are at high risk and count for a large share of those at risk of poverty in most of these countries
Relatively effective income support
Inadequate childcare provision – limited in number of place, opening hours and affordability
Low level of support to help women with children into employment
Inflexible working hours
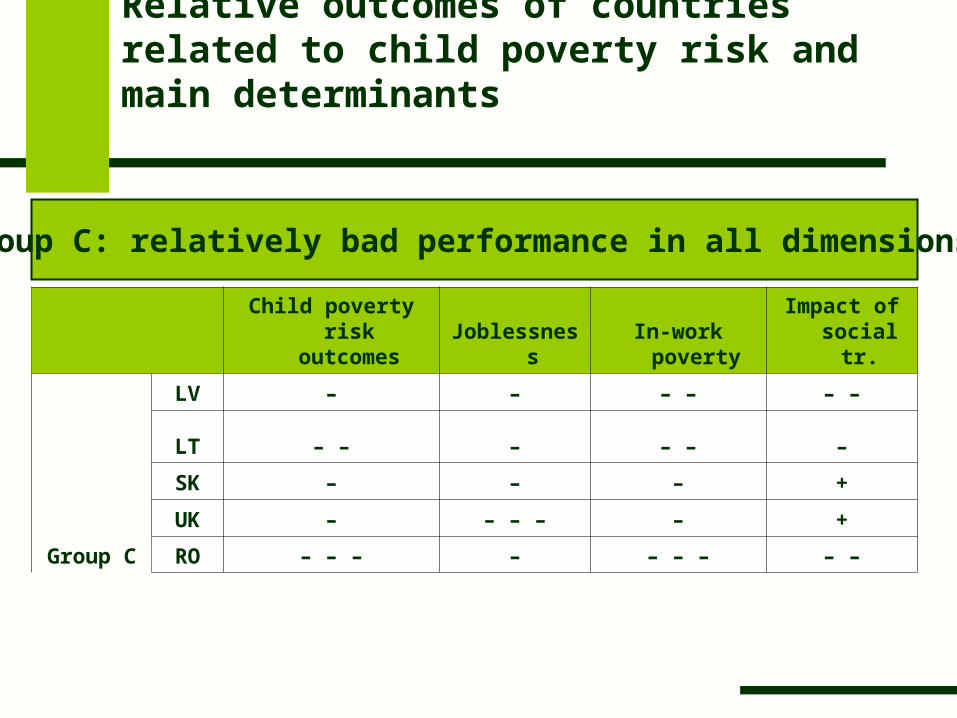
Relative outcomes of countries related to child poverty risk and main determinants
Child poverty risk outcomes Joblessness
In-work poverty
Impact of social tr.
Group C
LV – – – – – –
LT – – – – – –
SK – – – +
UK – – – – – +
RO – – – – – – – – –
Group C: relatively bad performance in all dimensions
Determinants and policies in place in Group C countries
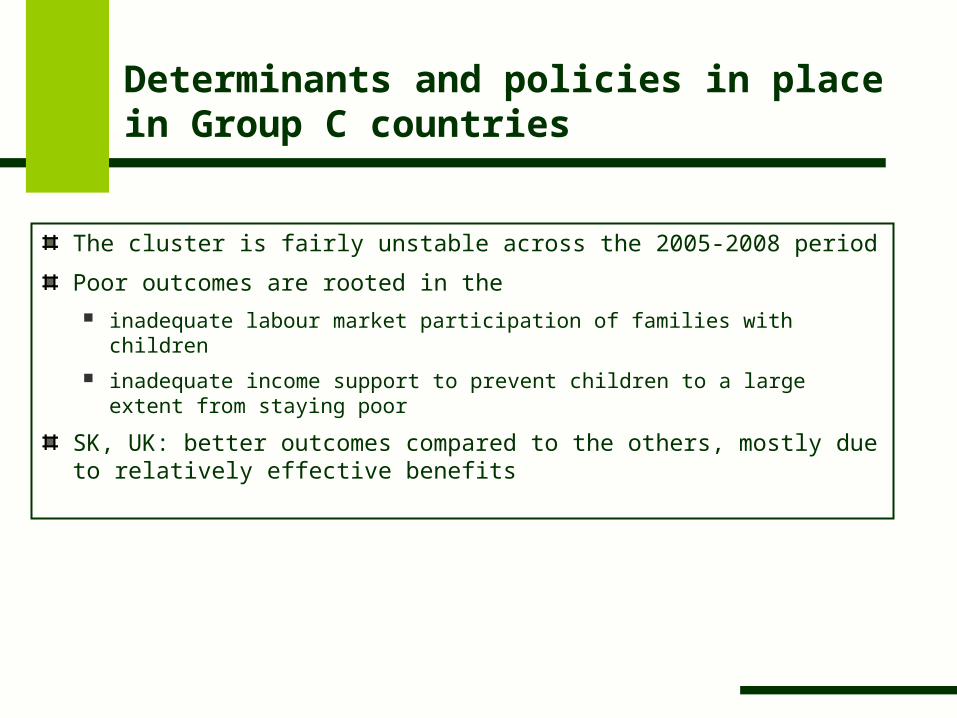
The cluster is fairly unstable across the 2005-2008 period
Poor outcomes are rooted in the inadequate labour market participation of families with children
inadequate income support to prevent children to a large extent from staying poor
SK, UK: better outcomes compared to the others, mostly due to relatively effective benefits
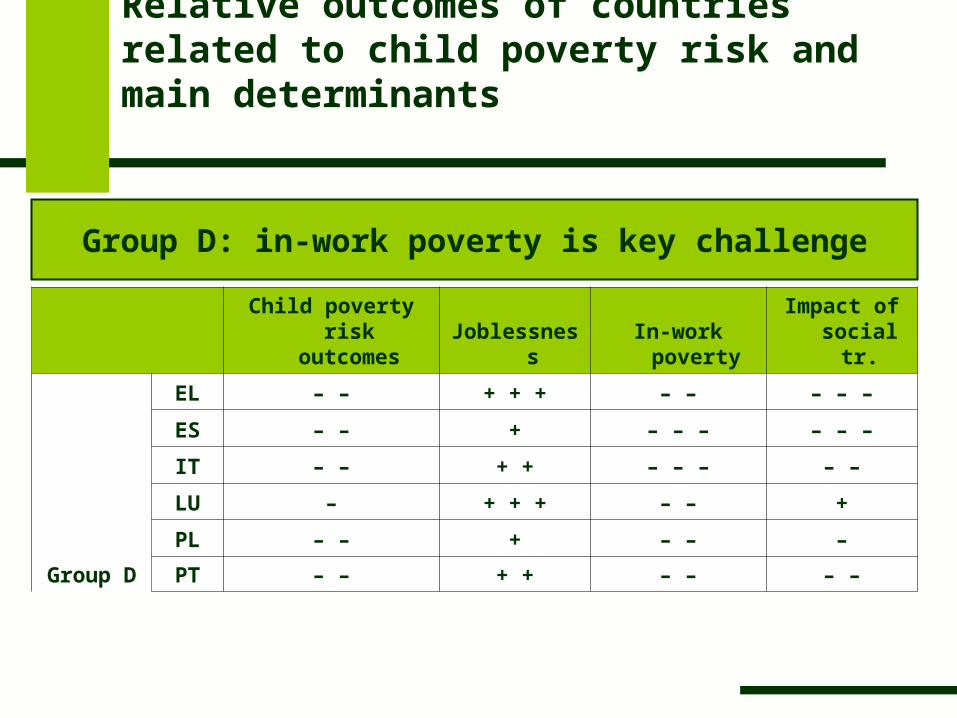
Relative outcomes of countries related to child poverty risk and main determinants
Child poverty risk outcomes Joblessness
In-work poverty
Impact of social tr.
Group D
EL – – + + + – – – – –
ES – – + – – – – – –
IT – – + + – – – – –
LU – + + + – – +
PL – – + – – –
PT – – + + – – – –
Group D: in-work poverty is key challenge
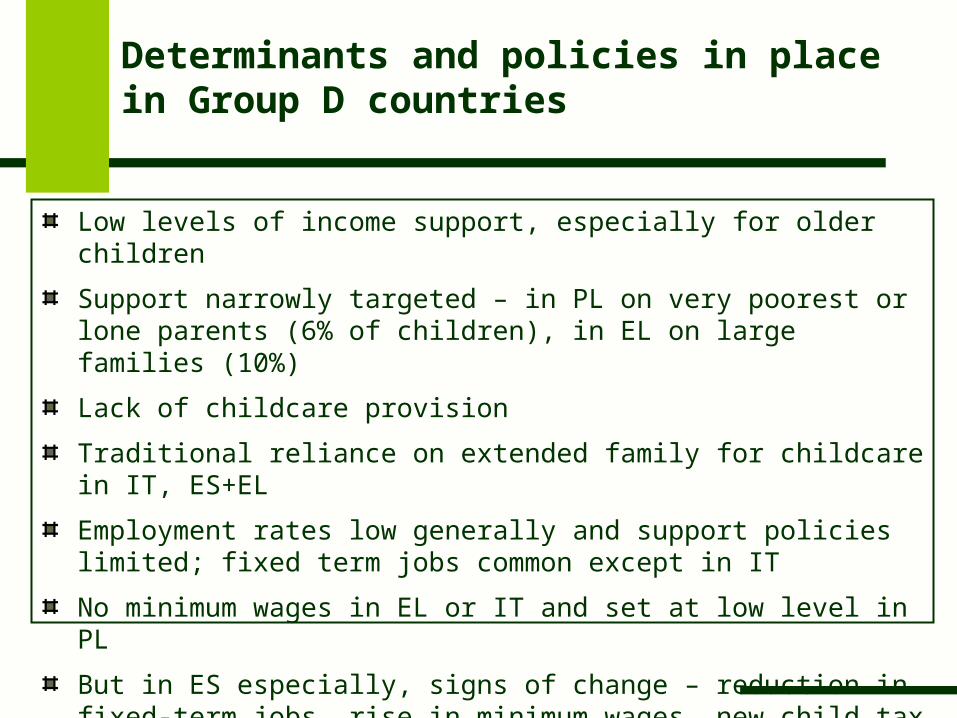
Determinants and policies in place in Group D countries
Low levels of income support, especially for older children
Support narrowly targeted – in PL on very poorest or lone parents (6% of children), in EL on large families (10%)
Lack of childcare provision
Traditional reliance on extended family for childcare in IT, ES+EL
Employment rates low generally and support policies limited; fixed term jobs common except in IT
No minimum wages in EL or IT and set at low level in PL
But in ES especially, signs of change – reduction in fixed-term jobs, rise in minimum wages, new child tax allowances
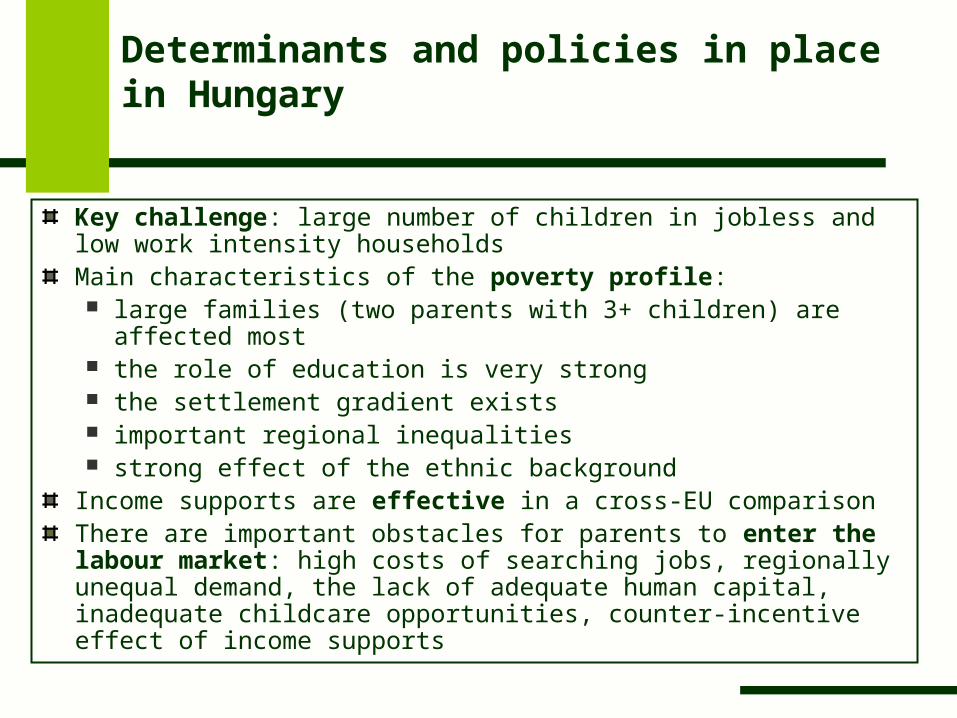
Determinants and policies in place in Hungary
Key challenge: large number of children in jobless and low work intensity householdsMain characteristics of the poverty profile: large families (two parents with 3+ children) are affected most the role of education is very strong the settlement gradient exists important regional inequalities strong effect of the ethnic background
Income supports are effective in a cross-EU comparisonThere are important obstacles for parents to enter the labour market: high costs of searching jobs, regionally unequal demand, the lack of adequate human capital, inadequate childcare opportunities, counter-incentive effect of income supports
How to go ahead with the analysis?
To extend the analysis using multilevel modelling: to take into account additional dimensions on the
explanatory side at individual (hh) level (hh composition, socio-economic status of parents, settlement, migrant status)
national level institutional variables to better differentiate between countries in terms of policy effectiveness and efficiency
Microsimulation

Thank you for your attention!
www.tarki.hu