Embed Size (px)
Citation preview
DETERMINANTS OF BANK PROFITABILITY: EVIDENCE FROM US By
Yinglin Cheng
Bachelor of Management, South China Normal University, 2015
and
Yating Huang Bachelor of Economics, Hunan University of finance and Economics, 2015
PROJECT SUBMITTED IN PARTIAL FULFILLMENT OF THE REQUIREMENTS FOR THE DEGREE OF
MASTER OF SCIENCE IN FINANCE
In the Master of Science in Finance Program of the
Faculty of
Business Administration
© Yating Huang, Yinglin Chen, 2017
SIMON FRASER UNIVERSITY
Term Fall 2017
All rights reserved. However, in accordance with the Copyright Act of Canada, this work may be reproduced, without authorization, under the conditions for Fair Dealing.
Therefore, limited reproduction of this work for the purposes of private study, research, criticism, review and news reporting is likely to be in accordance with the law,
particularly if cited appropriately.
brought to you by COREView metadata, citation and similar papers at core.ac.uk
provided by Simon Fraser University Institutional Repository
1
Approval
Name: Yating Huang, Yinglin Chen
Degree: Master of Science in Finance
Title of Project: Determinants of Bank Profitability: Evidence from US
Supervisory Committee:
___________________________________________
Jijun Niu Senior Supervisor Associate Professor of Finance
___________________________________________
Ying Duan Second Reader Assistant Professor of Finance
Date Approved: ___________________________________________

2
Abstract
This paper examines the variables that affect bank profitability. We construct a
sample of US banks from 2003 to 2015, and use return on assets (ROA) and return on
equity (ROE) to measure bank profitability. We find that banks with higher profitability
are the banks that have: (1) a higher deposits to total asset ratio, (2) a higher
diversification ratio, and (3) higher operational efficiency. We also find that better-
capitalized banks tend to be more profitable only when we use ROA as the measure of
profitability. Furthermore, loans have a positive impact on profitability before the
financial crisis, but not during the crisis. Size has a positive impact on profitability when
the bank is small.
Keywords: Bank profitability; Size of the banks; Financial crisis

3
Acknowledgements
We would like to thank Professor Jijun Niu for providing guidance on
methodology of this research project and giving us valuable suggestions to improve our
work. We would also like to thank Professor Ying Duan for support. We appreciate SFU
Beedie Faculties for providing help to ensure the completion of our project.

4
Table of content
Approval .......................................................................................................................................... 1
Abstract ........................................................................................................................................... 2
Acknowledgements ......................................................................................................................... 3
List of Tables ................................................................................................................................... 5
List of Figures ................................................................................................................................. 6
1: Introduction ................................................................................................................................ 7
2: Literature Review .................................................................................................................... 10 2.1 Size ........................................................................................................................................ 10 2.2 Capitalization ........................................................................................................................ 11 2.3 Asset Structure ...................................................................................................................... 12 2.4 Deposit .................................................................................................................................. 13 2.5 Diversification ....................................................................................................................... 13 2.6 Efficiency .............................................................................................................................. 15
3: Sample and Methodology ........................................................................................................ 16 3.1 Sample ................................................................................................................................... 16 3.2 Variable definitions ............................................................................................................... 16
3.2.1 Dependent variables ................................................................................................. 16 3.2.2 Independent variables ............................................................................................... 17
3.3 Methodology ......................................................................................................................... 19
4: Results ....................................................................................................................................... 20 4.1 Determinants of the profitability of large banks ................................................................... 20 4.2 Determinants of the profitability of medium banks .............................................................. 22 4.3 Determinants of the profitability of small banks ................................................................... 23
5: Summary ................................................................................................................................... 24
6: Appendix ................................................................................................................................... 25 6.1 Appendix A: Tables .............................................................................................................. 25 6.2 Appendix B: Figures ............................................................................................................. 35
7: Bibliography ............................................................................................................................. 36

5
List of Tables
Table 1 Variable definitions ........................................................................................................... 25
Table 2 Number of observations by year........................................................................................ 26
Table 3 Summary of statistics ........................................................................................................ 27
Table 4 Regression results, Large banks, ROA .............................................................................. 29
Table 5 Regression results, Large banks, ROE .............................................................................. 30
Table 6 Regression results, Medium-sized banks, ROA ................................................................ 31
Table 7 Regression results, Medium-sized banks, ROE ................................................................ 32
Table 8 Regression results, Small banks, ROA .............................................................................. 33
Table 9 Regression results, Small banks, ROE .............................................................................. 34

6
List of Figures
Figure 1 Profitability of US Banks from 2003 to 2015 .................................................................. 35

7
1: Introduction
There are thousands of banks in the US, and they play significant roles in economic
activities. Banks are financial institutions that accept deposits from the public and create
credit. Lending activities are performed mostly by banks. Levine et al. (2002) state that
banks translate customer deposits into productive investments in a way that supports
economic growth. Therefore, a more profitable bank should be able to not only make
better contributions to the countries and society, but also main sufficient capital ratios,
even in a risky business environment.
US banks are influential and important in global economic environment, and
present a significant resource to study bank profitability for two reasons. First, US
banking system is one of the most advanced system in the world, and there is enough
number of banks that we can use as samples to analyse. Second, following a period of
financial deregulation and increased competition in the banking and financial sectors, US
banks were hit by a major financial crisis between 2007 and 2009, which brought
unexpected loss to the world. Thus, banks should learn how to prevent losses and
maintain profitability even during economic recessions.
A lot of researchers have studied the determinants of bank profitability over
different sample periods and in different counties. For example, Flamini et al (2009) and
Smirlock (2009) find a positive relationship between the size of a bank and its
profitability, while Pasiouras (2006) finds the relationship to be negative. Berger (1995b)
finds that increasing capital ratio may increase bank profitability. Freixas (2005) suggests
8
that a bank can benefit more with higher loans to asset ratio because of informational
advantage.
In this paper, we examine not only the relationship between different factors and
bank profitability, but also how the relationship differs across bank size groups and over
time. Since banks of different size often follow different strategies to grow their
profitability, we study which determinants matter most for each size group. Moreover,
the relationship might change in different economic conditions. Therefore, we divide all
banks into three size groups, and we analyse each group separately in three time periods:
before the crisis, during the crisis and after the crisis.
We use Stata to run linear regressions and measure profitability using both return
on assets (ROA) and return on equity (ROE). ROA is calculated as the ratio of net
income to total assets. It is the most popular way for comparing banks to each other, and
is also used by banks to monitor their own performance from period to period.
Nowadays, there are still many banks that prefer to use ROA though these banks are
typically small. ROE is defined as a ratio of net income to shareholders’ equity. It is not
asset-dependent, and therefore is gaining popularity recently. ROE can be used to
monitor any line of business or any product in the bank, and ROE also permits people to
look at the comparative profitability of lines of business like deposit services, while it
would be difficult to analyse the profitability with ROA. Many observers recommend
ROE, because it focuses on shareholders’ interest in the business.
This paper proceeds as follows. Section 2 reviews several significant empirical
studies that help to develop our hypothesis. Section 3 explains the data and methods we

9
use to estimate the empirical equation. Section 4 presents and discusses the results.
Section 5 gives summary and gives advice on improving bank profitability.

10
2: Literature Review
2.1 Size
Chronopoulos et al. (2015) find a nonlinear relationship between the scale and bank
profitability. They also find evidence that profitability tends to increase during periods of
economic growth, and deteriorates during periods of slow economic growth. Barros et al
(2007) find that larger, more diversified Banks are more likely to have poor performance;
this suggests that smaller, specialized Banks can more effectively reduce the asymmetric
information problems related to loans. Berger and Humphrey (1997) find that, in general,
large banks performed better than smaller Banks, but it was not clear whether large banks
benefited from economies of scale. They point out that better practices are more
important than economies of scale in terms of technical and managerial structures.
Flamini et al. (2009) and Smirlock (1985) find a positive link between size and
profitability. One possible reason is that large banks are more diversified in their products
and services, which reduces the risk level and thus improves operational efficiency and
profitability. Moreover, large banks can raise relatively cheap capital and thus appear to
be more profitable. In addition, some studies have found that, in the absence of
competition environment, large banks have larger market share by providing lower
deposit rates to obtain higher profits, and maintain a higher lending rates (Flamini et al.,
2009). On the other hand, Pasiouras and Kosmidou (2007) and Stiroh and Rumble (2006)
find the link to be negative. They argue that the increase in bank size will result in an
increase in marketing and operating costs, and bureaucratic costs rise, leading to the
11
negative correlation between the profitability and scale. So, the scale effect on
profitability is still a puzzle.
Based on the prior literature, we also hypothesize that the impact of size on
profitability is especially important during a crisis, and small banks may be influenced
differently than large bank.
Therefore, based on the scale of profitability and economies of scale, there are two
uncertain assumptions about the impact of bank size on bank profitability that needs to be
tested.
Hypothesis 1a: There is a positive relationship between bank size and bank profitability.
Hypothesis 1b: There is a negative relationship between bank size and bank profitability.
2.2 Capitalization
In terms of expected returns, equity costs are the most expensive funding sources.
Similarly, because capital is risky and requires a higher return, banks generally believe
that higher equity requirements will add to the cost of financing. That is why bankers are
less enthusiastic when asked to raise capital adequacy ratios.
The following reasons explain that higher profitability can result from better
capitalization of a bank. First, a bank would have high bankruptcy cost at the time when
their capital ratios are low; this is known as the expected bankruptcy cost hypothesis of
Berger (1995b). Second, a bank with higher capital ratio would have lowering interest
expenses on debt. Finally, Berger (1995b) argues that banks can use higher capital ratios
to signal good prospects.
It is also suggested that Capitalization would particularly help small banks to gain
profit. Berger and Bouwman (2013) find that capital would enhance profitability of small
12
banks at all time, and improve profitability of medium and large banks during banking
crises. They point out that size could be a source of economic strength for a bank, and
small banks benefit the most from capital as their access to the financial market is more
limited compare to medium and large banks.
Hypothesis 2: There is a positive relationship between the amount of capital of a bank
and the bank’s profitability.
2.3 Asset Structure
Asset structure refers to the composition of assets held by a bank. To study the
impact of asset structure on bank profitability, we focus on the loan to asset ratio.
Following reasons supports the idea of a positive relationship between this ratio and bank
profitability. First, Freixas (2005) suggests that banks with higher loan to asset ratio
would have more informational advantage, and therefore would generate higher profits.
Second, banks often charge high interest rates on loans as a compensation for taking
liquidity risk. Above finding are reported in recent study by Barros et al. (2007),
Chiorazzo et al. (2008), DeYoung and Rice (2004), Goddard et al. (2004) and Iannotta et
al. (2007).
It is also reasonable to hypothesize that banks with a higher ratio of loans to asset
tend to suffer more during the crisis. Therefore, we wish to analyze whether loans always
have a positive impact on bank profitability, or whether the impact changes over time.
Hypothesis 3: There is a positive relationship between the loans-to-assets ratio and bank
profitability.

13
2.4 Deposit
Several papers examine the effect of customer deposits on bank profitability.
Claeys and Vander Vennet (2008) suggest that higher shares of customer deposits should
be able to increase bank profitability. They argue that customer deposits are a cheaper
and more stable financial resource than other financing resources in bank liabilities.
Beltratti and Stulz (2009) also find that large banks with more deposit financing at the
end of 2006 had higher profitability during the crisis. Therefore, more customer deposits
in bank liabilities mean higher bank profitability (Rasiah 2010).
However, if the commercial policy is aggressive, banks will have to pay higher
deposit rates in order to attract depositors from competitors, and thus lower bank
margins. This is so called ‘deposit war’. What is more, according to Liu and Wilson
(2010), if banks pass lower costs on to their customers in the form of higher deposit rates,
the profits will be reduced. Therefore, we examine the relation between customer
deposits and bank profitability in this paper.
Hypothesis 4a: There is a positive relationship between the deposits of a bank and the
bank’s profitability.
Hypothesis 4b: There is a negative relationship between the deposits of a bank and the
bank’s profitability.
2.5 Diversification
The decline in interest margins in the last decade has driven traditional banks to
change their focus on lending activities, and searched for new sources of revenue. The
argument that whether diversification has a positive impact on bank profitability has
aroused many scholar’s interest. Some researchers argue that income diversification has a
14
positive impact on bank profitability. Chiorazzo et al. (2008) and Elsas et al. (2010)
conclude that income diversification increases bank profitability through higher margins
from non-interest businesses. Khanna and Tice (2001) find that income diversification
can reduce risk.
However, other researchers find evidence that income diversification has a negative
impact on bank profitability. Acharya, Hasan, and Saunders (2002) find that
diversification can reduce bank returns. Lepetit et al. (2008) finds that certain loans that
have lower interest rate aiming to capture customers for other products and services
provided by the banks can cause detriment in the banks. That is, the revenue from non-
interest product cannot offset the cost of lowering interest rate. Stiroh and Rumble (2006)
conclude that greater income diversification does not necessarily turn into an
improvement on bank profitability.
What is more, Dietrich and Wanzenried (2011) suggest that only larger banks
benefit from revenue diversification. This is because larger banks have economies of
scale (e.g., increased operational efficiency) and economies of scope (e.g., higher degree
of product and loan diversification) than smaller banks.
Therefore, we are interested in finding the possible relationship between income
diversification and bank profitability, and whether the relationship differs across different
sizes of banks.
Hypothesis 5a: There is a positive relationship between the level of diversification of a
bank and the bank’s profitability.
Hypothesis 5b: There is a negative relationship between the level of diversification of a
bank and the bank’s profitability.
15
2.6 Efficiency
As the development in financial technologies, information and communication in
finance industry, banks have been performing their traditional services more efficiently.
Therefore, efficiency in delivering banking services has constituted a significant
determinant of the bank profitability. A number of researchers have found a positive
relationship between efficiency and bank profitability, for both US and European banks
(Berger, 1995a; Goddard et al., 2001).
Previous scholars often use the cost-to-income (CI) ratio, which is a proxy for
operational efficiency, to examine the relationship between bank profitability and
managerial efficiency. Lowering the bank’s cost ratio, and hence increasing managerial
efficiency, is expected to enhance bank profitability. Furthermore, there is also evidence
that cost-income ratio (CIR) (Goddard et al., 2009) or overhead costs over total assets
(Athanasoglou et al., 2008), the proxy for operational efficiency, affects bank
profitability. Dietrich and Wanzenried (2011) find evidence that the more efficiently
banks operate, the higher profits banks obtain. According to Trujillo-Ponce (2013), on
average, banks may have costs about 20 per cent higher than the industry minimum
because of low managerial efficiency.
However, Liu and Wilson (2010) suggest that if banks with higher operational
efficiency pass the lower costs to their customers through, for example, lower loan rates
and/or higher deposit rates, bank profits will decline. Given the findings of previous
studies, we expect a positive relationship between efficiency and bank profitability.
Hypothesis 6: There is a positive relationship between the efficiency of a bank and the
bank’s profitability.
16
3: Sample and Methodology
3.1 Sample
In order to achieve the goal of this research paper, we obtain data from the
Wharton Research Data Service (WRDS). Specifically, we download accounting data
(with annual frequency) of Bank Holding Companies in the US over the period from
2003 to 2015.
There are 16,829 observations on 2,843 unique banks in our sample. We then
divide banks into three groups based on their total assets. Small banks have total assets up
to $1 billion. Medium banks have total assets between $1 billion and $10 billion. Large
banks have total assets of more than $10 billion.
In order to learn the effect of financial crisis, we divide our sample period into
three periods. We define 2003 to 2006 as ‘Before the crisis’, 2007 to 2009 as ‘During the
crisis’, and 2010 to 2015 as ‘After the crisis’.
3.2 Variable definitions
3.2.1 Dependent variables
We use two dependent variables in this paper, which are return on assets (ROA)
and return on equity (ROE), to measure the ability of banks to generate profit. ROA
indicates how profitable a bank is given its assets. It gives investor and manager an idea
of how efficient the management of a bank is to generate return using its assets. ROE
17
quantifies how much profit a bank could generate with the money that shareholders have
invested in the bank.
3.2.2 Independent variables
We choose the following variables as the independent variables: Asset Size,
Capital Ratio, Net Loans, Deposits, Asset Diversity, and Cost-income Ratio. We test the
effect of these variables on ROA and ROE over the three periods: before the crisis,
during the crisis, and after the crisis.
For Asset Size, we have taken the natural logarithm of total asset in thousands of
dollars to reduce the heteroscedasticity.
For Capital Ratio, we use the ratio of equity to total assets as measurement.
Following our second Hypothesis, we expect a positive relationship between capital ratio
and bank profitability.
For Net Loans, we use the ratio of net loans to total assets. From our third
Hypothesis, we expect to observe a positive relationship between the ratio of net loans to
total assets and profitability.
For Deposits, we use the ratio of total deposits to total assets. We have no clear
prior of the impact of deposits on bank profitability. On the one hand, deposits are stable
and cheap founding sources, and banks take advantage of deposits. On the other hand,
banks may increase their interest expenses when they try to attract more deposits. Thus,
the impact of deposits on bank profitability is ambiguous.
For Income Diversity, we use the ratio of noninterest income to total operating
income, where total operating income is the sum of interest income and noninterest
income. We expect a positive relationship between this variable and bank profitability.

18
For Cost-income Ratio, we use the ratio of total noninterest expense to total
operating income. This is a useful ratio to test the impact of efficiency on bank
profitability. A higher cost-income ratio indicates lower efficiency.
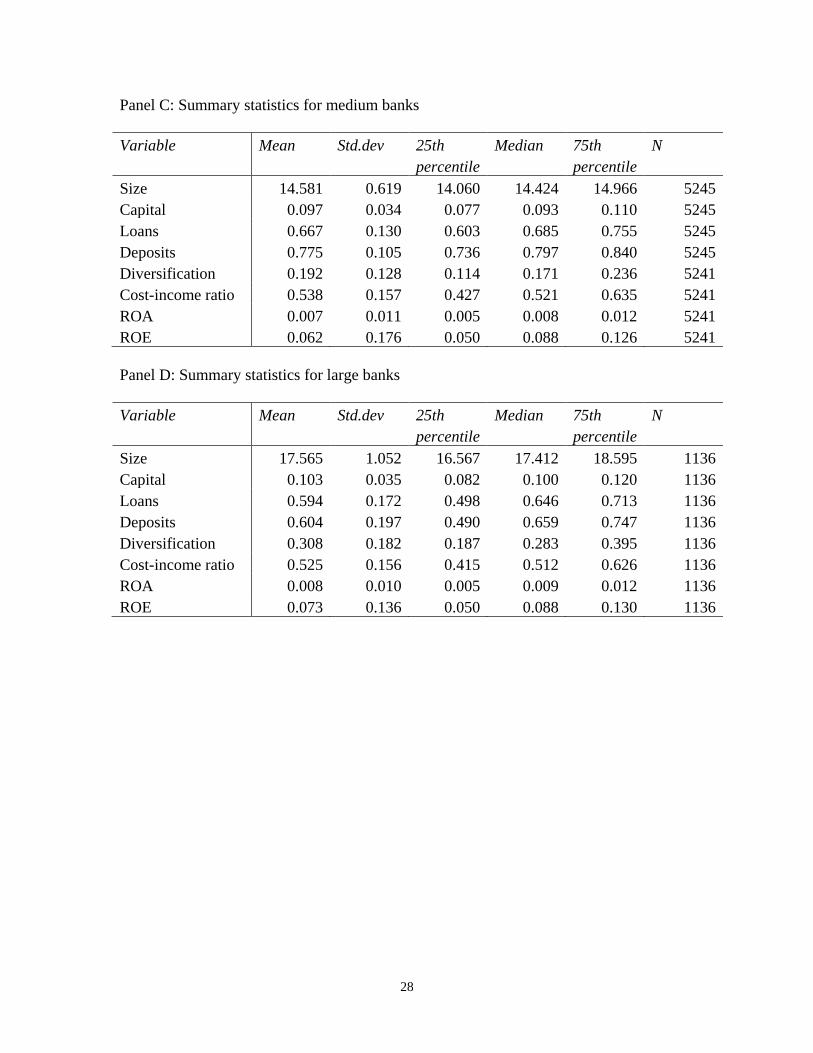
Table 1 provides variable definitions. Table 2 reports the number of banks each
year from 2003 to 2015. Table 3 provides the summary statistics such as mean, standard
deviation, 25th percentile, Median, 75th Percentile, and number of observation for each
variable.

19
3.3 Methodology
We perform linear regressions using STATA to examine the impact of each
independent variable on bank profitability. Our equation is as follow:
𝑌𝑖,𝑡 = 𝛼 + 𝛽1 ∗ 𝑆𝑖𝑧𝑒𝑖,𝑡 + 𝛽2 ∗𝐸𝑞𝑢𝑖𝑡𝑦𝑖,𝑡𝑇𝐴𝑖,𝑡
+ 𝛽3𝐿𝑜𝑎𝑛𝑠𝑖,𝑡𝑇𝐴𝑖,𝑡
+ 𝛽4 ∗𝐷𝑒𝑝𝑜𝑠𝑖𝑡𝑠𝑖,𝑡
𝑇𝐴𝑖,𝑡+ 𝛽5 ∗
𝐷𝑖𝑣𝑒𝑟𝑠𝑖𝑣𝑖𝑐𝑎𝑡𝑖𝑜𝑛𝑖,𝑡 + 𝛽6 ∗ 𝐶𝐼𝑅𝑖,𝑡 + 𝜀𝑖,𝑡
Where
Yi,t: Either ROA or ROE in different regressions
β: Coefficient on independent variables
εi,t: Error term
We estimate above equation separately for the three periods in order to understand
whether the impact of each variable changes over time .
20
4: Results
4.1 Determinants of the profitability of large banks
Tables 4 and 5 report the regression results for both dependent variables (ROA and
ROE) using large banks.
The coefficient on size is negative in all regressions no matter whether the
dependent variable is ROA or ROE. Therefore, the results show that there is a negative
relationship between bank size and bank profitability, meaning that banks cannot increase
their profitability by increasing size anymore when they reach a certain level of
economies of scale. Increasing size would reduce bank profitability by generating lots of
other costs, which cannot be offset by the increase in revenue.
The coefficient on the loans-to-total-assets ratio is positive before the crisis, while
negative during the crisis. It provides mixed evidence for our hypothesis that there is a
positive relationship between asset structure and bank profitability for large banks. We
conclude that, for large banks, having more loans can have positive impact on bank
profitability when the economy is good and stable. However, holding more loans may
hurt bank profitability during recessions because of the bad debts and the collapse of
housing market.
Deposits in large banks have a positive and significant impact on bank
profitability in all periods. Therefore, we conclude that there is a positive relationship
between deposits and profitability for large banks. The traditional business of taking
deposits still matters for the profitability of large banks in the US.
21
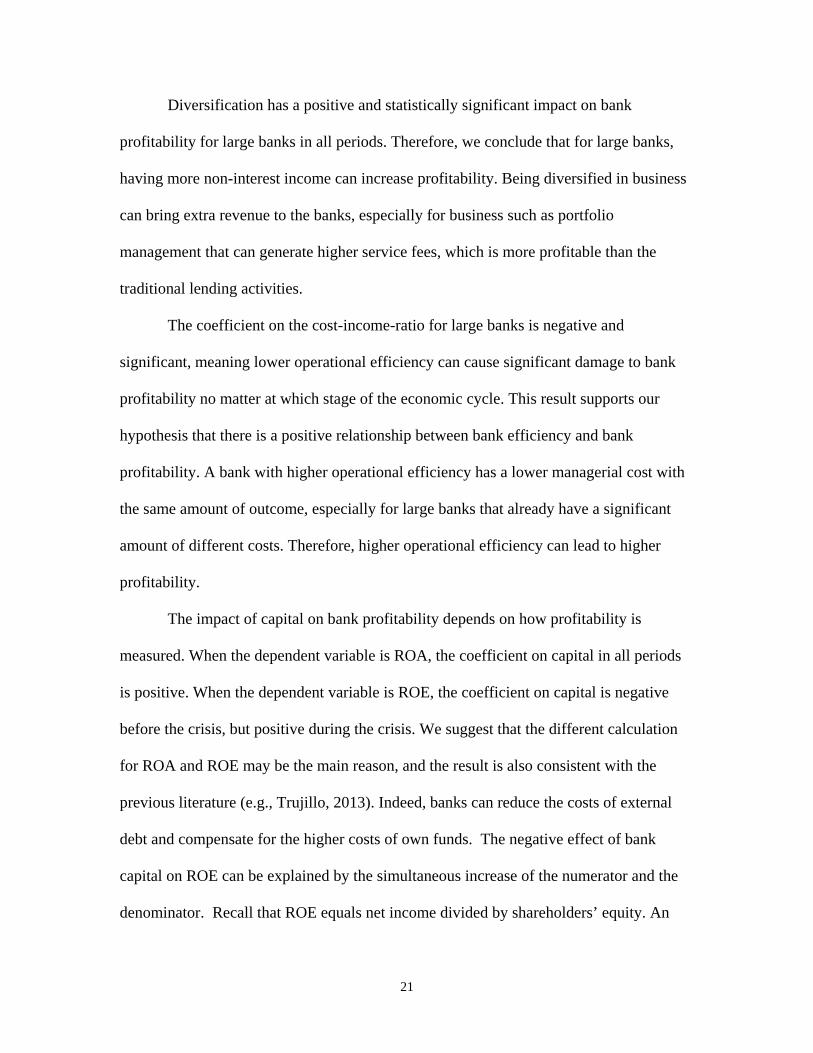
Diversification has a positive and statistically significant impact on bank
profitability for large banks in all periods. Therefore, we conclude that for large banks,
having more non-interest income can increase profitability. Being diversified in business
can bring extra revenue to the banks, especially for business such as portfolio
management that can generate higher service fees, which is more profitable than the
traditional lending activities.
The coefficient on the cost-income-ratio for large banks is negative and
significant, meaning lower operational efficiency can cause significant damage to bank
profitability no matter at which stage of the economic cycle. This result supports our
hypothesis that there is a positive relationship between bank efficiency and bank
profitability. A bank with higher operational efficiency has a lower managerial cost with
the same amount of outcome, especially for large banks that already have a significant
amount of different costs. Therefore, higher operational efficiency can lead to higher
profitability.
The impact of capital on bank profitability depends on how profitability is
measured. When the dependent variable is ROA, the coefficient on capital in all periods
is positive. When the dependent variable is ROE, the coefficient on capital is negative
before the crisis, but positive during the crisis. We suggest that the different calculation
for ROA and ROE may be the main reason, and the result is also consistent with the
previous literature (e.g., Trujillo, 2013). Indeed, banks can reduce the costs of external
debt and compensate for the higher costs of own funds. The negative effect of bank
capital on ROE can be explained by the simultaneous increase of the numerator and the
denominator. Recall that ROE equals net income divided by shareholders’ equity. An
22
increase in capital can lead to an increase in net income. However, it also leads to an
increase in the denominator.
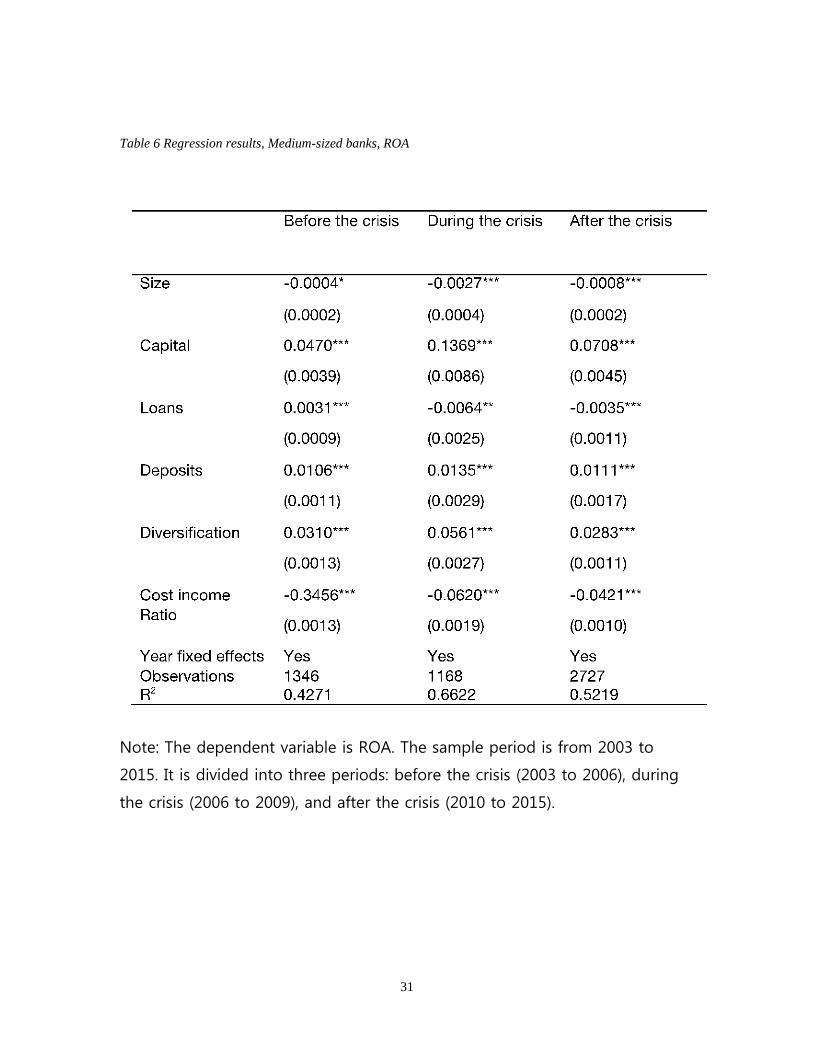
4.2 Determinants of the profitability of medium banks
Tables 6 and 7 report the regression results for medium banks. We find that size,
deposit, diversification and cost-income-ratio have the same impact on medium banks as
that on large banks. Thus, for medium banks in the US, increasing bank size cannot have
a positive impact on bank profitability, since the bank cannot offset the cost of expanding
by the increase in revenue.
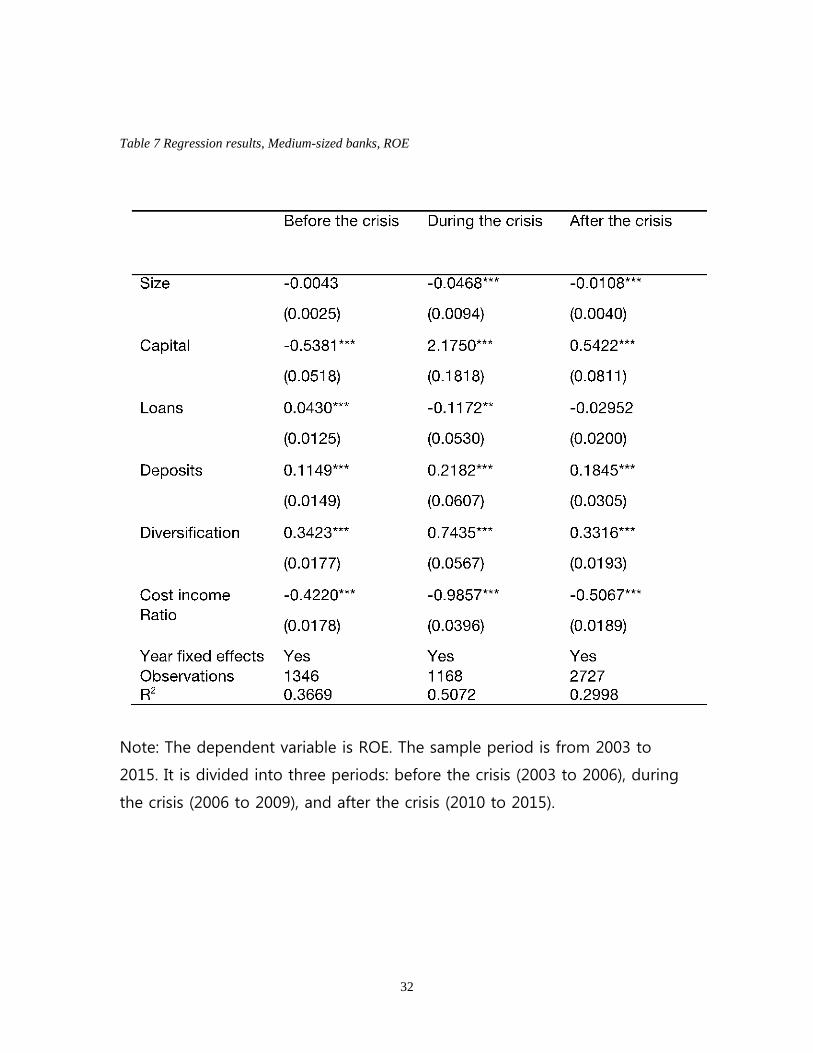
However, the coefficient on capital is different from that on large banks. Capital
has a positive and significant impact on bank profitability during and even after the
financial crisis when the dependent variable is ROE. Indeed, the sources of profitability
might have changed for medium banks during the financial crisis, and more capital is
good for return on equity, because people view capital as an important element to reduce
the insolvency risk of a bank, and more capital means less insolvency risk. Therefore,
during and after the financial crisis, capital is important for a medium bank to generate
profits.
Furthermore, loans have a negative impact on medium banks not only during the
financial crisis, but also after the crisis. We suggest that compared to the large banks,
medium banks do not have a high reputation and customer bases, therefore more loans in
the asset structure can be risky for medium banks after the recession. People may view a
medium bank with higher amount of loans as having higher credit risk.
23
4.3 Determinants of the profitability of small banks
Table 8 and 9 report the regression results for small banks. We find that the
coefficients on deposits, diversification, and cost-income-ratio are qualitatively similar to
those reported in previous tables. Therefore, we conclude that for all banks in the US,
having more deposits, being more diversified and having higher efficiency can increase
bank profitability.
However, size has a negative and significant impact on bank profitability for
small banks before crisis, but a positive impact during the crisis. We suggest that it is
difficult for small banks to compete with big banks during the crisis. Increasing the size
can bring benefits to small banks during the crisis by reducing insolvency risk through
better diversification.

24
5: Summary
This paper empirically analyzes the variables that influence the profitability of US
banks from 2003 to 2015. We divide banks into three groups: large banks, medium banks
and small banks, and analyze them over different sample periods.
We find that: (1) Banks with higher levels of deposits, revenue diversification and
higher efficiency tend to have higher profitability. These results hold whether we
measure profitability using ROA and ROE. (2) Large and medium banks cannot increase
their profitability by enlarging their size, while small banks can do so. (3) Banks with
higher loans tend to have higher profitability before the financial crisis, but lower
profitability during the financial crisis. (4) Banks with higher capital tend to be more
profitable, but only when we use ROA to measure profitability.
We conclude that, if a bank wants to improve its profitability, it can attract more
deposits, become more diversified in, and improve its operational efficiency.
One limitation of this paper is that the regressions may be endogenous. We
assumed that capital affects bank profitability. However, in practice, profitability may in
turn affect capital, because banks with higher profits will have higher capital. If capital is
endogenous, estimating the empirical equation using ordinary least squares may produce
biased estimates. We leave this issue to future research.

25
6: Appendix
6.1 Appendix A: Tables
Table 1 Variable definitions
Variable Definition
Return on assets The ratio of net income to total assets
Return on equity The ratio of net income to total equity capital
Size The natural logarithm of total assets in thousands of dollars
Capital The ratio of equity to total assets
Loans The ratio of loans and leases to total assets
Deposits The ratio of domestic deposits to total assets
Diversification The ratio of noninterest income to total operating income
Cost-income ratio The ratio of noninterest expense to total operating income

26
Table 2 Number of observations by year
Year Number of Banks
2003 2186
2004 2301
2005 2310
2006 986
2007 966
2008 973
2009 1015
2010 1009
2011 1018
2012 1140
2013 1143
2014 1129
2015 653

27
Table 3 Summary of statistics
Panel A: Summary Statistics for the whole sample Variable Mean Std.dev 25th Median 75th N percentile percentile Size 13.793 1.391 12.906 13.512 14.288 16829 Capital 0.093 0.033 0.074 0.090 0.108 16829 Loans 0.665 0.135 0.593 0.684 0.759 16829 Deposits 0.785 0.112 0.751 0.811 0.855 16829 Diversification 0.177 0.126 0.101 0.150 0.217 16825 Cost-income ratio 0.527 0.147 0.426 0.508 0.613 16825 ROA 0.007 0.010 0.005 0.009 0.012 16825 ROE 0.073 0.162 0.055 0.094 0.132 16825 Panel B: Summary statistics for small banks Variable Mean Std.dev 25th Median 75th N percentile percentile Size 12.987 0.545 12.513 13.125 13.435 10448 Capital 0.090 0.032 0.072 0.087 0.105 10448 Loans 0.671 0.131 0.593 0.688 0.766 10448 Deposits 0.810 0.079 0.776 0.825 0.864 10448 Diversification 0.155 0.105 0.093 0.135 0.189 10448 Cost-income ratio 0.522 0.140 0.426 0.503 0.600 10448 ROA 0.007 0.010 0.005 0.009 0.012 10448 ROE 0.079 0.157 0.059 0.098 0.135 10448
28
Panel C: Summary statistics for medium banks Variable Mean Std.dev 25th Median 75th N percentile percentile Size 14.581 0.619 14.060 14.424 14.966 5245 Capital 0.097 0.034 0.077 0.093 0.110 5245 Loans 0.667 0.130 0.603 0.685 0.755 5245 Deposits 0.775 0.105 0.736 0.797 0.840 5245 Diversification 0.192 0.128 0.114 0.171 0.236 5241 Cost-income ratio 0.538 0.157 0.427 0.521 0.635 5241 ROA 0.007 0.011 0.005 0.008 0.012 5241 ROE 0.062 0.176 0.050 0.088 0.126 5241 Panel D: Summary statistics for large banks Variable Mean Std.dev 25th Median 75th N percentile percentile Size 17.565 1.052 16.567 17.412 18.595 1136 Capital 0.103 0.035 0.082 0.100 0.120 1136 Loans 0.594 0.172 0.498 0.646 0.713 1136 Deposits 0.604 0.197 0.490 0.659 0.747 1136 Diversification 0.308 0.182 0.187 0.283 0.395 1136 Cost-income ratio 0.525 0.156 0.415 0.512 0.626 1136 ROA 0.008 0.010 0.005 0.009 0.012 1136 ROE 0.073 0.136 0.050 0.088 0.130 1136

29
Table 4 Regression results, Large banks, ROA
Note: The dependent variable is ROA. The sample period is from 2003 to
2015. It is divided into three periods: before the crisis (2003 to 2006), during
the crisis (2006 to 2009), and after the crisis (2010 to 2015).

30
Table 5 Regression results, Large banks, ROE
Note: The dependent variable is ROE. The sample period is from 2003 to
2015. It is divided into three periods: before the crisis (2003 to 2006), during
the crisis (2006 to 2009), and after the crisis (2010 to 2015).
31
Table 6 Regression results, Medium-sized banks, ROA
Note: The dependent variable is ROA. The sample period is from 2003 to
2015. It is divided into three periods: before the crisis (2003 to 2006), during
the crisis (2006 to 2009), and after the crisis (2010 to 2015).
32
Table 7 Regression results, Medium-sized banks, ROE
Note: The dependent variable is ROE. The sample period is from 2003 to
2015. It is divided into three periods: before the crisis (2003 to 2006), during
the crisis (2006 to 2009), and after the crisis (2010 to 2015).

33
Table 8 Regression results, Small banks, ROA
Note: The dependent variable is ROA. The sample period is from 2003 to
2015. It is divided into three periods: before the crisis (2003 to 2006), during
the crisis (2006 to 2009), and after the crisis (2010 to 2015).

34
Table 9 Regression results, Small banks, ROE
Note: The dependent variable is ROE. The sample period is from 2003 to
2015. It is divided into three periods: before the crisis (2003 to 2006), during
the crisis (2006 to 2009), and after the crisis (2010 to 2015).
35
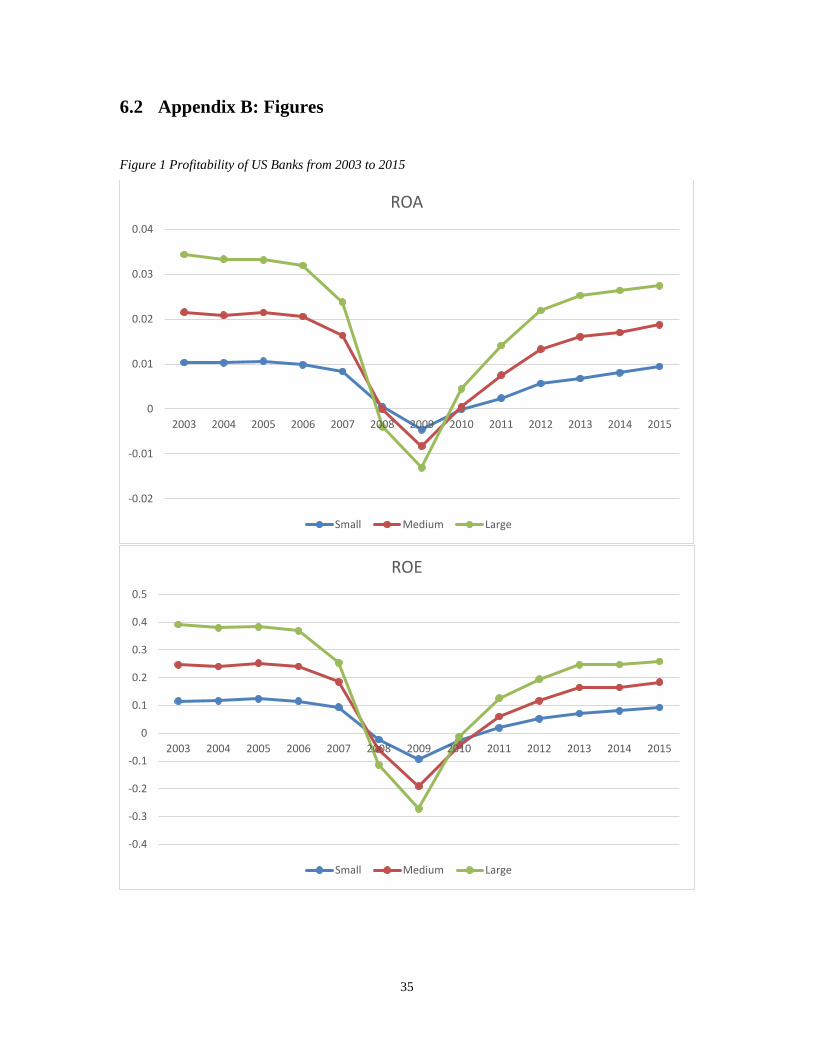
6.2 Appendix B: Figures
Figure 1 Profitability of US Banks from 2003 to 2015
-0.02
-0.01
0
0.01
0.02
0.03
0.04
2003 2004 2005 2006 2007 2008 2009 2010 2011 2012 2013 2014 2015
ROA
Small Medium Large
-0.4
-0.3
-0.2
-0.1
0
0.1
0.2
0.3
0.4
0.5
2003 2004 2005 2006 2007 2008 2009 2010 2011 2012 2013 2014 2015
ROE
Small Medium Large
36
7: Bibliography
Acharya, Viral V. and Saunders, Anthony and Hasan, Iftekhar, 2002. The Effects of Focus and
Diversification on Bank Risk and Return: Evidence from Individual Bank Loan Portfolios. CEPR
Discussion Paper No. 3252
Athanasoglou, P. P., Brissimis, S. N. and Delis, M. D. (2008) Bank-specific, industry-specific
and macroeconomic determinants of bank profitability, Journal of International Financial
Markets, Institutions and Money, 18, (121–36.)
Barros, C. P., C. Ferreira, and J. Willians, 2007, Analysing the determinants of performance of
best and worst European banks: a mixed logit approach, Journal of Banking and Finance 31,
(2189–2203.)
Beltratti, A., Stulz, R., 2009. Why Did Some Banks Perform Better During the Credit Crisis? A
Cross-Country Study of the Impact of Governance and Regulation. EGGI's Finance Working
Paper No.254/2009
Berger and Bouwman, 2013. How does capital affect bank performance during financial crises.
Journal of financial economics, 109, (pp. 146-176.)
Berger, A. and D. Humphrey, 1997. Efficiency of financial institutions: International survey and
directions for future research. European Journal of Operational Research, 98, (pp. 175-212.)
37
Berger, A. N. (1995b), The relationship between capital and earnings in banking, Journal of
Money, Credit, and Banking 27, (pp. 432–456)
Chiorazzo, V., C. Milani, and F. Salvini, 2008, Income diversification and bank performance:
evidence from Italian banks, Journal of Financial Services Research 33, (181–203.)
Claeys, S., and R. Vander Vennet, 2008, Determinants of bank interest margins in Central and
Eastern Europe: a comparasion with the West, Economic Systems 32, (197-216)
Degryse, H. and Ongena, S. (2008) Competition and regulation in the banking sector: a review of
the empirical evidence on the sources of bank rents, in Handbook of Corporate Finance, Financial
Intermediation and Banking (Eds) A. Boot and A. Thakor, Elsevier, Amsterdam, pp. 483–554.
DeYoung, R., and T. Rice, 2004, Non interest income and financial performance at US
commercial banks, The Financial Review 39, 101–127.
Dietrich and Wanzenried. (2014). The determinants of commercial banking profitability in low,
middle and high-income countries.
Dimitris K. Chronopoulos, Hong Liu, Fiona J. McMillan & John O.S. Wilson(2015) The
dynamics of US bank profitability, The European Journal of Finance, 21:5, (pp. 426-443).
Flamini, V., Schumacher, L., McDonald, C.A., 2009. The determinants of commercial bank
profitability in Sub-Saharan Africa, International Monetary FundWP/09/15.
38
Freixas, X. (2005) Deconstructing relationship banking, Investigaciones Econo´micas, 29, 3–31.
GarcıaLa-Herrero, A., S. GavilaaL , and D. SantabaaL rbara, 2009, What explains the low
profitability of Chinese banks?, Journal of Banking and Finance 33, (pp. 2080–2092.)
Goddard, J., Molyneux, P. and Wilson, J. O. S. (2001) European Banking: Efficiency,
Technology and Growth, John Wiley, Chichester, UK.
Goddard, J., P. Molyneux, and J. Wilson, 2004, Dynamics of growth and profitability in banking,
Journal of Money, Credit and Banking 36, 1069–1090.
Iannotta, G., G. Nocera, and A. Sironi, 2007, Ownership structure, risk and performance in the
European banking industry, Journal of Banking and Finance 31, 2127–2149.
Khanna, T. and S. Tice (2001), 'The bright side of internal capital markets', Journal of Finance,
56(4), 1489–531
Lepetit, L., Nys, E., Rous, P. and Tarazi, A. (2008) Bank income structure and risk: an empirical
analysis of European banks, Journal of Banking and Finance, 32, 1452–67.
Liu and Wilson. (2010). The profitability of banks in Japan. (pp. 7)
Pasiouras, F., Kosmidou, K., 2007. Factors influencing the profitability of domestic and foreign
commercial banks in the European Union. Res. Int. Bus.Finance 21, (222–237.)

39
Rasiah D., 2010. Review of Literature and Theories on Determinants of Commercial Bank
Profitability. Journal of Performance Management, 23, 23-49.
Short, B.K., 1979. The relation between commercial bank profit rates and banking concentration
in Canada, Western Europe, and Japan. J. Bank. Finance 3,209–219.
Smirlock, M., 1985. Evidence on the (non)-relationship between concentration and profitability in
banking. J. Money Credit Bank. 17, (pp. 69–83.)
Stiroh, K. J. (2010) Diversification in banking, in Oxford Handbook of Banking (Eds) A. N.
Berger, P. Molyneux and J. O. S. Wilson, Oxford University Press, Oxford, pp. 146–70.
Stiroh, K.J., Rumble, A., 2006. The dark side of diversification: the case of US financial holding
companies. J. Bank. Finance 30, (pp.2131–2161.)
Trujillo-Ponce. (2013). Accounting and Finance. What determines the profitability of banks-
Evidence from Spain. (pp.566)