Embed Size (px)
Citation preview

1
Determinants and Effects of Corporate Lobbying
Matthew D. Hill, G. Wayne Kelly, and Robert A. Van Ness*
This study examines the determinants of lobbing and whether lobbying affects shareholder
wealth. We find that lobbying behavior is related to firm size, investment opportunities, and
industry affiliation. Lobbying is unrelated to cash flow, which is inconsistent with lobby
spending arising from agency problems, unlike other forms of political spending. Evidence
suggests corporate lobbying is lucrative on average. After controlling for factors known to
influence firm-value, results indicate the market value contribution of an additional dollar of
lobbying is roughly $200.
Keywords: corporate lobbying; political connections; market value
We appreciate helpful comments from seminar participants at the University of Mississippi and Mississippi State
University. Financial support and research assistance for this project was provided by the University of Mississippi
School of Business Administration. All errors remain the sole property of the authors.
*Matthew D. Hill is an Assistant Professor of Finance at the University of Mississippi. G. Wayne Kelly is an
Associate Professor of Finance at Mississippi State University. Robert A. Van Ness is a Professor of Finance at the
University of Mississippi.

2
This paper examines the determinants and shareholder wealth effects of corporate
lobbying among S&P 500 firms. Lobbying is the attempt to affect legislative policy for the
benefit of special interests.1 Legislative influence via lobbying is achieved through internal (in-
house) or external lobbyists, who, in addition to meeting with legislators, provide research and
analysis of legislation and regulatory proposals, attend legislative or regulatory hearings, and
discuss implications of pending legislation or regulatory proposals with management. Many
lobbyists are former political insiders that may provide valuable political connections to their
clients.2
The Lobbying Disclosure Act of 1995 mandated the public disclosure of lobbying
expenditures. The resulting data show that between 1998 and 2006, lobbying expenditures
increased from $1.45 billion to $2.6 billion and the number of registered lobbyists grew from
10,693 to 15,247.3
We find that corporate lobbying is primarily determined by firm size, investment
opportunities, and industry effects. We find no relation between lobbying and cash flow,
indicating that lobbying is unrelated to the ability to lobby. Further, an insignificant relation
between lobbying and cash flow suggests lobbying is not related to agency problems associated
1 The U.S. government defines lobbying as the attempt to persuade legislators to propose, pass, defeat legislation or
change existing laws to provide benefits to parties with special interests (www.senate.gov). See
http://www.senate.gov/legislative/Lobbying/Lobby_Disclosure_Act/3_Definitions.htm for a full discussion of
lobbying activity. 2 Yu and Yu (2008) state that over half of former congressmen or senators become lobbyists for firms. Although
former US government officials are able to become lobbyists, restrictions do exist. Currently, congressmen and
executive branch officials must wait one year after leaving office before directly lobbying government officials. A
loophole exists in that lobbying firms can retain former officials as consultants or advisors until the end of the
moratorium (http://www.opensecrets.org/lobby/lobby00/former.php). 3 http://www.opensecrets.org/lobby/index.php

3
with free cash flow (Jensen (1986)). The results are robust to dependent variable and
econometric specification, firm-level clustering of standard errors, time and industry effects and
various robustness checks.
We also determine the impact of lobbying on firm value, since lobby expenditures
represent investments in political capital. We find a statistically and economically significant
relation between firm value and lobbying, indicating the market prices corporate lobbying
activity. Our base estimate for the market value of an extra dollar spent on prior period lobbying
is roughly $200. This estimate coupled with the sample mean of annual lobbying expenditures
($1.273M) indicates lobbying can increase shareholder wealth by roughly $253M per year.
Hence, lobbying appears to be a worthwhile investment, especially given the market value of
research and development expenditures and average internal rates of return on other corporate
investments (Sougiannis (1994), Fama and French (1999)). The market value of lobbying results
are robust to firm-level clustering of standard errors, dependent variable specification, and fixed
effects (firm, industry, and time), and various robustness checks.
This study contributes to the political spending, corporate lobbying, and political
connections literatures of finance and economics. Navarro (1988) argues that corporate
philanthropy can be used to enhance the reputation of firms and garner political favors.
However, Brown, Helland, and Kiholm-Smith (2006) show that corporate giving is primarily a
function of agency problems, where managers use philanthropy to bolster their image or to fund
certain charities in which they have a personal interest. Aggarwal, Meschke, and Wang (2008)
show corporate campaign donations are related to agency problems associated with free cash
4
flow, suggesting contributions reflect the political leanings of management and are not
investments in political capital. Also, Aggarwal, Meschke, and Wang (2008) show excess
returns are negatively related to political donations, further supporting the view that donations
represent agency problems rather than investment in political capital.4
Results for the determinants of corporate philanthropy and campaign contributions stand
in contrast to the determinants of lobbying activity as we find no significant relation between
corporate lobbying and cash flow. Further, our results show firm value is directly related to
lobbying, while Aggarwal, Meschke, and Wang (2008) show firm value is negatively related to
campaign contributions, which implyies the market distinguishes between types of political
spending. Thus, we extend and complement the political spending literature by providing
evidence differentiating the motives and shareholder wealth implications of corporate lobbying
from other forms of political spending.
Our paper also contributes to the corporate lobbying literature. Richter, Samphantharak,
and Timmons (2008) examine taxes and lobbying and find that increases in lobbying expenses
leads to significantly lower effective tax rates. Alexander, Scholz, and Mazza (2009) find that
firms lobbying for the American Jobs Creation Act of 2004, which created a tax holiday on
repatriated earnings, have average tax savings to lobby expense ratios of 22,000 percent.5 Yu
and Yu (2008) find lobbying firms are less likely than non-lobbying firms to be detected
4 Furthermore, Goldman, Rocholl, and So (2008) find evidence suggesting campaign contributions proxy industry
political preferences over the firm-specific political connections as campaign contributions do not positively impact
firm value after controlling for industry effects. 5 Alexander, Scholz, and Mazza (2009) calculate a return on investment from lobbying by dividing tax savings by
lobby expenses. The authors do not examine lobbying and taxes within a multivariate framework.
5
committing fraud and that it takes longer for authorities to discover fraud committed by lobbying
firms, allowing managers to sell shares before the negative information spreads through the
market.
The present study is related to a working paper by Chen, Parsley, and Yang (2009)
examining the financial operating performance and market valuation of lobbying firms. The
authors show accounting-based performance is positively related to lagged lobbying expenses.
Using a portfolio-based approach, Chen, Parsley, and Yang (2009) show that only firms in the
top quintile of lobbying intensity outperform non-lobbying firms. Because of differences in
methodologies, our market value of lobbying analysis addresses a different question.
Specifically, we test for the effect of lobbying on excess returns within a multivariate framework,
thereby controlling for factors known to influence market value. This approach allows us to test
for the association between firm-value and lobby expenses and make meaningful (i.e., all-else
constant) statistical and economic inferences. While we show a direct link between firm-value
and lobbying, results presented by Chen, Parsley, and Yang (2009) provide a comparison of the
performance of lobbying to non-lobbying firms.
We extend the corporate lobbying literature in two ways. First, we provide theory and
evidence of factors influencing lobbying. Second, we investigate the relation between market
value and lobbying activity, which is motivated by lobbying studies showing the financial benefit
accruing to lobbying firms.
This research also complements the political connections literature as we show that
connections via lobbying yield significant benefits to firms. Specifically, Fisman (2001)
6
examines the share performance of Indonesian firms during periods in which President Suharto’s
health was rumored to have worsened and finds that firms with stronger political connections
experience greater losses relative to less connected firms. Faccio (2006) examines political
connections for a cross-section of international firms and finds positive abnormal returns
associated with the entry of large shareholders or corporate officers into politics. Faccio and
Parsley (2007) find that firms headquartered in the hometown of recently deceased politicians
experience negative returns, suggesting the market is aware of the benefits conferred upon
connected firms. Goldman, Rocholl, and So (2008 and 2009) show that firms earn positive
abnormal returns upon the announcement of adding a politically connected individual to the
board of directors and that political connections affect the allocation of government procurement
contracts, respectively.6
Our research is distinguished from prior political connections research as we use
lobbying activity as the specific source of political connections, a new approach. In fact,
Goldman, Rocholl, and So (2008) mention that lobbying is another way companies can become
politically connected. While the majority of the cited studies classify political connections based
on personal relationships, we believe the direct and concrete nature of lobby expenses makes this
variable a useful proxy for political connections of U.S. firms for two reasons. First, lobbying
expenses are objective and avoid the subjectivity of other measures of political connections used
6 Goldman, Rocholl, and So (2008) examine the relation between firm value and campaign contributions as a
robustness check. The authors find that firm value is unrelated to campaign contributions.

7
in the literature.7 Second, the continuous nature of lobbying expenditures provides an improved
way to quantify the degree of firms’ political connectedness; increased lobbying expenses imply
stronger political connections. Therefore, this examination of the determinants and shareholder
wealth effects of corporate lobbying extends the political connections literature by providing
further evidence of the benefits provided by political connections.
I. Determinants of Corporate Lobbying
The expected net present value of corporate lobbying should be influenced by firm-
specific characteristics, affecting both the potential change in firm value associated with desired
changes in policies as well as the likelihood of the desired outcome occurring. Accordingly, we
expect certain firm-specific characteristics to influence lobbying behavior.
The first proposed determinant of corporate lobbying is firm size. Agrawal and Knoeber
(2001) mention that politics matter more for larger firms because of increased political
oversight.8 That is, political visibility increases with size. Accordingly, lobbying may be more
valuable to larger firms, so we expect a direct relation between lobbying and firm size.
Next, we account for investment opportunities using the market-to-book ratio. Increased
investment opportunities imply more potential payoffs through which lobbying can benefit firms;
hence, we expect a direct relation between lobbying and investment opportunities. Similarly,
7 We note that Faccio’s (2006) definitions of political connections classify fourteen publicly traded US firms (out of
7,124) as politically connected, which may suggest these connections criteria are most appropriate for non-US firms.
Also, in terms of degree of political connections we argue that corporate lobbying affords firms the relatively same
degree of connection as other measures used in the political connections literature as many lobbyists are former
political insiders (Yu and Yu (2008) and www.opensecrets.org)). 8 Agrawal and Knoeber (2001) show that the incidence of politically useful directors is directly related to firm size.

8
Brown, Helland, and Kiholm-Smith (2006) and Aggarwal, Meschke, and Wang (2008) control
for the market-to-book ratio when estimating the determinants of corporate philanthropy and
campaign contributions, respectively.
Industry-specific conditions should be a determinant of corporate lobbying as the value
of lobbying likely varies across industries. Agrawal and Knoeber (2001) argue that the value of
political connections are affected by firms’ reliance on the government as a customer and the
degree of government regulation, where both factors vary by industry. Brown, Helland, and
Kiholm-Smith (2006) show that firms in more regulated industries are more likely to make
charitable contributions and suggest firms attempt to buy protection via philanthropy. Lobbying
could be similarly used by firms in industries sensitive to government oversight. We account for
variation in industry conditions affecting lobbying behavior using industry affiliation, degree of
dependence on intangible assets, and industry competitiveness.
We control for industry affiliation to account for general differences in government
involvement across industries using the Fama and French (1997) 49-industry classifications.
Another control for industry effects is corporate reliance on intangible assets via research and
development expenditures. Brown, Helland, and Kiholm-Smith (2006) show that corporate
philanthropy is directly related to research and development expenditures and rationalize this
result in that firms relying more heavily on intellectual properties should more highly value
investment in political capital because intangible assets may be more vulnerable to government
regulation, hence policy changes. Accordingly, we expect lobbying behavior to be directly
related to research and development expenses.
9
The last industry variable is concentration. Pittman (1976) shows that firms in more
concentrated industries make greater campaign contributions and suggests contributions are used
to curry political favor in terms of favorable changes in legislative policy. This is because the
benefits of policy changes should be greatest for firms in industries with fewer market
participants. Benefits provided by political capital in more competitive industries are spread
across all firms in the industry, not just firms with investments in political capital, introducing a
free rider problem. Accordingly, we expect lobbying to be directly related to industry
concentration. We measure industry competitiveness using the Herfindahl index, the annual sum
of squared market shares for all Compustat firms in each industry, where industries are defined
via Fama and French (1997) 49 industries. The Herfindahl index approaches a maximum value
of one as industry concentration approaches monopoly, so we expect lobbying to be directly
related to the Herfindahl index.
Our final independent variable is cash flow, which accounts for lobbying ability. Two
theories support a direct relation between lobbying behavior and cash flow. First, the benefit of
reduced taxes varies directly with the level of cash flow, increasing the incentive to lobby.
Richter, Samphantharak, and Timmons (2008) suggest lobbying efforts are successful in
reducing corporate taxes as their findings suggest that tax rates are negatively related to lobby
expenses. Second, firms with greater cash flow may lobby more actively simply because they
can, so lobbying may be a by-product of the agency problems associated with excess cash flow
(Jensen (1986)). Brown, Helland, and Kiholm-Smith (2006) and Aggarwal, Meschke, and Wang
(2008) find that corporate philanthropy and campaign contributions, respectively, are directly

10
related to cash flow, which suggests these forms of political expenditures are symptomatic of
agency problems associated with excess cash flow. Cash flow is measured as operating income
before depreciation net of interest expense, income taxes, and common dividends.
A. Model: The Determinants of Corporate Lobbying
We examine the factors influencing the corporate lobbying decision as well as lobbying
intensity using the following model:
(1) .
& _
,,
1,51,41,31,21,10,
titjj
titititititi
VariablesControl
CFHerfDRMBSizeVarLobby
To estimate the factors associated with lobbying participation, we estimate Equation (1) using
Probit regressions and define the dependent variable as Lobby_DV, a binary variable equal to one
if the firm reports lobbying expenses in year t, zero otherwise. While the Probit results are
helpful in determining factors influencing firms to lobby, factors associated with the degree to
which firms invest in lobbying are of interest as well. We use two econometric methodologies
for the lobbying intensity models. First, we use an OLS model specifying the dependent variable
as the natural logarithm of annual inflation-adjusted lobbying expenses (LN(AdjLobbyExp)) after
adding $1 to each lobby expenditure to preserve the sample due to the large number of non-
lobbying firm-years.9 Second, because of the large number of firm-years with no lobbying
9 A log-transformation is used because of the skewed lobbying data (see descriptive statistics in Table 1).
11
activity, we use Tobit regressions to estimate models specifying LN(AdjLobbyExp) as the
dependent variable.10
Independent variables specified in Equation 1 are defined as follows. Size is the natural
logarithm of assets in inflation-adjusted 2006 dollars.11
The market-to-book ratio, M/B, is the
ratio of the sum of market value of equity and total liabilities to total assets. R&D is the ratio of
research and development expenditures to sales. The Herfindahl index, HFI, is the annual sum
of squared market shares across the Fama and French (1997) industries. Cash flow, CF, is
operating income before depreciation minus interest expense, income taxes, and common
dividends divided by assets. We lag the financial variables thereby mitigating the potential for
reverse causality between the dependent and independent variables. For example, controlling for
contemporaneous cash flow could bias the results as successful lobbying could lead to an
increase in current period cash flow. It is unlikely that current period lobbying drives prior
period firm characteristics. Controls consists of fixed-effects for industry and time.
II. Data and Results
A. Data Source and Description
10
As shown in Table 1, thirty-five percent of the firm-years have no lobbying activity, which truncates the
distribution of the dependent variable. An additional motivation for the use of the Tobit methodology is due to the
censored nature of firm-reported lobbying data, as discussed in footnote 13. 11
Compustat abbreviations and (codes) for variables used are as follows: Sales (SALE, A12), Operating Income
Before Depreciation (OIBDP, A13), Income Taxes-Total (TXT, A16), Total Assets (AT, A6), Total Liabilities (LT,
A181), Interest Expense (XINT, A15), Common Shares Outstanding (CSHO, A25), Research and Development
Expenditures (XRD, A46), Price-fiscal Year Close (PRCCF, A199), Cash Dividends-Common (DVC, A21).
Market value of equity is Common Shares Outstanding* Price-fiscal Year Close.
12
Payments made by corporations to lobbying firms must be disclosed to the Secretary of
the Senate’s Office of Public Records (SOPR) as mandated by the Lobbying Disclosure Act of
1995. The Center for Responsive Politics (CRP) maintains a publicly available database that
tracks lobbying expenses, as reported to the SOPR, from 1998 to the present.12
Subsequently,
our lobby expenditure data is taken from the CRP website.13
The data consists of annual lobby expenditures for S&P 500 firms over the 1998 to 2006
period.14
Accounting data is obtained from Compustat. We delete observations with missing
Compustat data, duplicate values, the first observation for each firm, and to mitigate the
influence of outliers, firm-level ratios are winsorized at the one percent tails.15
Our final sample
consists of 3,045 firm-years consisting of 425 unique S&P 500 firms from 1999 to 2006.
B. Descriptive Statistics: Determinants of Lobbying
Table I shows sample characteristics for lobbying and non-lobbying sub-samples.
Approximately sixty-five percent of the firm-year observations, 1,967, engage in lobbying. For
lobbying firms, the mean and median annual lobbying expense is $1.273M and $0.581M,
12
The web address is www.opensecrets.org. 13
We should elaborate on a few of the nuances of the lobby data. As discussed at www.opensecrets.org, firms are
required to submit good faith estimates, rounded to the nearest $20,000, of all lobby expenses for each six month
period. Firms spending less than $10,000 in a six month period do not have to state lobby expenses, and the CRP
treats their lobby expenses as $0, which means lobbying expenditures are censored (lower end) as discussed in
footnote 10. The CRP provides annual lobbying expenses by summing the mid-year and year-end reported lobbying
expenditures. Further, the CRP attributes subsidiary lobby expenses to the parent firm. To check for reporting
errors, the SOPR matches lobby expenses reported by firms to revenues reported by lobbyists. The lobbying data
reported by the CRP does not include amounts spent on industry trade association lobbying and so is considered an
estimate of direct firm-level lobby expense. 14
Similarly, Goldman, Rocholl, and So (2008) collect campaign contributions data from the CRP website and
restrict their sample to S&P 500 firms. 15
The first observation for each firm is deleted because of the use of lagged values. We winsorize by all financial
ratios used in Equation (1).
13
respectively, showing positive skew in the distribution of lobby expenses across firms. The
measures of location for lobbying expenses indicate investments in lobbying are small expenses,
relative to assets or revenues, of S&P 500 firms.
The sub-samples are significantly different at the ten percent level or stronger for three of
the characteristics considered. Lobbying firms are larger, have fewer investment opportunities,
and are in more concentrated industries. The univariate results for size and concentration are
consistent with our expectations, unlike the result for investment opportunities.
Table II provides the sample distribution across time. The maximum and minimum
number of observations for a given year are 391 (2004) and 370 (1999), respectively. Columns 3
and 4 show a general increasing trend in the percentage of firms that lobby and in the sum of
annual lobbying expenses, respectively. From 1999 to 2006, annual lobbying expenditures
increases by roughly forty-nine percent. Columns 5 and 6 show growth in the average firm’s
lobbying expense.
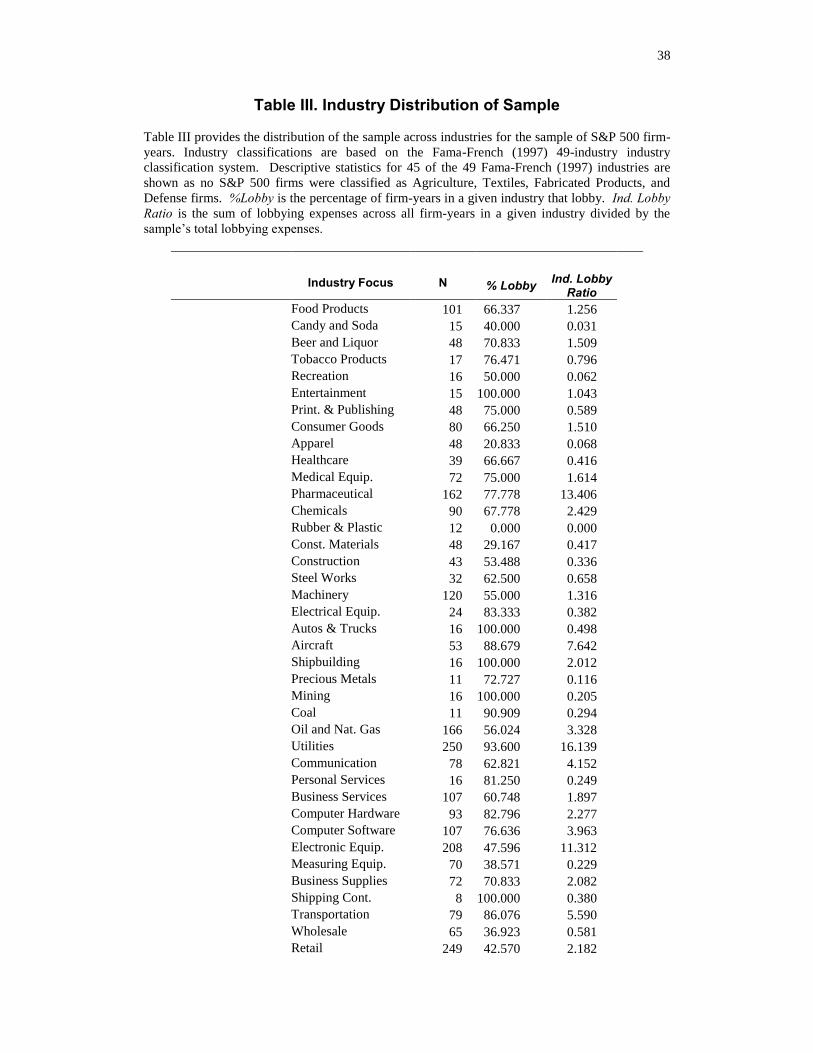
Table III provides the distribution of lobbying activity and expenditures by industry
affiliation.16
Descriptive statistics in Table III show substantial inter-industry variation in
lobbying. Column 4 of Table III presents the industry lobby ratio, calculated as the sum of
lobbying expenses across all years for all firms in an industry divided by the entire sample’s sum
of lobbying expenses. Pharmaceuticals and utilities industries have the two largest industry
lobbying ratios.
16
Forty-five industry classifications are reported in Table III as no S&P 500 firms are classified as Agriculture,
Textiles, Fabricated Products, and Defense firms.

14
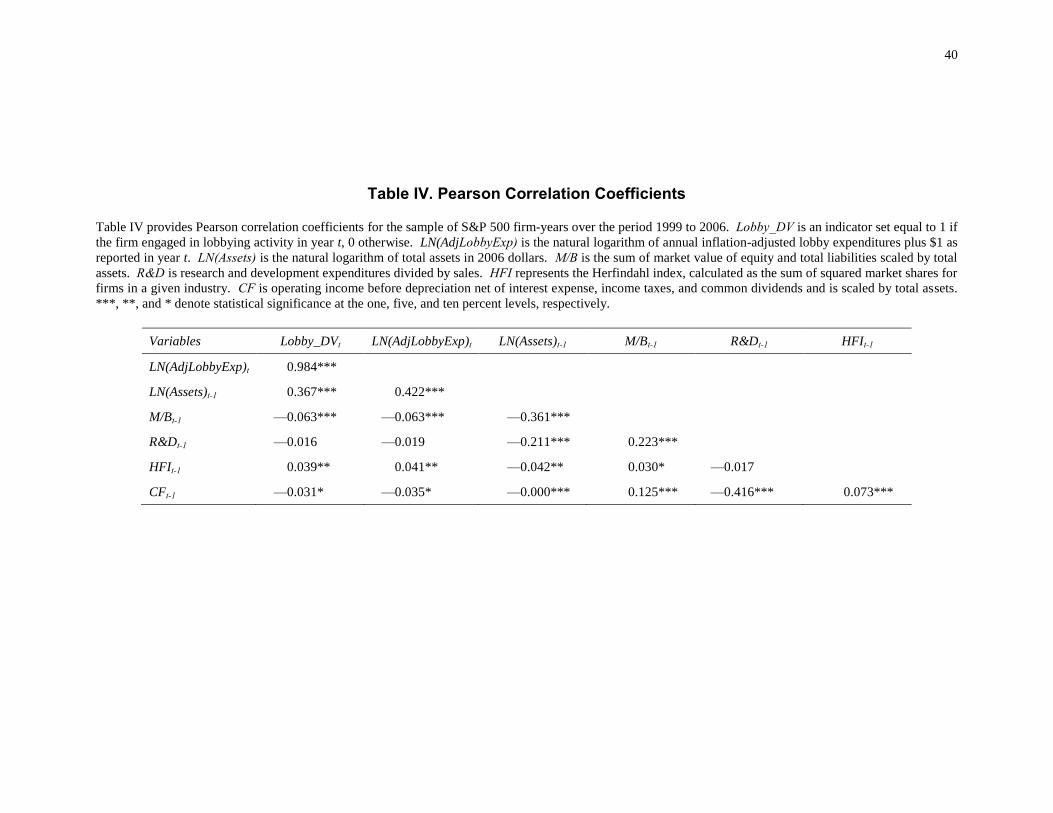
Table IV displays the Pearson correlation coefficients. The correlations are largely
consistent with the univariate results in Table I. Both corporate lobbying participation and
intensity are positively and significantly correlated with size and industry concentration. Further,
both lobbying proxies are inversely and significantly correlated with investment opportunities
and cash flow. We delay making further inferences as multivariate tests provide more
meaningful inferences.
C. Multivariate Results: Determinants of Lobbying
Table V presents Probit, OLS, and Tobit regressions estimating the determinants of
corporate lobbying behavior (Equation (1)). Each model includes industry and time dummies.17
Standard errors are robust and cluster at the firm level for Probit and OLS models.18
Results in columns 1 through 3 show corporate lobbying is directly related to lagged firm
size and is significant. The positive relation is robust across dependent variable and econometric
specification, indicating larger firms are significantly more likely to lobby and spend more on
lobbying, relative to smaller firms. Since lobbying expenditures represent our proxy for political
connections, the direct lobby-size relation is consistent with Agrawal and Knoeber’s (2001) view
17
Several of the industry dummies perfectly predict corporate lobbying participation (Probit models). Hence, we
combine the problematic industries, in lieu of dropping firms in these industries or dropping the industry dummies
altogether. The combinations include: Recreation-Entertainment; Rubber & Plastic-Construction Materials; Autos
& Trucks-Aircraft-Shipbuilding; Precious Metals-Mining-Coal-Oil-Natural Gas; Business Supplies-Shipping
Containers; Candy & Soda-Food Products. The standard Fama and French (1997) affiliations are used for the OLS
and Tobit models. 18
Standard errors are clustered at the firm level, as suggested by Petersen (2008) for corporate finance panel
datasets. Also, the statistical inferences are robust to the use of Newey-West (1987) standard errors, which correct
for both heteroskedasticity and autocorrelation.

15
that politics are more important to larger firms than smaller firms. Similarly, Brown, Helland,
and Kiholm-Smith (2006) and Aggarwal, Meschke, and Wang (2008) find corporate
philanthropy and campaign contributions, respectively, are directly related to firm size.
In columns 1 and 2 we find evidence of a direct relation between lobbying and
investment opportunities, proxied by the market-to-book ratio. The direct relation between
lobbying and the market-to-book ratio is consistent with lobbying being most lucrative for firms
with greater investment opportunities, all else constant. This initial evidence suggests
investment opportunities influence corporate lobbying.
While space constraints do not permit us to tabulate results for the Fama-French (1997)
industry dummies, a comment is in order. Using the retail industry as the base case, the industry
dummies measure industry differences in lobbying behavior. Untabulated industry results (OLS)
show that the investment in lobbying is significantly different (ten percent level or stronger) from
firms in the retail industry for twenty-three of the industry affiliations.19
These results support
univariate results showing substantial industry-level variation in lobbying.20
Results in columns 1 through 3 largely indicate that neither intangible assets via research
and development expenses nor industry concentration have a statistically distinguishable impact
on lobbying behavior. However, the strong correlation between industry affiliation and both
19
Industries with significantly greater lobbying expenditures include Entertainment, Healthcare, Medical
Equipment, Pharmaceuticals, Electrical Equipment, Automobiles, Aircraft, Shipbuilding, Precious Metals, Mining,
Coal, Utilities, Personal Services, Business Services, Hardware, Software, Business Supplies, Shipping Containers,
Transportation, and Restaurants, etc. Industries with significantly reduced lobbying expenditures include Rubber
and Plastic and Real Estate. 20
While we find no differences in the lobbying of finance firms (banks and insurance companies) and retail firms, a
comment is in order. Regulation of banks and insurance firms generally occurs at the state level, so these firms also
lobby through industry trade association, which is not accounted for in the lobby expense data.

16
research and development expense and industry concentration. Thus, we re-estimate the models
(columns 1 through 3) without industry dummies and find that lobbying is directly related to
research and development expense.21
We find evidence that lobbying is directly and
significantly related to industry concentration, but the results are not robust.22
Importantly, we find no evidence of a significant relation between lobbying and cash
flow.23
This indicates that the ability to afford lobbying expenses has no bearing on lobbying
behavior. This is a key result as Brown, Helland, and Kiholm-Smith (2006) and Aggarwal,
Meschke, and Wang (2008) find that corporate philanthropy and campaign contributions,
respectively, are directly related to cash flow, suggesting philanthropy and campaign
contributions represent management consumption of perquisites. Thus, our insignificant lobby-
cash flow relation indicates differences in motives across different types of corporate political
spending. While campaign contributions and philanthropy appear to be functions of perquisite
consumption by management, our evidence indicates lobbying is used strategically as an
investment.
Unreported results for the time dummies show that lobbying activity has significantly
increased over time, even after controlling for other factors. These results confirm descriptive
statistics showing increased corporate lobbying activity. Overall, the results presented in Table
21
The variance inflation factors show some degree of collinearity between the Herfindahl Index and a handful of the
industry dummies. Given that multicollinearity does not bias the results, we leave the collinear variables in the
model to ensure that the results do not suffer from omitted variables bias. 22
Specifically, we find that lobbying participation is unrelated to industry concentration. However, lobbying
intensity is directly related to industry concentration, and the strength of the relation varies by econometric
methodology. 23
While it is possible that size absorbs the positive effect of cash flow, we do not find that this is the case. To
determine whether this is a valid issue, we re-estimate the models after dropping size and still find an insignificant
lobbying-cash flow relation.
17
V are robust across dependent variable specification as well as econometric methodology
(Probit, OLS, and Tobit) and indicate the primary determinants of both lobbying participation
and intensity are firm size, investment opportunities, and industry affiliation. From these results
we infer that corporate lobbying is primarily influenced by the expected net present value of
lobbying, not an ability to lobby.
D. Robustness Checks
We assess the sensitivity of our results to validate and strengthen the implications of our
initial evidence regarding the determinants of corporate lobbying. We re-estimate the models
after including the lagged dependent variable to account for historical and/or unobserveable
factors that cause differences in current period lobbying, which should further mitigate the
potential for omitted variables bias.
Results for lobbying participation and lobbying intensity models after re-estimating
Equation (1) with the lagged dependent variable are tabulated in columns 4 through 6. Results
show current period lobbying is directly related to prior period lobbying, indicating persistence
in lobbying behavior. Similar to prior results, the results controlling for inertial effects show
lobbying is directly related to firm size and the market-to-book ratio and unrelated to cash flow.
Two different results emerge once we include the lagged dependent variable. First, both
lobbying participation and intensity are directly related to research and development
expenditures. Brown, Helland, and Kiholm-Smith (2006) also find a direct relation between
corporate philanthropy and research and development expenses. The direct lobby-research and

18
development expense relation may be due to firms relying more heavily on intellectual properties
placing a greater emphasis on investments in political capital because intangible assets may be
more vulnerable to government regulation, as argued by Brown, Helland, and Kiholm-Smith
(2006). Another difference in results is that lobbying intensity is directly related to the
Herfindahl index, indicating firms in more concentrated industries have greater lobby
expenditures. This direct relation is consistent with the expectation that the benefits of changes
in operating environments, stimulated by lobbying, are more valuable to firms in industries with
fewer competitors. Overall, the results are robust after accounting for unobserved factors via
prior period lobbying.
In untabulated results, we examine whether the results are sensitive to extreme lobbying.
First, we re-estimate the models after dropping observations with the twenty largest lobby
expenditures.24
The models are robust as lobbying behavior is significantly related to size,
investment opportunities, research and development expenditures, and industry affiliation.
Second, to determine whether the results are driven by observations in certain industries that are
most heavily engaged in lobbying, we re-estimate the models after dropping the industries with
the five largest lobbying intensity ratios in Table III.25
The results are robust as each model
shows the determinants of lobbying behavior consist of size, investment opportunities, and
industry affiliation. Evidence concerning the relation between lobbying and research and
development expenditures is mixed.
24
This restriction is equivalent to dropping observations with inflation-adjusted lobbying expenditures greater than
$9.12M. 25
These industries include Utilities. Pharmaceutical, Electronic Equipment, Aircraft, and Transportation.
19
III. Marginal Value of Corporate Lobbying
The second objective of our study is to provide evidence of shareholder wealth effects
due to corporate lobbying. This objective addresses whether lobbying is a value increasing
investment and is important given research showing other forms of political spending result from
agency conflicts (Brown, Helland, and Kiholm-Smith (2006) and Aggarwal, Meschke and Wang
(2008)). Grossman and Helpman (1994) argue that the incentives to influence legislation arises
from the impact that policy changes can exert on the fortunes of firms. Contemporaneous
lobbying research supports Grossman and Helpman’s (1994) conjecture as evidence presented by
Richter, Samphantharak, and Timmons (2008), and Alexander, Scholz, and Mazza (2009))
suggests lobbying can benefit firms via reduced taxes. Faccio (2006) discusses specific benefits,
in addition to reduced taxes, provided by political connections, including preferential treatment
in competition for government contracts and by government enterprises and relaxed regulatory
oversight or stricter oversight of competitors.26
Chen, Parsley, and Yang (2008) argue that firms
lobby for defensive purposes that – if successful—lead to an unobserved outcome as defensive
lobbying is used to maintain existing conditions rather than altering current policies.
Accordingly, it is difficult to quantify the monetary value of policy outcomes influenced by
lobbying. However, we can exploit the market’s perception of the benefits provided by lobbying
to estimate the dollar value of lobbying.
26
Also, Stigler (1971) mentions government provisions affecting corporate value.

20
A. Model: Marginal Value of Corporate Lobbying
We examine the relation between firm value and lobbying using a variant of the valuation
framework provided by Faulkender and Wang (2006).27
We define the dependent variable as
excess returns, calculated as the firm’s annual return minus the return on its benchmark portfolio,
using the Fama and French (1993) size and book-to-market portfolios. The independent
variables control for factors influencing firm-value, including profitability, and financing and
investment policy. By including a proxy for lobbying, we are able to test whether investors
incorporate lobbying activity into stock prices. The Faulkender and Wang (2006) model
provides a strong test for the valuation of lobbying as the control variables are theory-based
factors influencing returns, which mitigates the potential for omitted variables bias as well as the
potential endogeneity of lobbying. Each independent variable is scaled by the lagged market
value of equity and the dependent variable is the annual percentage change in market value. As
discussed by Faulkender and Wang (2006), the model’s coefficients can be interpreted as the
incremental change in shareholder wealth associated with a $1 change in the independent
variable.
The valuation framework used to estimate the value of corporate lobbying expenses is:
)(ControlsLevMktVal
NF
MktVal
Div
MktVal
IntExp
MktVal
DR
MktVal
Assets
MktVal
Earn
MktVal
LobbyExpRr
titjji,t
ti
ti
ti
ti
i,t-
ti
i,t-
ti
ti
ti
i,t-
ti
i,t-
i,t-Btiti
2 ,
&
-
,,8
1,
,
7
1,
,
6
1
,
5
1
,
4
1,
,
3
1
,
2
1
1
10,,
27
Faulkender and Wang (2006) estimate the market value of cash. Subsequent papers by Dittmar and Mahrt-Smith
(2007) and Klasa, Maxwell, and Ortiz-Molina (2008) use Faulkender and Wang’s (2006) methodology to examine
various issues pertaining to the value of cash.
21
where ΔX indicates a change in X from period t-1 to t.28
The dependent variable is the change in
firm value, measured by firm i’s annual stock return over the year t-1 to t minus its benchmark
portfolio return during year t. The benchmark portfolios are the Fama and French (1993) size
and book-to-market value-weighted portfolios.
We proxy lobby activity using the ratio of lagged lobby expense to the lagged market
value of equity. Prior period lobbying offers several advantages. First, institutional difficulties
in changing policies imply future payoffs to lobbying; this is supported by results showing
financial operating performance is directly related to prior period lobbying (Chen, Parsley, and
Yang (2009)). Second, lobbying expenditure data is generally not disclosed in a timely or
transparent way to investors.29
Subsequently, we expect lobbying investments to be capitalized
into equity prices over time. Finally, using prior period lobbing reduces the likelihood of
reverse causality bias as improved current period market performance could influence firms to
lobby more in the current period.
The coefficient of interest is γ1, the incremental change in shareholder wealth attributable
to an additional $1 spent on lobbying in the prior year. Estimates for the marginal value of
lobbying show the degree to which lobbying affects shareholder wealth.
28
Since Faulkender and Wang’s (2006) objective was to estimate the marginal value of cash, the authors split total
assets into cash and net assets. Since our study has no bearing on the value of cash, we replace net assets and cash
with total assets. Also, we control for time and industry dummies. The remaining difference in models is our
inclusion of the lobbying variable. 29
For a similar reason, Aggarwal, Meschke, and Wang (2008) examine the lagged effect of corporate campaign
contributions on firm-value. Also, the authors argue that the long-term potential payoffs to political spending
necessitate the use of longer-horizon returns rather event study windows, which supports our use of the Faulkender
and Wang (2006) model.

22
The remaining independent variables are defined similarly to those of Faulkender and
Wang (2006) and control for factors affecting firm value, including profitability (Earn),
financing (IntExp, Div, NF, and Lev) and investment policy (Assets and R&D). Independent
variables other than Lev are scaled by the lagged market value of equity (MktVal).30
In addition
to the controls used by Faulkender and Wang, we include industry (Fama and French (1997)) and
time indicator variables. This vector of controls, generally accepted to influence firm value,
reduces the likelihood of endogeneity problems associated with controlling for lobbying
expenses.
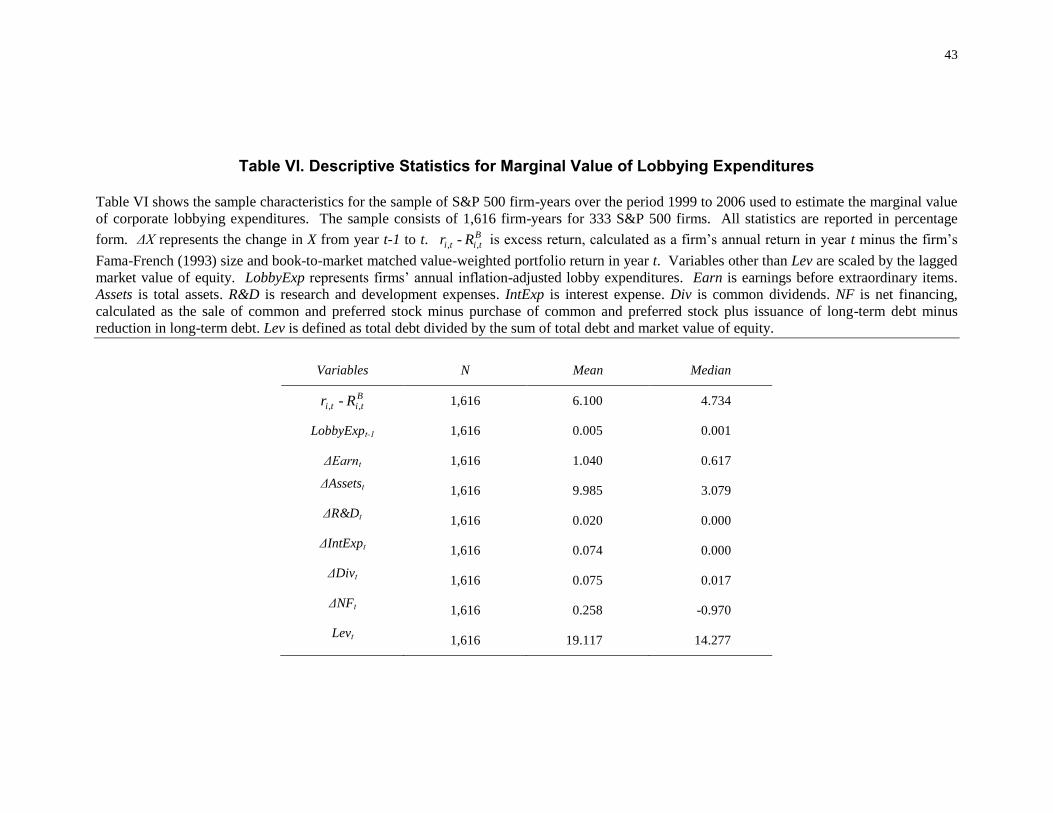
B. Descriptive Statistics: Marginal Value of Corporate Lobbying
The descriptive statistics for the variables used to estimate the marginal value of lobbying
appear in Table VI. The final sample of lobbying and non-lobbying firms consists of 1,616 firm-
years for 333 unique S&P 500 firms over the 1999 to 2006 period. The sample is winsorized at
the one percent tails for each of the financial ratios included in Equation (2).31
Mean and median
30
The variables are defined as in Faulkender and Wang (2006) and Dittmar and Mahrt-Smith (2007). Complete
variable definitions and calculations, along with Compustat mnemonics and codes, are as follows. MktVal is market
value of equity (Share Price (PRCCF:199)*Shares(CSHO:25)); Earn is earnings before extraordinary items (Income
before extraordinary items (IB:18) + Interest expense (XINT:15) + Deferred taxes (TXDI:50) + Investment tax
credit (ITCI:51)); Assets is assets (AT:6); R&D is research and development expenses (XRD:46, set equal to zero if
missing); IntExp is interest expense (XINT:15); Div is common dividends (DVC:21); NF is net financing (Sale of
Common and Preferred Stock (SSTK:108) minus Purchase of Common and Preferred Stock (PRSTKC: 115) plus
Issuance of Long-Term Debt (DLTIS:111) minus Reduction in Long-Term Debt (DLTR); Lev is leverage ratio,
calculated as total debt (Long-Term Debt (DLTT:9) + Debt in Current Liabilities (DLC:34)) divided by the sum of
total debt and market value of equity. 31
The sample size is smaller than for the determinants of lobbying sample because of additional data requirements
needed to estimate the Faulkender and Wang (2006) model. Namely, Compustat’s coverage of the following
variables particularly reduces our sample size: Deferred taxes (TXDI:50), Investment tax credit (ITCI:51)), Sale of
Common and Preferred Stock (SSTK:108), Purchase of Common and Preferred Stock (PRSTKC: 115), Issuance of
Long-Term Debt (DLTIS:111), Reduction in Long-Term Debt (DLTR).
23
excess returns are roughly six and five percent, respectively, consistent with abnormal returns
being positively skewed. Differences in descriptive statistics, relative to Faulkender and Wang
(2006), are due to differences in sample firms and sampling periods. Specifically, our sample
consists of S&P 500 firms, while Faulkender and Wang (2006) study all U.S. publicly traded
firms. Also, Faulkender and Wang (2006) examine the 1972 through 2001 period, while we
examine the 1999 through 2006 period. Still, measures of location for several of the control
variables are similar to those reported by Faulkender and Wang (2006). The descriptive statistics
for lobbying expenses as a percentage of market capitalization echo earlier results showing that
lobbying expenditures are a small expense for publicly traded firms.32
C. Marginal Value of Corporate Lobbying Activity
Results in Table VII present the marginal value of lagged lobby expenditures and the
estimates for the control variables. As in Faulkender and Wang (2006), results in column 1 are
estimated using pooled OLS and use robust standard errors that allow for firm-level clustering.33
Results for control variables are similar to those provided by Faulkender and Wang (2006).
Column 1 results are estimated using the full sample of lobbying and non-lobbying firms.
The estimate for γ8 is positive and significant at the one percent level, indicating that even after
accounting for firm-specific risk in the dependent variable and controlling for firm characteristics
known to affect market value, the change in shareholder wealth is directly associated with
32
Using the full sample of lobbying and non-lobbying firms, we tests for differences in the excess returns across
sub-samples and find no significant differences in abnormal return performance. 33
Results are robust using Newey-West (1987) standard errors.
24
lobbying. Further, the significance of the value-lobby relation shows corporate lobbying is a
priced factor.
Results showing a direct relation between firm value and lobbying are revealing
considering Aggarwal, Meschke and Wang (2008) find that firm value is negatively related to
corporate campaign contributions. Differences in the market value impacts of these forms of
political spending indicate markets differentiate between lobbying and campaign contributions.
Further, the market value results are strengthened as we show that, unlike campaign
contributions, lobbying is unrelated to cash flow, which supports the agency explanation for
corporate campaign contributions. Overall, our results complement those presented by
Aggarwal, Meschke and Wang (2008) in terms of the effectiveness of political spending as our
market value results suggest lobbying is an effective form of political spending.
The statistically significant marginal value of lobbying estimate also has important
economic implications as it indicates that each additional dollar spent on lobbying in the prior
year increases shareholder wealth by roughly $199 in the following year. Alexander, Scholz,
and Mazza (2009) calculate a mean ratio of tax savings to lobby expenses suggesting a 22,000
percent return on investment from lobbying. We believe our estimate for the dollar return on
lobbying has greater economic and statistical meaning as we estimate the return to lobbying
within a multivariate framework.34
Further, our return to lobbying estimate captures the
34
Alexander, Scholz, and Mazza (2009) calculate the return on lobbying by scaling the tax savings in 2004 by
lobbying expenses and do not examine the wealth implications of corporate lobbying within a multivariate
framework. Our return on lobbying estimate of roughly 19,800% ((199-1)/1) may be less than the return on
lobbying estimated by Alexander, Scholz, and Mazza (2009) because of differences in methodologies as we use a
multiple regression approach. Also, they calculate the lobbying return on investment only for lobbying firms.

25
market’s assessment of all of the benefits associated with lobbying, not just tax savings, that are
impounded into equity values.
Our estimate for the return on lobbying has further economic meaning given the annual
average lobbying expense of lobbying firms. Specifically, the sampled lobbying firms spend, on
average, $1.273M (Table 1) per year on lobbying. This suggests the incremental change in
shareholder wealth created by prior period lobbying is in excess of $253M, on average. Despite
the small scale of lobbying expenditures, relative to corporate cash flows, the effect of lobbying
is economically large because of the high returns on investment from lobbying.35
The economically significant returns to lobbying are also important given investments
typically made by firms. Fama and French (1999) find the internal rate of return earned by the
average firm is approximately 7.38 percent. Further, Sougiannis (1994) finds that the market
value contribution of an additional dollar spent on research and development is roughly $5.
The direct expenditures reported to the government are plausibly the minimum amount
firms spend on lobbying. Lobbying may be underreported as spending on indirect lobbying via
trade associations or other types of organizations are not reported as lobbying expenditures.
Thus, the observable lobbying data may serve as a proxy for actual lobbying expense. If the
observable lobbying data is less than actual amounts spent on lobbying, then the marginal value
estimate for lobbying would be an upper bound estimate. However, Chen, Parley, and Yang
(2009) argue that firms may lobby for defensive purposes, implying the full benefit from
lobbying is unobservable (e.g., an averted or postponed loss). Depending on the extent to which
35
De Figueiredo and Silverman (2006) also show a significant effect of lobbying for Universities. They find that
the marginal value of lobbying ranges from $1.56 to $5.24 for their sample of universities that lobby.

26
the market can discern the value implications of defensive lobbying, the marginal value of
lobbying results may be understated. Thus, it is difficult to determine whether our estimate for
the market value of lobbying represents an upper or lower bound. Regardless, the direct
association between market value and lobbying is important in a broad sense as it implies that
political connections made via lobbying add substantially to firm value, consistent with the
political connections literature showing connected firms outperform unconnected firms (Fisman
(2001), Faccio (2006), Faccio and Parsley (2007), and Goldman, Rocholl, and So (2008)).
D. Reported Robustness Tests
It is conceiveable that lobbying firms are simply better at predicting the passage of
certain legislation and thus lobby more in anticipation of the win, which could cause a spurious
positive and significant relation between firm value and lobbying. To address this concern we
provide several robustness tests. First, we determine whether the direct relation between firm-
value and lobbying is robust after accounting for firm-specific heterogeneity by dropping the
time invariant industry dummies and re-estimating Equation (2) using fixed-effects. Firm fixed-
effects should account for heterogeneity across firms in the ability to predict the passage of
legislation, an effect that may otherwise be attributed to the lobbying variable. The estimate for
the marginal value of lobby expenditures using fixed-effects (column (2)) is $604, roughly three
27
times the initial estimate. Hence, after accounting for fixed-effects, the direct relation between
shareholder wealth and lobbying is still economically and statistically significant.36
In addition to potential bias caused by an ability to anticipate a beneficial change in
legislation, lobbying is a choice variable, which could mean the results suffer from self-selection
bias. As a first pass, we determine whether the results are sensitive to the sample by restricting
the sample to firm-years reporting lobby expenses as non-lobbying firms may expect reduced
expected economic benefits from lobbying, which could bias downward the estimated marginal
value of lobbying for lobbying firms. Results in column 3 show the marginal value of lobbying
estimate increases to $232, indicating the realized benefits from lobbying are greater for
lobbying firms, relative to non-lobbying firms. Recognizing the potential self-selection bias
caused by restricting the sample to lobbying firms, we estimate a Heckman-Probit (1979) self-
selection model using the Probit equation used in column 4 of Table V, where the exclusion
restrictions consist of the determinants of lobbying participation. After estimating the selection
equation, we calculate the inverse Mill’s Ratio (λ) and include it as a control variable in the value
regression. Results in column 4 of Table VII show the marginal value of lobbying estimates are
robust to self-selection bias as the marginal value estimate of lagged lobbying exceeds the initial
value and is significant at the one percent level.37
Further, λ is insignificant indicating no sample
selection bias for the restricted sample. Thus, the endogeneity of the lobbying decision does not
appear to influence the marginal value of lobbying results
36
Further, the results are robust after estimating random-effects as well, which also allows us to control for industry
affiliation. 37
The sample size for Heckman-Probit results (column 4) is less than that for the restricted model (column 3)
because of the additional data requirements needed to estimate the selection equation.
28
Another way to determine if firm value and lobbying are spuriously related via increased
lobbying in anticipation of changes in legislation, is to provide evidence regarding the sensitivity
of the results with respect to extreme lobbying activity. This is because firms with an improved
ability to anticipate policy changes may lobby the most intensively to ensure the favorable policy
outcome. Thus, dropping firms with extreme lobbying activity should mitigate this concern.
Further, this robustness check reduces the likelihood of the marginal value of lobbying estimates
being driven by a handful of firms for which lobbying proved to be especially lucrative. The
restrictions used are similar to those used in the determinants of lobbying section.38
We first re-
estimate Equation (2) after dropping the observations with the twenty largest lobby
expenditures.39
Results in column 5 are quantitatively and qualitatively unchanged as the
marginal value of lobbying estimate is positively signed and significant at the one percent level.
Interestingly, after dropping the observations with the twenty largest lobbying expenditures, both
the marginal value of lobbying estimate and its t-statistic increase, relative to the original results
in column 1.
To determine whether results are unduly influenced by firms in industries most heavily
engaged in lobbying, we re-estimate Equation (2) after dropping observations in industries with
the five largest lobbying intensity ratios (Table III).40
Results in column 6 confirm earlier
38
Results in columns 5 through 7 are estimated using the full sample, extreme lobbying activity sample restriction
notwithstanding, of lobbying and non-lobbying firms. 39
This restriction is equivalent to dropping observations with inflation-adjusted lobbying expenditures greater than
$9.348M. Note that this restriction is enforced coupled with winsorizing the data at the one percent level of each tail
of the financial ratios included in Equation (2), which includes the ratio of lagged lobby expenditures to lagged
market value of equity. 40
We drop observations in the following industries: Utilities, Pharmaceutical, Electronic Equipment, Aircraft, and
Transportation.

29
findings. The estimated coefficient loses statistical strength but is still significant at the five
percent level. Overall, the reported robustness tests suggest the direct association between firm
value and lobbying is not spurious.
E. Untabulated Robustness Tests
Another potential explanation for our results is that perhaps better performing firms
simply lobby more heavily. We alleviate this concern by individually including the lagged value
of the dependent variable and the lagged change in earnings as control variables. These
additional independent variables should account for the better performing firm effect. The initial
results are robust as firm value and lobbying are still directly related.
In untabulated results, we examine the sensitivity of the results to alternate dependent
variable specifications.41
Specifically, we replace the Fama-French (1993) value-weighted
benchmark portfolio with the following: Fama-French (1993) equally-weighted benchmark
portfolio, CRSP equal and value-weighted portfolios, and raw returns. The results are robust as
the marginal value of lobbying estimate is still positive and significant.
As a final robustness check, we assess our results with respect to overall model
specification using Fama and French (1998) value regressions.42
We augment the Fama and
French (1998) methodology by including the level of lobby expenses scaled by total assets as
well as the lagged and future two-year change in lobby expenses to total assets. Although the
41
Untabulated results are available upon request. 42
Fama and French (1998) use the value regressions to estimate the impact of taxes on firm value via the market
values of leverage and dividends.

30
current period lobby expense ratio is insignificant, the lagged two-year change in lobby expenses
is positive and significant. This result allows a similar inference to our initial results: prior
period lobbying leads to increased shareholder wealth. Results using an alternate model
specification (Fama and French (1998)) confirm our initial marginal value of lobbying results.
Overall, the results show that firm value is directly associated with firm value, even after
controlling for factors know to influence shareholder wealth, which reduces the likelihood of
omitted variables bias. Further, we show that the direct value-lobbying relation is robust to
various issues.
IV. Conclusion
This paper provides an examination of the factors influencing corporate lobbying and
reports evidence concerning lobbying as an investment. Almost two-thirds of the S&P 500 firm-
year observations in our sample lobby, and the factors influencing firms to lobby along with the
impact of lobbying on firm value are open questions.
Our results indicate the primary determinants of lobbying are firm size, investment
opportunities, and industry fixed-effects. We find no relation between lobbying and cash flow,
which contrasts with evidence presented for other forms of political spending showing corporate
philanthropy and campaign contributions are directly related to cash flow. We interpret our
results as evidence that the corporate motives for political spending vary based on type of
political spending. Specifically, the lack of a significant lobby-cash flow relation provides
evidence that the primary motivation for lobbying is to increase shareholder wealth, while other
forms of political spending arise from agency problems. Further, the insignificant lobbying-cash
31
flow relation indicates a reduced ability to lobby (low cash flow) does not constrain firms’
lobbying, implying that firms choose not to lobby because they view lobbying as a negative net
present value investment.
Our second objective is to quantify the value of lobbying and results indicate an extra
dollar spent on prior period lobbying increases current period market value by roughly $200.
The economic significance of the marginal value of lobbying is important as it is much larger
than the average internal rates of return earned on other corporate investments and research and
development expenditures (Fama and French (19990 and Sougiannis (1994)). Further, the size of
the marginal value of lobbying estimate suggests lobbying can be a strategically effective way to
increase firm value.
The direct firm value-lobbying relation is also important when coupled with results from
previous research showing differences in the shareholder wealth effects of different forms of
political spending. Specifically, firm value is negatively related to campaign contributions
(Aggarwal, Meschke, and Wang (2008)) suggesting the market views campaign contributions as
a function of agency problems, unlike lobbying. Thus, our results are important in a broad
context as we show the outcomes of political spending depend on the type of political spending.
Given the large returns to lobbying, a relevant question concerns the relative paucity of
funds spent on lobbying. The determinants of lobbying results shed some light on this by
indicating that lobbying behavior is related to size, investment opportunities, and industry
affiliation, from which we infer that lobbying is not lucrative for all firms. Our results showing
lobbying confers significant benefit to firms and is not a by-product of excess free cash flow

32
calls into question investor relation groups that criticize corporate lobbying expenses.
33
References
Aggarwal, R., F. Meschke, and T. Wang, 2008, Corporate Political Contributions: Investment or
Agency?, Working Paper, University of Minnesota.
Agrawal, A. and C. Knoeber, 2001, Do Some Outside Directors Play a Political Role?, Journal
of Law and Economics 44, 179-198.
Alexander, R., S. Scholz, and S. Mazza, 2009, Measuring Rates of Return for Lobbying
Expenditures: An Empirical Analysis Under the American Jobs Creation Act, Working
Paper, Kansas University.
Brown, W., E. Helland, and J. Kiholm-Smith, 2006, Corporate Philanthropic Practices, Journal
of Corporate Finance 12, 855-877.
Chen, H., D. Parsley, and Y. Yang, 2009, Corporate Lobbying and Financial Performance,
Working Paper, Vanderbilt University.
Claessens S., E. Feijen, and L. Laeven, Political Connections and Preferential Access to Finance:
The Role of Campaign Contributions, Journal of Financial Economics 88, 554-580.
De Figueiredo, J. and B.Silverman, 2006, Academic Earmarks and the Returns to Lobbying,
Journal of Law and Economics 49, 597-625.
Dittmar, A. and J. Mahrt-Smith, 2007, Corporate Governance and the Value of Cash Holdings,
Journal of Financial Economics 83, 599-634.
Faccio, M, 2007, The Characteristics of Politically Connected Firms, Working Paper, University
of Purdue.
Faccio, M, 2006, Politically Connected Firms, American Economic Review 96, 369-385.
Faccio, M and M. Parsley, 2008, Sudden Deaths: Taking Stock of Geographic Ties, Journal of
Financial Quantitative Analysis, Forthcoming.
Faccio, M., R. Masulis, and J. McConnell, Political Connections and Corporate Bailouts, Journal
of Finance 61, 2597-2635.
Fama, E., and K. French, 1997, ―Industry Costs of Equity,‖ Journal of Financial Economics 43,
153-193.
34
Fama, E. and K. French, 1998, Taxes, Financing Decisions, and Firm Value, Journal of Finance
53, 819-843.
Fama, E., and K. French, 1999, The Corporate Cost of Capital and the Return on Corporate
Investment, Journal of Finance 54, 1939-1967.
Faulkender, M. and R. Wang, 2006, Corporate Financial Policy and the Value of Cash,
Journal of Finance 61, 1957-1990.
Fisman, R., 2001. Estimating the Value of Political Connections, American Economic Review 91,
1095-1102.
Goldman, E., J. Rocholl, and J. So, 2008, Do Politically Connected Boards Affect Firm Value?,
Review of Financial Studies, Forthcoming.
Goldman, E., J. Rocholl, and J. So, 2009, Political Connections and the Allocation of
Procurement Contracts, Working Paper, University of North Carolina.
Grossman, G. and E. Helpman, 1994, Protection for Sale, American Economic Review 84, 833-
850.
Heckman, J. 1979, Sample Selection Bias as a Specification Error, Econometrica 47, 153-161.
Klasa, S., W. Maxwell, and H. Ortiz-Molina, 2008, The Strategic Use of Corporate Cash
Holdings in Collective Bargaining with Labor Unions, Journal of Financial Economics,
Forthcoming.
Navarro, P., 1988, Why Do Corporations Give to Charity? Journal of Business 61, 65-93.
Newey, W. and K. West, 1987, A Simple, Positive Semi-Definite, Heteroskedasticity and
Autocorrelation Consistent Matrix, Econometrica 55, 703-708.
Petersen, M., 2008, Estimating Standard Errors in Finance Panel Data Sets: Comparing
Approaches, Review of Financial Studies, Forthcoming.
Pittman, R., 1976, The Effects of Industry Concentration and Regulation on Contributions in
Three 1972 U.S. Senate Campaigns, Public Choice 23, 71-80.
Pittman, R., 1977, Market Structure and Campaign Contributions, Public Choice 31, 37-52.
35
Richter, B., K. Samphantharak, and J. Timmons, 2008, Lobbying and Taxes, Working Paper,
UCLA.
Snyder, J., 1986, Campaign Contributions as Investments: The U.S. House of Representatives,
1980-1986, Journal of Political Economy 98, 1195-1227.
Sougiannis, T., 1994, The Accounting Based Valuation of Corporate R&D, Accounting Review
69, 44-68.
Stigler, G., 1971, The Theory of Economic Regulation, The Bell Journal of Economics and
Management Science 2, 3-21.
Yu, F. and X. Yu, 2008, Corporate Lobbying and Fraud Protection, Working Paper, University
of Indiana.

36
Table I. Differences in Firm Characteristics: Lobbying and non-Lobbying Firms
Table I provides descriptive statistics for the sample that consists of 3,045 firm-years for 425 S&P 500 companies over the period 1999 to
2006. The lobbying and non-lobbying sub-samples consist of 1,967 and 1,078 firm-years, respectively. LobbyExp represents firms’ annual
inflation-adjusted lobby expenditures in year t. Assets is inflation-adjusted total assets in billions. M/B is the sum of market value of equity
and total liabilities scaled by total assets. R&D is research and development expenditures divided by sales. HFI represents the industry level
Herfindahl index, calculated as the sum of squared market shares for firms in a given industry. CF is operating income before depreciation net
of interest expense, income taxes, and common dividends and is scaled by total assets. ***, **, and * represent statistical significance at the
one, five, and ten percent levels, respectively.
Variables
Lobbying Firms (1)
Non-Lobbying Firms
(2)
Difference in Means (1) – (2)
N Median Mean N Median Mean Difference T-Stat
LobbyExpt ($M) 1,967 0.581 1.273 1,078 n/a n/a n/a n/a
Assetst-1 ($B) 1,967 11.270 15.977 1,078 3.788 7.325 8.652***
18.980
M/Bt-1 (Ratio) 1,967 1.672 2.409 1,078 1.907 2.773 –0.364***
–3.500
R&D t-1 (%) 1,967 0.000 4.162 1,078 0.000 4.765 –0.600
–0.860
HFIt-1 (%) 1,967 6.449 8.632 1,078 6.237 8.064 0.600**
2.170
CFt-1 (%) 1,967 8.052 8.365 1,078 9.167 8.890 –0.520 –1.430

37
Table II. Time Distribution of Sample
Table II provides the distribution of the sample across time for the sample of S&P 500 firm-years. %Lobby is the percentage of firms that lobby
in a given year. Sum of LobbyExp is total amount spent on lobbying in a given year. Mean LobbyExp_All represents the mean annual amount
spent on lobbying (inflation-adjusted) for both lobbying and non-lobbying firms. Mean LobbyExp_Lobbyers represents the mean annual
amount spent on lobbying (inflation-adjusted) by lobbying firms.
Year N (firm-year obs.) % Lobby Sum of LobbyExp ($M) Mean
LobbyExp_All($M)
Mean LobbyExp_Lobbyers
($M)
1999 370 57.297 258.270 0.698 1.218
2000 375 56.533 261.133 0.696 1.232
2001 371 60.647 289.674 0.781 1.287
2002 379 63.852 305.951 0.807 1.264
2003 385 67.013 331.441 0.861 1.285
2004 391 67.519 329.288 0.842 1.247
2005 388 70.876 343.478 0.885 1.249
2006 386 72.280 384.593 0.996 1.378
38
Table III. Industry Distribution of Sample
Table III provides the distribution of the sample across industries for the sample of S&P 500 firm-
years. Industry classifications are based on the Fama-French (1997) 49-industry industry
classification system. Descriptive statistics for 45 of the 49 Fama-French (1997) industries are
shown as no S&P 500 firms were classified as Agriculture, Textiles, Fabricated Products, and
Defense firms. %Lobby is the percentage of firm-years in a given industry that lobby. Ind. Lobby
Ratio is the sum of lobbying expenses across all firm-years in a given industry divided by the
sample’s total lobbying expenses.
Industry Focus
N
% Lobby
Ind. Lobby Ratio
Food Products 101 66.337 1.256
Candy and Soda 15 40.000 0.031
Beer and Liquor 48 70.833 1.509
Tobacco Products 17 76.471 0.796
Recreation 16 50.000 0.062
Entertainment 15 100.000 1.043
Print. & Publishing 48 75.000 0.589
Consumer Goods 80 66.250 1.510
Apparel 48 20.833 0.068
Healthcare 39 66.667 0.416
Medical Equip. 72 75.000 1.614
Pharmaceutical 162 77.778 13.406
Chemicals 90 67.778 2.429
Rubber & Plastic 12 0.000 0.000
Const. Materials 48 29.167 0.417
Construction 43 53.488 0.336
Steel Works 32 62.500 0.658
Machinery 120 55.000 1.316
Electrical Equip. 24 83.333 0.382
Autos & Trucks 16 100.000 0.498
Aircraft 53 88.679 7.642
Shipbuilding 16 100.000 2.012
Precious Metals 11 72.727 0.116
Mining 16 100.000 0.205
Coal 11 90.909 0.294
Oil and Nat. Gas 166 56.024 3.328
Utilities 250 93.600 16.139
Communication 78 62.821 4.152
Personal Services 16 81.250 0.249
Business Services 107 60.748 1.897
Computer Hardware 93 82.796 2.277
Computer Software 107 76.636 3.963
Electronic Equip. 208 47.596 11.312
Measuring Equip. 70 38.571 0.229
Business Supplies 72 70.833 2.082
Shipping Cont. 8 100.000 0.380
Transportation 79 86.076 5.590
Wholesale 65 36.923 0.581
Retail 249 42.570 2.182

39
Restaurants, Etc. 58 81.034 1.104
Banking 21 80.952 0.728
Insurance 154 66.234 4.210
Real Estate 2 0.000 0.000
Trading 66 34.848 0.795
Other 23 73.913 0.196 vv
40
Table IV. Pearson Correlation Coefficients Table IV provides Pearson correlation coefficients for the sample of S&P 500 firm-years over the period 1999 to 2006. Lobby_DV is an indicator set equal to 1 if
the firm engaged in lobbying activity in year t, 0 otherwise. LN(AdjLobbyExp) is the natural logarithm of annual inflation-adjusted lobby expenditures plus $1 as
reported in year t. LN(Assets) is the natural logarithm of total assets in 2006 dollars. M/B is the sum of market value of equity and total liabilities scaled by total
assets. R&D is research and development expenditures divided by sales. HFI represents the Herfindahl index, calculated as the sum of squared market shares for
firms in a given industry. CF is operating income before depreciation net of interest expense, income taxes, and common dividends and is scaled by total assets.
***, **, and * denote statistical significance at the one, five, and ten percent levels, respectively.
Variables Lobby_DVt LN(AdjLobbyExp)t LN(Assets)t-1 M/Bt-1 R&Dt-1 HFIt-1
LN(AdjLobbyExp)t 0.984***
LN(Assets)t-1 0.367*** 0.422***
M/Bt-1 —0.063*** —0.063*** —0.361***
R&Dt-1 —0.016 —0.019 —0.211*** 0.223***
HFIt-1 0.039** 0.041** —0.042** 0.030* —0.017
CFt-1 —0.031* —0.035* —0.000*** 0.125*** —0.416*** 0.073***

41
Table V. Determinants of Corporate Lobbying
Table V presents results for models used to estimate factors associated with corporate lobbying. The sample consists of S&P 500 firm-years over the period
1999 to 2006. Two dependent variable specifications are used: Lobby_DVt is a binary variable set equal to 1 if the firm engaged in lobbying activity in year t, 0
otherwise; LN(Adj_LobbyExp) is the natural logarithm of annual inflation-adjusted lobby expenditures plus $1. Models are estimated with the aforementioned
dependent variables using Probit, OLS, and Tobit, respectively. Size is the natural logarithm of total assets in 2006 dollars. M/B is the sum of market value of
equity and total liabilities scaled by total assets. R&D is research and development expenditures divided by sales. HFI represents the industry level Herfindahl
index, calculated as the sum of squared market shares for firms in a given industry. CF is operating income before depreciation net of interest expense, income
taxes, and common dividends and is scaled by total assets. All models include indicator variables for industry (Fama-French (1997)) and time. Standard errors
for Probit and OLS models are robust to heteroskedasticity and are clustered at firm level. Test statistics are in parentheses below coefficients. Results in
columns (4) through (6) control for the lagged dependent variable. R-square represents adjusted R-square for OLS models and represents psuedo R-square for
Probit and Tobit models.
(1)
(2)
(3)
(4)
(5)
(6)
Sizet-1 0.465
***
(6.960)
2.277***
(8.960)
1.146***
(27.060)
0.263***
(6.480)
0.480***
(5.950)
0.436***
(15.320)
M/Bt-1 0.042*
(1.870)
0.169*
(1.660)
0.097***
(5.670)
0.037***
(3.020)
0.071**
(2.000)
0.064***
(5.890)
R&D-1 0.334
(1.640)
1.360
(1.600)
0.471*
(1.740)
0.473***
(3.100)
0.983*
(1.890)
0.340**
(2.030)
HFIt-1
–0.826
(–0.530)
8.862
(1.270)
3.180
(1.190)
1.674
(1.270)
11.075**
(2.250)
4.102**
(2.420)
CFt-1 0.323
(0.670)
1.462
(0.750)
0.731
(1.070)
0.430
(1.310)
0.662
(0.880)
0.268
(0.630)
Lobby_DVt-1 2.538***
(26.820)
LN(Adj_LobbyExpt-1) 0.787***
(47.790)
0.299***
(53.880)
Intercept –10.882***
(–7.120)
–47.488**
(–8.240)
–16.420***
(–16.240)
–7.356
(–7.830)
–10.223
(–5.470)
–1.570**
(–2.350)

42
Observations 3,045 3,045 3,045 3,045 3,045 3,045
Dependent Variable Lobby_DV LN(AdjLobbyExp) LN(AdjLobbyExp) Lobby_DV LN(AdjLobbyExp) LN(LobbyAdjExp
Method Probit OLS Tobit Probit OLS Tobit
R-Square 0.213 0.320 0.131 0.610 0.755 0.371
* **, **, and * denote statistical significance at the 1%, 5%, and 10% levels, respectively.
43
Table VI. Descriptive Statistics for Marginal Value of Lobbying Expenditures Table VI shows the sample characteristics for the sample of S&P 500 firm-years over the period 1999 to 2006 used to estimate the marginal value
of corporate lobbying expenditures. The sample consists of 1,616 firm-years for 333 S&P 500 firms. All statistics are reported in percentage
form. ΔX represents the change in X from year t-1 to t. Btiti Rr ,, - is excess return, calculated as a firm’s annual return in year t minus the firm’s
Fama-French (1993) size and book-to-market matched value-weighted portfolio return in year t. Variables other than Lev are scaled by the lagged
market value of equity. LobbyExp represents firms’ annual inflation-adjusted lobby expenditures. Earn is earnings before extraordinary items.
Assets is total assets. R&D is research and development expenses. IntExp is interest expense. Div is common dividends. NF is net financing,
calculated as the sale of common and preferred stock minus purchase of common and preferred stock plus issuance of long-term debt minus
reduction in long-term debt. Lev is defined as total debt divided by the sum of total debt and market value of equity.
Variables N Mean Median
Btiti Rr ,, - 1,616 6.100 4.734
LobbyExpt-1 1,616 0.005 0.001
ΔEarnt 1,616 1.040 0.617
ΔAssetst 1,616 9.985 3.079
ΔR&Dt 1,616 0.020 0.000
ΔIntExpt 1,616 0.074 0.000
ΔDivt 1,616 0.075 0.017
ΔNFt 1,616 0.258 -0.970
Levt 1,616 19.117 14.277
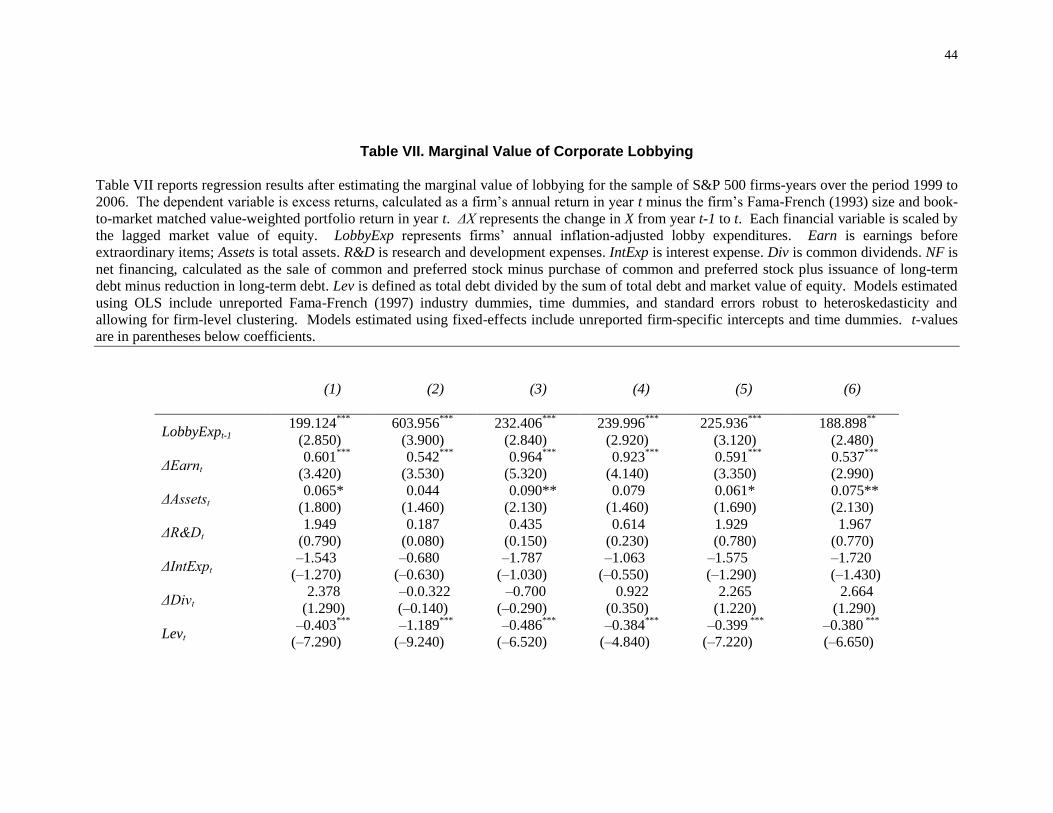
44
Table VII. Marginal Value of Corporate Lobbying
Table VII reports regression results after estimating the marginal value of lobbying for the sample of S&P 500 firms-years over the period 1999 to
2006. The dependent variable is excess returns, calculated as a firm’s annual return in year t minus the firm’s Fama-French (1993) size and book-
to-market matched value-weighted portfolio return in year t. ΔX represents the change in X from year t-1 to t. Each financial variable is scaled by
the lagged market value of equity. LobbyExp represents firms’ annual inflation-adjusted lobby expenditures. Earn is earnings before
extraordinary items; Assets is total assets. R&D is research and development expenses. IntExp is interest expense. Div is common dividends. NF is
net financing, calculated as the sale of common and preferred stock minus purchase of common and preferred stock plus issuance of long-term
debt minus reduction in long-term debt. Lev is defined as total debt divided by the sum of total debt and market value of equity. Models estimated
using OLS include unreported Fama-French (1997) industry dummies, time dummies, and standard errors robust to heteroskedasticity and
allowing for firm-level clustering. Models estimated using fixed-effects include unreported firm-specific intercepts and time dummies. t-values
are in parentheses below coefficients.
(1)
(2)
(3)
(4)
(5)
(6)
LobbyExpt-1 199.124
***
(2.850)
603.956***
(3.900)
232.406***
(2.840)
239.996***
(2.920)
225.936***
(3.120)
188.898**
(2.480)
ΔEarnt 0.601
***
(3.420)
0.542***
(3.530)
0.964***
(5.320)
0.923***
(4.140)
0.591***
(3.350)
0.537***
(2.990)
ΔAssetst 0.065*
(1.800)
0.044
(1.460)
0.090**
(2.130)
0.079
(1.460)
0.061*
(1.690)
0.075**
(2.130)
ΔR&Dt 1.949
(0.790)
0.187
(0.080)
0.435
(0.150)
0.614
(0.230)
1.929
(0.780)
1.967
(0.770)
ΔIntExpt –1.543
(–1.270)
–0.680
(–0.630)
–1.787
(–1.030)
–1.063
(–0.550)
–1.575
(–1.290)
–1.720
(–1.430)
ΔDivt 2.378
(1.290)
–0.0.322
(–0.140)
–0.700
(–0.290)
0.922
(0.350)
2.265
(1.220)
2.664
(1.290)
Levt –0.403
***
(–7.290)
–1.189***
(–9.240)
–0.486***
(–6.520)
–0.384***
(–4.840)
–0.399 ***
(–7.220)
–0.380 ***
(–6.650)

45
ΔNFt 0.088
(0.710)
0.162
(1.480)
0.022
(0.480)
0.0.116
(0.700)
0.101
(0.810)
0.057
(0.450)
λt 0.089
(0.960)
Intercept 0.011
(0.350)
na –0.040
(–0.780)
–0.081
(–1.640)
0.013
(0.410)
0.039
(1.140)
Full Sample? Yes Yes No No No No
Observations 1,616 1,616 987 869 1,596 1,466
FF Ind.
Dummies? Yes No Yes Yes Yes Yes
Method OLS Fixed-Effects OLS Heckman-
Probit OLS OLS
R-Square 0.139 0.067 0.238 0.099 0.137 0.253
* **, **, and * denote statistical significance at the 1%, 5%, and 10% levels, respectively.