Embed Size (px)
Citation preview

Detector noise analysis (DINO) demo
Max Mutchler
ACS-R Optimization Campaign dry-dryrun
30 January 2009

DINO is part of a collection of IDL routines created by the ACS IDT at JHU to process pre-flight data (in TV format).
Initially, it expected input frames in TV format, which have been archived in their dedicated IDT database (and could be identified by their database entry numbers).
It has since been modified to handle other formats, including inflight FITS format, and to be run in batch mode.

Incidentally, the IDT preflight database is a good thing to know about. Pre-flight data are searchable via the web, and identified by a database entry number.
The data is archived on CD-ROM, and this interface can help you search the database and identify which CD-ROMs contain the data you are seeking.

DINO cookbook
• File menu: open ACS FITS (choose a FITS file) • GUI: select amp: A,B,C,D (cycle through them one at a time) • Hit “Calculate” button (will plot spectrum) • Adjust plot settings and threshold (0.002) and plot scaling; hit the "lock
settings" button to retain them• Hit the “Plot” button to re-plot with new settings • Hit the “Peaks” button to list peaks above threshold • File menu: Save peaks (creates dino_peaks.txt) • Hit “Hardcopy” button (creates dino_spectrum.ps) • Rename output files (example for amp A):
> mv dino_peaks.txt rootname_a_peaks.txt > mv dino_spectrum.ps rootname_a_spectrum.ps
• Repeat for next amp, image. A graphical example follows…• Not covered here: running in batch mode; other input FITS formats
> ssh –XY sofialice (or install from ACS IDT website)> cd pathname…> start_acs (a special IDL startup) ACS> dino (GUI will start up, see next slides)

> ssh –XY sofialice > start_acs ACS> dino
plot window
File menu
buttons
(don’t adjust these
parameters)
peaks/plotparameters
messages

File: Open
ACS FITS

Select amp:ABCD

See peaks?
Calculatebutton
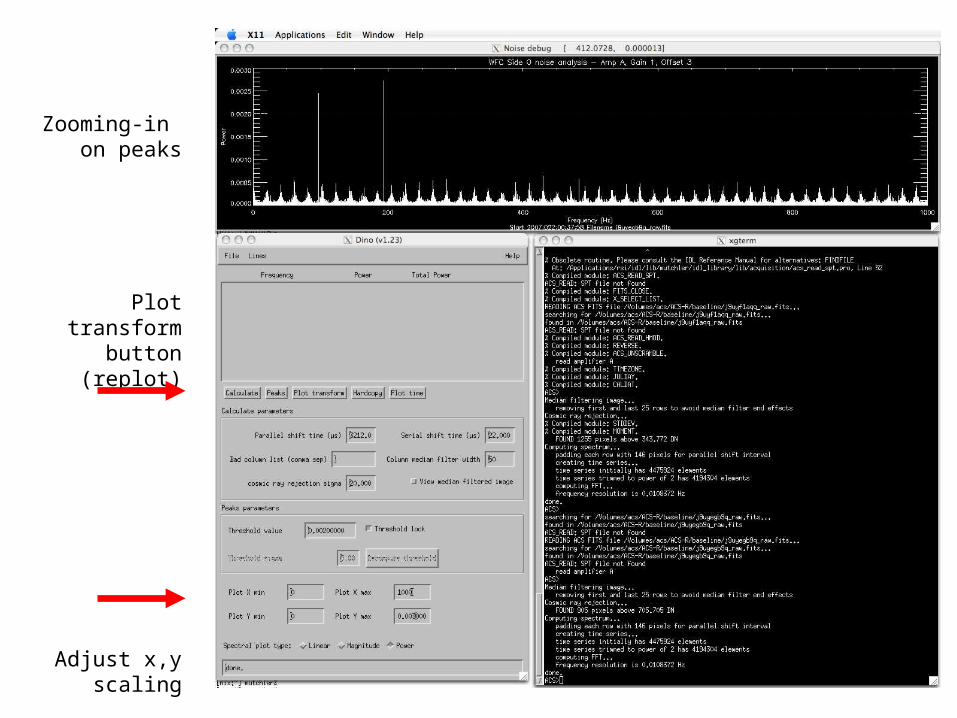
Zooming-in on peaks
Plot transformbutton
(replot)
Adjust x,y scaling

Peaksbutton

File:Save peaks
(dino_peaks.txt)
Hardcopybutton
(dino_spectrum.ps)

Hardcopy plot (dino_spectrum.ps)

Setting alower
threshold,recording more
peaks

Setting thethreshold
too low:recording no
peaks!
message: