Embed Size (px)
Citation preview
sensors
Review
Detection-Response Task—Uses and Limitations
Kristina Stojmenova and Jaka Sodnik *
Faculty of Electrical engineering, University of Ljubljana, Tržaška cesta 25, 1000 Ljubljana, Slovenia;[email protected]* Correspondence: [email protected]; Tel.: +386-1-476-8494
Received: 20 December 2017; Accepted: 12 February 2018; Published: 14 February 2018
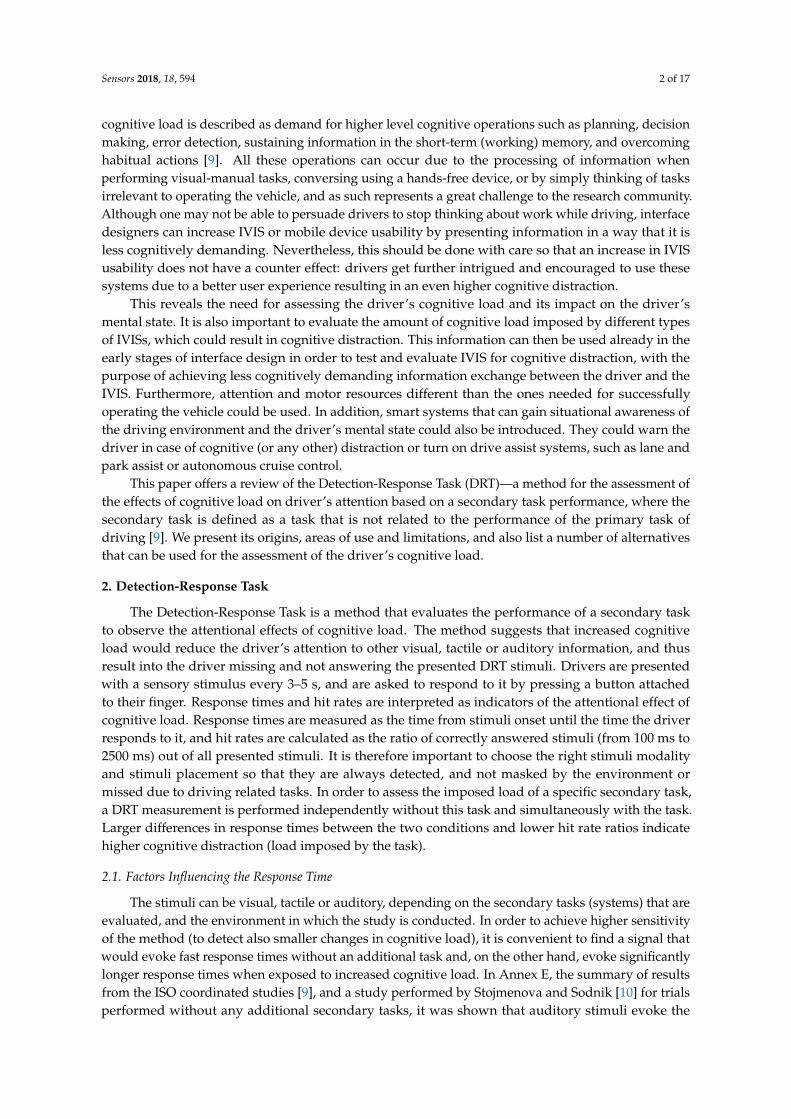
Abstract: The Detection-Response Task is a method for assessing the attentional effects of cognitiveload in a driving environment. Drivers are presented with a sensory stimulus every 3–5 s, and areasked to respond to it by pressing a button attached to their finger. Response times and hit rates areinterpreted as indicators of the attentional effect of cognitive load. The stimuli can be visual, tactile andauditory, and are chosen based on the type of in-vehicle system or device that is being evaluated.Its biggest disadvantage is that the method itself also affects the driver’s performance and secondarytask completion times. Nevertheless, this is an easy to use and implement method, which allowsrelevant assessment and evaluation of in-vehicle systems. By following the recommendationsand taking into account its limitations, researchers can obtain reliable and valuable results on theattentional effects of cognitive load on drivers.
Keywords: detection-response task; cognitive distraction; driving; cognitive load; sensors;attentional resources
1. Introduction
Distracted driving is one of the major causes of road accidents. The National HighwayTraffic Safety Administration (NHTSA) reported that almost 400,000 people were injured in motorvehicle crashes due to distracted driving in 2015 in the United States [1]. Due to its complexity asa psychological construct, driver distraction does not have one uniform definition and explanation.One of many definitions [2,3] of driver distraction states that “driver distraction is the diversion ofattention away from activities critical for safe driving toward a competing activity” [4]. With regard toattention, which James defined as “concentration on a specific source of information” [5]; Recarte andNunes suggest that driver distraction can be exogenous or endogenous [6]. Exogenous distraction isproduced by external objects or events irrelevant to driving, whereas endogenous is produced by thedriver’s cognitive activity unrelated to the task of driving (lost in thought or solving problems unrelatedto the ongoing task of driving). Visual (eyes off the road) and manual (hands off the steering wheel)distractions are examples of exogenous distraction. Visual distraction has been tackled by changing theplacement of information presentation, for example, head-up displays instead of classic head-downdisplays. Manual distraction can occur as a result of operating a mobile device or an in-vehicleinformation system (IVIS). A review of the trends in fatalities from distracted driving, reported byauthorities in the United States, showed that there was a rise of 28% in fatalities due to texting and useof mobile devices in 2008 compared to 2005 in the United States [7]. These and similar reports explainthe call for prohibition of cell phone use in many countries around the world. While visual and tactiledistraction is due to sensory information perception and communication, driver cognitive distractionoccurs as a result of the processing of information unrelated to driving. Cognitive distraction occurs asa result of increased cognitive load unrelated to the task of driving. Cognitive load can be defined asa multidimensional construct representing the load that performing a particular task imposes on thelearner’s cognitive system [8]. In the ISO standard on the Detection-Response Task relating to driving,
Sensors 2018, 18, 594; doi:10.3390/s18020594 www.mdpi.com/journal/sensors
Sensors 2018, 18, 594 2 of 17
cognitive load is described as demand for higher level cognitive operations such as planning, decisionmaking, error detection, sustaining information in the short-term (working) memory, and overcominghabitual actions [9]. All these operations can occur due to the processing of information whenperforming visual-manual tasks, conversing using a hands-free device, or by simply thinking of tasksirrelevant to operating the vehicle, and as such represents a great challenge to the research community.Although one may not be able to persuade drivers to stop thinking about work while driving, interfacedesigners can increase IVIS or mobile device usability by presenting information in a way that it isless cognitively demanding. Nevertheless, this should be done with care so that an increase in IVISusability does not have a counter effect: drivers get further intrigued and encouraged to use thesesystems due to a better user experience resulting in an even higher cognitive distraction.
This reveals the need for assessing the driver’s cognitive load and its impact on the driver’smental state. It is also important to evaluate the amount of cognitive load imposed by different typesof IVISs, which could result in cognitive distraction. This information can then be used already in theearly stages of interface design in order to test and evaluate IVIS for cognitive distraction, with thepurpose of achieving less cognitively demanding information exchange between the driver and theIVIS. Furthermore, attention and motor resources different than the ones needed for successfullyoperating the vehicle could be used. In addition, smart systems that can gain situational awareness ofthe driving environment and the driver’s mental state could also be introduced. They could warn thedriver in case of cognitive (or any other) distraction or turn on drive assist systems, such as lane andpark assist or autonomous cruise control.
This paper offers a review of the Detection-Response Task (DRT)—a method for the assessment ofthe effects of cognitive load on driver’s attention based on a secondary task performance, where thesecondary task is defined as a task that is not related to the performance of the primary task ofdriving [9]. We present its origins, areas of use and limitations, and also list a number of alternativesthat can be used for the assessment of the driver’s cognitive load.
2. Detection-Response Task
The Detection-Response Task is a method that evaluates the performance of a secondary taskto observe the attentional effects of cognitive load. The method suggests that increased cognitiveload would reduce the driver’s attention to other visual, tactile or auditory information, and thusresult into the driver missing and not answering the presented DRT stimuli. Drivers are presentedwith a sensory stimulus every 3–5 s, and are asked to respond to it by pressing a button attachedto their finger. Response times and hit rates are interpreted as indicators of the attentional effect ofcognitive load. Response times are measured as the time from stimuli onset until the time the driverresponds to it, and hit rates are calculated as the ratio of correctly answered stimuli (from 100 ms to2500 ms) out of all presented stimuli. It is therefore important to choose the right stimuli modalityand stimuli placement so that they are always detected, and not masked by the environment ormissed due to driving related tasks. In order to assess the imposed load of a specific secondary task,a DRT measurement is performed independently without this task and simultaneously with the task.Larger differences in response times between the two conditions and lower hit rate ratios indicatehigher cognitive distraction (load imposed by the task).
2.1. Factors Influencing the Response Time
The stimuli can be visual, tactile or auditory, depending on the secondary tasks (systems) that areevaluated, and the environment in which the study is conducted. In order to achieve higher sensitivityof the method (to detect also smaller changes in cognitive load), it is convenient to find a signal thatwould evoke fast response times without an additional task and, on the other hand, evoke significantlylonger response times when exposed to increased cognitive load. In Annex E, the summary of resultsfrom the ISO coordinated studies [9], and a study performed by Stojmenova and Sodnik [10] for trialsperformed without any additional secondary tasks, it was shown that auditory stimuli evoke the

Sensors 2018, 18, 594 3 of 17
fastest response times compared to tactile and visual stimuli, and tactile stimuli evoke a faster responsethan visual stimuli (Figure 1).
Sensors 2018, 18, x FOR PEER REVIEW 3 of 17
stimuli evoke the fastest response times compared to tactile and visual stimuli, and tactile stimuli evoke a faster response than visual stimuli (Figure 1).
Figure 1. Mean response times for visual, tactile and auditory stimuli [10].
This is somewhat expected as (all being equal) response to light has a longer latency compared to sound or touch [11]. This is due to the fact that sound signals reach the brain in 8–10 ms [12], while light signals require from 20 to 40 ms [13]. Respectively, response times for touch are somewhat in-between at 155 ms [14], for tasks where answering stimuli is the primary and only task.
Furthermore, Chocholle explored how stimuli intensity affected response times. He revealed that for pure tones the response time decreases with increased signal intensity [15], but only until approx. 100 dB. The response time at 100 dB is approx. 109 ms [16], which is defined as the irreducible minimum by Chocholle, and above this limit, the sound intensity does not have any effect on response times. Additionally, Niessen showed that increased intensity also affects alertness and decreases the time needed to direct attention to a stimulus [17].
This shows that special precaution should be taken when comparing different studies using the DRT. The method’s sensitivity can be manipulated by increasing the stimuli intensity in order to reduce the basic response time (trials without a task), and hence increase the difference in response times compared to trials with a task [18], for example in environments with a bad signal-to-noise ratio. Preferably the same stimuli modality and intensity should be used when comparing different IVISs or relationships between different types of in-vehicle interaction and cognitive load in order to achieve reliable cross-cite studies and analysis.
2.2. DRT Versions and Types of Stimuli
The versions using visual and tactile stimuli were standardised by ISO in 2016 [9]. The standard gives guidelines for two possible placements of visual stimuli, head-mounted (HDRT) and a remote (RDRT). The latter version can sometimes be referred to as the Peripheral Detection Task (PDT), which is actually the method DRT was developed from [19–21]. In the standardised DRT version, visual stimuli can be placed in the driver’s peripheral field of view, usually on the left bottom side of the windshield or on the top right side of the dashboard. The standard proposes the use of a single
Figure 1. Mean response times for visual, tactile and auditory stimuli [10].
This is somewhat expected as (all being equal) response to light has a longer latency comparedto sound or touch [11]. This is due to the fact that sound signals reach the brain in 8–10 ms [12],while light signals require from 20 to 40 ms [13]. Respectively, response times for touch are somewhatin-between at 155 ms [14], for tasks where answering stimuli is the primary and only task.
Furthermore, Chocholle explored how stimuli intensity affected response times. He revealedthat for pure tones the response time decreases with increased signal intensity [15], but only untilapprox. 100 dB. The response time at 100 dB is approx. 109 ms [16], which is defined as the irreducibleminimum by Chocholle, and above this limit, the sound intensity does not have any effect on responsetimes. Additionally, Niessen showed that increased intensity also affects alertness and decreases thetime needed to direct attention to a stimulus [17].
This shows that special precaution should be taken when comparing different studies using theDRT. The method’s sensitivity can be manipulated by increasing the stimuli intensity in order toreduce the basic response time (trials without a task), and hence increase the difference in responsetimes compared to trials with a task [18], for example in environments with a bad signal-to-noise ratio.Preferably the same stimuli modality and intensity should be used when comparing different IVISs orrelationships between different types of in-vehicle interaction and cognitive load in order to achievereliable cross-cite studies and analysis.
2.2. DRT Versions and Types of Stimuli
The versions using visual and tactile stimuli were standardised by ISO in 2016 [9]. The standardgives guidelines for two possible placements of visual stimuli, head-mounted (HDRT) and a remote(RDRT). The latter version can sometimes be referred to as the Peripheral Detection Task (PDT),which is actually the method DRT was developed from [19–21]. In the standardised DRT version,visual stimuli can be placed in the driver’s peripheral field of view, usually on the left bottom side ofthe windshield or on the top right side of the dashboard. The standard proposes the use of a single red

Sensors 2018, 18, 594 4 of 17
light source presented with an LED. In the case of a driving simulator environment, a graphical objectis displayed at a fixed location on the visual display [9].
The PDT method, on the other hand, is used primarily for assessing the driver’s visual distractionduring driving [21]. It therefore provides more alternatives for the placement of the stimuli. It can beplaced in the peripheral field of view, in the form of a fixed set-up or interchangeably—the locationof the source of light would change for each next stimulus [22]. For example, one (randomly chosen)out of 23 available light sources would light up (Figure 2) [21], a stimulus would change positionthroughout the experiment from left to right or in a randomly chosen direction [20].
Sensors 2018, 18, x FOR PEER REVIEW 4 of 17
red light source presented with an LED. In the case of a driving simulator environment, a graphical object is displayed at a fixed location on the visual display [9].
The PDT method, on the other hand, is used primarily for assessing the driver’s visual distraction during driving [21]. It therefore provides more alternatives for the placement of the stimuli. It can be placed in the peripheral field of view, in the form of a fixed set-up or interchangeably—the location of the source of light would change for each next stimulus [22]. For example, one (randomly chosen) out of 23 available light sources would light up (Figure 2) [21], a stimulus would change position throughout the experiment from left to right or in a randomly chosen direction [20].
Figure 2. Peripheral Detection Task set-up [21].
It is important to note that the PDT does not measure the size (width) of the functional field of view (visual tunnelling) [22], and should be used exclusively for assessing the effects of visual distraction and, consequently, cognitive load. Its main disadvantage and limitation is the use of a visual stimulus placed in the driver’s peripheral field of view. Regardless of the position of the stimulus, drivers can overlook and miss it while turning their head, looking at the rear mirrors or due to any other visually demanding driving tasks, and not because of increased cognitive load.
The other standardised visual version, HDRT, solves this problem by head-mounting the stimuli source so that it always stays in the field of view, regardless of the driver’s head position. With this version, the visual stimuli are presented in front of the driver’s left eye staying visible at all times (Figure 3). It is important to note that the DRT method is used to evaluate the effect of cognitive load on the driver’s attention and resource allocation imposed by the performance of secondary tasks. The latter mainly represent the use of IVISs or other types of driver-vehicle interaction. At the moment, the majority of IVISs in vehicles display (output) information visually and are operated (input) manually (visual-manual systems). Human attention is limited, and a visual perception channel can only perceive a limited amount of information at a time [5]. The perception of visual DRT stimuli, reading information on the IVIS display and paying attention to the driving environment, which requires a significant amount of visual attention, can therefore be overwhelming. Consequently, the use of the visual DRT in such circumstances can be inappropriate and can cause sensory overload.
Figure 2. Peripheral Detection Task set-up [21].
It is important to note that the PDT does not measure the size (width) of the functional fieldof view (visual tunnelling) [22], and should be used exclusively for assessing the effects of visualdistraction and, consequently, cognitive load. Its main disadvantage and limitation is the use of a visualstimulus placed in the driver’s peripheral field of view. Regardless of the position of the stimulus,drivers can overlook and miss it while turning their head, looking at the rear mirrors or due to anyother visually demanding driving tasks, and not because of increased cognitive load.
The other standardised visual version, HDRT, solves this problem by head-mounting the stimulisource so that it always stays in the field of view, regardless of the driver’s head position. With thisversion, the visual stimuli are presented in front of the driver’s left eye staying visible at all times(Figure 3). It is important to note that the DRT method is used to evaluate the effect of cognitive loadon the driver’s attention and resource allocation imposed by the performance of secondary tasks.The latter mainly represent the use of IVISs or other types of driver-vehicle interaction. At the moment,the majority of IVISs in vehicles display (output) information visually and are operated (input)manually (visual-manual systems). Human attention is limited, and a visual perception channelcan only perceive a limited amount of information at a time [5]. The perception of visual DRTstimuli, reading information on the IVIS display and paying attention to the driving environment,which requires a significant amount of visual attention, can therefore be overwhelming. Consequently,the use of the visual DRT in such circumstances can be inappropriate and can cause sensory overload.

Sensors 2018, 18, 594 5 of 17
Sensors 2018, 18, x FOR PEER REVIEW 5 of 17
Figure 3. Head-mounted Detection-Response Task (HDRT) set-up [23].
In order to avoid sensory overload, tactile or auditory stimuli can be used instead. For example, the TDRT uses vibration as stimuli, produced with a small 10 mm vibrating tactor with a maximum speed of 12,000 rpm and vibration amplitude 0.8 G [9]. It is placed on the driver’s left shoulder collar bone for left-side operated vehicles, and on the right for vehicles with the steering wheel on the right side (Figure 4). Like with a visual DRT, the driver’s task is to respond to the stimuli as soon as perceived by manually pressing a button. Although this version avoids the overlap in the perception channel (i.e., visual stimulus and visual-manual IVIS interaction), an overlap in the output channel still occurs as the driver uses the same biomechanical channel of touch to perceive tactile stimuli and to answer them by manually pressing a button.
Figure 4. Tactile Detection-Response Task (TDRT) set-up [24].
Due to this reason, Stojmenova et al. proposed an auditory version of the DRT (ADRT) using an auditory signal as a stimulus. In this case, there is no overlap with the visual or biomechanical channel [25]. Beforehand, the ADRT was also mentioned in studies by Merat et al. [26], Merat and Jameson [27] and Stojmenova et al. [25]. However, they all use different sound signals (beeps,
Figure 3. Head-mounted Detection-Response Task (HDRT) set-up [23].
In order to avoid sensory overload, tactile or auditory stimuli can be used instead. For example,the TDRT uses vibration as stimuli, produced with a small 10 mm vibrating tactor with a maximumspeed of 12,000 rpm and vibration amplitude 0.8 G [9]. It is placed on the driver’s left shouldercollar bone for left-side operated vehicles, and on the right for vehicles with the steering wheel on theright side (Figure 4). Like with a visual DRT, the driver’s task is to respond to the stimuli as soon asperceived by manually pressing a button. Although this version avoids the overlap in the perceptionchannel (i.e., visual stimulus and visual-manual IVIS interaction), an overlap in the output channelstill occurs as the driver uses the same biomechanical channel of touch to perceive tactile stimuli andto answer them by manually pressing a button.
Sensors 2018, 18, x FOR PEER REVIEW 5 of 17
Figure 3. Head-mounted Detection-Response Task (HDRT) set-up [23].
In order to avoid sensory overload, tactile or auditory stimuli can be used instead. For example, the TDRT uses vibration as stimuli, produced with a small 10 mm vibrating tactor with a maximum speed of 12,000 rpm and vibration amplitude 0.8 G [9]. It is placed on the driver’s left shoulder collar bone for left-side operated vehicles, and on the right for vehicles with the steering wheel on the right side (Figure 4). Like with a visual DRT, the driver’s task is to respond to the stimuli as soon as perceived by manually pressing a button. Although this version avoids the overlap in the perception channel (i.e., visual stimulus and visual-manual IVIS interaction), an overlap in the output channel still occurs as the driver uses the same biomechanical channel of touch to perceive tactile stimuli and to answer them by manually pressing a button.
Figure 4. Tactile Detection-Response Task (TDRT) set-up [24].
Due to this reason, Stojmenova et al. proposed an auditory version of the DRT (ADRT) using an auditory signal as a stimulus. In this case, there is no overlap with the visual or biomechanical channel [25]. Beforehand, the ADRT was also mentioned in studies by Merat et al. [26], Merat and Jameson [27] and Stojmenova et al. [25]. However, they all use different sound signals (beeps,
Figure 4. Tactile Detection-Response Task (TDRT) set-up [24].
Due to this reason, Stojmenova et al. proposed an auditory version of the DRT (ADRT)using an auditory signal as a stimulus. In this case, there is no overlap with the visual orbiomechanical channel [25]. Beforehand, the ADRT was also mentioned in studies by Merat et al. [26],Merat and Jameson [27] and Stojmenova et al. [25]. However, they all use different sound signals

Sensors 2018, 18, 594 6 of 17
(beeps, broadband noise and modulated harmonic signals), which makes the direct comparison of theproposed methods almost impossible. The DRT standard also does not provide any guidelines for theselection or implementation of the most appropriate auditory stimuli. Stojmenova et al. proposeda candidate for the auditory stimulus through a user study considering some general properties andlimitations of the human hearing system. They took into consideration that the hearing system isonly sensitive to stimuli containing from around 20 Hz to around 20 kHz, and is the most sensitive tofrequencies between 2 kHz and 5 kHz [28]. Their results were most favourable towards 4 kHz and8 kHz pure tones, played at 53 dB. Finally, they recommend the use of 4 kHz with a slightly increasedintensity, primarily due to the fact that the upper limit of hearing decreases with age and thereforethe 8 kHz could be more difficult to perceive for older drivers. They later validated their choice byperforming a study in which they compared their ADRT version (4 kHz stimuli played at 60 dB),with the standardized RDRT and TDRT, and showed that the ADRT is also sensitive to the attentionaleffects of cognitive load [10].
2.3. Choosing the Right DRT Version (Relationship between the DRT Version and the Secondary Task)
As indicated before, all DRT versions are used to assess the attentional effects of cognitive loadimposed on the driver by secondary tasks. There is a strong relationship between the type of secondarytask and the DRT version used due to the previously presented potential overlap of input/outputchannels (i.e., human senses and responders). The two most commonly used groups of secondarytasks in vehicles are:
- visual-manual tasks: typical interaction with in-vehicle infotainment systems (IVIS) where theinformation is shown visually and the device is operated manually (e.g., head-down or head-updisplays operated through a touchscreen or various buttons and levers in the cockpit);
- pure cognitive tasks: in-vehicle tasks where information is presented auditorily and responsesare given vocally (e.g., navigation device operated through speech commands or simple phoneconversations based on hands-free systems).
These two types of typical in-vehicle tasks can be simulated by two experimental tasks enablinga high level of controllability and experimental validity.
The Surrogate Reference Task (SuRT) is a standardized visual-manual task where drivers arepresented with a number of circles of the same size and one larger “target” circle. They have to pointout the target circle using the left and right keypad buttons [29]. Depending on the difference in thesize of the target circle and other circles, the level of demand can be easy or hard (Figure 5).
Sensors 2018, 18, x FOR PEER REVIEW 6 of 17
broadband noise and modulated harmonic signals), which makes the direct comparison of the proposed methods almost impossible. The DRT standard also does not provide any guidelines for the selection or implementation of the most appropriate auditory stimuli. Stojmenova et al. proposed a candidate for the auditory stimulus through a user study considering some general properties and limitations of the human hearing system. They took into consideration that the hearing system is only sensitive to stimuli containing from around 20 Hz to around 20 kHz, and is the most sensitive to frequencies between 2 kHz and 5 kHz [28]. Their results were most favourable towards 4 kHz and 8 kHz pure tones, played at 53 dB. Finally, they recommend the use of 4 kHz with a slightly increased intensity, primarily due to the fact that the upper limit of hearing decreases with age and therefore the 8 kHz could be more difficult to perceive for older drivers. They later validated their choice by performing a study in which they compared their ADRT version (4 kHz stimuli played at 60 dB), with the standardized RDRT and TDRT, and showed that the ADRT is also sensitive to the attentional effects of cognitive load [10].
2.3. Choosing the Right DRT Version (Relationship between the DRT Version and the Secondary Task)
As indicated before, all DRT versions are used to assess the attentional effects of cognitive load imposed on the driver by secondary tasks. There is a strong relationship between the type of secondary task and the DRT version used due to the previously presented potential overlap of input/output channels (i.e., human senses and responders). The two most commonly used groups of secondary tasks in vehicles are:
- visual-manual tasks: typical interaction with in-vehicle infotainment systems (IVIS) where the information is shown visually and the device is operated manually (e.g., head-down or head-up displays operated through a touchscreen or various buttons and levers in the cockpit);
- pure cognitive tasks: in-vehicle tasks where information is presented auditorily and responses are given vocally (e.g., navigation device operated through speech commands or simple phone conversations based on hands-free systems).
These two types of typical in-vehicle tasks can be simulated by two experimental tasks enabling a high level of controllability and experimental validity.
The Surrogate Reference Task (SuRT) is a standardized visual-manual task where drivers are presented with a number of circles of the same size and one larger “target” circle. They have to point out the target circle using the left and right keypad buttons [29]. Depending on the difference in the size of the target circle and other circles, the level of demand can be easy or hard (Figure 5).
Figure 5. Visual-manual Surrogate Reference Task (SuRT) [30].
Delayed digit recall is a pure cognitive task, also known as a modified n-back task [31]. It is a simple task where drivers are presented with spoken auditory stimuli in the form of single-digit numbers, which they have to repeat back to the experimenter following specific rules. The structure of the task allows several difficulty levels: mild, moderate and high level of task demand. For the mild level, the driver has to repeat immediately the last number presented—0-back, for the
Figure 5. Visual-manual Surrogate Reference Task (SuRT) [30].
Delayed digit recall is a pure cognitive task, also known as a modified n-back task [31].It is a simple task where drivers are presented with spoken auditory stimuli in the form of single-digitnumbers, which they have to repeat back to the experimenter following specific rules. The structure ofthe task allows several difficulty levels: mild, moderate and high level of task demand. For the mildlevel, the driver has to repeat immediately the last number presented—0-back, for the moderate the

Sensors 2018, 18, 594 7 of 17
number next-to-last (1-back) and for the high level the number second-to-last (2-back). An example ofthe consecutive order of numbers and drivers’ responses is presented in Table 1.
Table 1. N-back task in high level—2-back task.
Consecutive Order of Digits
Stimuli 3 9 7 4 6 5 5 1 8 9Response - - 3 9 7 4 6 5 5 1
The sensitivity, to both visual-manual and pure cognitive secondary tasks, for all four versions ofDRT methods has been evaluated in various studies [10,22,23,25–27,30]. Based on the results of thesestudies, the ISO DRT standard suggests primarily visual and tactile DRT variants to be suitable andsensitive for assessing distracting factors of audio-vocal systems in vehicles [9]. The tactile versionshould preferably be used for the assessment of systems that present information visually, and thereforerequire more visual attention.
Stojmenova and Sodnik, on the other hand, demonstrated that the audio version of the DRTalso showed the greatest differences in response times when comparing trials without and trials witha cognitive auditory-vocal task (Figure 6) [10]. In their experiment, the same amount of cognitive loadwas induced across all trials with a cognitive task, therefore, the obtained differences in response timesdirectly represent the sensitivity of each method. The results even indicate that the ADRT seems to bethe most sensitive version of the DRT methods for assessing the impact of this type of secondary tasks.
Sensors 2018, 18, x FOR PEER REVIEW 7 of 17
moderate the number next-to-last (1-back) and for the high level the number second-to-last (2-back). An example of the consecutive order of numbers and drivers’ responses is presented in Table 1.
Table 1. N-back task in high level—2-back task.
Consecutive Order of DigitsStimuli 3 9 7 4 6 5 5 1 8 9
Response - - 3 9 7 4 6 5 5 1
The sensitivity, to both visual-manual and pure cognitive secondary tasks, for all four versions of DRT methods has been evaluated in various studies [10,22,23,25–27,30]. Based on the results of these studies, the ISO DRT standard suggests primarily visual and tactile DRT variants to be suitable and sensitive for assessing distracting factors of audio-vocal systems in vehicles [9]. The tactile version should preferably be used for the assessment of systems that present information visually, and therefore require more visual attention.
Stojmenova and Sodnik, on the other hand, demonstrated that the audio version of the DRT also showed the greatest differences in response times when comparing trials without and trials with a cognitive auditory-vocal task (Figure 6) [10]. In their experiment, the same amount of cognitive load was induced across all trials with a cognitive task, therefore, the obtained differences in response times directly represent the sensitivity of each method. The results even indicate that the ADRT seems to be the most sensitive version of the DRT methods for assessing the impact of this type of secondary tasks.
Figure 6. Response times for remote visual DRT (RDRT), tactile DRT (TDRT) and auditory DRT (ADRT) for trials without and with a cognitive task (auditory-vocal n-back task) [10].
Figure 6. Response times for remote visual DRT (RDRT), tactile DRT (TDRT) and auditory DRT (ADRT)for trials without and with a cognitive task (auditory-vocal n-back task) [10].

Sensors 2018, 18, 594 8 of 17
2.4. Response to the Stimulus
The response method has also evolved through the years. In the first research that mentionsthe RDRT (PDT), a verbal response was used to indicate that the stimuli were perceived [32,33].In surrogate driving environments, where drivers, instead of driving, watch a driving video recordedfrom a driver’s perspective, tapping on the pedal brake was also used as a response method [34,35].Nevertheless, the most common and now standardised response method is a manual response basedon a button press [9,10,20,30]. The ISO standard recommends that a button is attached to the thumb,index finger (Figure 7) or, if requested, any other finger, on the left hand for left-operated vehicles andvice versa, and it is pressed against the wheel to respond to the presented stimuli [9].
Paul Fitts discussed the importance of “compatibility” of the stimulus and response in termsof their modality (e.g., visual-vocal, visual-manual, auditory-manual, tactile-manual, etc.) [36].The properties of the relationship between the two turned out to be as important as their individualproperties. It refers to the finding that different combinations of stimuli and response modalitiesproduce different results (e.g., faster and more accurate responses) [37]. This raises a question aboutthe possibility of defining a standardised answering method for the DRT as currently all four versionsof the method use the same response method.
Sensors 2018, 18, x FOR PEER REVIEW 8 of 17
2.4. Response to the Stimulus
The response method has also evolved through the years. In the first research that mentions the RDRT (PDT), a verbal response was used to indicate that the stimuli were perceived [32,33]. In surrogate driving environments, where drivers, instead of driving, watch a driving video recorded from a driver’s perspective, tapping on the pedal brake was also used as a response method [34,35]. Nevertheless, the most common and now standardised response method is a manual response based on a button press [9,10,20,30]. The ISO standard recommends that a button is attached to the thumb, index finger (Figure 7) or, if requested, any other finger, on the left hand for left-operated vehicles and vice versa, and it is pressed against the wheel to respond to the presented stimuli [9].
Paul Fitts discussed the importance of “compatibility” of the stimulus and response in terms of their modality (e.g., visual-vocal, visual-manual, auditory-manual, tactile-manual, etc.) [36]. The properties of the relationship between the two turned out to be as important as their individual properties. It refers to the finding that different combinations of stimuli and response modalities produce different results (e.g., faster and more accurate responses) [37]. This raises a question about the possibility of defining a standardised answering method for the DRT as currently all four versions of the method use the same response method.
Figure 7. Response button used for answering to Detection-response task (DRT) stimuli [24].
2.5. DRT Intrusiveness
An important point to be considered when using this sensory based method is the fact that although it tries to capture the effects of secondary tasks on the driver’s attention, the method itself is also a secondary task, and as such distracts the driver from the primary task. Regardless of the stimuli modality, the DRT requires constant driver involvement and diverts his/her attention from driving to detecting the presented stimulus. Stojmenova and Sodnik conducted a study in which they explored the intrusiveness of the method by observing changes in three dependent variables [38]:
- psychophysical response (i.e., pupil dilation), - driving performance (i.e., acceleration and lane deviation/departure), and - secondary task performance (i.e., performance of the secondary cognitive task, success rate and
task completion times).
In the study, participants performed eight trials:
• driving • driving and a cognitive task (n-back task)
Figure 7. Response button used for answering to Detection-response task (DRT) stimuli [24].
2.5. DRT Intrusiveness
An important point to be considered when using this sensory based method is the fact thatalthough it tries to capture the effects of secondary tasks on the driver’s attention, the method itself isalso a secondary task, and as such distracts the driver from the primary task. Regardless of the stimulimodality, the DRT requires constant driver involvement and diverts his/her attention from driving todetecting the presented stimulus. Stojmenova and Sodnik conducted a study in which they exploredthe intrusiveness of the method by observing changes in three dependent variables [38]:
- psychophysical response (i.e., pupil dilation),- driving performance (i.e., acceleration and lane deviation/departure), and- secondary task performance (i.e., performance of the secondary cognitive task, success rate and
task completion times).
In the study, participants performed eight trials:
• driving• driving and a cognitive task (n-back task)

Sensors 2018, 18, 594 9 of 17
• driving and RDRT• driving and RDRT, and a cognitive task (n-back task)• driving and TDRT• driving and TDRT, and a cognitive task (n-back task)• driving and ADRT• driving and ADRT, and a cognitive task (n-back task).
They explored how these three variables changed in the presence of DRT stimuli. The driver’spupil size data for trials without the DRT and trials with the DRT did not show significant differences,indicating that answering DRT stimuli does not impose additional cognitive load on the driver.Results on acceleration deviation and task completion times suggest that answering DRT stimuliaffects driving (Figures 8 and 9) and secondary task performance (Figures 10 and 11).
Sensors 2018, 18, x FOR PEER REVIEW 9 of 17
• driving and RDRT • driving and RDRT, and a cognitive task (n-back task) • driving and TDRT • driving and TDRT, and a cognitive task (n-back task) • driving and ADRT • driving and ADRT, and a cognitive task (n-back task).
They explored how these three variables changed in the presence of DRT stimuli. The driver’s pupil size data for trials without the DRT and trials with the DRT did not show significant differences, indicating that answering DRT stimuli does not impose additional cognitive load on the driver. Results on acceleration deviation and task completion times suggest that answering DRT stimuli affects driving (Figures 8 and 9) and secondary task performance (Figures 10 and 11).
Figure 8. Standard deviation of the mean speed across trials without and with visual, tactile and auditory DRT stimuli [38].
Figure 9. Standard deviation of the mean acceleration deviation across trials without and with visual, tactile and auditory DRT stimuli [38].
Figure 8. Standard deviation of the mean speed across trials without and with visual, tactile andauditory DRT stimuli [38].
Sensors 2018, 18, x FOR PEER REVIEW 9 of 17
• driving and RDRT • driving and RDRT, and a cognitive task (n-back task) • driving and TDRT • driving and TDRT, and a cognitive task (n-back task) • driving and ADRT • driving and ADRT, and a cognitive task (n-back task).
They explored how these three variables changed in the presence of DRT stimuli. The driver’s pupil size data for trials without the DRT and trials with the DRT did not show significant differences, indicating that answering DRT stimuli does not impose additional cognitive load on the driver. Results on acceleration deviation and task completion times suggest that answering DRT stimuli affects driving (Figures 8 and 9) and secondary task performance (Figures 10 and 11).
Figure 8. Standard deviation of the mean speed across trials without and with visual, tactile and auditory DRT stimuli [38].
Figure 9. Standard deviation of the mean acceleration deviation across trials without and with visual, tactile and auditory DRT stimuli [38].
Figure 9. Standard deviation of the mean acceleration deviation across trials without and with visual,tactile and auditory DRT stimuli [38].

Sensors 2018, 18, 594 10 of 17
Sensors 2018, 18, x FOR PEER REVIEW 10 of 17
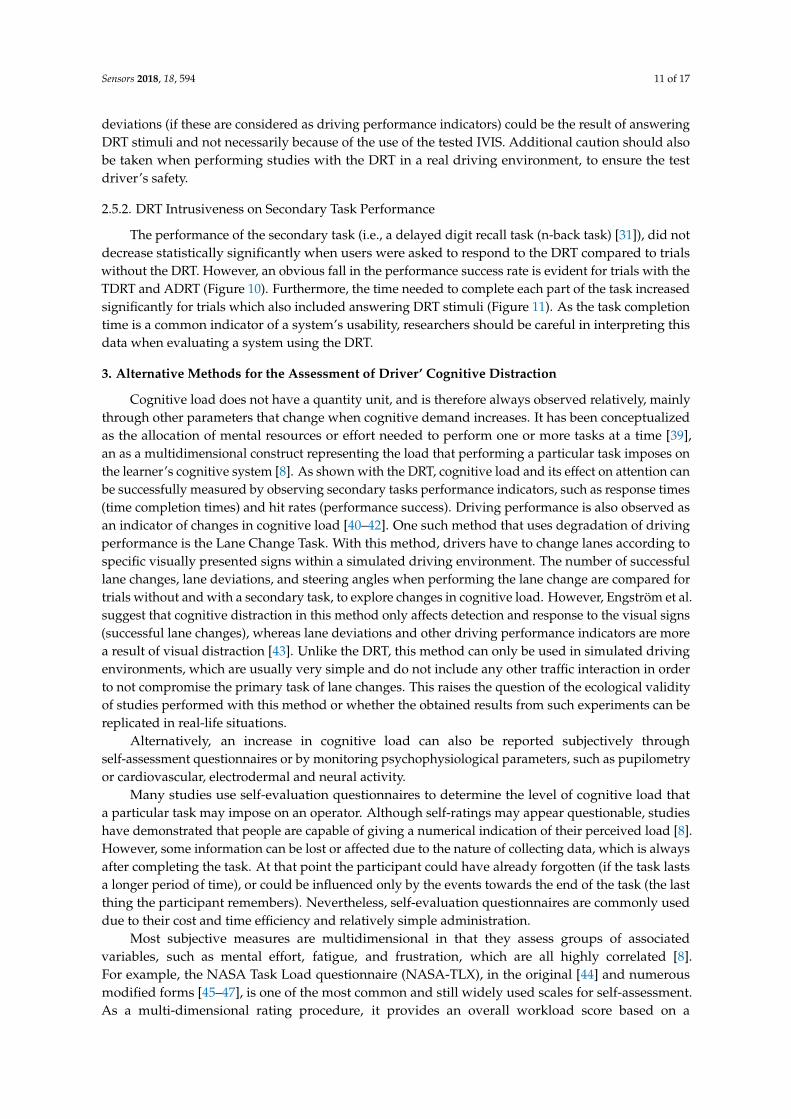
Figure 10. Mean task performance rate for trials without and with DRT stimuli [38].
Figure 11. Mean task completion times for trials without and with DRT stimuli [38].
2.5.1. DRT Intrusiveness on Driving Performance
In the study, participants were asked to drive at a constant speed of 130 km on a simulated highway route with low traffic intensity, which did not require them to overtake any vehicles. Consequently, the average driving speed did not change much during different trials, and standard deviationof the speed increased significantly when comparing trials without answering the DRT and trials with the RDRT and TDRT (Figure 8). There were also significant increases in the standard deviation of mean acceleration for trials with all three versions of RDRT, TDRT and ADRT compared to trials without DRT stimuli (Figure 9).
When performing more than one task, drivers can adjust their performance and allocate more effort to the primary task of driving [3]. In the study [38], this is evident from the fact that the average speed across all trials did not change; however, there was an increase in the average speed and acceleration deviations for trials with the DRT, indicating that participants had to put more effort into completing the task of driving at a constant speed. These results could be taken into
Figure 10. Mean task performance rate for trials without and with DRT stimuli [38].
Sensors 2018, 18, x FOR PEER REVIEW 10 of 17
Figure 10. Mean task performance rate for trials without and with DRT stimuli [38].
Figure 11. Mean task completion times for trials without and with DRT stimuli [38].
2.5.1. DRT Intrusiveness on Driving Performance
In the study, participants were asked to drive at a constant speed of 130 km on a simulated highway route with low traffic intensity, which did not require them to overtake any vehicles. Consequently, the average driving speed did not change much during different trials, and standard deviationof the speed increased significantly when comparing trials without answering the DRT and trials with the RDRT and TDRT (Figure 8). There were also significant increases in the standard deviation of mean acceleration for trials with all three versions of RDRT, TDRT and ADRT compared to trials without DRT stimuli (Figure 9).
When performing more than one task, drivers can adjust their performance and allocate more effort to the primary task of driving [3]. In the study [38], this is evident from the fact that the average speed across all trials did not change; however, there was an increase in the average speed and acceleration deviations for trials with the DRT, indicating that participants had to put more effort into completing the task of driving at a constant speed. These results could be taken into
Figure 11. Mean task completion times for trials without and with DRT stimuli [38].
2.5.1. DRT Intrusiveness on Driving Performance
In the study, participants were asked to drive at a constant speed of 130 km on a simulated highwayroute with low traffic intensity, which did not require them to overtake any vehicles. Consequently,the average driving speed did not change much during different trials, and standard deviationof thespeed increased significantly when comparing trials without answering the DRT and trials with theRDRT and TDRT (Figure 8). There were also significant increases in the standard deviation of meanacceleration for trials with all three versions of RDRT, TDRT and ADRT compared to trials withoutDRT stimuli (Figure 9).
When performing more than one task, drivers can adjust their performance and allocate moreeffort to the primary task of driving [3]. In the study [38], this is evident from the fact that the averagespeed across all trials did not change; however, there was an increase in the average speed andacceleration deviations for trials with the DRT, indicating that participants had to put more effort intocompleting the task of driving at a constant speed. These results could be taken into considerationwhen evaluating IVIS with the DRT and driving performance data; some of the speed and acceleration
Sensors 2018, 18, 594 11 of 17
deviations (if these are considered as driving performance indicators) could be the result of answeringDRT stimuli and not necessarily because of the use of the tested IVIS. Additional caution should alsobe taken when performing studies with the DRT in a real driving environment, to ensure the testdriver’s safety.
2.5.2. DRT Intrusiveness on Secondary Task Performance
The performance of the secondary task (i.e., a delayed digit recall task (n-back task) [31]), did notdecrease statistically significantly when users were asked to respond to the DRT compared to trialswithout the DRT. However, an obvious fall in the performance success rate is evident for trials with theTDRT and ADRT (Figure 10). Furthermore, the time needed to complete each part of the task increasedsignificantly for trials which also included answering DRT stimuli (Figure 11). As the task completiontime is a common indicator of a system’s usability, researchers should be careful in interpreting thisdata when evaluating a system using the DRT.
3. Alternative Methods for the Assessment of Driver’ Cognitive Distraction
Cognitive load does not have a quantity unit, and is therefore always observed relatively, mainlythrough other parameters that change when cognitive demand increases. It has been conceptualizedas the allocation of mental resources or effort needed to perform one or more tasks at a time [39],an as a multidimensional construct representing the load that performing a particular task imposes onthe learner’s cognitive system [8]. As shown with the DRT, cognitive load and its effect on attention canbe successfully measured by observing secondary tasks performance indicators, such as response times(time completion times) and hit rates (performance success). Driving performance is also observed asan indicator of changes in cognitive load [40–42]. One such method that uses degradation of drivingperformance is the Lane Change Task. With this method, drivers have to change lanes according tospecific visually presented signs within a simulated driving environment. The number of successfullane changes, lane deviations, and steering angles when performing the lane change are compared fortrials without and with a secondary task, to explore changes in cognitive load. However, Engström et al.suggest that cognitive distraction in this method only affects detection and response to the visual signs(successful lane changes), whereas lane deviations and other driving performance indicators are morea result of visual distraction [43]. Unlike the DRT, this method can only be used in simulated drivingenvironments, which are usually very simple and do not include any other traffic interaction in orderto not compromise the primary task of lane changes. This raises the question of the ecological validityof studies performed with this method or whether the obtained results from such experiments can bereplicated in real-life situations.
Alternatively, an increase in cognitive load can also be reported subjectively throughself-assessment questionnaires or by monitoring psychophysiological parameters, such as pupilometryor cardiovascular, electrodermal and neural activity.
Many studies use self-evaluation questionnaires to determine the level of cognitive load thata particular task may impose on an operator. Although self-ratings may appear questionable, studieshave demonstrated that people are capable of giving a numerical indication of their perceived load [8].However, some information can be lost or affected due to the nature of collecting data, which is alwaysafter completing the task. At that point the participant could have already forgotten (if the task lastsa longer period of time), or could be influenced only by the events towards the end of the task (the lastthing the participant remembers). Nevertheless, self-evaluation questionnaires are commonly useddue to their cost and time efficiency and relatively simple administration.
Most subjective measures are multidimensional in that they assess groups of associatedvariables, such as mental effort, fatigue, and frustration, which are all highly correlated [8].For example, the NASA Task Load questionnaire (NASA-TLX), in the original [44] and numerousmodified forms [45–47], is one of the most common and still widely used scales for self-assessment.As a multi-dimensional rating procedure, it provides an overall workload score based on a

Sensors 2018, 18, 594 12 of 17
weighted average of ratings of originally six dimensions: mental, physical and temporal demand,and performance, effort and frustration. The Subjective Workload Assessment Technique (SWAT) usesonly three: time, mental and psychological stress load, and similarly to the NASA-TLX it uses conjointmeasurement and scaling techniques to develop a single, global rating scale [48]. This rating score,however, does not give information only on cognitive load; it is an overall assessment of the driver’sworkload for performing a task, which can also be due to the visual, manual or other type of demand.Both methods have been primarily used for the assessment of aircraft operators but have since spreadalso to other vehicle operators.
Furthermore, for more detailed and extensive research, questionnaires such as the WorkloadProfile (WP) are used. The WP does not ask participants to rate the amount of load they haveexperienced, but to identify which attentional resource (the sheet of definitions on each of themis also provided) they had to use to complete the task [49]. This method has been shown to besuperior in sensitivity compared to the NASA-TLX and SWAT [50], and due to the fact that it doesdifferentiate between resources, cognitive load can be distinguished from other types of resourcedemand. Nevertheless, its implementation and interpretation are much more challenging than theformer two. Although questionnaires represent a relatively easy way of gathering data, they are oftenconsidered as unreliable and are usually accompanied with at least one other method for workloadassessment. This suggests that they are used more as a complementary method to the DRT, rather thanas an alternative.
Observing and capturing psychophysiological parameters, on the other hand, is quite the opposite.It requires higher financial and technical input, but it is usually viewed as more valid and reliable.There are a number of methods and sensors developed for assessing the physical and psychologicalstate of the driver in relation to his/her cognitive load. Heart rate (HR) sensors, for example,are one of the earliest and commonly used biometric indicators of changes in cognitive load in vehicleoperators [51]. Heart rate variability (HRV) is used, with a number of researchers indicating that it issuperior to HR [52] when assessing changes in cognitive load. Mehler et al., however, suggest that bothparameters can be used as indicators of changes in cognitive load. In their study, results even indicatedthat with HR it is possible to detect also a low-level task, unlike HRV, which was only sensitive tohigher demands of cognitive load [53]. Still, the authors comment that they do not support the ideathat one measurement is superior to the other. Instead, they suggest that physiological measurementscan be influenced by the conditions and environment in which the testing is taking place, as well as thetype of workload that is imposed by the secondary task (for example, pure cognitive or not). They alsosuggest supporting cardiovascular measurements with electrodermal measurements, such as skinconductance, to further increase the reliability of such tests. Electrodermal activity (EDA) sensorsare used to collect electrophysiological data to explore and understand the emotional and cognitiveprocess. It is important to note that EDA is composed of two components: the electrodermal level,which occurs as a thermoregulatory process, and electrodermal responses, which are correlated withsympathetic nervous discharges [54]. The latter are interpreted as indicators of a particular emotionalor cognitive faction. As mentioned earlier, skin conductance is used as a supporting measurementfor the assessment of the driver’s cognitive load [53,55]. We could not find any studies that wouldreport on the driver’s cognitive load or cognitive distraction relying solely on this measurement.Furthermore, it is important to be aware that the same sweat glands are also activated when humansexperience stress, and models that differentiate between these two should be applied when interpretingthe data [56].
As a substitute, eye activities such as pupil size, blink frequency and blink frequency variabilitycan also be used for the assessment of a driver’s cognitive demand. Pupil size, for example, increaseswhen humans are exposed to increased cognitive demand [57,58]. Researchers have reported studiesin which the effects of cognitively demanding tasks while driving can be detected with both low-costand high-end eye trackers [24,59,60]. Instead of only observing the physical changes in the driver’seyes, it has been found that cognitive distraction can also be understood from visual behaviour,

Sensors 2018, 18, 594 13 of 17
such as following the driver’s gaze (eye tracking) and effects (visual tunnelling and eye fixations),as it affects the driver’s visual field horizontally and vertically, and glances at the rear mirrors orspeed signs are less frequent [6,61]. The biggest disadvantage of eye trackers is that the eye isvery light sensitive, and the collected data can also be influenced by visual load and distraction.Therefore, eye activities, especially pupil size, can also be the result of changes in surrounding lightingor due to visual information related to traffic (signs, brake lights or traffic lights). In controlled drivingenvironments, such as driving simulators, these difficulties can be avoided; however, in real-lifevehicles, eye-trackers can be more difficult to use.
Furthermore, electroencephalogram (EEG) is also used for the assessment of the driver’s cognitivedistraction and can be interpreted as the closest sensory-based method to directly measure cognitiveload. EEG variables that indicate changes in cognitive demand are alpha suppression, increasedbeta, increased frontal midline theta, and ratios such as beta–alpha plus theta and alpha plustheta–beta [62,63]. While the EEG can record even the slightest increase in cognitive load, it cannotdetect cognitive underload, which can occur due to the lack of attention [64]. For this type of cognitivedistraction, event-related potentials (ERPs) are more appropriate. The ERP is a direct brain response tosensory, cognitive or motor stimuli, and is also recorded with EEG sensors. Most of these methodswere developed for the assessment of cognitive load in general, and not solely for the assessment ofdrivers’ cognitive load and distraction. The driving environment is quite dynamic and the testingconditions are much different than laboratory and research noise-free and controlled ones, which callsfor precaution when interpreting the data, or use of a much simpler solution (if the study characteristicsallow it), such as the Detection-Response Task.
4. Conclusions
The detection-response method (DRT) has gained popularity in the human-computer interaction(HCI) research community mainly due to its simple implementation, lower cost than use of biometricsensors, and more reliable detection of the effects of cognitive load compared to self-evaluationquestionnaires. The need for such a method has also been confirmed by all the suggestions forimprovements during the years and the effort invested into developing four different versions withthe purpose of making it suitable for different testing environments and various IVIS modalities.
In order to collect reliable data, the method characteristics and limitations should be taken intoconsideration when performing research studies, and the right version should be chosen based onthe environment and the tested in-vehicle interaction and infrastructure. The DRT relies on theperception of either visual, tactile or auditory stimuli, which can cause an overlap in modalitiesused for interaction with in-vehicle interfaces. These overlaps should therefore be avoided whenselecting the most appropriate DRT method. For example, the visual versions, RDRT or HDRT,could be used for testing less visually demanding IVISs as they all rely on the same perception channel.Similarly, the tactile version, TDRT, should not be used for interfaces relying on tactile informationpresentation (for example seat or steering wheel vibrations), and could be used instead for visual orauditory interfaces. The auditory DRT could be used for the assessment of pure cognitive tasks andvisual-manual interfaces. From the reported evaluation of various research studies, it can be concludedthat different modalities also enable the use of different testing environments; for desktop simulators,where head turning is not required, the RDRT offers the simplest implementation. The ADRT or TDRT,on the other hand, could be used for set-ups with changing lighting or a number of visual distractions,such as traffic and vehicle lights, dash-board information signals or direct sunlight, which could leadto overlooking visual stimuli.
It is important to mention that although the DRT method does not impose additional cognitiveload, it does affect the driver’s performance and secondary task performance. Increased speed andacceleration variations indicate that the driver’s performance is affected by the DRT, which on realroads can endanger the driver and the rest of the traffic participants. Controlled driving environments,such as simulators and surrogate driving set-ups, may be more appropriate when using this method

Sensors 2018, 18, 594 14 of 17
in order to avoid casualties and preserve test drivers’ safety. Task completion time is a commonindicator of a system’s usability and intuitiveness. Because answering DRT stimuli increases thetask completion times for secondary tasks (operation of IVIS), researchers should be careful wheninterpreting these data.
Even though the implementation methods and collection of response times can be performedwith an average PC, its implementation was made even easier after Krause et al. published an opensource code and detailed step-by-step instructions on how to construct an Arduino based systemfor stimuli presentation and collection of response times [65]. Alternatively, there are also availableready-to-use DRT sets [66], or even companies that offer performing DRT studies as a service [67].
After reviewing the potential uses and limitations of the method, and comparing it with thepossible alternatives, the detection-response task can be considered as an easy to use and implementmethod, which allows relevant assessment and evaluation of in-vehicle systems. By following thestandard and other published recommendations for different environments, while taking into accountthe method’s limitations and intrusiveness, researchers can obtain reliable and valuable results on theeffect of cognitive load on drivers’ attention.
Acknowledgments: The authors acknowledge the financial support from the Slovenian Research Agency.
Conflicts of Interest: The authors declare no conflict of interest.
References
1. NHTSA. Distracted Driving. Available online: https://www.nhtsa.gov/risky-driving/distracted-driving(accessed on 8 November 2017).
2. Regan, M.A.; Hallett, C.; Gordon, C.P. Driver distraction and driver inattention: Definition, relationship andtaxonomy. Accid. Anal. Prev. 2011, 43, 1771–1781. [CrossRef] [PubMed]
3. Young, K.; Regan, M.; Hammer, M. Driver distraction: A review of the literature. In Distracted Driving;Australasian College of Road Safety: Sydney, Australia, 2007; pp. 379–405.
4. Lee, J.D.; Young, K.L.; Regan, M.A. Defining driver distraction. In Driver Distraction: Theory, Effects,and Mitigation; CRC Press: Boca Raton, FL, USA, 2008; Volume 13, pp. 31–40.
5. James, W. The Principle of Psychology; Holt: New York, NY, USA, 1890.6. Recarte, M.A.; Nunes, L.M. Mental workload while driving: Effects on visual search, discrimination,
and decision making. J. Exp. Psychol. Appl. 2003, 9, 119. [CrossRef] [PubMed]7. Wilson, F.A.; Stimpson, J.P. Trends in fatalities from distracted driving in the United States, 1999 to 2008.
Am. J. Public Health 2010, 110, 2213–2219. [CrossRef] [PubMed]8. Paas, F.; Tuovinen, J.E.; Tabbers, H.; Van Gerven, P.W. Cognitive load measurement as a means to advance
cognitive load theory. Educ. Psychol. 2003, 38, 63–71. [CrossRef]9. ISO (International Organization for Standardization). Road Vehicles—Transport Information and Control
Systems—Detection-Response Task (DRT) for Assessing Attentional Effects of Cognitive Load in Driving;ISO: Geneva, Switzerland, 2016; p. 17488.
10. Stojmenova, K.; Sodnik, J. Validation of the Auditory Detection-Response Task Method for Assessing theAttentional Effects of Cognitive Load. Traffic Injury Prev. 2018; accepted for publication.
11. Woodworth, R.S. Experimental Psychology; Oxford and IBH Publishing: New Delhi, India, 1954.12. Kemp, B.J. Reaction time of young and elderly subjects in relation to perceptual deprivation and signal-on
versus signal-off condition. Dev. Psychol. 1973, 8, 268–272. [CrossRef]13. Marshall, W.H.; Talbot, S.A.; Ades, H.W. Cortical response of the anaesthesized cat to gross photic and
electrical afferent stimulation. J. Neurophysiol. 1943, 6, 1–15. [CrossRef]14. Robinson, E.S. Work of the integrated organism. In Handbook of General Experimental Psychology;
Murchison, C., Ed.; Clark University Press: Worcester, MA, USA, 1934.15. Chocholle, R. Variation des temps de réaction auditifs en fonction de l’intensité à diverses fréquences
[Variation of auditory reaction times as a function of intensity at various frequencies]. Année Psychol. 1940,41, 65–124. [CrossRef]

Sensors 2018, 18, 594 15 of 17
16. Kohfeld, D.L.; Santee, J.L.; Wallace, N.D. Loudness and reaction time: I. Atten. Percept. Psychophys. 1981, 29,535–549. [CrossRef]
17. Nissen, M.J. Stimulus intensity and information processing. Atten. Percept. Psychophys. 1977, 22, 338–352.[CrossRef]
18. Stojmenova, K.; Policardi, F.; Sodnik, J. On the selection of stimulus for the Auditory Variant of the DetectionResponse Task Method for driving experiments. Traffic Injury Prev. 2017, 19, 23–27. [CrossRef] [PubMed]
19. Van Winsum, W.; Martens, M.; Herland, L. The Effects of Speech versus Tactile Driver Support Messages onWorkload, Driver Behaviour and User Acceptance; TNO-Report; TNO Human Factors Research Institute:Soesterberg, The Netherlands, 1999.
20. Martens, M.H.; Van Winsum, W. Measuring Distraction: The Peripheral Detection Task; TNO-Report;TNO Human Factors Research Institute: Soesterberg, The Netherlands, 2000.
21. Olsson, S.; Burns, P.C. Measuring Driver Visual Distraction with a Peripheral Detection Task; Technical Report;National Highway Traffic Safety Administration: Washington, DC, USA, 2000.
22. Merat, N.; Johansson, E.; Engström, J.; Chin, E.; Nathan, F.; Victor, T. Specification of a Secondary Task to Be Usedin Safety Assessment of IVIS. AIDE Deliverable 2.2.3, IST-1-507674-IP. European Commission. 2006. Availableonline: http://www.aide-eu.org/pdf/sp2_deliv_new/aide_d2_2_3.pdf (accessed on 1 December 2017).
23. Ranney, T.A.; Baldwin, G.H.; Parmer, E.; Domeyer, J.; Martin, J.; Mazzae, E.N. Developing a Test to MeasureDistraction Potential of in-Vehicle Information System Tasks in Production Vehicles; No. HS-811 463; HighwayTraffic Safety Administration: Washington, DC, USA, 2011.
24. Cegovnik, T.; Stojmenova, K.; Jakus, G.; Sodnik, J. An analysis of the suitability of a low-cost eye tracker forassessing the cognitive load of drivers. Appl. Ergon. 2018, 68, 1–11. [CrossRef] [PubMed]
25. Stojmenova, K.; Jakus, G.; Sodnik, J. Sensitivity evaluation of the visual, tactile, and auditory detectionresponse task method while driving. Traffic Injury Prev. 2017, 18, 431–436. [CrossRef] [PubMed]
26. Merat, N.; Jamson, A.; Leeds, U. Multisensory signal detection: How does driving and IVIS managementaffect performance? In Proceedings of the 4th International Driving Symposium on Human Factors in DriverAssessment, Training and Vehicle Design, Iowa City, IA, USA, 9–12 July 2007; pp. 351–357.
27. Merat, N.; Jamson, A.H. The effect of stimulus modality on signal detection: Implications for assessing thesafety of in-vehicle technology. Hum. Factors 2008, 50, 145–158. [CrossRef] [PubMed]
28. Fastl, H.; Zwicker, E. Psychoacoustics: Facts and Models; Springer Science & Business Media:Berlin, Germany, 2006.
29. ISO (International Organization for Standardization). Road Vehicles—Ergonomic Aspects of Transport Informationand Control Systems—Calibration Tasks for Methods which Assess Driver Demand Due to the Use of In-VehicleSystems; ISO: Geneva, Switzerland, 2012; ISO standard number 14198.
30. Young, R.A.; Hsieh, L.; Seaman, S. The tactile detection response task: Preliminary validation for measuring theattentional effects of cognitive load. In Proceedings of the 7th International Driving Symposium on HumanFactors in Driver Assessment, Training and Vehicle Design, Bolton Landing, NY, USA, 17–20 June 2013.
31. Mehler, B.; Reimer, B.; Dusek, J.A. MIT AgeLab Delayed Digit Recall Task (n-Back); Massachusetts Institute ofTechnology: Cambridge, MA, USA, 2011.
32. Miura, T. Coping with situational demands: A study of eye movements and peripheral vision. In Proceedingsof Vision in Vehicles; Gale, A.G., Brown, I.D., Haslegrave, C.M., Smith, P., Taylor, S., Eds.; Elsevier: Amsterdam,The Netherlands, 1986; pp. 205–216.
33. Miura, T. Behavior oriented vision: Functional field of view and processing resources. In Eye Movements:From Physiology to Cognition; Elsevier: Amsterdam, The Netherlands, 1987; pp. 563–572.
34. Angell, L.S.; Young, R.A.; Hankey, J.M.; Dingus, T.A. An Evaluation of Alternative Methods for Assessing DriverWorkload in the Early Development of In-Vehicle Information Systems; SAE Technical Paper No. 2002-01-1981;SAE International: Blacksburg, VA, USA, 2002.
35. Graydon, F.X.; Young, R.; Benton, M.D.; Genik, R.J.; Posse, S.; Hsieh, L.; Green, C. Visual event detectionduring simulated driving: Identifying the neural correlates with functional neuroimaging. Transp. Res. PartF Traffic Psychol. Behav. 2004, 7, 271–286. [CrossRef]
36. Fitts, P.M.; Seeger, C.M. SR compatibility: Spatial characteristics of stimulus and response codes.J. Exp. Psychol. 1953, 46, 199. [CrossRef] [PubMed]

Sensors 2018, 18, 594 16 of 17
37. Verfaellie, M.; Bowers, D.; Heilman, K.M.; Proctor, R.W.; Reeve, T.G. Attentional processes in spatialstimulus-response compatibility. In Stimulus-Response Compatibility: An Integrated Perspective; Proctor, R.W.,Reeve, T.G., Eds.; Elsevier: Amsterdam, The Netherlands, 1990.
38. Stojmenova, K.; Sodnik, J. Detection-Response Task: How intrusive is it? In Proceedings 8th InternationalConference on Information Society and Techology, Kopaonik, Serbia, 11–14 March 2018; Zdravkovic, M.,Trajanovic, M., Konjovic, Z., Eds.; Eventiotic: Kopaonik, Serbia, 2018; under review.
39. Kahneman, D. Attention and Effort; Prentice-Hall: Englewood Cliffs, NJ, USA, 1973; Volume 1063, p. 4.40. ISO (International Organization for Standardization). Road Vehicles—Ergonomic Aspects of Transport Information
and Control Systems—Simulated Lane Change Test to Accesses in-Vehicle Secondary Task Demand; ISO: Geneva,Switzerland, 2010; ISO standard number 26022.
41. Young, K.L.; Lenné, M.G.; Williamson, A.R. Sensitivity of the lane change test as a measure of in-vehiclesystem demand. Appl. Ergon. 2011, 42, 611–618. [CrossRef] [PubMed]
42. Liang, Y.; Reyes, M.L.; Lee, J.D. Real-time detection of driver cognitive distraction using support vectormachines. IEEE Trans. Intell. Transp. Syst. 2007, 8, 340–350. [CrossRef]
43. Engström, J.; Markkula, G. Effects of visual and cognitive distraction on lane change test performance.In Proceedings of the 4th International Driving Symposium on Human Factors in Driver Assessment,Training, and Vehicle Design, Iowa City, IA, USA, 9–12 July 2007; pp. 199–205.
44. Hart, S.G.; Staveland, L.E. Development of NASA-TLX (Task Load Index): Results of empirical and theoreticalresearch. Adv. Psychol. 1988, 52, 139–183.
45. Byers, J.C.; Bittner, A.C.; Hill, S.G. Traditional and raw task load index (TLX) correlations: Are pairedcomparisons necessary? In Advances in Industrial Ergonomics & Safety; Mital, A., Ed.; CRC Press: New York,NY, USA, 1989; Volume 1, pp. 481–485.
46. Moroney, W.F.; Biers, D.W.; Eggemeier, F.T.; Mitchell, J.A. A comparison of two scoring procedures with theNASA task load index in a simulated flight task. In Proceedings of the IEEE 1992 National Aerospace andElectronics Conference, Dayton, OH, USA, 18–22 May 1992; pp. 734–740.
47. Pauzié, A. A method to assess the driver mental workload: The driving activity load index (DALI). IET Intell.Transp. Syst. 2008, 2, 315–322. [CrossRef]
48. Reid, G.B.; Nygren, T.E. The subjective workload assessment technique: A scaling procedure for measuringmental workload. Adv. Psychol. 1988, 52, 185–218.
49. Tsang, P.S.; Velazquez, V.L. Diagnosticity and multidimensional subjective workload ratings. Ergonomics1996, 39, 358–381. [CrossRef] [PubMed]
50. Rubio, S.; Díaz, E.; Martín, J.; Puente, J.M. Evaluation of subjective mental workload: A comparison of SWAT,NASA-TLX, and workload profile methods. Appl. Psychol. 2004, 53, 61–86. [CrossRef]
51. Wierwille, W.W.; Eggemeier, F.T. Recommendations for mental workload measurement in a test andevaluation environment. Hum. Factors 1993, 35, 263–281. [CrossRef]
52. Mulder, L.J.M. Measurement and analysis methods of heart rate and respiration for use in appliedenvironments. Biol. Psychol. 1992, 34, 205–236. [CrossRef]
53. Mehler, B.; Reimer, B.; Wang, Y. A comparison of heart rate and heart rate variability indices in distinguishingsingle-task driving and driving under secondary cognitive workload. In Proceedings of the SixthInternational Driving Symposium on Human Factors in Driver Assessment, Training and Vehicle Design,Lake Tahoe, CA, USA, 27–30 June 2011; pp. 590–597.
54. Sequeira, H.; Hot, P.; Silvert, L.; Delplanque, S. Electrical autonomic correlates of emotion. Int. J. Psychophysiol.2009, 71, 50–56. [CrossRef] [PubMed]
55. Son, J.; Myoungouk, P. Estimating cognitive load complexity using performance and physiological data ina driving simulator. In Proceedings of the Adjunct Automotive User Interfaces and Interactive VehicularApplications Conference, Salzburg, Austria, 29 November–2 December 2011.
56. Setz, C.; Bert, A.; Schumm, J.; La Marca, R.; Tröster, G.; Ehlert, U. Discriminating stress from cognitive loadusing a wearable EDA device. IEEE Trans. Inform. Technol. Biomed. 2010, 14, 410–417. [CrossRef] [PubMed]
57. Marshall, S.P. The index of cognitive activity: Measuring cognitive workload. In Proceedings of the 2002IEEE 7th Conference on Human Factors and Power Plants, Scottsdale, AZ, USA, 19 September 2002; p. 7.
58. Van Gog, T.; Kester, L.; Nievelstein, F.; Giesbers, B.; Paas, F. Uncovering cognitive processes: Differenttechniques that can contribute to cognitive load research and instruction. Comput. Hum. Behav. 2009, 25,325–331.

Sensors 2018, 18, 594 17 of 17
59. Klingner, J.; Kumar, R.; Hanrahan, P. Measuring the task-evoked pupillary response with a remote eyetracker. In Proceedings of the 2008 Symposium on Eye Tracking Research & Applications, Savannah, Georgia,26–28 March 2008; pp. 69–72.
60. Palinko, O.; Kun, A.L.; Shyrokov, A.; Heeman, P. Estimating cognitive load using remote eye tracking ina driving simulator. In Proceedings of the 2010 Symposium on Eye-Tracking Research & Applications,Austin, TX, USA, 22–24 March 2010; pp. 141–144.
61. Stuyven, E.; Van der Goten, K.; Vandierendonck, A.; Claeys, K.; Crevits, L. The effect of cognitive load onsaccadic eye movements. Acta Psychol. 2000, 104, 69–85. [CrossRef]
62. Antonenko, P.; Paas, F.; Grabner, R.; Van Gog, T. Using electroencephalography to measure cognitive load.Educ. Psychol. Rev. 2010, 22, 425–438. [CrossRef]
63. Klimesch, W. EEG alpha and theta oscillations reflect cognitive and memory performance: A review andanalysis. Brain Res. Rev. 1999, 29, 169–195. [CrossRef]
64. Wester, A.E.; Böcker, K.B.E.; Volkerts, E.R.; Verster, J.C.; Kenemans, J.L. Event-related potentials andsecondary task performance during simulated driving. Accid. Anal. Prev. 2008, 40, 1–7. [CrossRef][PubMed]
65. Krause, M.; Conti, A.; Späth, M.; Bengler, K. Testing Open-Source Implementations for Detection ResponseTasks. In Proceedings of the XV International Conference on Human Computer Interaction (Interacción ’14),Puerto de la Cruz, Spain, 10–12 September 2014.
66. Red Scientific. Detection Response Task Kit. Available online: http://www.redscientific.com/products/drt.php (accessed on 14 December 2017).
67. NERVteh. Services. Road Safety Organizations. Available online: https://www.nerv-teh.com/ (accessed on4 December 2007).
© 2018 by the authors. Licensee MDPI, Basel, Switzerland. This article is an open accessarticle distributed under the terms and conditions of the Creative Commons Attribution(CC BY) license (http://creativecommons.org/licenses/by/4.0/).