Embed Size (px)
Citation preview

This article was downloaded by: [University of Auckland Library]On: 08 October 2014, At: 16:14Publisher: Taylor & FrancisInforma Ltd Registered in England and Wales Registered Number:1072954 Registered office: Mortimer House, 37-41 Mortimer Street,London W1T 3JH, UK
Toxicological &Environmental ChemistryPublication details, including instructions forauthors and subscription information:http://www.tandfonline.com/loi/gtec20
Detection or trace levels ofpolyethylene glycol ethersurfactants in biologicaltissuesD. Fung a , S. Safe a & Dr. J.F.S. Crocker ba Guelph‐Waterloo Centre for Graduate Work inChemistry, Department of Chemistry , Universityof Guelph , Guelph, Ontario, NIG2WI, Canadab Izaak Walton Killam Hospital for Children,Department of Pediatrics , Dalhousie University ,Halifax, Nova Scotia, B3J3G9, CanadaPublished online: 19 Sep 2008.
To cite this article: D. Fung , S. Safe & Dr. J.F.S. Crocker (1984) Detectionor trace levels of polyethylene glycol ether surfactants in biological tissues,Toxicological & Environmental Chemistry, 8:2-3, 109-118
To link to this article: http://dx.doi.org/10.1080/02772248409357045
PLEASE SCROLL DOWN FOR ARTICLE
Taylor & Francis makes every effort to ensure the accuracy of allthe information (the “Content”) contained in the publications on ourplatform. However, Taylor & Francis, our agents, and our licensorsmake no representations or warranties whatsoever as to the accuracy,completeness, or suitability for any purpose of the Content. Any opinionsand views expressed in this publication are the opinions and views ofthe authors, and are not the views of or endorsed by Taylor & Francis.The accuracy of the Content should not be relied upon and should beindependently verified with primary sources of information. Taylor and

Francis shall not be liable for any losses, actions, claims, proceedings,demands, costs, expenses, damages, and other liabilities whatsoeveror howsoever caused arising directly or indirectly in connection with, inrelation to or arising out of the use of the Content.
This article may be used for research, teaching, and private studypurposes. Any substantial or systematic reproduction, redistribution,reselling, loan, sub-licensing, systematic supply, or distribution in anyform to anyone is expressly forbidden. Terms & Conditions of accessand use can be found at http://www.tandfonline.com/page/terms-and-conditions
Dow
nloa
ded
by [
Uni
vers
ity o
f A
uckl
and
Lib
rary
] at
16:
14 0
8 O
ctob
er 2
014

Toxicological and Environmental Chemistry, 1984, Vol. 8, pp. 109-1180277-2248/84/0803-0109 $18.50/0© Gordon and Breach Science Publishers Inc., 1984Printed in Great Britain
Detection or Trace Levels ofPolyethylene Glycol EtherSurfactants in Biological TissuesD. FUNG AND S. SAFEGuelph-Waterloo Centre for Graduate Work in Chemistry, Department ofChemistry University of Guelph, Guelph, Ontario, Canada NIG2WI
and
Dr. J. F. S. CROCKERIzaak Walton Killam Hospital for Children, Department of Pediatrics,Dalhousie University, Halifax Nova Scotia, Canada B3J3G9
(Received November, 15, 1983)
This paper reports the development and application of an analytical method in whichboth polyethylene glycol ethers or polyethylene glycols are converted into ethylenedibromide via treatment with concentrated hydrobromic acid/glacial acetic acid (1:1)at 150°C for 3 hours. This method can detect <1 ppm of the surfactant in biologicaltissues, however, the practical utility of the technique is dependent on the solvent andreagent purities and the various cleanup methods which include base hydrolysis, highpressure liquid chromatography and Florisil or acidified Florisil columnchromatography.
INTRODUCTION
Nonionic polyethylene glycol-derived surfactants are widely usedindustrial chemicals which have been detected as residues inenvironmental samples.1"5 Although the initial cleavage of the etherlinkage in these compounds is rapid there is evidence which indicates
109
Dow
nloa
ded
by [
Uni
vers
ity o
f A
uckl
and
Lib
rary
] at
16:
14 0
8 O
ctob
er 2
014

110 D. FUNG, S. SAFE AND J. F. S. CROCKER
that the polyethylene glycol moieties may be relatively more resistantto environmental or biological breakdown. Numerous methods havebeen described for the analysis of this class of compounds includingpaper and thin-layer chromatography (TLC), gas chromatography(GC), high pressure liquid chromatography (HPLC) and combinedGC-mass spectrometry (MS).1"6 All of these procedures either lacksensitivity or the precise quantitation of the total surfactant presentis complicated due to the complex nature of the polyethylene glycoland polyethylene glycol ether formulations.
Tobin and co-workers5'7 proposed an alternative scheme in whichthese surfactants were treated with concentrated HBr and convertedinto ethylene dibromide which was readily detected by GC coupledto an electron capture (EC) detector. However, initial studies8 usingthis approach to analyze for polyethylene glycol ethers in biologicsamples indicated that a large number of compounds werecoextracted with the surfactant; moreover, the control (unspiked)sample contained a compound which cochromatographed withethylene dibromide.
Recent reports suggest that commercial polyethylene glycol etherpreparations can play an important role in modulating the toxicaction of viruses both in vivo and in vitro.9~i3 For example, ToximulMP-8 and Atlox 3409, two detergent formulations which containboth nonionic polyethylene glycol ethers and anionic surfactants, areknown to alter the interferon production and antiviral activity inhost animals exposed to influenza B viral infections. Moreover, theexposed animals exhibit a Reye's-like Syndrome if the chemicals areadministered dermally or by intraperitoneal injection. Since theetiology of Reye's Syndrome and the possible role of chemicalagent(s) has not been established,12 this research was undertaken todevelop more sensitive analytical methods for determiningpolyethylene glycol-derived surfactants in biological tissues.
MATERIALS AND METHODS
Extraction, cleanup and analysis
Rat or human tissue (liver, kidney, brain) was ground withanhydrous sodium sulfate (4-5 g) and méthylène chloride (15 ml). Themixture was filtered, washed twice with 10 ml portions of méthylène
Dow
nloa
ded
by [
Uni
vers
ity o
f A
uckl
and
Lib
rary
] at
16:
14 0
8 O
ctob
er 2
014
DETECTION OF TRACE ELEMENTS 111
chloride and the combined extracts concentrated to a small volume(1 ml). The analytical method used was based on hydrobromic acidcleavage technique5'7 with some procedural modifications. The tissueextract was transferred to a glass ampoule (made from combustiontubing 8 in. long, 0.3 in. i.d. with 0.1 in. wall thickness and sealed atone end) and the solvent was removed by evaporation using astream of nitrogen. Hydrobromic acid/glacial acetic acid 1:1 (0.5 ml)was added to the dried residue in the ampoule, the tube was sealedand placed in an oven at 150°C for 3h. The ampoule was thencooled and the contents transferred to another tube; the reactionmixture was diluted with water (3 ml) and extracted with petroleumether (2x1 ml) or hexane. The extract was then filtered through aPasteur pipette column filled with activated Florisil (1 cm, bottom)and anhydrous sodium sulfate (0.5 cm, top) and then analyzed byGC on a 6 ft x 4 mm (i.d.) glass column packed with 1.5% OV 17+ 2%OV 210 on Gas Chrom Q 100/120 mesh (ChromatographieSpecialties); the oven temperatures were programmed after 4 minfrom 60-150°C (at S^min"1), the (EC) detector temperature was300°C, the carrier gas was argon/methane (5%methane) with a flowrate of 60 ml min"1. The presence of the polyethylene glycol ethersurfactant was indicated by the increase of the 1,2-dibromoethaneGC peak after the derivatization of the tissue extracts. Due to thecomplexity of the matrix, the extracts were subjected to variouscleanup procedures before the HBr cleavage. In each case, tissue wasspiked with a known amount of polyethylene glycol surfactant andthen analyzed to determine the efficiency of the cleanup procedures.
a) Florisil Column. The concentrated extract (1 ml) wasintroduced on top of an activated Florisil column (15 cm x 1 cm) andeluted with méthylène chloride (20 ml) followed by methanol (15 ml).The methanol fraction was concentrated, transferred to glassampoule degraded to ethylene dibromide and analyzed as describedearlier.
b) Acidified Florisil Column. The concentrated extract (0.2 ml)was layered on an acidified Florisil column (i.e. a Pasteur pipette)and eluted with méthylène chloride (20 ml) followed by 10%acetone/methylene chloride (15 ml). The 10% acetone/methylenechloride fraction was concentrated, transferred to glass ampoule andanalyzed as described above.
Dow
nloa
ded
by [
Uni
vers
ity o
f A
uckl
and
Lib
rary
] at
16:
14 0
8 O
ctob
er 2
014
112 D. FUNG, S. SAFE AND J. F. S. CROCKER
c) Preparative Reverse Phase HPLC. Reverse phase HPLCanalysis of polyethoxylate surfactants containing the nonylphenylgroup was investigated using UV detector with a 280 nm filter. TheUV spectra of Igepal CO-210 and Toximul MP-8 gave maxima at274 nm. Three columns were used in the study: an Ultrasil ODS,10 n 25 cm x 10 mm i.d. (Beckman); Ultrasil-ODS, 5/i 25 cm x 4.6 mmi.d. (Beckman); and LiChrosorb RP-8, 10 ¡i 25 cm x 4.0 mm i.d.(Hibar RT). A Beckman Model 110A HPLC equipped with an UVdetector, with methanol (or acetonitrile) as solvent at a flow rate of2.0ml min"1 was used. Standard Igepal CO-210 and Toximul MP-8solutions gave peaks within 10 min after injection. (Note: this wasdue to the variable polyethylene glycol chain lengths and isomericalkyl phenols). The concentrated tissue extract was dried, dissolvedin methanol (1.5 ml), filtered through millipore filter paper, andinjected on the preparative column (Ultrasil-ODS 10 /x25 cm x 10 mm i.d.) the fraction corresponding to the elution of thesurfactant standard was collected, dried, hydrolyzed with HBr/aceticacid and analyzed by GC-EC as previously described.
d) Base Hydrolysis. In this procedure, the tissue was ground withanhydrous sodium sulfate (4-5 g) and methanol (10 ml). The mixturewas filtered, washed with methanol (3x5 ml), and the combinedextracts dried by evaporation on a hot plate. The residue was re-dissolved in methanol (2-3 ml), concentrated to 1 ml and centrifugedto separate out the protein. The supernatant solution was filtered,6N sodium hydroxide (2 ml) was added, vortex mixed and allowedto stand for 15 min. The mixture was then diluted with distilled-in-glass water (5 ml), saturated sodium chloride solution (2 ml) andextracted 3 times with méthylène chloride (2 ml, lml, lml). Theméthylène chloride extracts were filtered through anhydrous sodiumsulfate, combined and dried. The residue was dissolved in methanol(2 ml) and transferred to a glass ampoule. The extract was dried,hydrolyzed with HBr and the ethylene dibromide produced analyzedby GC-EC as previously described.
Pharmacokinetic study of polyethylene glycol-derivedsurfactants in rats
a) Toximul MP-8. Toximul MP-8 was dissolved in a 5% sucrosesolution (2 g in 10 ml). The solution was administered to 1 month
Dow
nloa
ded
by [
Uni
vers
ity o
f A
uckl
and
Lib
rary
] at
16:
14 0
8 O
ctob
er 2
014
DETECTION OF TRACE ELEMENTS 113
old male Wistar rats (15 rats) by intraperitoneal injection(500 mg/kg/rat) and 3 rats were sacrificed at 0 (control), 3, 5.5, 9 and15 hours after administration (2 rats died between 3-15 h afterinjection, hence only a rat was left for the 15 h sample). The brainwas removed at time of sacrifice, extracted, subjected to the basehydrolysis cleanup and analyzed as previously described.
b) Polyethylene Glycol 400. Polyethylene glycol (averagemolecular weight 380-420, or 9 EO units) was dissolved in a 5%sucrose solution (2 g in 10 ml). The solution was administered to 1month old male Wistar rats (15 rats) by intraperitoneal injection(500 mg/kg/rat) and 3 rats were sacrificed at 0 (control), 3, 5.5, 9 and17 hours after administration. The brain was removed at time ofsacrifice, extracted, cleaned up using base hydrolysis and analyzed aspreviously described.
r
Analysis of human tissues
The presence of trace levels of polyethylene glycol-derived productswas determined in two human liver samples from children (deceased)using the Florisil and base hydrolysis cleanup procedures. One of theliver samples was obtained from a child with Reye's Syndrome.
Chemicals
Certified A.C.S. sodium chloride, sodium sulfate anhydrous, sodiumhydroxide, 48% aqueous hydrobromic acid, reagent gradehydrobromic acid C (30-32% in acetic acid), glacial acetic acid;pesticide grade n-pentane, hexanes, acetonitrile, diethylether,méthylène chloride and HPLC grade methanol were purchased fromFisher Scientific (Toronto); 47% min. hydrobromic acid ultrapureand acetic acid ultrapure from Thiokol/Ventron Division (Denvers,Ma.); and Florisil 60/100 mesh from Floridin Co. Activated Florisilwas prepared by placing the Florisil in oven at 180°C for 3h. Theacidified (40% H2SO4) Florisil was prepared by mixing concentratedsulfuric acid with Florisil (4:10 by weight) and the mixture wasshaken thoroughly. Igepal CO-210 was obtained from CommercialDevelopments of Canada Ltd. (Rexdale, Ont.); Toximul MP-8 fromCharles Tennant & Company Canada Ltd. (Toronto, Ont.) andPolyethylene Glycol 400 from Matheson Coleman & BellManufacturing Chemists (Norwood, Ohio).
TOXI—B
Dow
nloa
ded
by [
Uni
vers
ity o
f A
uckl
and
Lib
rary
] at
16:
14 0
8 O
ctob
er 2
014
114 D. FUNG, S. SAFE AND J. F. S. CROCKER
RESULTS AND DISCUSSION
Extraction, cleanup and analytical methodology
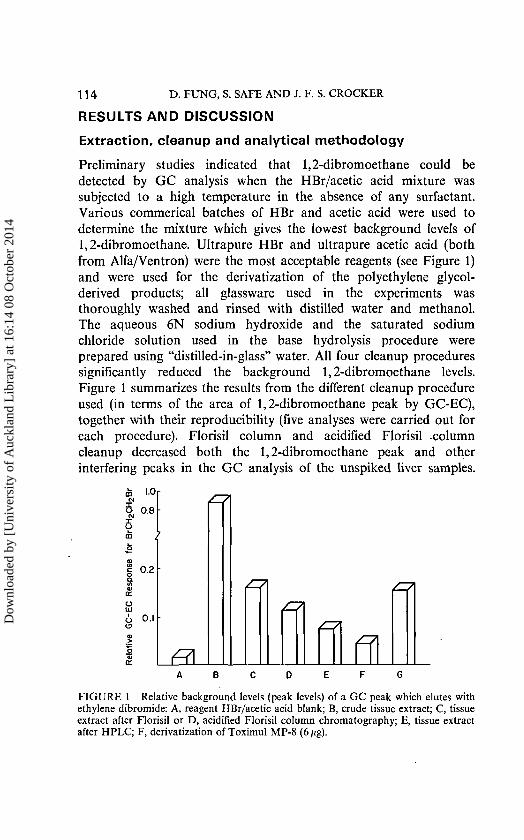
Preliminary studies indicated that 1,2-dibromoethane could bedetected by GC analysis when the HBr/acetic acid mixture wassubjected to a high temperature in the absence of any surfactant.Various commençai batches of HBr and acetic acid were used todetermine the mixture which gives the lowest background levels of1,2-dibromoethane. Ultrapure HBr and ultrapure acetic acid (bothfrom Alfa/Ventron) were the most acceptable reagents (see Figure 1)and were used for the derivatization of the polyethylene glycol-derived products; all glassware used in the experiments wasthoroughly washed and rinsed with distilled water and methanol.The aqueous 6N sodium hydroxide and the saturated sodiumchloride solution used in the base hydrolysis procedure wereprepared using "distilled-in-glass" water. All four cleanup proceduressignificantly reduced the background 1,2-dibromoethane levels.Figure 1 summarizes the results from the different cleanup procedureused (in terms of the area of 1,2-dibromoethane peak by GC-EC),together with their reproducibility (five analyses were carried out foreach procedure). Florisil column and acidified Florisil -columncleanup decreased both the 1,2-dibromoethane peak and otherinterfering peaks in the GC analysis of the unspiked liver samples.
CM
I 0-85
/
O.I/—A
A B C D E F G
FIGURE 1 Relative background levels (peak levels) of a GC peak which elutes withethylene dibromide: A, reagent HBr/acetic acid blank; B, crude tissue extract; C, tissueextract after Florisil or D, acidified Florisil column chromatography; E, tissue extractafter HPLC; F, derivatization of Toximul MP-8 (6/ig).
Dow
nloa
ded
by [
Uni
vers
ity o
f A
uckl
and
Lib
rary
] at
16:
14 0
8 O
ctob
er 2
014

DETECTION OF TRACE ELEMENTS 115
HPLC cleanup procedure also significantly decreased thebackground 1,2-dibromoethane GC peak, however, this treatmentdid not remove other interfering components. Base hydrolysis wasfound to be the most effective cleanup procedure. Typicalchromatograms of the tissue extract after HBr cleavage usingdifferent cleanup procedures are shown in Figure 2. Results of
n
CEOLJ
UJT I M E —
FIGURE 2 GC tracings of rat liver extract treated with HBr/acetic acid after (a) nocleanup; (b) Florisil or acidified Florisil cleanup; (c) HPLC cleanup; (d) basehydrolysis cleanup (note: retention time of ethylene dibromide indicated with anarrow).
recovery studies (analysis done in triplicate) for Igepal CO-210, andspiked tissue (with Igepal CO-210) using the base hydrolysisprocedure for brain, liver and kidney are shown in Figure 3. Thedetection limit for the polyethylene glycol ethers after the cleanupfollowed by the HBr cleavage procedure was < 1 ppm.
Pharmacokinetic study of polyethylene glycol-derivedsurfactants in rats
Preliminary studies with rats indicated that brain tissue preferentiallyretained the polyethylene glycol-derived surfactants and for this
Dow
nloa
ded
by [
Uni
vers
ity o
f A
uckl
and
Lib
rary
] at
16:
14 0
8 O
ctob
er 2
014

116 D. FUNG, S. SAFE AND J. F. S. CROCKER
• brain4 liver• kidneyo Igepal-
CO210
AMOUNT (in jug) OF IGEPAL CO 210 ADDED
FIGURE 3 Ethylene dibromide recoveries (as determined by GC-EC) from rat livertissues spiked with different concentrations of the commercial polyethylene glycolnonylphenyl ether, Igepal CO-210.
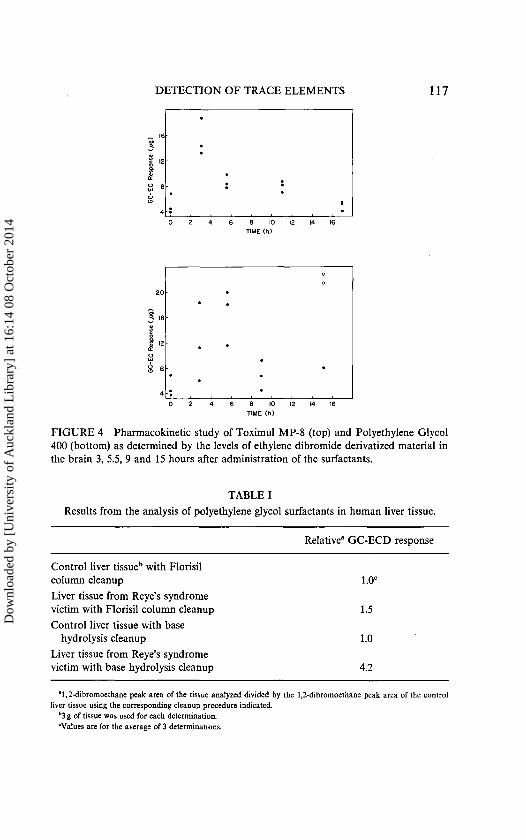
reason a time-course study of the levels of different surfactants inbrain tissue was carried out using two nonionic surfactantpreparation (Figure 4). The maximum brain concentration ofToximul MP-8 was observed 5 hours after administration of a500mg/kg dose of this commercial formulation. In contrast,Polyethylene Glycol 400 (average EO = 9-10), administered at thesame dose, was maximized in brain tissue 3 hours after exposure.The results suggest that the increased persistence of Toximul MP-8may be due to the nonylphenol ether linkage present in the nonionicpolyethylene glycol ether present in this formulation. Furtherresearch on the effects of structure on the persistence of this class ofcompounds in mammalian systems in progress.
Human liver samplesTable I summarizes the analysis of polyethylene glycol-derivedproducts in human liver samples using both the Florisil and basehydrolysis cleanup procedures followed by conversion into ethylenedibromide. A comparison of the GE-EC peak area ratios for
Dow
nloa
ded
by [
Uni
vers
ity o
f A
uckl
and
Lib
rary
] at
16:
14 0
8 O
ctob
er 2
014
DETECTION OF TRACE ELEMENTS 117
FIGURE 4 Pharmacokinetic study of Toximul MP-8 (top) and Polyethylene Glycol400 (bottom) as determined by the levels of ethylene dibromide derivatized material inthe brain 3, 5.5, 9 and 15 hours after administration of the surfactants.
TABLE IResults from the analysis of polyethylene glycol surfactants in human liver tissue.
Relative8 GC-ECD response
Control liver tissue1" with Florisilcolumn cleanup 1.0c
Liver tissue from Reye's syndromevictim with Florisil column cleanup 1.5Control liver tissue with base
hydrolysis cleanup 1.0Liver tissue from Reye's syndromevictim with base hydrolysis cleanup 4.2
"1,2-dibromoethane peak area of the tissue analyzed divided by the 1,2-dibromoethane peak area of the controlliver tissue using the corresponding cleanup procedure indicated.
b3 g of tissue was used for each determination.'Values are for the average of 3 determinations.
Dow
nloa
ded
by [
Uni
vers
ity o
f A
uckl
and
Lib
rary
] at
16:
14 0
8 O
ctob
er 2
014

118 D. FUNG, S. SAFE AND J. F. S. CROCKER
ethylene dibromide obtained after HBr treatment from extracts of acontrol human liver (cause of death unknown) and a Reye'sSyndrome patient gave ratios of 1.5 and 4.2 using the Florisil andbase hydrolysis methods respectively. The results suggest that theformer cleanup technique may be useful for determining polyethyleneglycol surfactant levels in human tissue and clearly an extensiveanalytical survey is required to firmly establish the possiblebioaccumulation of these xenobiotics in human and environmentalsamples. Future studies will utilize the derivatization methodologyfor detecting residues of polyethylene glycol-related materials inbiological tissue, however, this will also have to be confirmed by lesssensitive GC-MS analysis of the intact surfactants.
AcknowledgementThe financial assistance of the Natural Sciences and Engineering Research Council ofCanada is gratefully acknowledged.
References1. R. A. Llenado and R. A. Jamieson. Anal Chem. 53, 174R-182R (1981).2. W. Giger, E. Stephanou and C. Schaffner. Chemosphere 10, 1253-1263 (1981).3. L. S. Sheldon and R. A. Hites, Sci. Total Environ. 11, 279-286 (1979).4. P. Jones and G. Nickless. J. Chromatogr. 156, 99-110 (1978).5. R. S. Tobin, F. I. Onuska, D. H. J. Anthony and M. E. Comba. Ambio 5, 30-32
(1974).6. M. Kudoh, S. Fudano and S. Yamaguchi. J. Chromatogr. 205, 473-474 (1981).7. R. S. Tobin, F. I. Onuska, B. G. Brownlee, D. H. J. Anthony and M. E. Comba.
Water Res. 10, 529-535 (1976).8. S. H. Safe, O. Hutzinger and J. F. S. Crocker. Reye's Syndrome II, J. F. S. Crocker
ed., Grune and Stratton, New York, pp. 281-301 (1978).9. J. F. S. Crocker, R. L. Ozere, S. H. Safe, S. C. Digout, K. R. Rozee and O.
Hutzinger. Science 192, 1351-1353 (1978).10. G. Hug, J. Bosken, K. Bove, C. C. Linnemann Jr. and L. McAdams. Lab. Invest.
46, 89-109 (1981).11. K. R. Rozee, S. H. S. Lee, J. F. S. Crocker and S. H. Safe. Appl. Environ. Microb.
35, 297-300 (1978).12. J. F. S. Crocker and P. Bagnell. Can. Med. Assoc. J., 124, 375-383 (1981).13. J. F. S. Crocker, S. H. S. Lee, K. R. Rozee and S. C. Digout. J. Nat. Reye's
Syndrome Foundation 1, 120-125 (1980).
Dow
nloa
ded
by [
Uni
vers
ity o
f A
uckl
and
Lib
rary
] at
16:
14 0
8 O
ctob
er 2
014


![Electronic Supporting Information capture of blood cells ... · PDF filePoly(ethylene glycol) methyl ether methacrylate (OEGMA ... ethyl] azaniumyl] propane-1-sulfonate (SBMA ... Phosphate](https://img.pdfslide.us/doc/110x75/5a770c747f8b9ad22a8de812/electronic-supporting-information-capture-of-blood-cells-a-polyethylene.jpg)