Embed Size (px)
Citation preview
Detection of time-varying intensity distribution with CCDimage sensors
Osami Sasaki and Hirokazu Okazaki
A method of detection of the time-varying intensity distribution with CCD image sensors is proposed. Itis confirmed that the time-varying intensity can be reconstructed from the temporal output of a photodetec-tor element which is produced by integrating the time-varying intensity over the period of charge storage.This detection method is applied to measurement of the optical surface profile using sinusoidal phase-modu-lated laser light.
1. Introduction
Charge coupled device (CCD) image sensors arecurrently used in image processing. Among its manyuses a spatial intensity distribution of light on the CCDimage sensor is detected in the period of charge storage.'The CCD image sensors have not been used to detecttime-varying intensity distributions which are usuallydetected by scanning a photodiode or with a photodiodearray. As a special case, however, phase distributionof a sinusoidally time-varying intensity was detectedwith the CCD image sensor.2 Four outputs producedby integrating successively a sinusoidal signal overone-quarter period determined its phase.
In this paper we use the CCD image sensor to detecta time-varying intensity distribution. The integraldetection is analyzed to get the original time-varyingintensity. In experiments we detect sinusoidal phase-modulated laser light with a CCD image sensor. Andthis detection method is applied to measurement of theoptical surface profile using sinusoidal phase-modulatedlaser light.
II. Principle
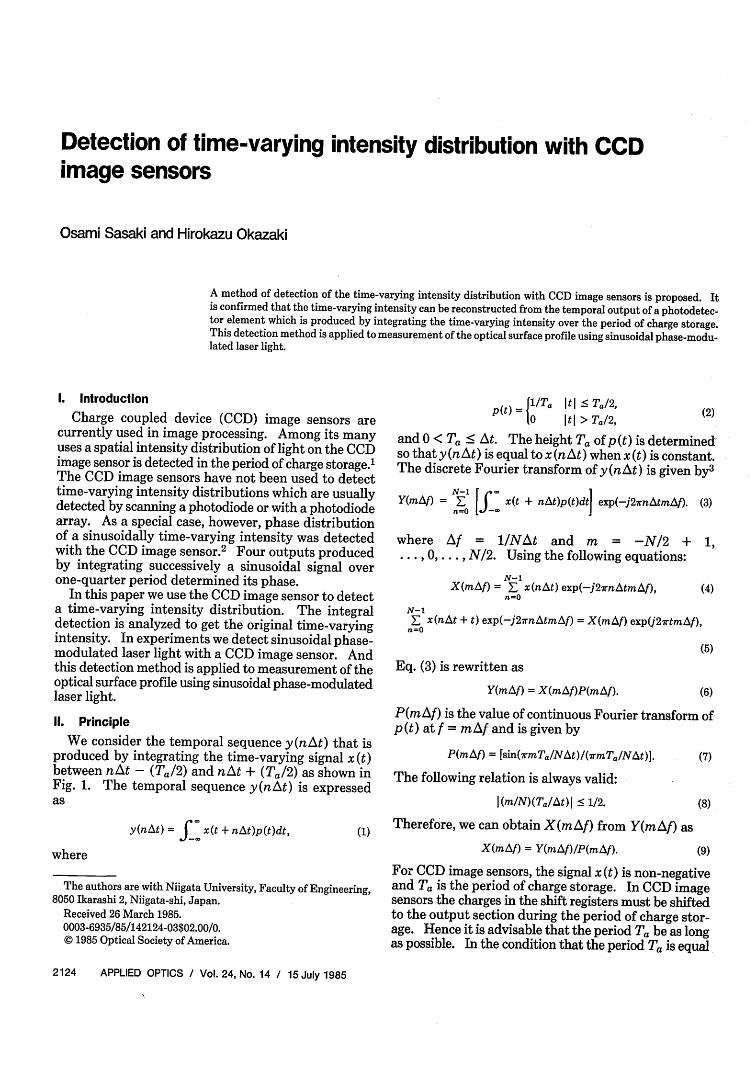
We consider the temporal sequence y(nAt) that isproduced by integrating the time-varying signal x(t)between nAt - (Ta/2) and nAt + (Ta/2) as shown inFig. 1. The temporal sequence y(nAt) is expressedas
y(nAt) = _ x(t + nAt)p(t)dt, (1)
where
The authors are with Niigata University, Faculty of Engineering,8050 Ikarashi 2, Niigata-shi, Japan.
Received 26 March 1985.0003-6935/85/142124-03$02.00/0.© 1985 Optical Society of America.
p(t) = l/Ta t < T/2,10 It > Ta/2, (2)
and 0 < Ta < At. The height Ta of p(t) is determinedso that y(nAt) is equal to x(nAt) when x(t) is constant.The discrete Fourier transform of y(nAt) is given by3
Y(mAf) = [ x(t + nt)p(t)dt exp(-j2rnAtmAf). (3)n=O -I
where Af = 1/NAt and m = -N/2 + 1,. . . , O,. . . , N/2. Using the following equations:
N-1X(mAf) = E x(nAt) exp(-j2,rnAtmAf),
n=O(4)
N-iL x(nAt + t) exp(-j27rnAtmAf) = X(mAf) exp(j27rtmAf),
n=0
(5)
Eq. (3) is rewritten as
Y(mAf) = X(mAf)P(mAf). (6)
P(mAf) is the value of continuous Fourier transform ofp(t) atf = mAf and is given by
P(mAf) = [sin(7rmT/NAt)/(lrmTa/NAt)].
The following relation is always valid:
(m/N) (TlA/t) 1/2.
Therefore, we can obtain X(mAf) from Y(mAf) as
X(mAf) = Y(mAf)/P(mAf).
(7)
(8)
(9)
For CCD image sensors, the signal x (t) is non-negativeand Ta is the period of charge storage. In CCD imagesensors the charges in the shift registers must be shiftedto the output section during the period of charge stor-age. Hence it is advisable that the period T be as longas possible. In the condition that the period Ta is equal
2124 APPLIED OPTICS / Vol. 24, No. 14 / 15 July 1985
,c(A M t)
X(t)I
X((N-1 )At)
0 At 2At (N-I)At t
a
ynt)y(0) y(At) ly(2At)
0 1 2
y((N-I)At)
(N n
Fig. 1. Temporal sequence y(nAt) produced by integrating thesignal x(t) between nAt - (Ta,/2) and nAt + (Ta/2).
to the sampling interval At, P(mnAf) has values between1 and 2/ir. Since the amplification of noise due to themultiplication of 7i/2 is considered to produce littledegradation of the signal-to-noise ratio, the period T,,is taken to be At in the following.
If all the charges in the shift registers cannot beshifted to the output section during the period Ta,, wehave to shield the light incident on some elements of thephotodetectors and use the COD image sensor as onewhich has a smaller number of elements. If we use aCOD image sensor operating with a clock pulse of fre-quency f, for the sampling interval At, the number ofelements that can detect the light is At Xf.
Ml. Experiments
A. Time-Varying intensity Distribution
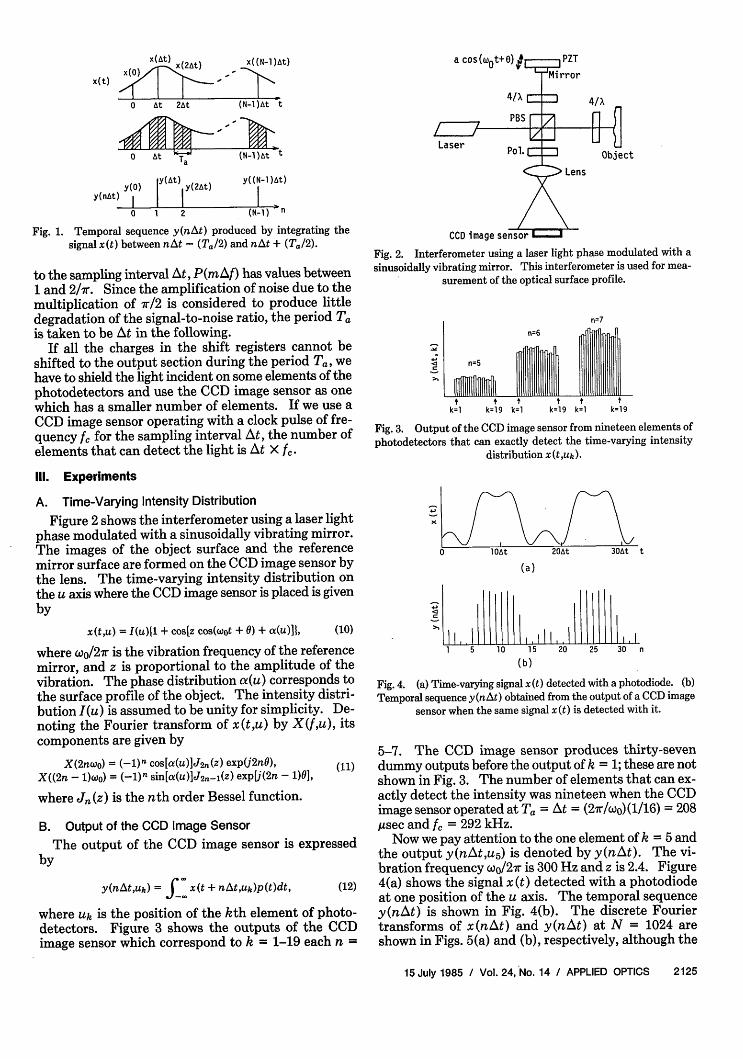
Figure 2 shows the interferometer using a laser lightphase modulated with a sinusoidally vibrating mirror.The images of the object surface and the referencemirror surface are formed on the COD image sensor bythe lens. The time-varying intensity distribution onthe u axis where the COD image sensor is placed is givenby
a cos(wot+)/~ JPZT
Laser
PBS Fr
Pol1. Object
Lens
CCD image sensor _ J
Fig. 2. Interferometer using a laser light phase modulated with a
sinusoidally vibrating mirror. This interferometer is used for mea-
surement of the optical surface profile.
~n=5iU
k=1 k=19 k=1 k=19 k= k=19
Fig. 3. Output of the CCD image sensor from nineteen elements of
photodetectors that can exactly detect the time-varying intensitydistribution X (t,Uk) .
(a)
X(tLL) = I(u)11 + cos[z cos(Wot + 0) + cx(LL)], (10)
where wo/2-7r is the vibration frequency of the referencemirror, and z is proportional to the amplitude of thevibration. The phase distribution a(u) corresponds tothe surface profile of the object. The intensity distri-bution I(u) is assumed to be unity for simplicity. De-noting the Fourier transform of x (t,u) by X(f,u), itscomponents are given by
X(2nwo) = (-1)n C0Sla(U)1Jsn(z) exp(j2n0), (1
X((2n - 1)wo) = (-l)n sin[a(u)1J 2 n-r(z) expUj(2n - 1)0],
where Jn(z) is the nth order Bessel function.
B. Output of the COD Image Sensor
The output of the COD image sensor is expressedby
Y(flAt,Uk) E x(t + nAt ,Uk)p(t)dt, (12)
where uk is the position of the kth element of photo-detectors. Figure 3 shows the outputs of the CODimage sensor which correspond to k = 1-19 each n =
I1 _ 11.1 5 1 0 1 5 20 25 30 n
(b)
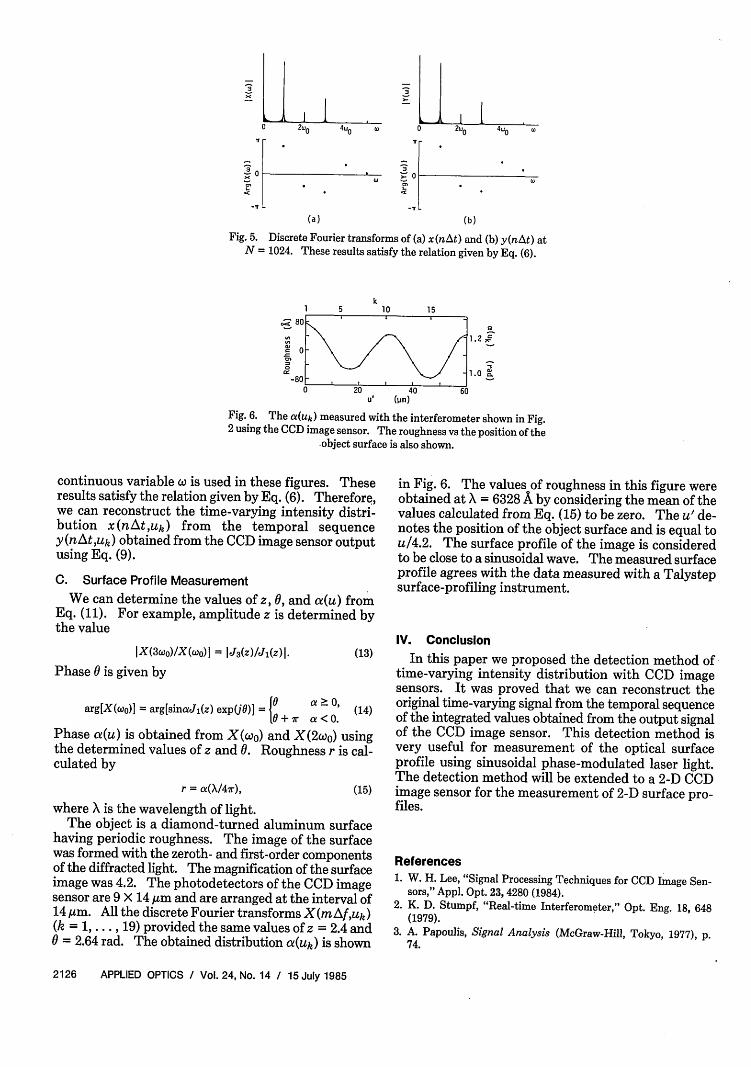
Fig. 4. (a) Time-varying signal x (t) detected with a photodiode. (b)
Temporal sequence y (nAt) obtained from the output of a CCD image
sensor when the same signal x (t) is detected with it.
5-7. The COD image sensor produces thirty-sevendummy outputs before the output of k = 1; these are notshown in Fig. 3. The number of elements that can ex-actly detect the intensity was nineteen when the CODimage sensor operated at T,, = At = (2i7r/w0 ) (1116) = 208lisec and f, = 292 kHz.
Now we pay attention to the one element of k 5 andthe output y(nAt,U 5) is denoted by y(nAt). The vi-bration frequency wo/2'r is 300 Hz and z is 2.4. Figure4(a) shows the signal x (t) detected with a photodiodeat one position of the u axis. The temporal sequencey(nAt) is shown in Fig. 4(b). The discrete Fouriertransforms of x(nAt) and y(nAt) at N = 1024 areshown in Figs. 5(a) and (b), respectively, although the
15 July 1985 / Vol. 24, No. 14 / APPLIED OPTICS 2125
.4
.5.I I
- .........II,
3 ~~~~~~~~3.2
a:0 3 Z
(a) (b)
Fig. 5. Discrete Fourier transforms of (a) x(nAt) and (b) y(nAt) atN = 1024. These results satisfy the relation given by Eq. (6).
3.3a2 ,l
Fig. 6. The a(uk) measured with the interferometer shown in Fig.2 using the CCD image sensor. The roughness vs the position of the
object surface is also shown.
continuous variable c is used in these figures. Theseresults satisfy the relation given by Eq. (6). Therefore,we can reconstruct the time-varying intensity distri-bution x(nAt,uk) from the temporal sequencey(nAt,uk) obtained from the CCD image sensor outputusing Eq. (9).
C. Surface Profile Measurement
We can determine the values of z, 0, and a(u) fromEq. (11). For example, amplitude z is determined bythe value
1X(3cwo)/X(wo) = IJ3(z)/J(z)1. (13)
Phase 0 is given by
arg[X(wo)] = arg[sinceiJ(z) exp(j0)] = a X < (14)
Phase (u) is obtained from X(coo) and X(2coo) usingthe determined values of z and 0. Roughness r is cal-culated by
r = a (X/47r), (15)
where X is the wavelength of light.The object is a diamond-turned aluminum surface
having periodic roughness. The image of the surfacewas formed with the zeroth- and first-order componentsof the diffracted light. The magnification of the surfaceimage was 4.2. The photodetectors of the CCD imagesensor are 9 X 1 4 m and are arranged at the interval of14 Aum. All the discrete Fourier transforms X(mAf,uk)(k = 1, . .. , 19) provided the same values of z = 2.4 and
= 2.64 rad. The obtained distribution a(Uk) is shown
in Fig. 6. The values of roughness in this figure wereobtained at X = 6328 A by considering the mean of thevalues calculated from Eq. (15) to be zero. The u' de-notes the position of the object surface and is equal tou/4.2. The surface profile of the image is consideredto be close to a sinusoidal wave. The measured surfaceprofile agrees with the data measured with a Talystepsurface-profiling instrument.
IV. Conclusion
In this paper we proposed the detection method oftime-varying intensity distribution with CCD imagesensors. It was proved that we can reconstruct theoriginal time-varying signal from the temporal sequenceof the integrated values obtained from the output signalof the CCD image sensor. This detection method isvery useful for measurement of the optical surfaceprofile using sinusoidal phase-modulated laser light.The detection method will be extended to a 2-D CCDimage sensor for the measurement of 2-D surface pro-files.
References1. W. H. Lee, "Signal Processing Techniques for CCD Image Sen-
sors," Appl. Opt. 23, 4280 (1984).2. K. D. Stumpf, "Real-time Interferometer," Opt. Eng. 18, 648
(1979).3. A. Papoulis, Signal Analysis (McGraw-Hill, Tokyo, 1977), p.
74.
2126 APPLIED OPTICS / Vol. 24, No. 14 / 15 July 1985
x
-s