Embed Size (px)
Citation preview
Detection of ST Segment Elevation Myocardial Infarction (STEMI) Using
Bacterial Foraging Optimization Technique Bensujin1, C.Kezi selva vijila2, Cynthia Hubert3
1Regisrar, Engineering Department, Nizwa College of Technology, Sultanate of Oman 2Principal,Christian College of Engineering & Technology, Ottanchathiram, Tamilnadu, India
3Research Scholar, Karunya University, Coimbatore,Tamilnadu, India 1 [email protected]
Abstract— The rife of heart disease (HD) is a comprehensive phenomenon, and the scale of the cardiovascular disease (CVD) increases in prevalence in the developed world. Cardio vascular disease (CVD) is the foremost cause of death worldwide; the World Health Organization (WHO) estimates that globally 17.3 million people died from Heart Disease in 2008, representing 30% of global deaths. The forecast of heart disease is a multi-layered problem, which is not free from false assumptions. The eminence of the clinical decisions and the effect of the stratagems should optimize the patient’s outcomes and to lessen the risk of disease factors, if the methods are applied effectively and properly grounded on the expert analysis on the presented data. The major clinical information related to heart disease can be obtained by the analysis for electrocardiograph (ECG) signal. The ST segment Myocardial Infarction (STEMI) is the severe type and the elevated ST segment on the ECG data represents that large amount of heart muscle mutilation is stirring. In this paper we recommend a constructive approach to identify the STEMI in the ECG signal of a person. The sample ECG data’s are acquired from the MIT-BIH databases. Those data’s are subsequently pre-processed; the ST segment is extracted and then measured to identify the availability of the disease. During the ST segment analysis stage the beats generated by the ventricular in origin or ventricular paced are resolute. The fine-tuned data set is converted into a formatted data set and conceded to the Bacterial Foraging Optimization Algorithm (BFOA) to detect the approximate solution. The proposed system overcomes the superseded algorithms by a focussed update in the methodology with reliable algorithms and techniques.
Keyword-Cardiovascular Disease, WHO, Electrocardiograph, STEMI, BFOA I. INTRODUCTION
The clinical decisions are certainly a complicated task to mark in diverse conditions as the output should be precise and accurate. Medical diagnosis is a vital but intricate task that should be performed accurately and efficiently. An immense number of theories delivers the investigation on extensive array of ECG indices and projected as indicators for quantitatively characterizing an ST elevation infarction (STEMI) and measuring imminent prognosis from the perspectives of acuteness, territory at risk, grade of ischemia, response to reperfusion therapy, and infarct size[1][2]. The non-ST elevation infarctions (non-STEMIs) or unstable angina pectoris are also been investigated as markers for characterization from an array of ECG indices (involving the QRS complex, ST segment, and T wave)[3]. Clinical data types pronounce large number of data’s which in turn reduces the accuracy of the detection system. The change of values in the ECG in the amplitudes, time duration of ST Segments, QRS complex disturbances indeed results in ischemic disease. Most of these patients will be evidence for a distinctive increase in biomarkers of myocardial necrosis and steps forward to Q-wave myocardial infarction[4]. The mortality of ST Segment Myocardial Infarction (STEMI) is due to many factors like renal failure, diabetes mellitus, Killip class, time delay to treatment, and ejection fraction.
The ST Elevation Myocardial Infarction is instigated by the persistent occlusion of a coronary artery by a blood clot. The level presented by the ST depression has the prognostic importance. The ST elevation which is shown in the ECG can be identified easily by the upcoming technologies inculcating the digital and high fidelity recordings which in turn provide highly precise and accurate values. The existing stratagem pertains to patients presenting with ischemic symptoms and persistent ST segment elevation on the ECG. The change of values in the ECG in the amplitudes, time duration of ST Segments, QRS complex disturbances indeed results in ischemic disease. Most of these patients will be evidence for a distinctive increase in biomarkers of myocardial necrosis and steps forward to Q-wave myocardial infarction. It is evidenced by several clinical practices that the myocardial damage begins immediately the coronary blood supply is interrupted, the longer the blood supply is occluded the greater the amount of heart muscle lost. Reperfusion therapy is advised for the patients with ST
Bensujin et al. / International Journal of Engineering and Technology (IJET)
ISSN : 0975-4024 Vol 6 No 2 Apr-May 2014 1212
Elevation, but in case of ST depression they are treated predictably. The patterns of ST deviation are used to diagnose the patients having anterior, inferior-posterior, or lateral myocardial infarction. The risk assessment is usually based on unpolished measurements of the complete magnitude of ST segment deviation or the width of the QRS complexes. If the ST Segment Myocardial infarction (STEMI) is detected at the early stage, the percutaneous coronary intervention (PCI), can be performed as the better choice treatment. As indicated in many literatures the wealth of data available within the health care systems are huge. However, there is a lack of effective analysis tools to discover hidden relationships and trends in data. A set of core databases such as MEDLINE, Embase, the Cocharane Library and Cinahl provides enormous number of clinical data[5].
Swam Intelligence is the well-known technique used in several optimization problem domains provides the collective behaviour of decentralized, self-organised systems that are natural or artificial. Gerado Beni and Jing Wang in 1989 labelled the concept of swam intelligence [6]. Swam Intelligence is based on a population of simple agents interacting locally with one another and with their environment. Those simple agents guides to the emergence of intelligent global behaviour which are unknown to the individual agents with the provision of simple rules [7]. The behaviour, interactions the degree of random and its global and local behaviour is not controlled by a central structure. Different forms of swam intelligence are ant colonies, animal herding, bird flocking, bacterial growth and fish schooling. The bacterial foraging optimization algorithm (BFOA) has been widely accepted global optimization algorithm. The bacterial Foraging optimization algorithm is applied on current interest for distributed optimization and control[8]. The social foraging behaviour of Escherichia coli (E.Coli) bacteria is the stimulus of Bacterial Foraging Optimization Algorithm. Bacterial Foraging Optimization is a probabilistic technique which mimics the food seeking and common behaviour of general bacteria like Escherichia coli (E.coli) [9]. The BFOA is used for continuous optimization that is the reason this current work choose the BFOA model for the detection of ST elevation Myocardial Infarction (STEMI). Despite the endorsements of training standards and machine learning outputs, the ST segment elevation detection on the ECG data has its limitations, especially if not used correctly. To overcome the situation a well versed optimization technique is represented in this paper using Bacterial Foraging Optimization algorithm (BFOA).
II. BACKGROUND LITERATURE RESEARCH A huge number of prediction algorithms and methodologies are proposed in different literatures which in a
way motivated our work. Using neural networks Niti Guru et al.[10] provide a prototyping model for predicting the heart disease, blood pressure and sugar. 13 input variables are used in the system from a sample database for training the network. Back propagation algorithm is used for training the network. The system was said as a doctor assistant as it can provide the type of disease according the patients input. A new system Intelligent Heart Disease Prediction System (IHDPS) was proposed by Sellappan Palaniappan et al., [11]. The system was proved to be sturdy as it provides the healthier results and output the decision more accurately than any decision making system. The techniques used in IHDPS are the common techniques like Decision Trees, Naïve Bayes and Neural Network. The system also encompasses patterns, relationships amid medical factors connected with heart disease. Anamika Gupta et al. projected an effort that the medical data’s can be analysed and clustered using the data mining techniques [12]. In this system the medical diagnostic data’s are retrieved and passed through a method of formal concept analysis. A model is proposed based on data mining techniques to classify the medical data’s. Basic classification rules and a redundancy algorithm is used which provides more strength to the system. Sheng
Nan Chang et al., (2008) introduced a method of measuring the ST segment elevation Myocardial Infarction through data mining techniques [13]. The work is based on the narrative reports in EDN in the clinical information systems (CIS) of National Taiwan University Hospital from 2002 to 2004.The patients who presented to the emergency room (ER) with AMI were identified. Ten parameters related to QC for AMI were measured through data-mining of EDN alone as well as through an extensive search of the CIS and paper medical records. Jiriet el., (2010) introduced a method of Machine Learning Methods for Mortality Prediction in Patients with ST Elevation Myocardial Infarction. The dataset contains data of 603 patients admitted to University Hospital in Olomouc for STEMI. The average age was 65 years. There were 431 men (71%) and 172 women (29%) in the dataset. Our goal is to classify patients into two classes according to whether they survive 30 days or not. In quest of arrhythmia detection and classification work, many computer techniques have been developed. Notably, Linhet al.(2010) selected the Hermite Function Expansion as the feature extraction method to represent the QRS complex[14]. The projected method uses a fuzzy neural network where Her-mite coefficients served as the features to classify only seven different types of arrhythmias
The theoretical foundations, analysis and applications of Bacterial Foraging Optimization Algorithm (BFOA) was described by Swagatam Das et al [8]. The work also focussed on the underlying biological features behind the foraging strategy of E.Coli bacteria which is emulated in an extraordinary way and used for the different optimization problems. Ismail Al Hadi et al., applied the Bacterial Foraging optimization algorithm in the Neural networking learning environment [15]. The author utilized five types of datasets and demonstrated the convergence rate and the classification percentage. Minakhi Rout et al.[16] applied the BFOA algorithm in the
Bensujin et al. / International Journal of Engineering and Technology (IJET)
ISSN : 0975-4024 Vol 6 No 2 Apr-May 2014 1213
forecasting of currency exchange rates. By absorbing the simple statistical features of the exchange rate the internal coefficients are trained and the maximum value is obtained. The assembly line balancing using Bacterial Foraging Optimization Algorithm is detailed by Yakup Atasagun et.al [9]. The simple straight and U shaped assembly line balancing is unerringly demarcated.
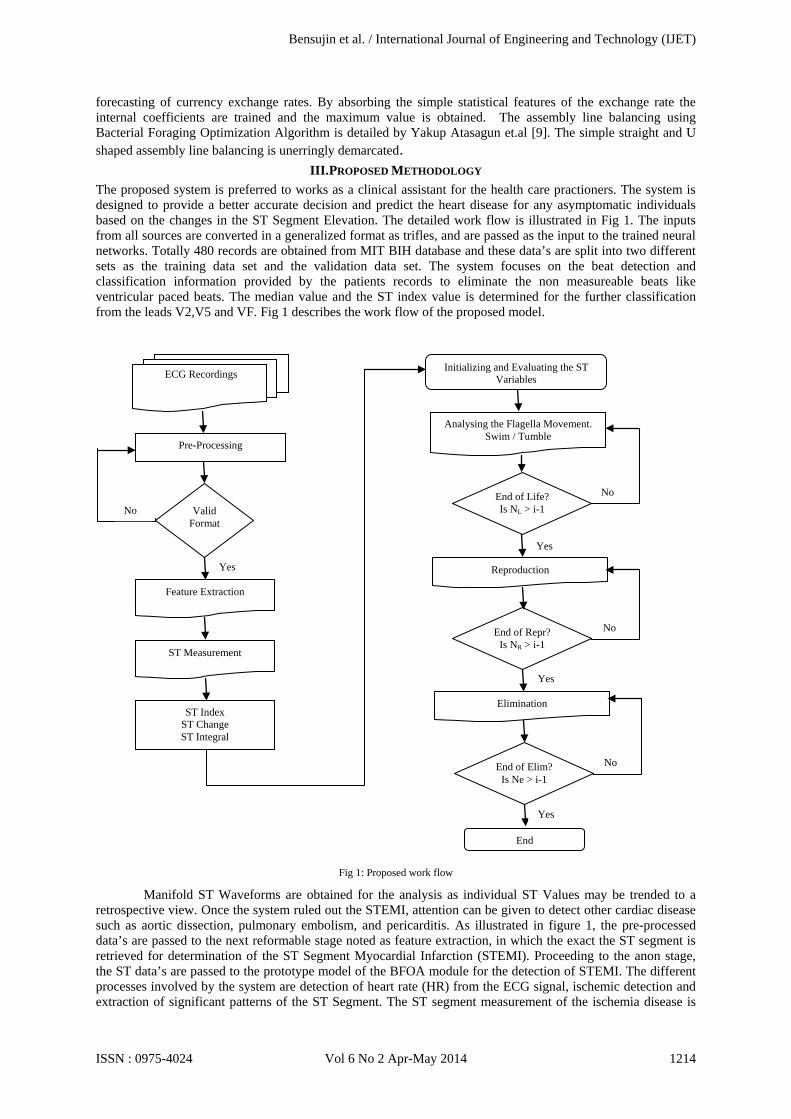
III. PROPOSED METHODOLOGY The proposed system is preferred to works as a clinical assistant for the health care practioners. The system is designed to provide a better accurate decision and predict the heart disease for any asymptomatic individuals based on the changes in the ST Segment Elevation. The detailed work flow is illustrated in Fig 1. The inputs from all sources are converted in a generalized format as trifles, and are passed as the input to the trained neural networks. Totally 480 records are obtained from MIT BIH database and these data’s are split into two different sets as the training data set and the validation data set. The system focuses on the beat detection and classification information provided by the patients records to eliminate the non measureable beats like ventricular paced beats. The median value and the ST index value is determined for the further classification from the leads V2,V5 and VF. Fig 1 describes the work flow of the proposed model.
Fig 1: Proposed work flow
Manifold ST Waveforms are obtained for the analysis as individual ST Values may be trended to a retrospective view. Once the system ruled out the STEMI, attention can be given to detect other cardiac disease such as aortic dissection, pulmonary embolism, and pericarditis. As illustrated in figure 1, the pre-processed data’s are passed to the next reformable stage noted as feature extraction, in which the exact the ST segment is retrieved for determination of the ST Segment Myocardial Infarction (STEMI). Proceeding to the anon stage, the ST data’s are passed to the prototype model of the BFOA module for the detection of STEMI. The different processes involved by the system are detection of heart rate (HR) from the ECG signal, ischemic detection and extraction of significant patterns of the ST Segment. The ST segment measurement of the ischemia disease is
ECG Recordings
Pre-Processing
Valid Format
Feature Extraction
ST Measurement
ST Index ST Change ST Integral
Initializing and Evaluating the ST Variables
Analysing the Flagella Movement. Swim / Tumble
End of Life? Is NL > i-1
Reproduction
End of Repr? Is NR > i-1
Elimination
End of Elim? Is Ne > i-1
End
Yes
No
No
No
No
Yes
Yes
Yes
Bensujin et al. / International Journal of Engineering and Technology (IJET)
ISSN : 0975-4024 Vol 6 No 2 Apr-May 2014 1214
the vital role in the system; a false assumption may lead for a wrong diagnosis. The myocardial infarction is well versed signposted by the changes of ST Segment elevation in the ECG recordings. However, The ST Segment elevation is highly sensitive to the interferences like base line wandering, therefore the features of ST Segment is highly difficult to detect accurately. The proposed methods use hybrid detection method so that the outputs are found more likely to be accurate.
A. Pre-processing
Data pre-processing transforms the data into a format that will be more easily and effectively processed for the purpose of using in a neural network. There are a number of different tools and methods used for pre-processing, including: sampling, which selects a representative subset from a large population of data; transformation, which manipulates raw data to produce a single input; de-noising, which removes noise from data; normalization, which organizes data for more efficient access; and feature extraction, which pulls out specified data that is significant in some particular context.
In the proposed system the data pre-processing stages like Sampling, Data cleaning, De noising and Feature extraction are included. Introduced into these different stages the raw data is transformed into effective data. Data pre-processing works based on the term ETL which is Extraction, Transformation and Loading. During this pre-processing stage the appropriate data’s are extracted from the raw data. To perform this transformation of continuous ECG raw data set is normalized using Chi merge Discretization method. Then the Euclidean distance is found out in the normalized data. Hence the similar datas are passed into the system for training and prediction. The Chi merge Discretization method is pertinent for any type of data sets. The all-purpose rule of Chi merge Discretization for any data X and the maximum data S the values has to fit into a new data set [C,D] in the form of [0.0 , 1.0] is given eq (1).
TpqTpqWpqz
qp
)(
1
2
12 −
=== ∑∑χ
(1)
The continuous data is found in the state space domain for the normalization. The state space domain is in the form as shown in eq(2) and eq(3).
P(t) = Ax(t) + By
Q(t) = C
(t) + w(t) (2)
x(t) + Dy
Where w(t) and T(t) are the absorbed continuous ECG signal. This can be discretised and the continuous integration of the input data is given by the eq(4) and eq(5)
(t) + T(t) (3)
X[k + 1] =Adx[k] + Bd
Y[k] = c
y[k] + w[k] (4)
dx[k] + Dd
The Euclidean distance d for a multi-dimensional data set to obtain the final normalised data as illustrated in eq (6).
y[k] + T[k] (5)
( ) ( ) ( ) .....221
221
221 +−+−+−= ccbbaad (6)
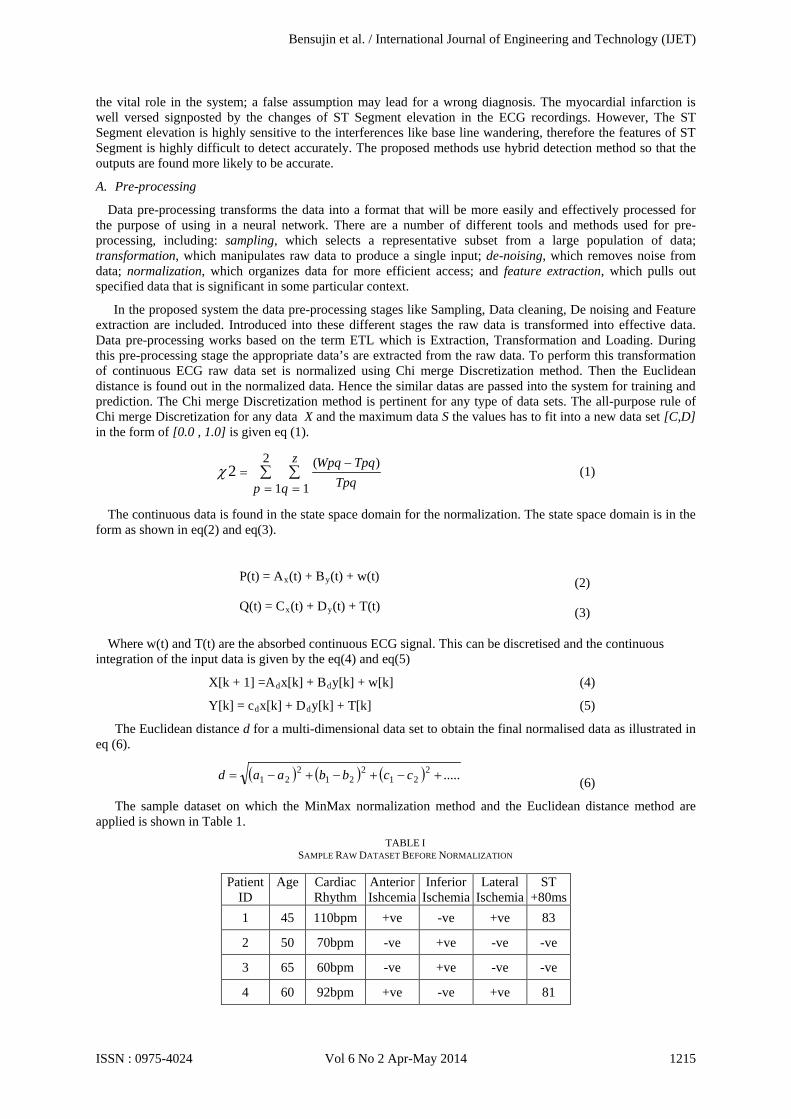
The sample dataset on which the MinMax normalization method and the Euclidean distance method are applied is shown in Table 1.
TABLE I SAMPLE RAW DATASET BEFORE NORMALIZATION
Patient
ID Age Cardiac
Rhythm Anterior Ishcemia
Inferior Ischemia
Lateral Ischemia
ST +80ms
1 45 110bpm +ve -ve +ve 83
2 50 70bpm -ve +ve -ve -ve
3 65 60bpm -ve +ve -ve -ve
4 60 92bpm +ve -ve +ve 81
Bensujin et al. / International Journal of Engineering and Technology (IJET)
ISSN : 0975-4024 Vol 6 No 2 Apr-May 2014 1215
The chi-merge algorithm checks each pair of adjacent rows n order to determine if the class frequencies of two intervals are significantly different. The algorithm is described below:
i. Set the minintervals and maxintervals. Choose the minintervals and maxintervals such that 2 ≤ minintervals < maxintervals
ii. Set the threshold value to as significance value (Interval of threshold 60ms > t >80ms iii. The number of degrees of freedom = (2-l) * ([number of classes]-1) = [number of classes]-1 iv. If the number of rows returned is equal to minintervals then stop.
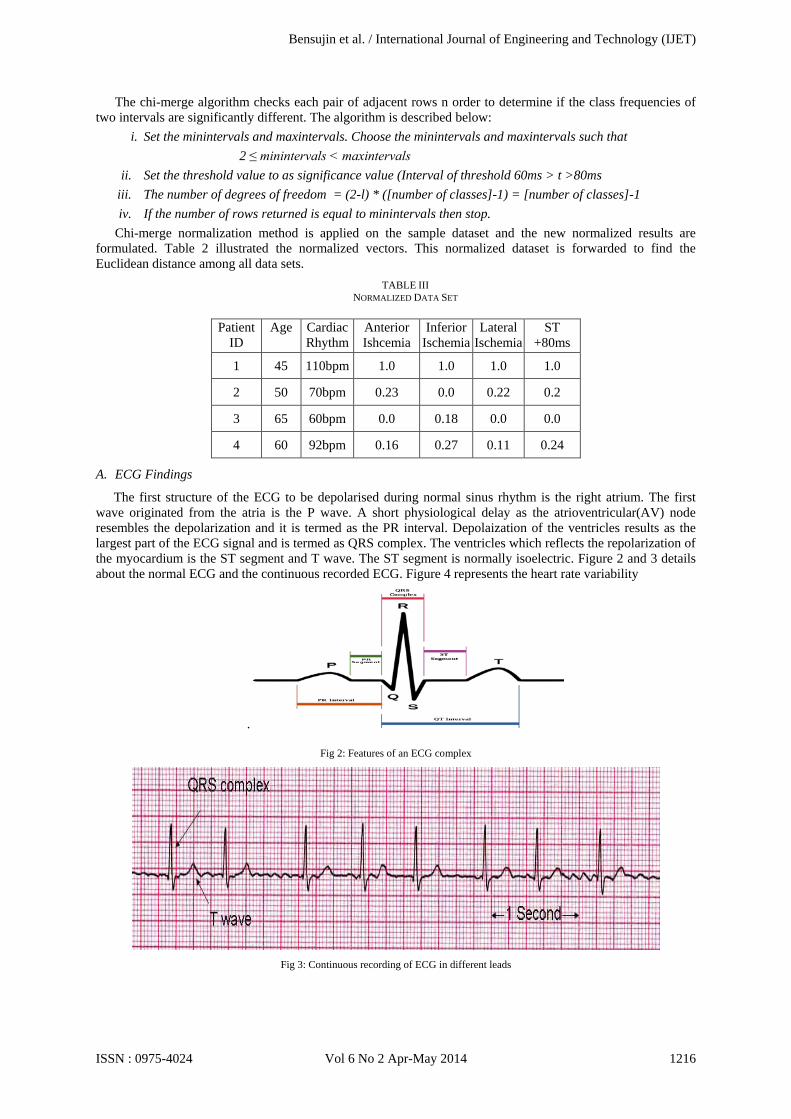
Chi-merge normalization method is applied on the sample dataset and the new normalized results are formulated. Table 2 illustrated the normalized vectors. This normalized dataset is forwarded to find the Euclidean distance among all data sets.
TABLE III NORMALIZED DATA SET
Patient
ID Age Cardiac
Rhythm Anterior Ishcemia
Inferior Ischemia
Lateral Ischemia
ST +80ms
1 45 110bpm 1.0 1.0 1.0 1.0
2 50 70bpm 0.23 0.0 0.22 0.2
3 65 60bpm 0.0 0.18 0.0 0.0
4 60 92bpm 0.16 0.27 0.11 0.24
A. ECG Findings
The first structure of the ECG to be depolarised during normal sinus rhythm is the right atrium. The first wave originated from the atria is the P wave. A short physiological delay as the atrioventricular(AV) node resembles the depolarization and it is termed as the PR interval. Depolaization of the ventricles results as the largest part of the ECG signal and is termed as QRS complex. The ventricles which reflects the repolarization of the myocardium is the ST segment and T wave. The ST segment is normally isoelectric. Figure 2 and 3 details about the normal ECG and the continuous recorded ECG. Figure 4 represents the heart rate variability
.
Fig 2: Features of an ECG complex
Fig 3: Continuous recording of ECG in different leads
Bensujin et al. / International Journal of Engineering and Technology (IJET)
ISSN : 0975-4024 Vol 6 No 2 Apr-May 2014 1216
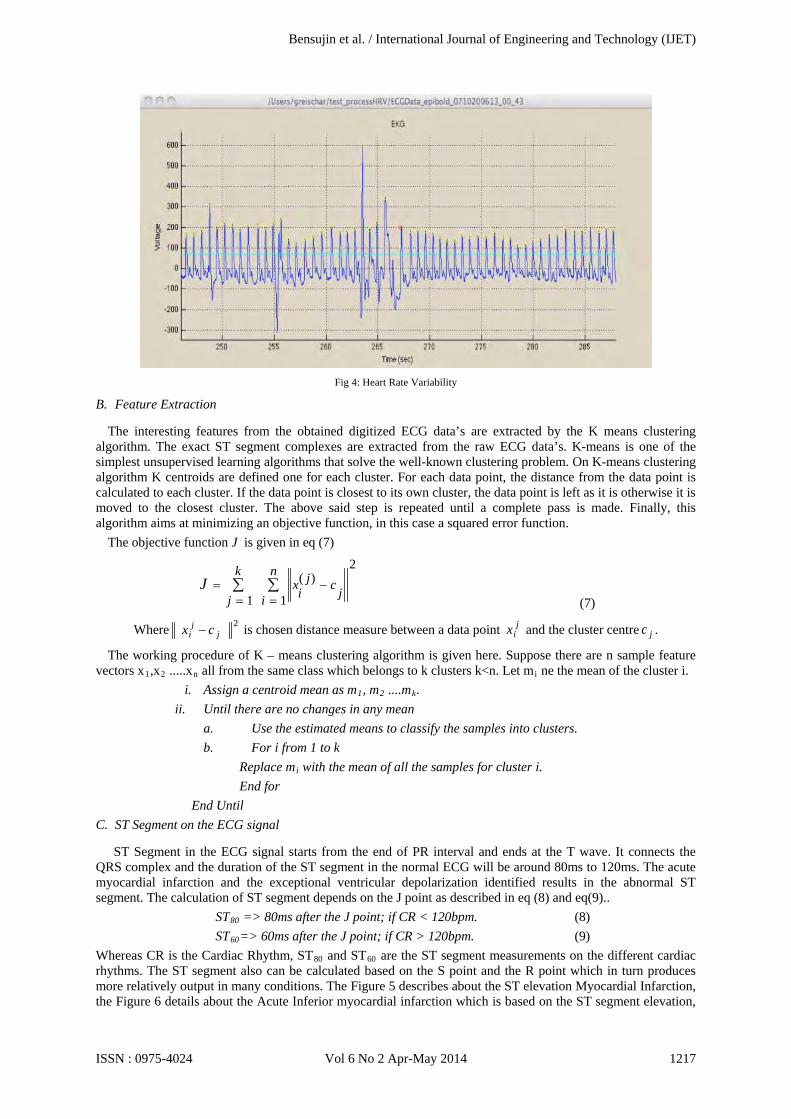
Fig 4: Heart Rate Variability
B. Feature Extraction
The interesting features from the obtained digitized ECG data’s are extracted by the K means clustering algorithm. The exact ST segment complexes are extracted from the raw ECG data’s. K-means is one of the simplest unsupervised learning algorithms that solve the well-known clustering problem. On K-means clustering algorithm K centroids are defined one for each cluster. For each data point, the distance from the data point is calculated to each cluster. If the data point is closest to its own cluster, the data point is left as it is otherwise it is moved to the closest cluster. The above said step is repeated until a complete pass is made. Finally, this algorithm aims at minimizing an objective function, in this case a squared error function.
The objective function J is given in eq (7) 2
1
)(
1∑∑=
−=
=n
i jcjix
k
jJ
(7)
Where 2j
ji cx − is chosen distance measure between a data point j
ix and the cluster centre jc .
The working procedure of K – means clustering algorithm is given here. Suppose there are n sample feature vectors x1,x2 .....xn all from the same class which belongs to k clusters k<n. Let mi
i. Assign a centroid mean as m ne the mean of the cluster i.
1, m2 ....mk
ii. Until there are no changes in any mean .
a. Use the estimated means to classify the samples into clusters. b. For i from 1 to k
Replace mi
End for with the mean of all the samples for cluster i.
End Until C. ST Segment on the ECG signal
ST Segment in the ECG signal starts from the end of PR interval and ends at the T wave. It connects the QRS complex and the duration of the ST segment in the normal ECG will be around 80ms to 120ms. The acute myocardial infarction and the exceptional ventricular depolarization identified results in the abnormal ST segment. The calculation of ST segment depends on the J point as described in eq (8) and eq(9)..
ST80
ST => 80ms after the J point; if CR < 120bpm. (8)
60
Whereas CR is the Cardiac Rhythm, ST=> 60ms after the J point; if CR > 120bpm. (9)
80 and ST60 are the ST segment measurements on the different cardiac rhythms. The ST segment also can be calculated based on the S point and the R point which in turn produces more relatively output in many conditions. The Figure 5 describes about the ST elevation Myocardial Infarction, the Figure 6 details about the Acute Inferior myocardial infarction which is based on the ST segment elevation,
Bensujin et al. / International Journal of Engineering and Technology (IJET)
ISSN : 0975-4024 Vol 6 No 2 Apr-May 2014 1217
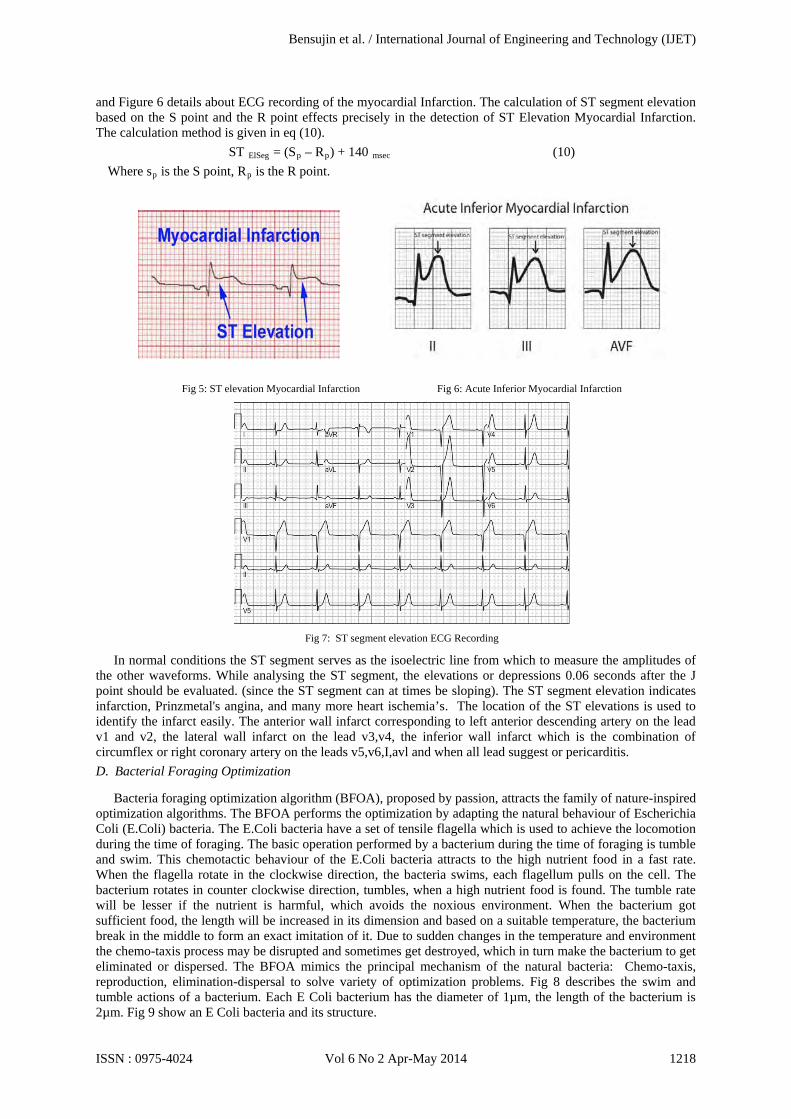
and Figure 6 details about ECG recording of the myocardial Infarction. The calculation of ST segment elevation based on the S point and the R point effects precisely in the detection of ST Elevation Myocardial Infarction. The calculation method is given in eq (10).
ST ElSeg = (Sp – Rp) + 140 msec
Where s(10)
p is the S point, Rp
is the R point.
Fig 5: ST elevation Myocardial Infarction Fig 6: Acute Inferior Myocardial Infarction
Fig 7: ST segment elevation ECG Recording
In normal conditions the ST segment serves as the isoelectric line from which to measure the amplitudes of the other waveforms. While analysing the ST segment, the elevations or depressions 0.06 seconds after the J point should be evaluated. (since the ST segment can at times be sloping). The ST segment elevation indicates infarction, Prinzmetal's angina, and many more heart ischemia’s. The location of the ST elevations is used to identify the infarct easily. The anterior wall infarct corresponding to left anterior descending artery on the lead v1 and v2, the lateral wall infarct on the lead v3,v4, the inferior wall infarct which is the combination of circumflex or right coronary artery on the leads v5,v6,I,avl and when all lead suggest or pericarditis. D. Bacterial Foraging Optimization
Bacteria foraging optimization algorithm (BFOA), proposed by passion, attracts the family of nature-inspired optimization algorithms. The BFOA performs the optimization by adapting the natural behaviour of Escherichia Coli (E.Coli) bacteria. The E.Coli bacteria have a set of tensile flagella which is used to achieve the locomotion during the time of foraging. The basic operation performed by a bacterium during the time of foraging is tumble and swim. This chemotactic behaviour of the E.Coli bacteria attracts to the high nutrient food in a fast rate. When the flagella rotate in the clockwise direction, the bacteria swims, each flagellum pulls on the cell. The bacterium rotates in counter clockwise direction, tumbles, when a high nutrient food is found. The tumble rate will be lesser if the nutrient is harmful, which avoids the noxious environment. When the bacterium got sufficient food, the length will be increased in its dimension and based on a suitable temperature, the bacterium break in the middle to form an exact imitation of it. Due to sudden changes in the temperature and environment the chemo-taxis process may be disrupted and sometimes get destroyed, which in turn make the bacterium to get eliminated or dispersed. The BFOA mimics the principal mechanism of the natural bacteria: Chemo-taxis, reproduction, elimination-dispersal to solve variety of optimization problems. Fig 8 describes the swim and tumble actions of a bacterium. Each E Coli bacterium has the diameter of 1µm, the length of the bacterium is 2µm. Fig 9 show an E Coli bacteria and its structure.
Bensujin et al. / International Journal of Engineering and Technology (IJET)
ISSN : 0975-4024 Vol 6 No 2 Apr-May 2014 1218
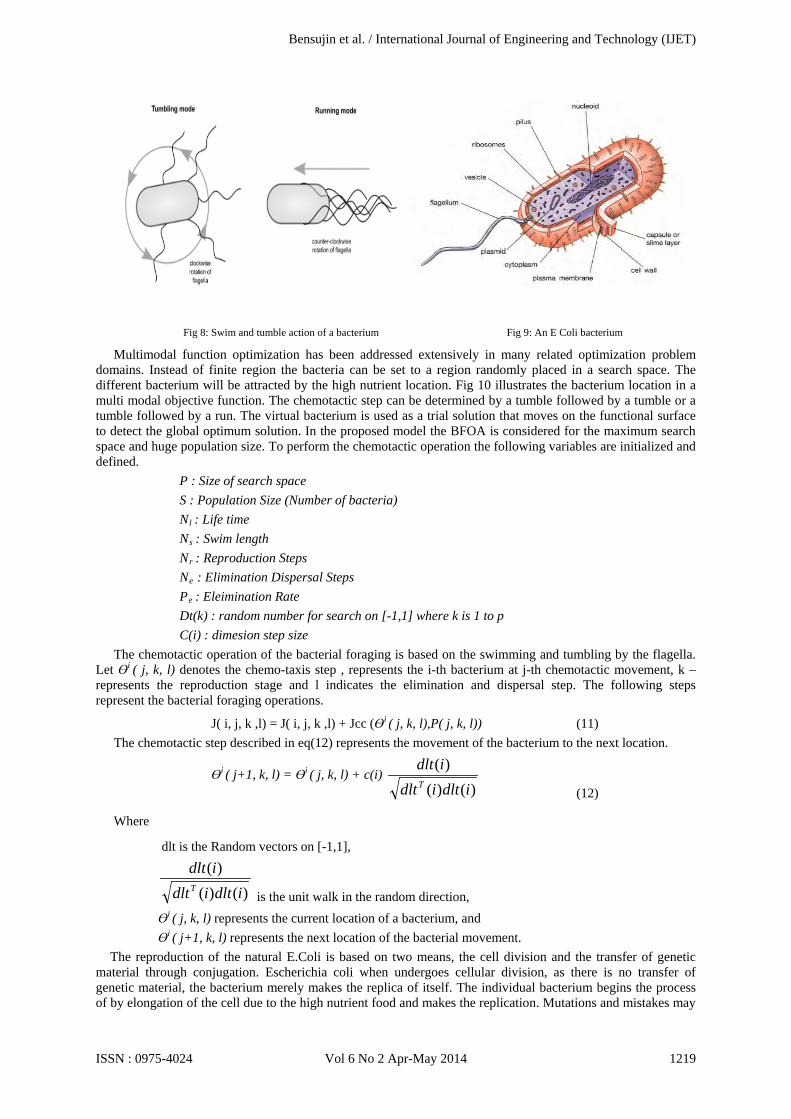
Fig 8: Swim and tumble action of a bacterium Fig 9: An E Coli bacterium
Multimodal function optimization has been addressed extensively in many related optimization problem domains. Instead of finite region the bacteria can be set to a region randomly placed in a search space. The different bacterium will be attracted by the high nutrient location. Fig 10 illustrates the bacterium location in a multi modal objective function. The chemotactic step can be determined by a tumble followed by a tumble or a tumble followed by a run. The virtual bacterium is used as a trial solution that moves on the functional surface to detect the global optimum solution. In the proposed model the BFOA is considered for the maximum search space and huge population size. To perform the chemotactic operation the following variables are initialized and defined.
P : Size of search space S : Population Size (Number of bacteria) Nl
N: Life time
s
N: Swim length
r
N: Reproduction Steps
e
P : Elimination Dispersal Steps
e
Dt(k) : random number for search on [-1,1] where k is 1 to p : Eleimination Rate
C(i) : dimesion step size The chemotactic operation of the bacterial foraging is based on the swimming and tumbling by the flagella.
Let Өi
J( i, j, k ,l) = J( i, j, k ,l) + Jcc (Ө
( j, k, l) denotes the chemo-taxis step , represents the i-th bacterium at j-th chemotactic movement, k – represents the reproduction stage and l indicates the elimination and dispersal step. The following steps represent the bacterial foraging operations.
i
The chemotactic step described in eq(12) represents the movement of the bacterium to the next location. ( j, k, l),P( j, k, l)) (11)
Өi ( j+1, k, l) = Өi
)()()(
idltidltidlt
T( j, k, l) + c(i)
(12)
Where
dlt is the Random vectors on [-1,1],
)()()(
idltidltidlt
T is the unit walk in the random direction,
Өi
Ө( j, k, l) represents the current location of a bacterium, and
i
The reproduction of the natural E.Coli is based on two means, the cell division and the transfer of genetic material through conjugation. Escherichia coli when undergoes cellular division, as there is no transfer of genetic material, the bacterium merely makes the replica of itself. The individual bacterium begins the process of by elongation of the cell due to the high nutrient food and makes the replication. Mutations and mistakes may
( j+1, k, l) represents the next location of the bacterial movement.
Bensujin et al. / International Journal of Engineering and Technology (IJET)
ISSN : 0975-4024 Vol 6 No 2 Apr-May 2014 1219
happen during the genetic replication, and those cells have to be eliminated in the Elimination – Dispersal stage. This makes the population size constant. The bacteria health is computed using eq (13) as defined.
),,,(1
1lkjiJ
lN
j
ihealthJ ∑
+
==
(13)
Where NL
Elimination and dispersal stage of the bacterium is done by generation a random vector from the population size [-1, 1]. Then the elements of the vector are organized in the rising order. All healthy bacteria are indexed and swapped in the optimization domain. In the optimization domain the swapping of bacteria is performed by matching the indexed bacterium with the randomly generated positions. Depends on the population and number of chemotactic steps the number of iterations are finalized. The best cost function is tracked in all recapitulations and enduring unhealthy bacteria will be eliminated. All best cost functions will be compared and generated to find the optimum solution. The pseudo code of the Bacterial Foraging Optimization Algorithm (BFOA) is described in following section.
is the chemotactic steps, j is the error value and i is the population steps.
The chemotactic steps are defined by the variable NL for the life time of the bacteria, Ns is the swim length of the bacteria, Nr for the number of reproductions steps, Ne is the number of elimination-dispersal steps and ped, the elimination rate, where P is the dimension and S is the population. The Pseudo Code BFOA Algorithm
Step 1: Collect all ST data segments which are plotted in a multi spaced dimension. Step 2: Initialize all BFOA parameters [ P,S,NL,NS,Nr,Ne,Ped
Step 3: Start Chemotaxis by incrementing to the next bacterium j+1 ,dlt(i) €[-1,1]].
i. For i=1 to S , perform the following st ii. Compute : J( i, j, k ,l) = J( i, j, k ,l) + Jcc (Өi
iii. To Swim: Assign C = 0 (Swim length counter) ( j, k, l),P( j,k,l))
For c <= NS ,
If J( i, j+1, k ,l) < Jc = c+1
max , then Jmax
Ө
= J( i, j+1, k ,l)
i ( j+1, k, l) = Өi
)()()(
idltidltidlt
T( j, k, l) + c(i)
Otherwise c = N
iv. ToTumble : Locate a random vector dlt(i) ∈ φ
s
p.
Move :
Өi ( j+1, k, l) = Өi
)()()(
idltidltidlt
T( j, k, l) + c(i)
Compute : J( i, j, k ,l) = J( i, j, k ,l) + Jcc (Өi
Step 4: if j < N
( j, k, l),P( j, k, l))
L
Otherwise end the life of bacterium.
Repeat Step 3.
Step 5: Reproduce i. For each bacterium J in the population S
ii. Compute : ),,,(1
1lkjiJ
lN
j
ihealthJ ∑
+
==
iii. If J size
a. Split the bacterium of its replica. is higher , the bacteria die else if it is in the best size and health
Step 6: If k < Nr Repeat Step3.
Bensujin et al. / International Journal of Engineering and Technology (IJET)
ISSN : 0975-4024 Vol 6 No 2 Apr-May 2014 1220
Otherwise end the reproduction stage. Step 7: Elimination – Dispersal
i. For all bacterium in the population S with the elimination rate Pa. Eliminate a bacteria
ed
b. Disperse other bacteria to a random location. Step 8: If l < Ne
Otherwise End the procedure Repeat from Step 2.
IV. EXPERIMENTAL RESULTS The proposed methodology is validated with the Chinese Heart Disease database which provided the records
of 209 patients. The dataset is categorised into different classes such as age, chest pain type, blood pressure, heart rate and disease occurrence is positive or negative. The system also worked well with the UCI machine learning repository which provided a multivariate data set. A total of 76 attributes were tested from the UCI dataset. The number of instances and attributes accepted by the system are 303 and 75. The table III exemplify the details presented by the Chinese data set of 209 patient records.
TABLE IIIII INPUT DATA SET WITH DIFFERENT ATTRIBUTES
Number of Patients : 209 Age group Chest pain Type Blood Pressure Heart Rate Disease occurrence
Age No.of Patients Type
No.of Patients range
No.of Patients range
No.of Patients Disease
No.of Patients
25-34 14 assympt 102 <120 68 80 - 100 21 Positive 117
36-45 60 atype angina 65 >120 and <140 50 102 - 120 33 Negative 92
46-55 101 non angina 36 >140 and <180 86 121 - 140 65
56-68 34 angina 6 >180 and <200 5 142 - 188 90 After recording the data set into the system, the system accomplished the pre-processing stages to gain the ST
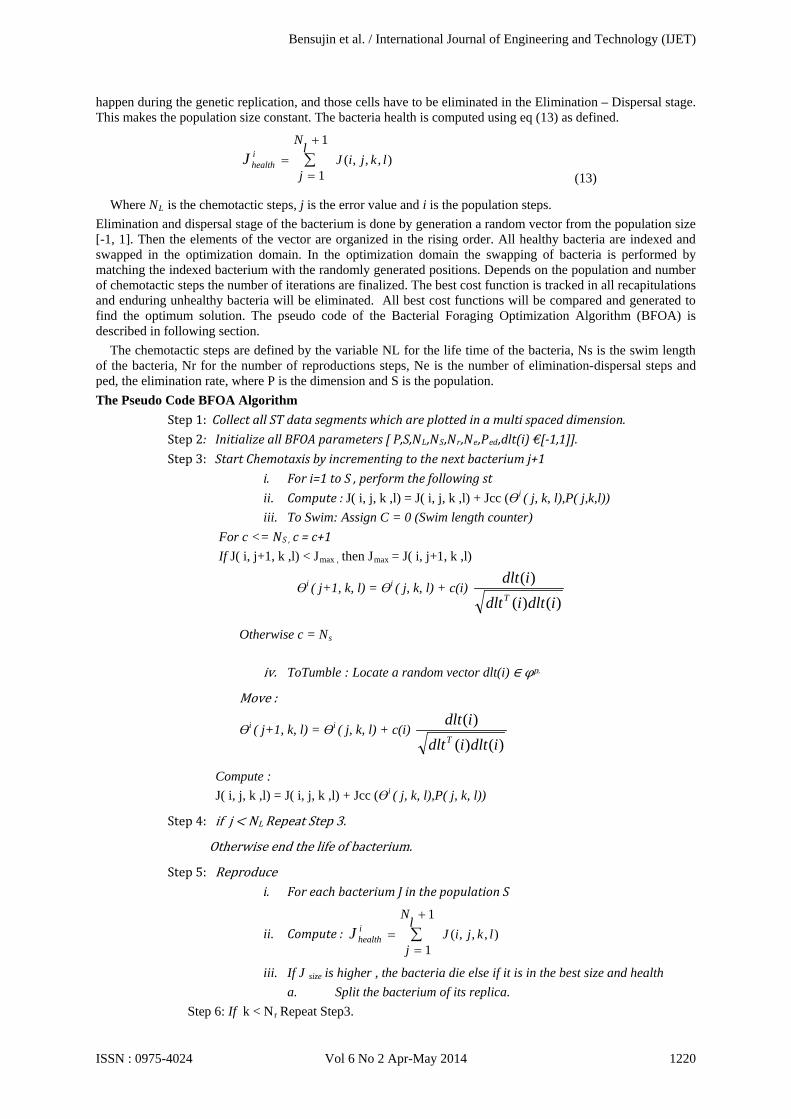
segment values from the continuous ECG signal. In order to make the test run the BFOA module is set with the colony size as 120, the number of chemotactic steps as 25, reproduction steps as 10, number of dispersals as 7 as described in Fig 8.
Fig 8: Run time output of the BFOA module with the best cost and best position.
Bensujin et al. / International Journal of Engineering and Technology (IJET)
ISSN : 0975-4024 Vol 6 No 2 Apr-May 2014 1221
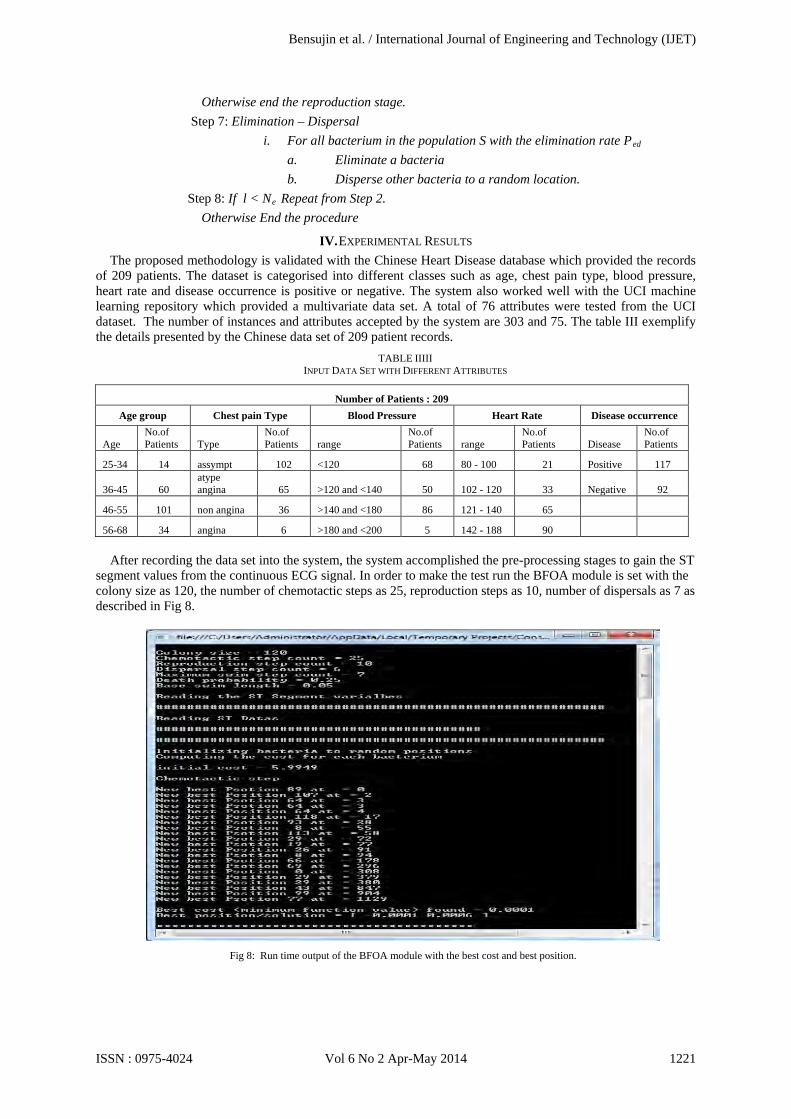
The BFOA module represented a best position at [-0.0001 0.0006] at the best cost at -0.0001. The number of iterations performed by the system is 21 for each patient record. The initial cost is set at 5.9949 before elimination, which is a random position chosen on the population S. Figure 9 resembles the foraging operation done by the system in each generations and Figure 10 plots the foraging after the dispersal step.
Fig 9: Initial Foraging Fig 10: Foraging after Dispersal
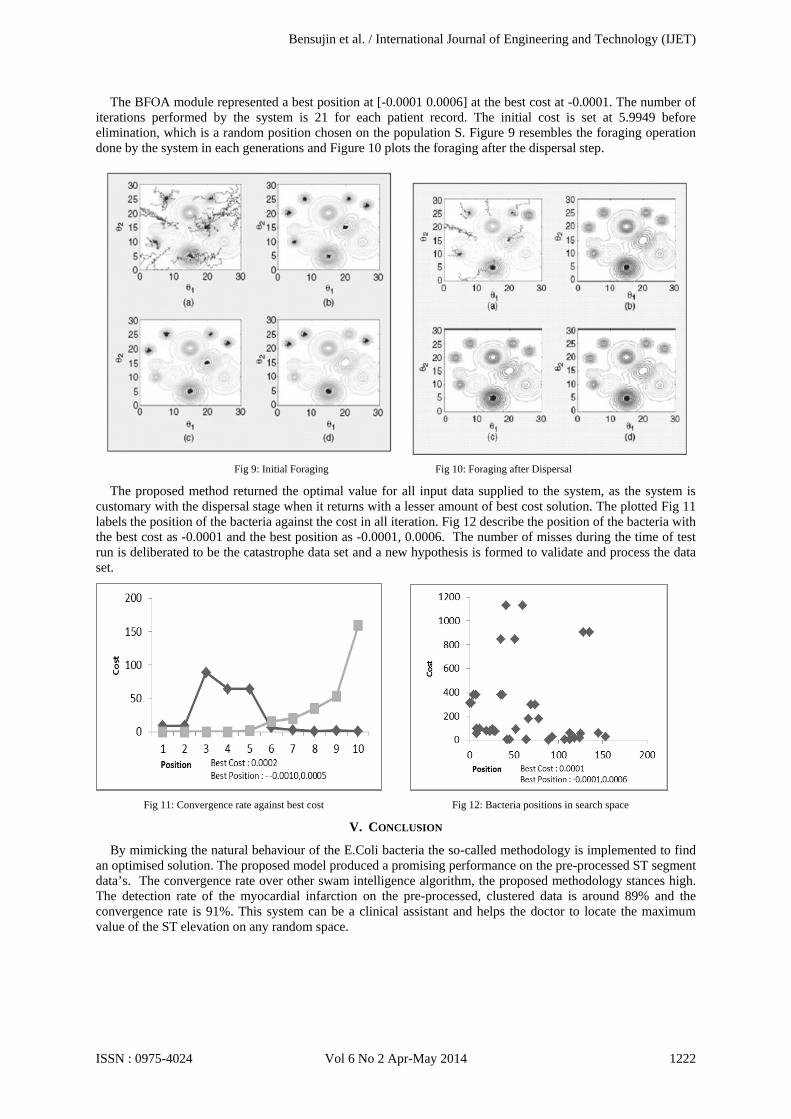
The proposed method returned the optimal value for all input data supplied to the system, as the system is customary with the dispersal stage when it returns with a lesser amount of best cost solution. The plotted Fig 11 labels the position of the bacteria against the cost in all iteration. Fig 12 describe the position of the bacteria with the best cost as -0.0001 and the best position as -0.0001, 0.0006. The number of misses during the time of test run is deliberated to be the catastrophe data set and a new hypothesis is formed to validate and process the data set.
Fig 11: Convergence rate against best cost Fig 12: Bacteria positions in search space
V. CONCLUSION
By mimicking the natural behaviour of the E.Coli bacteria the so-called methodology is implemented to find an optimised solution. The proposed model produced a promising performance on the pre-processed ST segment data’s. The convergence rate over other swam intelligence algorithm, the proposed methodology stances high. The detection rate of the myocardial infarction on the pre-processed, clustered data is around 89% and the convergence rate is 91%. This system can be a clinical assistant and helps the doctor to locate the maximum value of the ST elevation on any random space.
Bensujin et al. / International Journal of Engineering and Technology (IJET)
ISSN : 0975-4024 Vol 6 No 2 Apr-May 2014 1222
REFERENCES [1] J. W. Hurst, Abnormalities of the ST segment-Part I, Clinical Cardiology, Vol. 20, pp. 511-520, 1997. [2] G.Y. Jeongand K.H.Yu, Design of Ambulatory ECG Monitoring System to detectST pattern change, Proceedings of IEEE on SICE-
ICASE International Joint Conference, pp. 5873-5877,Oct2006. [3] R. V. Andreao, B. Dorizzi, J. Boudy, and J. C. M. Mota, ST-segment analysis using hidden markov model beat segmentation:
Application to ischemia Detection, Computer in Cardiology, Vol. 31, pp.381-384, 2004. [4] MachiSuka, TakumiIchimura, Katsumi Yoshida, Development of Coronary Heart Disease Database, Springer-Verlag Berlin
Heidelberg,PP.1081-1088,2004. [5] Louis Jacques,Tamara Syrek,Jyme Schafer,Jamie Hermansen, Michelle Issa,Joseph Chin, Coverage Decision Memorandum for
Intensive Behavioral Therapy for Cardiovascular Disease, Centers for Medicare & Medicaid Services, MD 21244 ,November 8, 2011.
[6] Gerado Beni and Jing Wang, Swam Intelligence, Proceedings 7th
[7] Michael C.Hinchey, Roy Sterritt and Chris Rouff, Swarms and Swarm Intellingence, Proceedings of Software Technologies, Journal of Computer Intelligence, pp.111-114,2007.
annual meet of Robotics Society of Japan, RSJ Press, pp.425-428, 1989.
[8] Swagatam Das, Arijit Biswas, Sambarta Dasgupta and Ajitha Abraham, Bacterial Foraging Optimization Algorithm : Theoretical Foundations, Analysis and Applications, Springer-Verlag Berlin Hiedelberg, vol 3, SCI 203, pp. 23-55,2009.
[9] Yakup Atasagun and Yakup Kara, Bacterial Foraging Optimization Algorithm for Assemblu line Balancing, Neural Computing and Applications, Springer-Verlag London, pp.333-345,2013.
[10] Niti Guru, Anil Dahiya, NavinRajpal, Decision Support System for Heart Disease Diagnosis Using Neural Network, Delhi Business Review, Vol. 8, No. 1 ,January - June 2007.
[11] Sellappan Palaniappan., Rafiah Awang., Intelligent Heart Disease Prediction System Using Data Mining Techniques, IJCSNS International Journal of Computer Science and Network Security, VOL.8 No.8, August 2008.
[12] Anamika Gupta and Naveen Kumar, Analysis of Medical Data using Data Mining and Formal Concept Analysis, World Academy of Science, Engineering and Technology 11 2005.
[13] Sheng-Nan Chang,Jou-Wei Lin,Juey-Jen Hwang, Measuring the process of quality of care for st-segment elevation acute myocardial infarction through data-mining of the electronic discharge notes , Vol 14, Issue 1,Jan 2008.
[14] Linh, T.H. , Osowski, Stainslaw ,Stodolski, M., On-line heart beat recognition using Hermite polynomials and neuro-fuzzy network, IEEE Transactions on Instrumentation and Measurement, Volume:52 , Issue: 4 ,PP: 1224 – 1231, Aug 2003.
[15] Ismail Ahmed Al Hadi and Siti Zaiton Hashim, Bacterial Foraging Optimization Algorithm for Neural Network Learning Enhancement”, International Journal of Innovative Computing, Vol 01(1) pp.8-14, 2011.
[16] Minakhi Rout, Babitha Majhi, Ritanjali Majhi and Ganapathi panda, Forecasting of currency exchange rates using and adaptive ARMA model with differential evolution based training, Journal of King Saud University – Computer and Information sciences, Vol 26, pp.7-18, 2014.
Bensujin et al. / International Journal of Engineering and Technology (IJET)
ISSN : 0975-4024 Vol 6 No 2 Apr-May 2014 1223