Embed Size (px)
Citation preview
Detection of pesticide impacts on larval prawns in hatcheries
and presence in estuarine intake water
Sharon E. Hook, Hai Doan, Debra Gonzago, Dean Musson, Jun Du, Rai Kookana, Melony Sellars and Anu Kumar
June 2017
FRDC Project No 2016-049
© 2017 Fisheries Research and Development Corporation. All rights reserved.
Detection of pesticide impacts on larval prawns in hatcheries and presence in estuarine intake water.
FRDC Project No 2016-049 IPA APFA
2017
Ownership of Intellectual property rights Unless otherwise noted, copyright (and any other intellectual property rights, if any) in this publication is owned by the Fisheries Research and Development Corporation Commonwealth Scientific and Industrial Research Organisation 2017
This publication (and any information sourced from it) should be attributed to Hook, S.E., Doan, H, Gonzago, D, Musson, D, Du, J, Kookana, R, Sellars, M, Kumar, A (2017) Detection of pesticide impacts on larval prawns in hatcheries and presence in estuarine intake water. CSIRO, Australia.
Creative Commons licence All material in this publication is licensed under a Creative Commons Attribution 3.0 Australia Licence, save for content supplied by third parties, logos and the Commonwealth Coat of Arms.
Creative Commons Attribution 3.0 Australia Licence is a standard form licence agreement that allows you to copy, distribute, transmit and adapt this publication provided you attribute the work. A summary of the licence terms is available from creativecommons.org/licenses/by/3.0/au/deed.en. The full licence terms are available from creativecommons.org/licenses/by/3.0/au/legalcode.
Inquiries regarding the licence and any use of this document should be sent to: [email protected]
Disclaimer The authors do not warrant that the information in this document is free from errors or omissions. The authors do not accept any form of liability, be it contractual, tortious, or otherwise, for the contents of this document or for any consequences arising from its use or any reliance placed upon it. The information, opinions and advice contained in this document may not relate, or be relevant, to a readers particular circumstances. Opinions expressed by the authors are the individual opinions expressed by those persons and are not necessarily those of the publisher, research provider or the FRDC.
The Fisheries Research and Development Corporation plans, invests in and manages fisheries research and development throughout Australia. It is a statutory authority within the portfolio of the federal Minister for Agriculture, Fisheries and Forestry, jointly funded by the Australian Government and the fishing industry.
Researcher Contact Details FRDC Contact Details Name: Address: Phone: Fax: Email:
Sharon Hook CSIRO O&A Lucas Heights NSW 2234 02 9710 6839 [email protected]
Address: Phone: Fax: Email: Web:
25 Geils Court Deakin ACT 2600 02 6285 0400 02 6285 0499 [email protected] www.frdc.com.au
In submitting this report, the researcher has agreed to FRDC publishing this material in its edited form.

Contents Contents ................................................................................................................................................. iv
Acknowledgments ............................................................................................................................... vii
Executive Summary ........................................................................................................................... viii
Introduction ........................................................................................................................................... 1
Review of the literature .....................................................................................................................1 Chemical and Toxicological properties of pesticides .................................................................1 Environmental concentrations of current use pesticides .............................................................4 Impacts of Insecticides on crustaceans and non-target Aquatic arthropods ...............................7
Objectives ............................................................................................................................................. 14
Method .................................................................................................................................................. 15
Toxicity Assessments ......................................................................................................................15 Prawns .......................................................................................................................................15 Exposure Solutions ....................................................................................................................15 Range finder experiments..........................................................................................................15 Daily renewal tests ....................................................................................................................15 Static exposure tests ..................................................................................................................16 Feeding Inhibition .....................................................................................................................16 Statistical analysis .....................................................................................................................16
Analytical Chemistry .......................................................................................................................16 Sample Collection .....................................................................................................................16 Chemical Analysis .....................................................................................................................16
Results and Discussion ........................................................................................................................ 20
Toxicity Assessments ......................................................................................................................20 Range Finder Results ................................................................................................................20 Fipronil ......................................................................................................................................21 Imidacloprid ..............................................................................................................................22 Bifenthrin ..................................................................................................................................27 Chlorpyrifos ..............................................................................................................................29
Chemical Analyses ..........................................................................................................................32 Insecticides ................................................................................................................................32 Herbicides .................................................................................................................................38 Other Compounds .....................................................................................................................41 Limitations ................................................................................................................................41
Conclusions and Implications ............................................................................................................ 45
Recommendations ............................................................................................................................... 46
Further development ........................................................................................................................46
Extension and Adoption ...................................................................................................................... 47
Glossary ................................................................................................................................................ 48
Project materials developed ............................................................................................................... 50
Appendices ........................................................................................................................................... 51
Project staff ......................................................................................................................................51
References ............................................................................................................................................ 52
FRDC FINAL REPORT CHECKLIST ................................................. Error! Bookmark not defined.
Tables
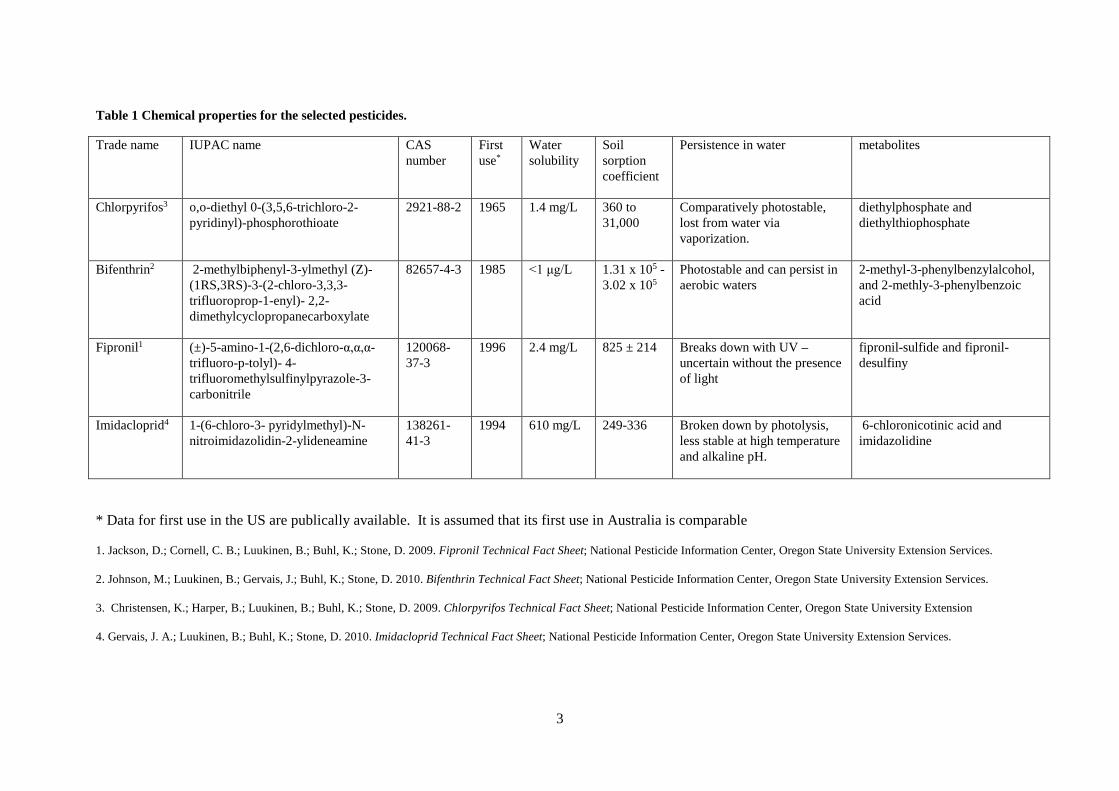
Table 1 Chemical properties for the selected pesticides. .............................................................................. 3
Table 2. Most frequently registered uses of the selected pesticide. ............................................................. 4
Table 3. Land use patterns in catchments containing prawn farms. .......................................................... 5
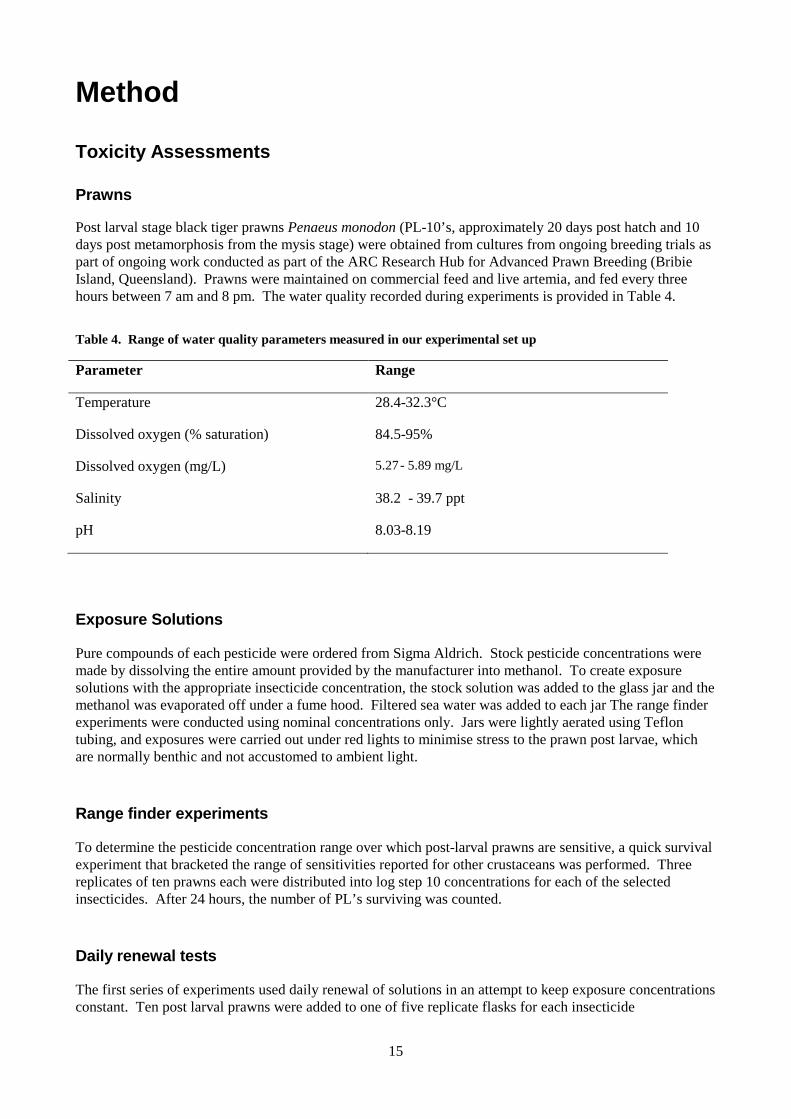
Table 4 The range of water quality parameters measured in our experimental set up ............................... 15
Table 5 Level of detection (μg/L) of pesticides measured in this study ..................................................... 19
Table 6 Results obtained during the range finder study .............................................................................. 20
Table 7 LC50 and LC10 values for the insecticides included in this study. .................................................. 31
Table 8 Pesticide concentrations measured in three replicate samples collected from intake waters at participating prawn farms. ......................................................................................................................... 34
Table 9. ANZECC/ARMCANZ and GBRMPA water quality guideline values for pesticides measured in prawn farm intake waters. ......................................................................................................................... 38
Table 10. The values used for risk assessment. . ....................................................................................... 43
Figures Figure 1 Increases in imidacloprid concentrations measured in Great Barrier Reef catchments (2009-2015) .............................................................................................................................................................. 6
Figure 2 Species sensitivity distribution for chlorpyrifos, based on LC50 concentrations. ......................... 8
Figure 3 Species sensitivity distribution for bifenthrin, based on LC50 concentrations. ............................ 9
Figure 4 Species sensitivity distribution for fipronil, based on LC50 concentrations. .............................. 10
Figure 5 Species Sensitivity distribution for imidiacloprid, based on LC50 concentrations.. ..................... 11
Figure 6. Location of farms where samples were taken. .......................................................................... 18
Figure 7 Survival (average + standard deviation) of post larval phase prawns exposed to different concentrations of fipronil.. .......................................................................................................................... 21
Figure 8 Average artemia consumption (mean + standard deviation) of post larval phase prawns exposed to different concentrations of fipronil, normalized to surviving individual. . ............................................ 22
Figure 9 Average survival (mean + standard deviation) of post larval phase prawns exposed to imidacloprid. ............................................................................................................................................. 23
Figure 10 Average artemia consumption (mean + standard deviation) of post larval phase prawns exposed to imidacloprid for 24 hours, normalized to surviving individual. ........................................................... 24
Figure 11 Average survival (mean + standard deviation) of post larval phase prawns exposed to different concentrations of imidacloprid. ................................................................................................................... 25
Figure 12 Average Artemia consumption (mean + standard deviation) of post larval phase prawns exposed to different concentrations of imidacloprid, normalized to surviving individual. ........................ 26
Figure 13 Average survival (mean + standard deviation) of post larval phase prawns exposed to different concentrations of imidacloprid. ................................................................................................................. 27
Figure 14 Average survival (mean + standard deviation) of post larval phase prawns exposed to different concentrations of bifenthrin. ....................................................................................................................... 28
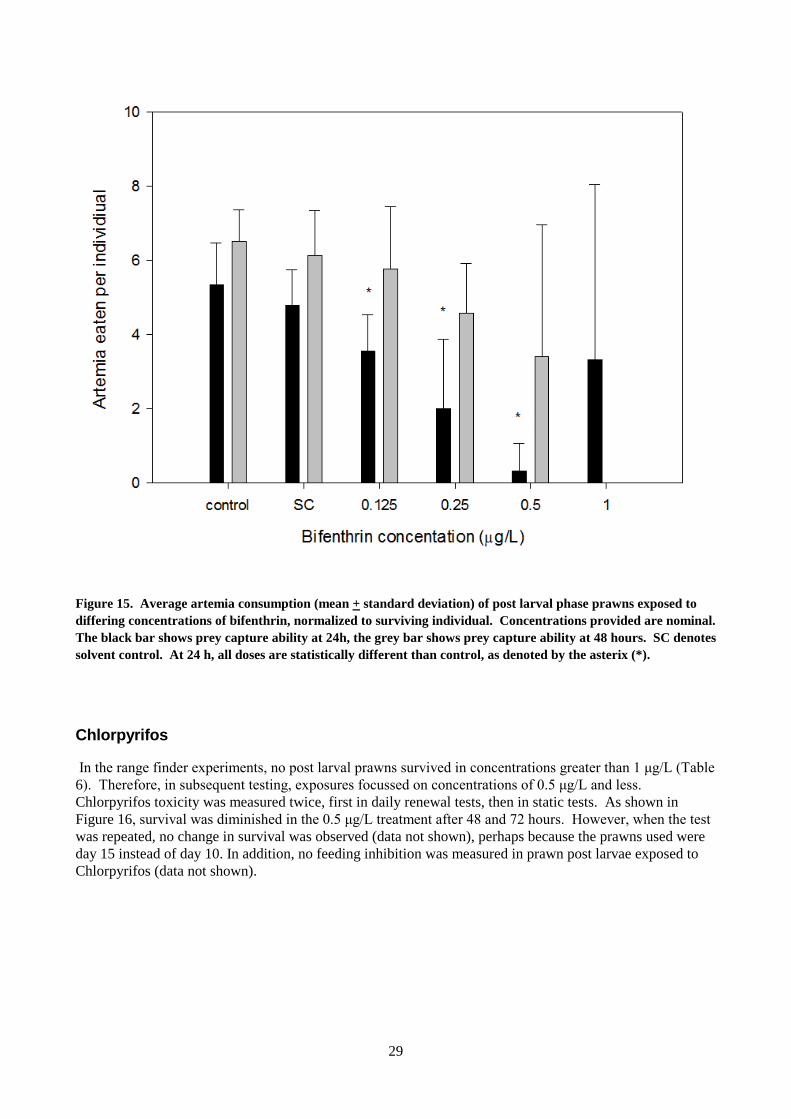
Figure 15 Average artemia consumption (mean + standard deviation) of post larval phase prawns exposed to differing concentrations of bifenthrin, normalized to surviving individual. ........................................... 29
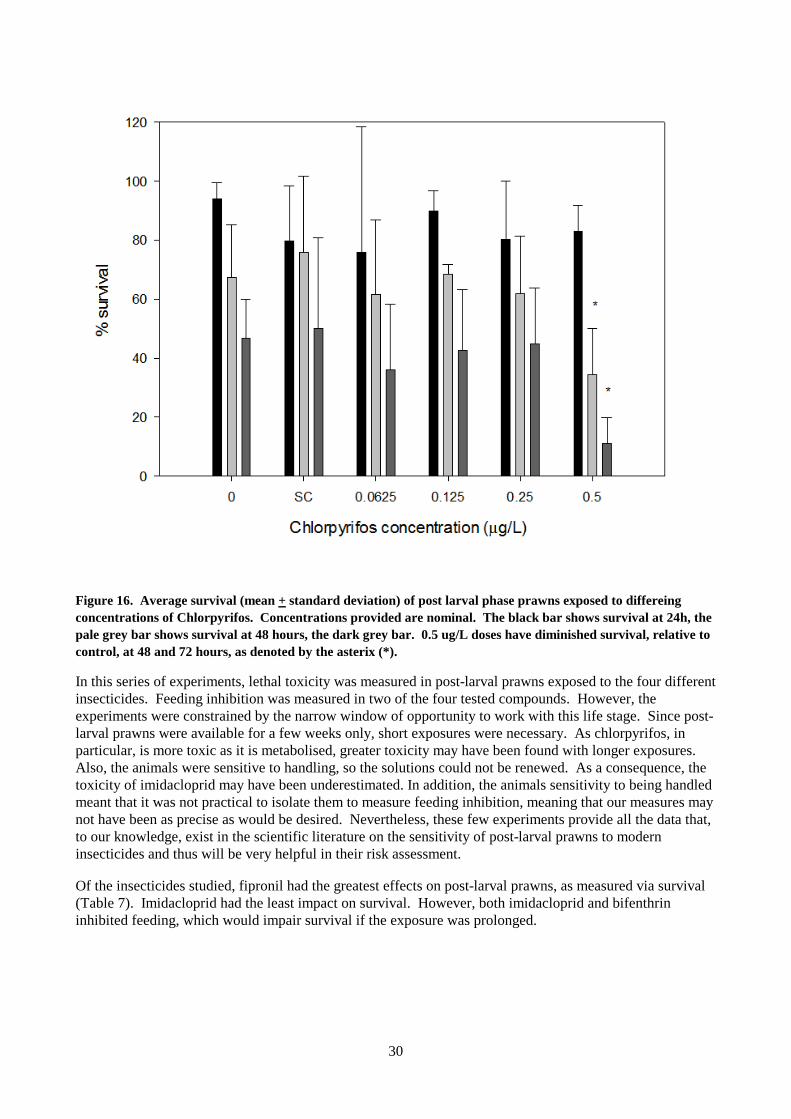
Figure 16 Average survival (mean + standard deviation) of post larval phase prawns exposed to differeing concentrations of Chlorpyrifos. ................................................................................................................... 30
Figure 17. Measured concentrations of each insecticide compared to concentrations at which lethal and sublethal impacts have been reported in crustaceans. ............................................................................... 37
Figure 18 . Measured concentrations of each insecticide compared to concentrations at which lethal and sublethal impacts have been reported in crustaceans. ............................................................................... 40
Figure 19. Measured concentrations of other analytes compared to concentrations at which lethal impacts have been reported in crustaceans.. ............................................................................................................. 41

Acknowledgments This work would not have been possible without the assistance and technical expertise of Brian Murphy (CSIRO Agriculture & Food). The staff members at the Bribie Island Research Station, Simon Irvin (CSIRO Agriculture & Food) in particular, also provided invaluable logistical support. Monique Binet (CSIRO Land & Water) provided assistance with the LC50 calculations, and Graeme Batley (CSIRO Land & Water) made helpful comments on a previous version of this manuscript. This study also would not have been possible without the assistance of the farmers who collected water samples. This report was supported by funding from the Australian Prawn Farmers Association (APFA) and the Fisheries Research and Development Corporation (FRDC) on behalf of the Australian Government.
Executive Summary The use patterns of pesticides in Australia has changed over the last decade, with the use of pyrethroid and neonicotinoid insecticides increasing. The limited water quality data that is available has measured increased concentrations of the neonicotinoid insecticide imidacloprid in particular. Prawn farms in Australia are predominantly located adjacent to estuaries in Queensland, which are impacted by multiple land uses upstream (e.g. sugarcane farming, banana farming, beef cattle farming and urbanisation). Because of their small size and rapid growth requirements, we would hypothesise that larval prawns would be most susceptible to the impacts of these modern pesticides.
While there is little ecotoxicology data for marine species, early life stages, or Australian species, the information available from studies with crustaceans conducted elsewhere suggests that the concentrations measured in this and other studies may be sufficient to cause impacts on survival, either directly or via inhibition of feeding. However, given the uncertainties in a) the levels of insecticides in farm intake water; b) the impacts of insecticide exposure on prawn larvae; and c) how these compounds interact when they co-occur, we can not adequately predict the impacts of these changes in pesticide use on the survival of post larval phase prawns.
To address these uncertainties, a series of experiments were conducted to determine the sensitivity of post larval prawns to these insecticides. To assess the potential for risk, a series of experiments examined the impact of exposure of post-larval black tiger prawns (Penaeus monodon) to modern use insecticides, imidacloprid, bifenthin, and fipronil as well as the organophosphate insecticide chlorpyrifos for comparison. Impacts were measured as decreased survival and feeding inhibition. Post-larval phase prawns were most sensitive to fipronil, bifenthrin, chlorpyrifos, and imidacloprid, in that order. They were comparably sensitive to other crustaceans based on literature studies. Bifenthrin and imidacloprid exposure also reduced the ability of post-larval prawns to capture live prey.
To determine the environmental risk of exposure to these compounds, concentrations of a broad suite of pesticides was measured in prawn farm intake waters. At least some pesticides were measured in every sample. Most of the pesticides detected were measured below concentrations that would be expected to cause harm to prawn larvae, although some herbicides were at concentrations that exceed either ANZECC/ARMCANZ or GBRMPA trigger values, suggesting the possibility of indirect or mixture related impacts. However, in the Mackay Catchment and Logan River, imidacloprid, bifenthrin, fipronil and chlorpyrifos insecticides were measured at concentrations that pose risk to prawn larvae. The potential for interactive effects and the limitations of basing risk on water samples collected at a single time point are discussed.
Keywords
Pesticides; Peneaus monodon, Water Quality, Fipronil, Bifenthrin, Chlorpyrifos, Imidacloprid,
1
Introduction
Review of the literature The purpose of this review is to collate what was known (prior to the onset of our experimental work) about the potential risks from exposure to modern-use pesticides for the survival of farmed post-larval prawns. Although there are hundreds of different pesticides currently in use in Queensland, this study focussed on imidacloprid, bifenthrin, fipronil and chlorpyrifos. Imidacloprid, representative of the neonicotinoid pesticides, was chosen because monitoring data from the Great Barrier Reef (GBR) catchments indicate that its concentration in water samples is increasing rapidly. Bifenthrin and fipronil are representative of classes of compounds that have been associated with aquatic toxicity elsewhere in the world. Chlorpyrifos was chosen for comparative purposes because it is representative of organophosphate insecticides that although being phased out, chlorpyrifos is still one of the most broadly used insecticides (Zhao and Chen, 2016). In the US, the use of chlorpyrifos against termites and for residential applications has been restricted, and it is no longer considered an ecological risk there (Giddings et al., 2014). However, in Australia it is still used for domestic pest control (e.g. it is used in residences) and may pose many of the environmental problems that led to its restriction in the US. This review will cover:
i. the patterns of use of these pesticides in Queensland, and where available, the concentrations at which they’ve been measured; and
ii. the current knowledge regarding the physiological impacts on crustaceans from exposure to these insecticides
Risk assessment is dependent on the concentrations of these compounds found in the environment and the sensitivity of the organisms to the contaminant. While we anticipate that their small body size, frequent moulting, low tolerance to starvation, and potential exposure to insecticides in intake water will make the post-larval phase the most sensitive to insecticide exposure of the black tiger prawn (Penaeus monodon) life stages, as outlined in the sections below, we do not currently have adequate information about the sensitivity of any Penaeid prawn life stage, or of the concentrations of insecticides to which prawns could be getting exposed to during commercial culture, to enable accurate estimation of the potential risks.
Chemical and Toxicological properties of pesticides
Population growth and increased food demand have led to a concurrent increase in pesticide use (Mugni et al., 2016). Insecticides are commonly used in agriculture to improve crop yield, to eliminate nuisance pests from residential areas, and in public health to control mosquitos and other potential disease vectors (e.g. Stevens et al., 2011). Ideally, an insecticide will be quick acting on the designated “pest species”, and have low toxicity to other animals in the environment. As a consequence, many insecticides are nerve agents, and are being designed to be more specific to arthropods, including insects and crustaceans. Even amongst the nerve agents, there are a variety of different compounds with slightly different biochemical properties. These insecticides can be grouped into classes based on their chemical properties and modes of action.
An older class of insecticide is the organophosphate pesticides, such as chlorpyrifos. Organophosphate compounds inhibit acetylcholinesterase activity, an enzyme that resets nerves to “normal” after they have signalled (Halstead et al., 2015). This acetylcholinesterase inhibition results in paralysis and death. Inhibition of acetylcholinesterase is not specific to arthropods, and as a consequence, there have been concerns about the impacts of organophosphate pesticides on non-
2
target organisms, including humans. Organophosphates are being phased out of use in many countries because of concern regarding their impact on human health and potential carcinogenesis (Weston and Lydy, 2014). Consequently, new classes of insecticides have been used increasingly.
Pyrethroid insecticides, such as bifenthrin, prevent repolarisation of voltage-sensitive ion channels in the membrane of the axon of nerves (Halstead et al., 2015). These have low toxicity to birds and mammals, but higher toxicity to fish and arthropods. The phenylpyrazole insecticide fipronil also interferes with GABA receptors in insect and crustacean nerve cells (Stevens et al., 2011).
Neonicotinid compounds, such as imidacloprid, are specifically designed to alter the normal activity of arthropods nicotinic acetylcholinesterase activity, which are structurally different than those of other animals (Sanchez-Bayo and Hyne, 2014). Imidacloprid binds irreversibly to nicotinic receptors, and exposure may have cumulative effects on organism health (Rondeau et al., 2014). Neonicotinid pesticides have been used in increasing amounts worldwide because they are very effective at eliminating insect pests, yet pose low risks to mammals and fish (Sanchez-Bayo and Hyne, 2014). These pesticides are highly water soluble and can be applied via numerous methods, and are used in both agricultural and urban applications (Sanchez-Bayo and Hyne, 2014). As discussed in more detail in subsequent sections, because these compounds have similar modes of action, they may interact to cause additive or greater than additive toxicity. Despite the similarity in mode of action, these compounds have quite different chemical properties (Table 1). Pyrethroid pesticides such as bifenthrin are hydrophobic and primarily associated with sediments (Holmes et al., 2008). Once in the water column, these compounds quickly partition into lipid and sediments (Solomon et al., 2001), however increased water-column concentrations can be associated with stormwater run-off events. Although uptake of this compound into tissue is rapid, it is quickly depurated, and as a consequence there is low concern about trophic transfer (Solomon et al., 2001). Fipronil also has relatively poor water solubility and is more likely to be associated with sediment than dissolved in the water column. Chlorpyrifos is also hydrophobic (Kuivila and Foe, 1995), and more often found in sediments than in the dissolved phase (Giddings et al., 2014).
Imidacloprid behaves very differently to the other pesticides discussed because of its low affinity for sediment (Table 1). Imidacloprid is highly water soluble and breaks down in light (Smit et al., 2015), and as a consequence, its environmental persistence is dependent on light (Anderson et al., 2015b), but can persist in turbid or cloudy waters. The compound is persistent in the environment and has a high potential to leach into the aquatic environment (Anderson et al., 2015b) but does not accumulate appreciably in sediments.
3
Table 1 Chemical properties for the selected pesticides.
Trade name IUPAC name CAS number
First use*
Water solubility
Soil sorption coefficient
Persistence in water metabolites
Chlorpyrifos3 o,o-diethyl 0-(3,5,6-trichloro-2-pyridinyl)-phosphorothioate
2921-88-2 1965 1.4 mg/L 360 to 31,000
Comparatively photostable, lost from water via vaporization.
diethylphosphate and diethylthiophosphate
Bifenthrin2 2-methylbiphenyl-3-ylmethyl (Z)-(1RS,3RS)-3-(2-chloro-3,3,3-trifluoroprop-1-enyl)- 2,2-dimethylcyclopropanecarboxylate
82657-4-3 1985 <1 μg/L 1.31 x 10⁵ - 3.02 x 10⁵
Photostable and can persist in aerobic waters
2-methyl-3-phenylbenzylalcohol, and 2-methly-3-phenylbenzoic acid
Fipronil1 (±)-5-amino-1-(2,6-dichloro-α,α,α-trifluoro-p-tolyl)- 4-trifluoromethylsulfinylpyrazole-3-carbonitrile
120068-37-3
1996 2.4 mg/L 825 ± 214 Breaks down with UV – uncertain without the presence of light
fipronil-sulfide and fipronil-desulfiny
Imidacloprid4 1-(6-chloro-3- pyridylmethyl)-N-nitroimidazolidin-2-ylideneamine
138261-41-3
1994 610 mg/L 249-336 Broken down by photolysis, less stable at high temperature and alkaline pH.
6-chloronicotinic acid and imidazolidine
* Data for first use in the US are publically available. It is assumed that its first use in Australia is comparable
1. Jackson, D.; Cornell, C. B.; Luukinen, B.; Buhl, K.; Stone, D. 2009. Fipronil Technical Fact Sheet; National Pesticide Information Center, Oregon State University Extension Services.
2. Johnson, M.; Luukinen, B.; Gervais, J.; Buhl, K.; Stone, D. 2010. Bifenthrin Technical Fact Sheet; National Pesticide Information Center, Oregon State University Extension Services.
3. Christensen, K.; Harper, B.; Luukinen, B.; Buhl, K.; Stone, D. 2009. Chlorpyrifos Technical Fact Sheet; National Pesticide Information Center, Oregon State University Extension
4. Gervais, J. A.; Luukinen, B.; Buhl, K.; Stone, D. 2010. Imidacloprid Technical Fact Sheet; National Pesticide Information Center, Oregon State University Extension Services.
4
Environmental concentrations of current use pesticides
The concentrations in the aquatic environment of most of these pesticides are unknown for many regions in Queensland, but may be comparatively high because of the agricultural land use adjacent to waterways and the tropical and sub-tropical conditions. Pesticide use can be higher in the tropics due to a variety of environmental factors (Lewis et al., 2016). Lower organic carbon content in soils is associated with increased run-off and risk to aquatic systems, but with increased rates of microbial metabolism as well. As a consequence, field dissipation rates are faster in the tropics than in temperate environments (Lewis et al., 2016).
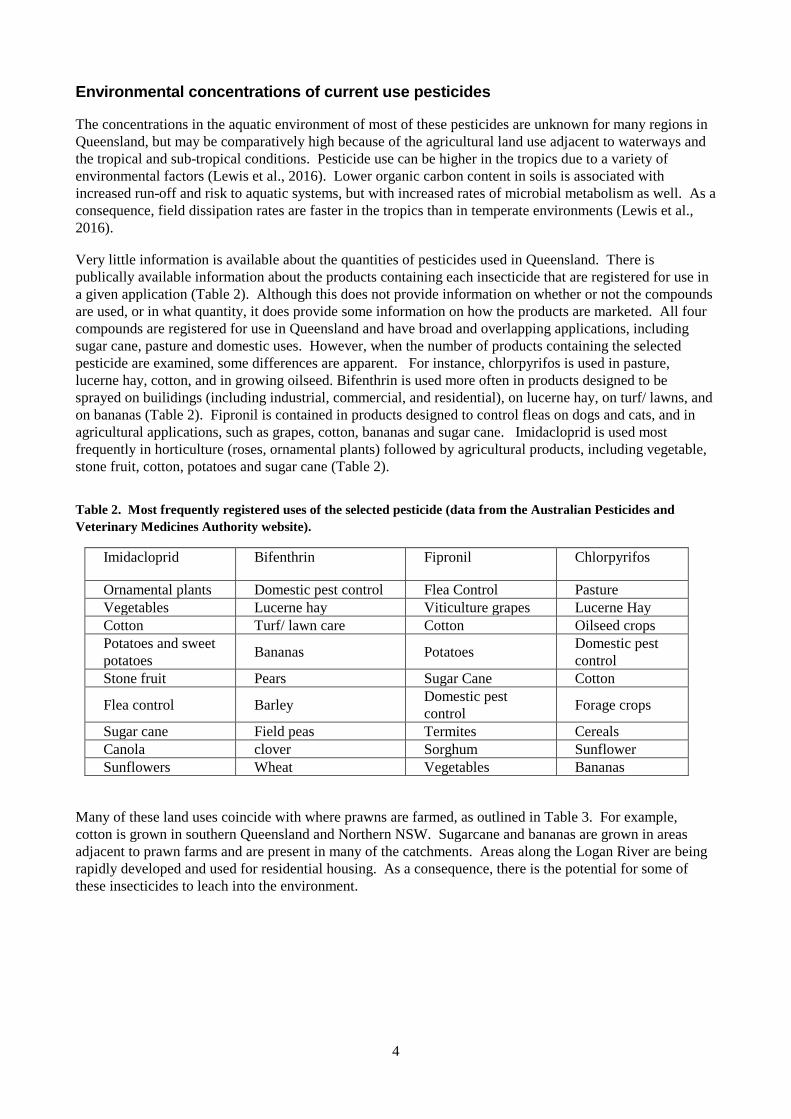
Very little information is available about the quantities of pesticides used in Queensland. There is publically available information about the products containing each insecticide that are registered for use in a given application (Table 2). Although this does not provide information on whether or not the compounds are used, or in what quantity, it does provide some information on how the products are marketed. All four compounds are registered for use in Queensland and have broad and overlapping applications, including sugar cane, pasture and domestic uses. However, when the number of products containing the selected pesticide are examined, some differences are apparent. For instance, chlorpyrifos is used in pasture, lucerne hay, cotton, and in growing oilseed. Bifenthrin is used more often in products designed to be sprayed on builidings (including industrial, commercial, and residential), on lucerne hay, on turf/ lawns, and on bananas (Table 2). Fipronil is contained in products designed to control fleas on dogs and cats, and in agricultural applications, such as grapes, cotton, bananas and sugar cane. Imidacloprid is used most frequently in horticulture (roses, ornamental plants) followed by agricultural products, including vegetable, stone fruit, cotton, potatoes and sugar cane (Table 2).
Table 2. Most frequently registered uses of the selected pesticide (data from the Australian Pesticides and Veterinary Medicines Authority website).
Imidacloprid Bifenthrin Fipronil Chlorpyrifos
Ornamental plants Domestic pest control Flea Control Pasture Vegetables Lucerne hay Viticulture grapes Lucerne Hay Cotton Turf/ lawn care Cotton Oilseed crops Potatoes and sweet potatoes Bananas Potatoes Domestic pest
control Stone fruit Pears Sugar Cane Cotton
Flea control Barley Domestic pest control Forage crops
Sugar cane Field peas Termites Cereals Canola clover Sorghum Sunflower Sunflowers Wheat Vegetables Bananas
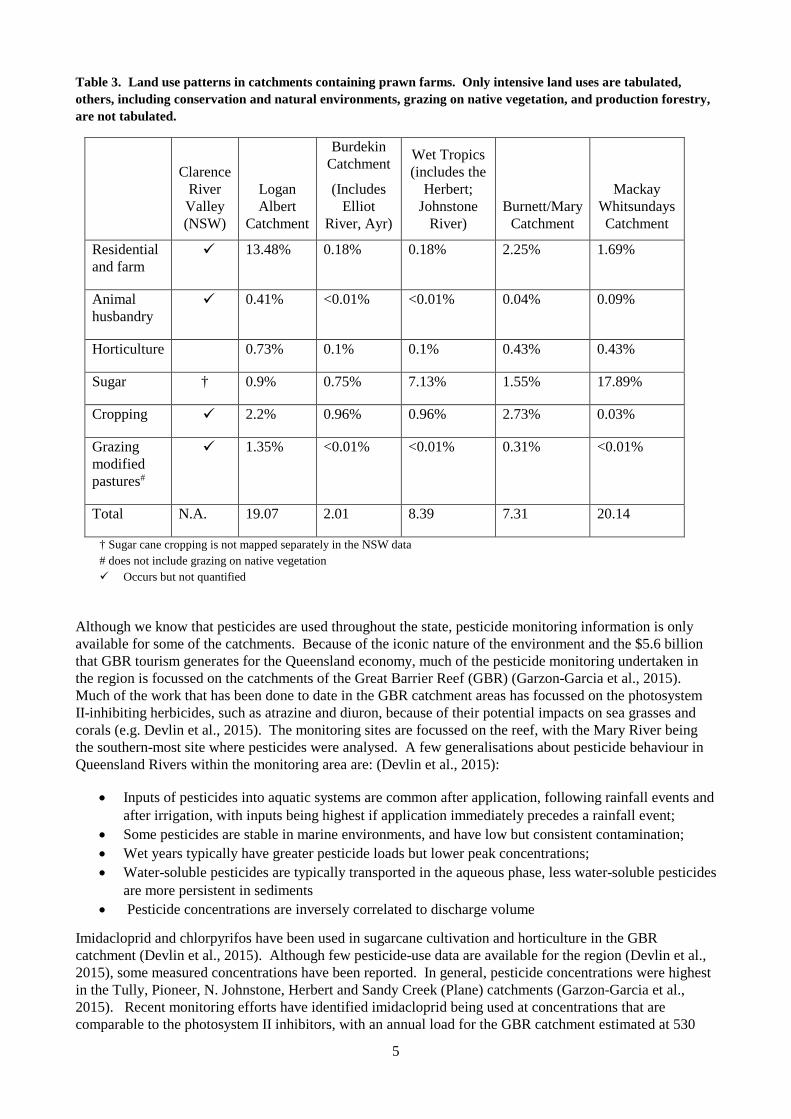
Many of these land uses coincide with where prawns are farmed, as outlined in Table 3. For example, cotton is grown in southern Queensland and Northern NSW. Sugarcane and bananas are grown in areas adjacent to prawn farms and are present in many of the catchments. Areas along the Logan River are being rapidly developed and used for residential housing. As a consequence, there is the potential for some of these insecticides to leach into the environment.
5
Table 3. Land use patterns in catchments containing prawn farms. Only intensive land uses are tabulated, others, including conservation and natural environments, grazing on native vegetation, and production forestry, are not tabulated.
Clarence River Valley (NSW)
Logan Albert
Catchment
Burdekin Catchment
(Includes Elliot
River, Ayr)
Wet Tropics (includes the
Herbert; Johnstone
River) Burnett/Mary
Catchment
Mackay Whitsundays Catchment
Residential and farm
13.48% 0.18% 0.18% 2.25% 1.69%
Animal husbandry
0.41% <0.01% <0.01% 0.04% 0.09%
Horticulture 0.73% 0.1% 0.1% 0.43% 0.43%
Sugar † 0.9% 0.75% 7.13% 1.55% 17.89%
Cropping 2.2% 0.96% 0.96% 2.73% 0.03%
Grazing modified pastures#
1.35% <0.01% <0.01% 0.31% <0.01%
Total N.A. 19.07 2.01 8.39 7.31 20.14
† Sugar cane cropping is not mapped separately in the NSW data # does not include grazing on native vegetation Occurs but not quantified
Although we know that pesticides are used throughout the state, pesticide monitoring information is only available for some of the catchments. Because of the iconic nature of the environment and the $5.6 billion that GBR tourism generates for the Queensland economy, much of the pesticide monitoring undertaken in the region is focussed on the catchments of the Great Barrier Reef (GBR) (Garzon-Garcia et al., 2015). Much of the work that has been done to date in the GBR catchment areas has focussed on the photosystem II-inhibiting herbicides, such as atrazine and diuron, because of their potential impacts on sea grasses and corals (e.g. Devlin et al., 2015). The monitoring sites are focussed on the reef, with the Mary River being the southern-most site where pesticides were analysed. A few generalisations about pesticide behaviour in Queensland Rivers within the monitoring area are: (Devlin et al., 2015):
• Inputs of pesticides into aquatic systems are common after application, following rainfall events and after irrigation, with inputs being highest if application immediately precedes a rainfall event;
• Some pesticides are stable in marine environments, and have low but consistent contamination; • Wet years typically have greater pesticide loads but lower peak concentrations; • Water-soluble pesticides are typically transported in the aqueous phase, less water-soluble pesticides
are more persistent in sediments • Pesticide concentrations are inversely correlated to discharge volume
Imidacloprid and chlorpyrifos have been used in sugarcane cultivation and horticulture in the GBR catchment (Devlin et al., 2015). Although few pesticide-use data are available for the region (Devlin et al., 2015), some measured concentrations have been reported. In general, pesticide concentrations were highest in the Tully, Pioneer, N. Johnstone, Herbert and Sandy Creek (Plane) catchments (Garzon-Garcia et al., 2015). Recent monitoring efforts have identified imidacloprid being used at concentrations that are comparable to the photosystem II inhibitors, with an annual load for the GBR catchment estimated at 530
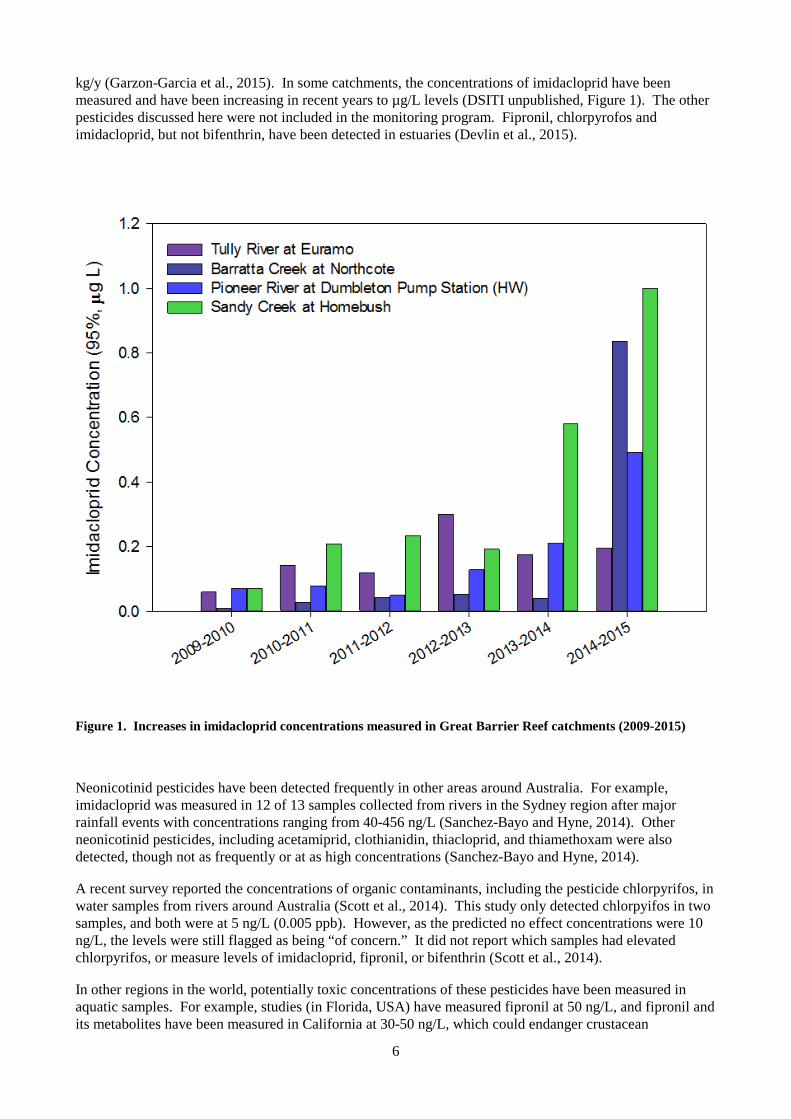
6
kg/y (Garzon-Garcia et al., 2015). In some catchments, the concentrations of imidacloprid have been measured and have been increasing in recent years to µg/L levels (DSITI unpublished, Figure 1). The other pesticides discussed here were not included in the monitoring program. Fipronil, chlorpyrofos and imidacloprid, but not bifenthrin, have been detected in estuaries (Devlin et al., 2015).
Figure 1. Increases in imidacloprid concentrations measured in Great Barrier Reef catchments (2009-2015)
Neonicotinid pesticides have been detected frequently in other areas around Australia. For example, imidacloprid was measured in 12 of 13 samples collected from rivers in the Sydney region after major rainfall events with concentrations ranging from 40-456 ng/L (Sanchez-Bayo and Hyne, 2014). Other neonicotinid pesticides, including acetamiprid, clothianidin, thiacloprid, and thiamethoxam were also detected, though not as frequently or at as high concentrations (Sanchez-Bayo and Hyne, 2014).
A recent survey reported the concentrations of organic contaminants, including the pesticide chlorpyrifos, in water samples from rivers around Australia (Scott et al., 2014). This study only detected chlorpyifos in two samples, and both were at 5 ng/L (0.005 ppb). However, as the predicted no effect concentrations were 10 ng/L, the levels were still flagged as being “of concern.” It did not report which samples had elevated chlorpyrifos, or measure levels of imidacloprid, fipronil, or bifenthrin (Scott et al., 2014).
In other regions in the world, potentially toxic concentrations of these pesticides have been measured in aquatic samples. For example, studies (in Florida, USA) have measured fipronil at 50 ng/L, and fipronil and its metabolites have been measured in California at 30-50 ng/L, which could endanger crustacean
7
populations (Wu et al., 2015; Weston and Lydy, 2014). These elevated concentrations occurred in residential areas with high amounts of lawn maintenance (Wu et al., 2015). In a US study, Bifenthrin was found in all seven urbanised stream environments surveyed, at concentrations as high as 11 µg/kg in sediments (Kuivila et al., 2012). In inland California, concentrations of chlorpyrifos were high enough to potentially affect the distribution of non-target invertebrates in the early 2000s (Xu et al., 2016). Now that these compounds are being phased out and replaced by pyrethroid pesticides (Ryberg and Gilliom, 2015), these pesticides, including bifenthrin, are causing toxicity in the same region (Xu et al., 2016).
Since chlorpyrifos has been phased out of residential use in the US, there are less frequent reports of it at concentrations greater than 100 ng/L, and it is considered to be low risk there (Giddings et al., 2014). An earlier US study detected chlorpyrifos at between 31 and 42 ng/L in three of twenty samples, but as the other pesticides (diazinon and methidathion) were at much higher concentrations, these concentrations were not thought to be contributing to the toxicity observed in water samples from these sites (Kuivila and Foe, 1995). In Latin America, chlorpyrifos was frequently detected in sediment samples collected in agricultural zones, but was frequently not at concentrations high enough to cause toxicity (e.g. less than 30 ng/g) (Hunt et al., 2016).
Impacts of Insecticides on crustaceans and non-target Aquatic arthropods
The following provides a summary of what is known about the environmental impacts of imidacloprid, fipronil, bifenthrin and chlorpyrifos on crustaceans and non-target aquatic arthropods. Although the concentrations of these pesticides in the aquatic environment are quite low, their specificity for arthropods indicates that non-target crustaceans, such as prawns, may be at risk. Very little work has been done on the toxicity of pesticides to Penaeid prawns or other crustaceans in the region (Devlin et al., 2015) so much of the following review is based on studies conducted elsewhere in the world. Also, much of the recent environmental impact work assessing these compounds has focused on pollinators (reviewed in Sanchez-Bayo and Goka, 2014).
The safety of pesticides prior to their registration for use in the environment has been primarily determined by industry-funded, laboratory-based toxicity tests (Boone et al., 2014). It is thought that some level of contamination is possible without harming aquatic ecosystems. The permissible concentration of each contaminant is based on the risk that exposure to that compound poses to aquatic organisms (Leung et al., 2014). Often a species sensitivity distribution, or SSD, where toxicity test data for a range of receptor species (typically more than 8 species from at least 4 different taxonomic groups) is plotted, and regression analysis is used to identify concentrations that would protect 90, 95 or 99% of species (ANZECC/ARMCANZ, 2000). Under the ANZECC/ARMCANZ (2000) guidelines, a species sensitivity distribution is used to identify concentrations that if found in aquatic environments, should trigger further investigation (Pathiratne and Kroon, 2016). In Australia, water quality guidelines are derived from sublethal toxicity data if available, or where not available, from lethal data with a “safety factor”. Recent studies have used this approach to suggest a guideline value of 1.8 µg/L for imidacloprid in tropical fresh waters (Pathiratne and Kroon, 2016), but no comparable values are available for marine species. Similarly, the current ANZECC guidelines for chlorpyrifos is 10 ng/L.
Despite the advantages, this approach does have some shortcomings. The results are expected to be protective of the system as a whole but assumes some level of “functional redundancy” (Leung et al., 2014), and will not necessarily protect all species. These studies are typically done with adult organisms and may not predict impacts on early life stages, and more information is available for freshwater species than marine. Stakeholders (such as aquaculturists or fisheries groups) may prefer assessments carried out on the species they are interested in. Also, the approach is most predictive when the toxicity thresholds are similar across all members of a given taxonomic group. With the large differences in toxicity seen between species in the data sets for these species, the threshold concentrations may not be adequately predictive with only a few toxicity test values.
8
Laboratory studies
Chlorpyrifos
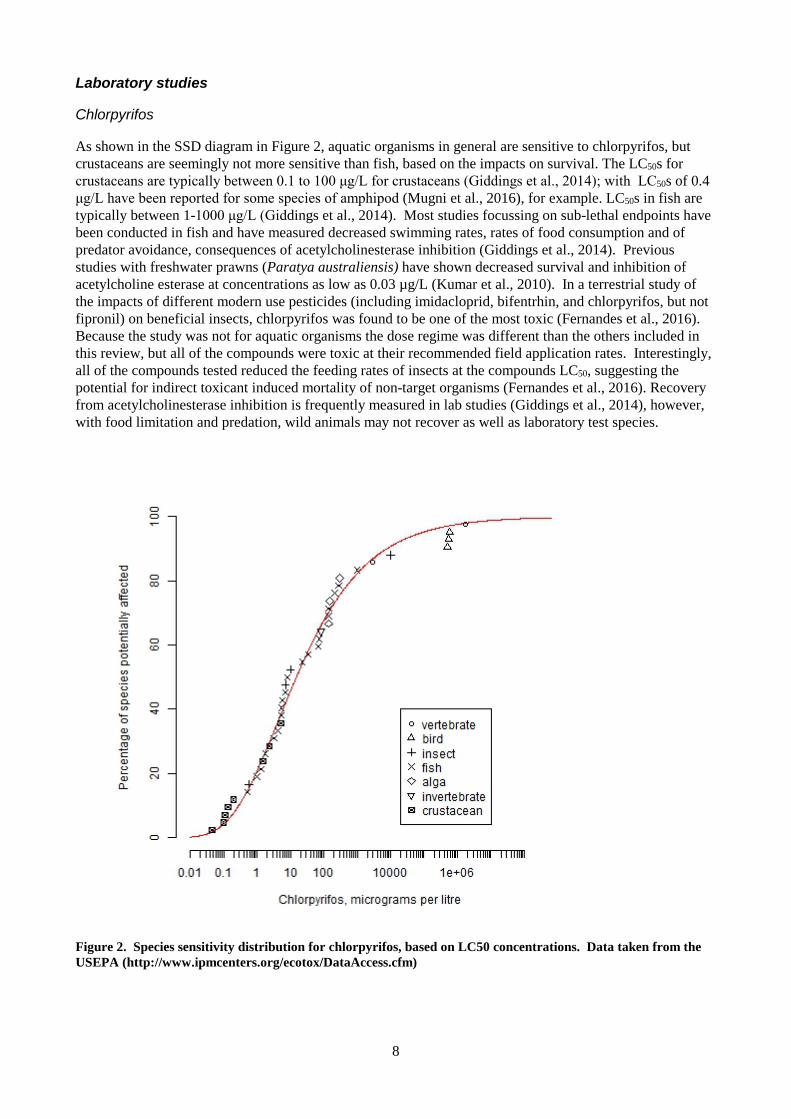
As shown in the SSD diagram in Figure 2, aquatic organisms in general are sensitive to chlorpyrifos, but crustaceans are seemingly not more sensitive than fish, based on the impacts on survival. The LC50s for crustaceans are typically between 0.1 to 100 μg/L for crustaceans (Giddings et al., 2014); with LC50s of 0.4 μg/L have been reported for some species of amphipod (Mugni et al., 2016), for example. LC50s in fish are typically between 1-1000 μg/L (Giddings et al., 2014). Most studies focussing on sub-lethal endpoints have been conducted in fish and have measured decreased swimming rates, rates of food consumption and of predator avoidance, consequences of acetylcholinesterase inhibition (Giddings et al., 2014). Previous studies with freshwater prawns (Paratya australiensis) have shown decreased survival and inhibition of acetylcholine esterase at concentrations as low as 0.03 µg/L (Kumar et al., 2010). In a terrestrial study of the impacts of different modern use pesticides (including imidacloprid, bifentrhin, and chlorpyrifos, but not fipronil) on beneficial insects, chlorpyrifos was found to be one of the most toxic (Fernandes et al., 2016). Because the study was not for aquatic organisms the dose regime was different than the others included in this review, but all of the compounds were toxic at their recommended field application rates. Interestingly, all of the compounds tested reduced the feeding rates of insects at the compounds LC50, suggesting the potential for indirect toxicant induced mortality of non-target organisms (Fernandes et al., 2016). Recovery from acetylcholinesterase inhibition is frequently measured in lab studies (Giddings et al., 2014), however, with food limitation and predation, wild animals may not recover as well as laboratory test species.
Figure 2. Species sensitivity distribution for chlorpyrifos, based on LC50 concentrations. Data taken from the USEPA (http://www.ipmcenters.org/ecotox/DataAccess.cfm)
9
Bifenthrin
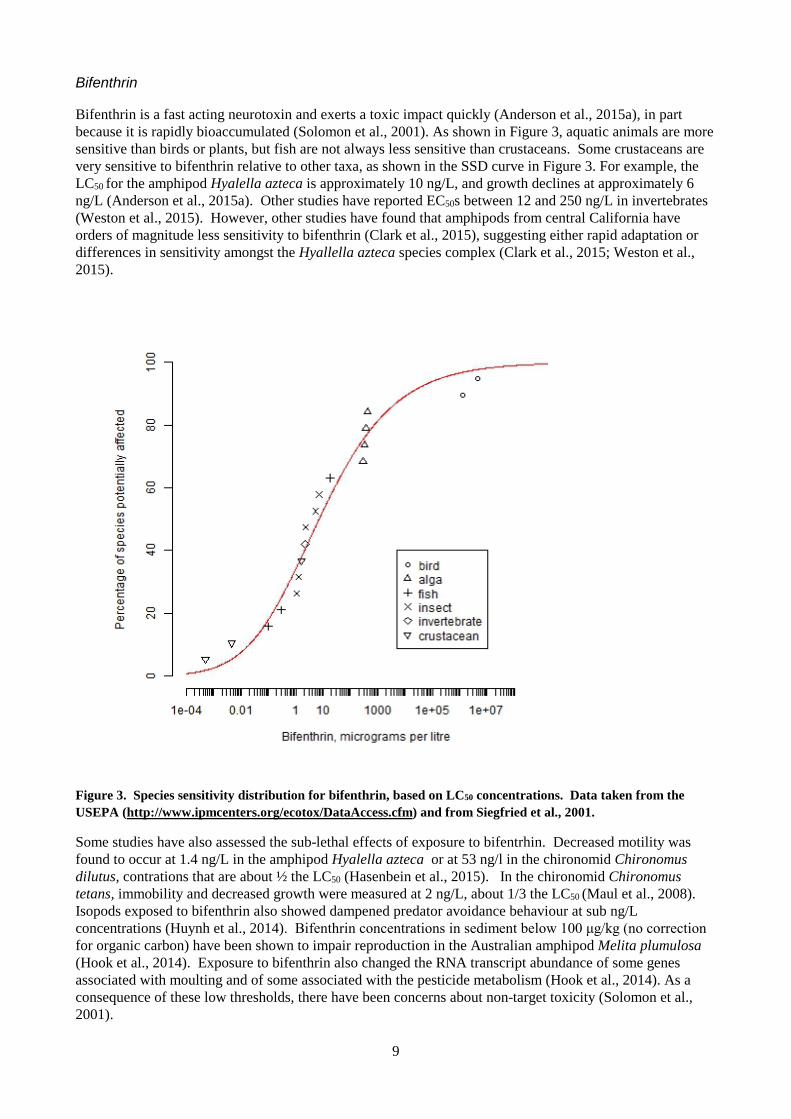
Bifenthrin is a fast acting neurotoxin and exerts a toxic impact quickly (Anderson et al., 2015a), in part because it is rapidly bioaccumulated (Solomon et al., 2001). As shown in Figure 3, aquatic animals are more sensitive than birds or plants, but fish are not always less sensitive than crustaceans. Some crustaceans are very sensitive to bifenthrin relative to other taxa, as shown in the SSD curve in Figure 3. For example, the LC50 for the amphipod Hyalella azteca is approximately 10 ng/L, and growth declines at approximately 6 ng/L (Anderson et al., 2015a). Other studies have reported EC50s between 12 and 250 ng/L in invertebrates (Weston et al., 2015). However, other studies have found that amphipods from central California have orders of magnitude less sensitivity to bifenthrin (Clark et al., 2015), suggesting either rapid adaptation or differences in sensitivity amongst the Hyallella azteca species complex (Clark et al., 2015; Weston et al., 2015).
Figure 3. Species sensitivity distribution for bifenthrin, based on LC50 concentrations. Data taken from the USEPA (http://www.ipmcenters.org/ecotox/DataAccess.cfm) and from Siegfried et al., 2001.
Some studies have also assessed the sub-lethal effects of exposure to bifentrhin. Decreased motility was found to occur at 1.4 ng/L in the amphipod Hyalella azteca or at 53 ng/l in the chironomid Chironomus dilutus, contrations that are about ½ the LC50 (Hasenbein et al., 2015). In the chironomid Chironomus tetans, immobility and decreased growth were measured at 2 ng/L, about 1/3 the LC50 (Maul et al., 2008). Isopods exposed to bifenthrin also showed dampened predator avoidance behaviour at sub ng/L concentrations (Huynh et al., 2014). Bifenthrin concentrations in sediment below 100 μg/kg (no correction for organic carbon) have been shown to impair reproduction in the Australian amphipod Melita plumulosa (Hook et al., 2014). Exposure to bifenthrin also changed the RNA transcript abundance of some genes associated with moulting and of some associated with the pesticide metabolism (Hook et al., 2014). As a consequence of these low thresholds, there have been concerns about non-target toxicity (Solomon et al., 2001).
10
Fipronil
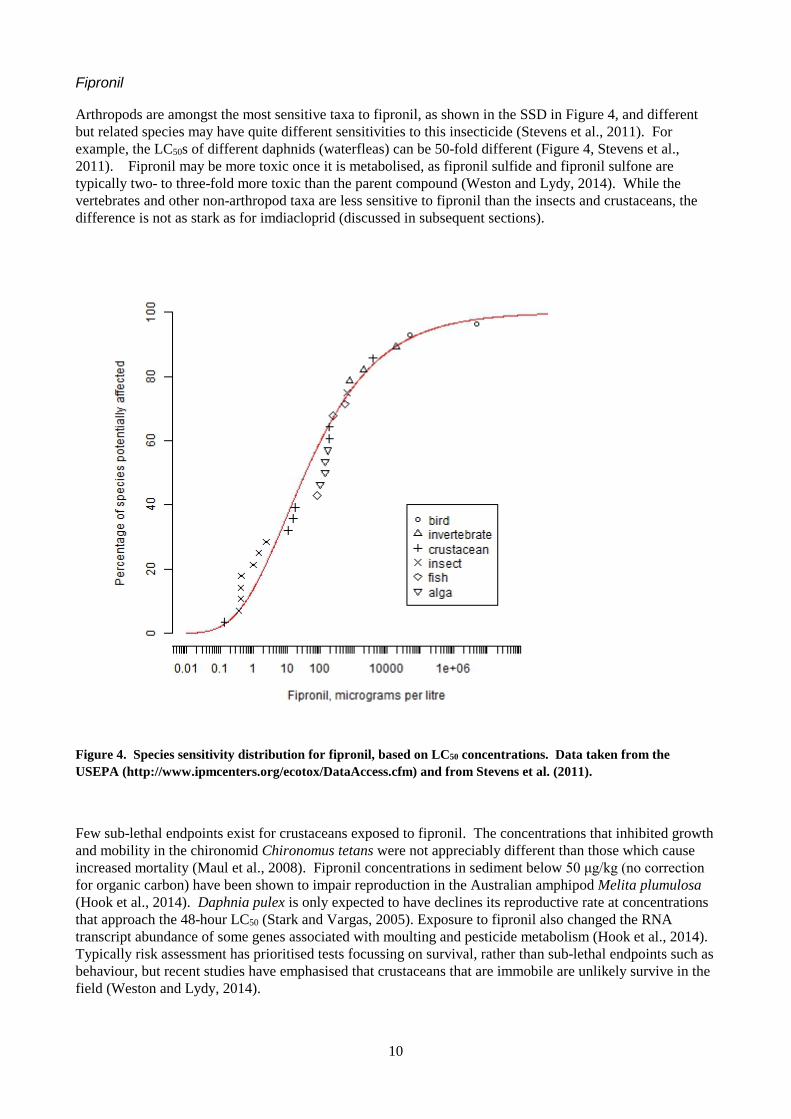
Arthropods are amongst the most sensitive taxa to fipronil, as shown in the SSD in Figure 4, and different but related species may have quite different sensitivities to this insecticide (Stevens et al., 2011). For example, the LC50s of different daphnids (waterfleas) can be 50-fold different (Figure 4, Stevens et al., 2011). Fipronil may be more toxic once it is metabolised, as fipronil sulfide and fipronil sulfone are typically two- to three-fold more toxic than the parent compound (Weston and Lydy, 2014). While the vertebrates and other non-arthropod taxa are less sensitive to fipronil than the insects and crustaceans, the difference is not as stark as for imdiacloprid (discussed in subsequent sections).
Figure 4. Species sensitivity distribution for fipronil, based on LC50 concentrations. Data taken from the USEPA (http://www.ipmcenters.org/ecotox/DataAccess.cfm) and from Stevens et al. (2011).
Few sub-lethal endpoints exist for crustaceans exposed to fipronil. The concentrations that inhibited growth and mobility in the chironomid Chironomus tetans were not appreciably different than those which cause increased mortality (Maul et al., 2008). Fipronil concentrations in sediment below 50 μg/kg (no correction for organic carbon) have been shown to impair reproduction in the Australian amphipod Melita plumulosa (Hook et al., 2014). Daphnia pulex is only expected to have declines its reproductive rate at concentrations that approach the 48-hour LC50 (Stark and Vargas, 2005). Exposure to fipronil also changed the RNA transcript abundance of some genes associated with moulting and pesticide metabolism (Hook et al., 2014). Typically risk assessment has prioritised tests focussing on survival, rather than sub-lethal endpoints such as behaviour, but recent studies have emphasised that crustaceans that are immobile are unlikely survive in the field (Weston and Lydy, 2014).
11
Imidacloprid
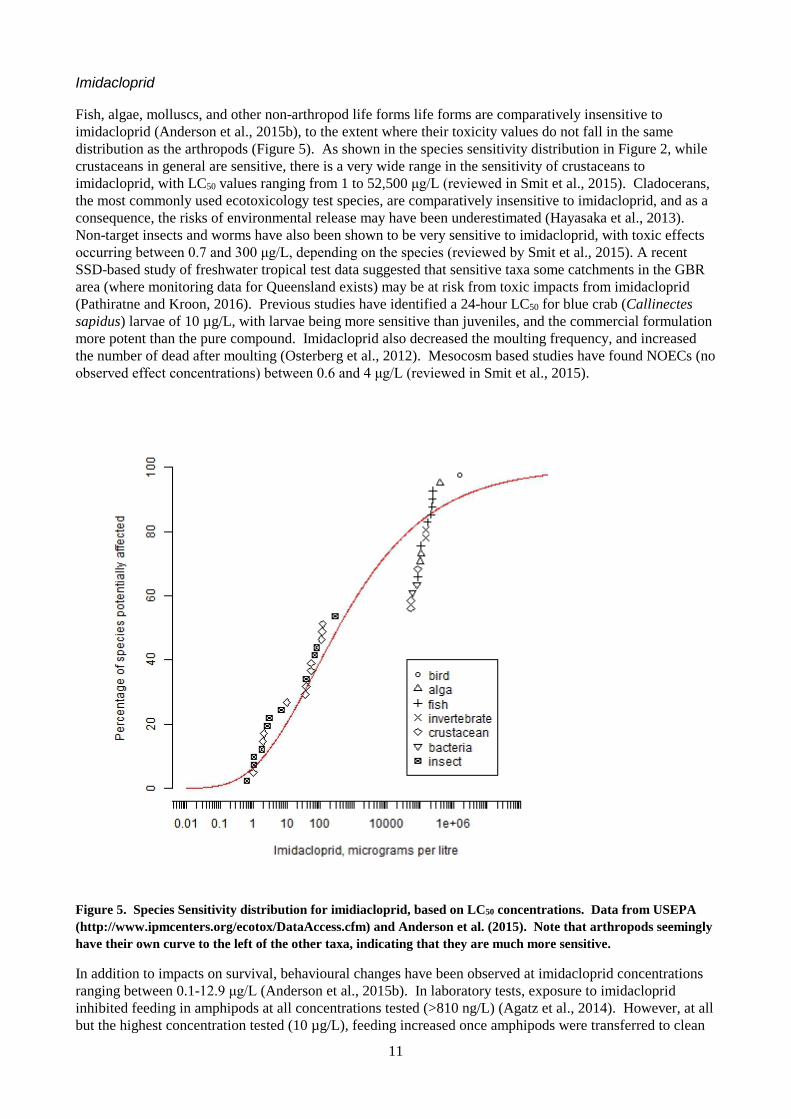
Fish, algae, molluscs, and other non-arthropod life forms life forms are comparatively insensitive to imidacloprid (Anderson et al., 2015b), to the extent where their toxicity values do not fall in the same distribution as the arthropods (Figure 5). As shown in the species sensitivity distribution in Figure 2, while crustaceans in general are sensitive, there is a very wide range in the sensitivity of crustaceans to imidacloprid, with LC50 values ranging from 1 to 52,500 μg/L (reviewed in Smit et al., 2015). Cladocerans, the most commonly used ecotoxicology test species, are comparatively insensitive to imidacloprid, and as a consequence, the risks of environmental release may have been underestimated (Hayasaka et al., 2013). Non-target insects and worms have also been shown to be very sensitive to imidacloprid, with toxic effects occurring between 0.7 and 300 μg/L, depending on the species (reviewed by Smit et al., 2015). A recent SSD-based study of freshwater tropical test data suggested that sensitive taxa some catchments in the GBR area (where monitoring data for Queensland exists) may be at risk from toxic impacts from imidacloprid (Pathiratne and Kroon, 2016). Previous studies have identified a 24-hour LC50 for blue crab (Callinectes sapidus) larvae of 10 µg/L, with larvae being more sensitive than juveniles, and the commercial formulation more potent than the pure compound. Imidacloprid also decreased the moulting frequency, and increased the number of dead after moulting (Osterberg et al., 2012). Mesocosm based studies have found NOECs (no observed effect concentrations) between 0.6 and 4 μg/L (reviewed in Smit et al., 2015).
Figure 5. Species Sensitivity distribution for imidiacloprid, based on LC50 concentrations. Data from USEPA (http://www.ipmcenters.org/ecotox/DataAccess.cfm) and Anderson et al. (2015). Note that arthropods seemingly have their own curve to the left of the other taxa, indicating that they are much more sensitive.
In addition to impacts on survival, behavioural changes have been observed at imidacloprid concentrations ranging between 0.1-12.9 μg/L (Anderson et al., 2015b). In laboratory tests, exposure to imidacloprid inhibited feeding in amphipods at all concentrations tested (>810 ng/L) (Agatz et al., 2014). However, at all but the highest concentration tested (10 µg/L), feeding increased once amphipods were transferred to clean
12
water. In another study, amphipods exposed pulsed and constant imidacloprid concentrations had reduced movement, including feeding, and ultimately reduced lipid content, leading to mortality (Nyman et al., 2013).
Imidacloprid is not thought to bioaccumulate (Smit et al., 2015). In a terrestrial food chain, imidacloprid taken up via trophic transfer has been shown to exert toxicity (Douglas et al., 2015). Slugs were shown to accumulate imidacloprid from their food, and to pass it on to beetle predator. The predatory beetles accumulated a lethal dose of imidacloprid. Field-collected slugs contained enough imidacloprid to be toxic to their predators (Douglas et al., 2015).
Australia currently has no water quality guidelines for imidacloprid (Pathiratne and Kroon, 2016). Different water quality criteria have been set in different places around the world. In the US, the water quality criteria was 1.05 μg/L, which exceeds the LC50 for the most sensitive species (Smit et al., 2015). In Canada, the guideline value is 0.23 μg/L (Anderson et al., 2015). In Europe, the guideline values are approximately 10 ng/L, which are frequently exceeded. A continuous exposure standard of 8 ng/L, and a “pulse” exposure standard of 200 ng/L was recommended (Smit et al., 2015).
Mixtures
Since these compounds have similar modes of toxic action, these compounds may interact and cause greater than predicted effects. In addition, the insecticides discussed above are not used in isolation, rather they are used in combination with other pesticides (including herbicides, fungicides, and insecticides such as methoprene that have different modes of toxic action). Furthermore, in vitro studies have identified interactions between the nicotinic acetylcholine receptor (the target for neonicotinid insecticides) and acetyl cholinesterase (the target for organophosphate receptors), suggesting that these compounds may exert a greater than additive toxicity (Shao et al., 2013). As highlighted in the literature studies below, when crustaceans are exposed to these compounds in concert, impacts can be surprisingly greater than expected.
Other types of pesticides may also change the sensitivity of crustaceans to insecticides. Ergosterol biosynthesis-inhibiting fungicides increased the toxicity of α-cypermethrin (a different neonicotinid pesticide) to the water flea Daphnia magna as much as twelve fold, even though Daphnia were much more sensitive to α-cypermethrin than to the fungicides (Norgaard and Cedergreen, 2010). The imidazole fungicide prochloraz in particular increased the potency of α-cypermethrin. It is not certain whether the toxicity increased because of increased bioavailability or a result of the inhibition of the enzymes that normally metabolise pesticides (Norgaard and Cedergreen, 2010). In bees, potential for synergistic toxicity from mixtures of neonicotinid and pyrethroid pesticides with ergosterol inhibiting fungicides has been noted (Sanchez-Bayo and Goka, 2014). Herbicides may also alter the sensitivity of crustaceans to insecticides. For example, even though grass shrimp embryos are comparatively insensitive to atrazine, exposure to simultaneous exposure to atrazine, imidacloprid and fipronil was more toxic than exposure to imidacloprid and fipronil alone (Key et al., 1997).
Other compounds are deliberately put into pesticide formulation to increase their efficacy, and these may increase their environmental risk as well. Surfactants such as alkylphenol ethoxylates are commonly co-applied with herbicides and other pesticides to increase their uptake by the weeds being targeted (Xie et al., 2005; Kroon et al., 2015). Their presence could also increase the bioavailability of the insecticides being studied. Piperonyl butoxide (PBO) inhibits the mixed function oxidases that animals normally use to metabolise pesticides, and as a consequence, are used to increase the effectiveness of mosquito control (Hunt et al., 2016). Although PBO alone has low toxicity to aquatic organisms, it can increase the toxicity of pyrethroid compounds (Hunt et al., 2016). However, PBO decreases the toxicity of organophosphate compounds.
Field-based studies
Microcosm and mesocosm experiments with chlorpyrifos concentrations as high as 0.1 μg/L did not show impacts on communities, although concentrations higher than this did cause declines in the abundance of fish (Giddings et al., 2014). Crustaceans were often the most sensitive organism in these studies, and it was occasionally noted that the loss of crustacean grazers led to algal blooms (Giddings et al., 2014).
13
Toxicity studies in pesticide-contaminated areas of the US have noted declines in crustaceans associated with bifentrhin and fipronil. A study in a tidal wetland in San Francisco, CA, USA, compared the toxicity (as paralysis) of winter storm water runoff to the amphipod Hyallela azteca and the freshwater midge Chironnmus dilutus (Weston et al., 2015). They found toxicity via immobility, though not lethality, in stormwater from urbanised that could be attributed to fipronil and bifenthrin. Agricultural runoff was not toxic, though this study was conducted outside of the growing season (Weston et al., 2015). A separate study of agricultural areas in central California (USA) found toxicity associated with field collected water and sediment samples, associated with chlorpyrifos, pyrethroid pesticides (including bifenthrin), or a mixture of the two in sediments and with chlorpyrifos and diazanon in water sediments (Anderson et al., 2014). They also found decreases in field populations of macroinvertebrates (Anderson et al., 2014).
Other California, USA, studies have found toxicity related to pyrethroid pesticides, primarily bifenthrin, in urban creeks (Holmes et al., 2008; Phillips et al., 2010). The initial study compared the pesticide concentrations in the sediment to mortality of the amphipod Hyalella atzeca. They found widespread toxicity, most acutely in heavily urbanised areas, and only bifentrin was present in sufficient quantities to explain the toxicity (Holmes et al., 2008). Chlorpyrifos was also measured in this study, and was thought to potentially contribute to the toxicity observed (Holmes et al., 2008). They also referred to other work documenting the loss of macroinvertebrates in the areas from which their sediments were collected (Holmes et al., 2008). Another study using field-collected sediments in California, USA, used a Toxicity Indentification Evaluation (TIE) approach to identify the causative agents of toxicity to the amphipod Hyalella atzeca. It identified bifenthrin as the most likely cause of the toxic responses, as the concentrations from sediments in the sediments studied ranges from 0.79-7.65 μg/g organic carbon, whereas the LC50 was 0.52 μg/g organic carbon (Phillips et al., 2010). Other pyrethroid pesticides, such as cyfluthrin and cypermethrin, may have also contributed to the toxicity observed (Phillips et al., 2010).
Another study examining the impact of bifenthrin concentrations following rainfall events in the Sacramento River, USA on endangered steelhead salmon found no impact, as measure either through traditional or molecular methods, on the fish themselves (Weston et al., 2015). However, the concentrations measured (as high as 15 ng/L) were sufficient to cause mortality in the caddisfly larvae that the salmon prey upon, suggesting the possibility of indirect effects (Weston et al., 2015). Similar studies in the Pacific Northwest of the US did not find as great an impact (Weston et al., 2011). One third of all sediment samples collected in this study had detectable pyrethroids, and toxicity was measured with only two of them. However, the authors argued that the low temperatures that occur in this region could increase the potency of bifenthrin (Weston et al., 2011).
Some studies have also measured problems in field sites with imidacloprid. In streams in the Netherlands contaminated with imidacloprid, there was a significant decrease in the densities of macrofaunal invertebrates. These declines start at concentrations as low as 37-64 ng/L (Van Dijk et al., 2013). In rice paddies, changes in community structure are observed at imidacloprid concentrations greater than 1 μg/L (Anderson et al., 2015).
We have implemented the current study to address the uncertainty around both the concentrations of insecticides measured in Queensland and the sensitivity of prawn larvae (Penaeus monodon) to these insecticides. Lethal and sublethal responses of prawns to chlorpyrifos, bifenthrin, fipronil and imidacloprid will be determined, and the concentrations of a suite of compounds, including these insecticides, in the intake water collected at prawn farms will be measured. If the concentrations measured approach 1/10 th the EC50, the larvae would be considered “at risk” and subsequent studies of mixtures and cumulative stressors may be warranted.

14
Objectives 1. Perform a desktop study of the potential impacts of modern use insecticides on the rearing of larval
prawns.
2. Determine whether environmentally relevant concentrations of pesticide (imidacloprid, bifenthrin, fipronil, and chlorpyrifos) affect the survival and feeding behaviour of prawn larvae.
3. Analyse the intake waters from selected farms for the concentrations of pesticides, including the selected insecticides, to determine whether the concentrations approach those that could be harmful.
15
Method
Toxicity Assessments
Prawns
Post larval stage black tiger prawns Penaeus monodon (PL-10’s, approximately 20 days post hatch and 10 days post metamorphosis from the mysis stage) were obtained from cultures from ongoing breeding trials as part of ongoing work conducted as part of the ARC Research Hub for Advanced Prawn Breeding (Bribie Island, Queensland). Prawns were maintained on commercial feed and live artemia, and fed every three hours between 7 am and 8 pm. The water quality recorded during experiments is provided in Table 4.
Table 4. Range of water quality parameters measured in our experimental set up
Parameter Range
Temperature 28.4-32.3°C
Dissolved oxygen (% saturation) 84.5-95%
Dissolved oxygen (mg/L) 5.27 - 5.89 mg/L
Salinity 38.2 - 39.7 ppt
pH 8.03-8.19
Exposure Solutions
Pure compounds of each pesticide were ordered from Sigma Aldrich. Stock pesticide concentrations were made by dissolving the entire amount provided by the manufacturer into methanol. To create exposure solutions with the appropriate insecticide concentration, the stock solution was added to the glass jar and the methanol was evaporated off under a fume hood. Filtered sea water was added to each jar The range finder experiments were conducted using nominal concentrations only. Jars were lightly aerated using Teflon tubing, and exposures were carried out under red lights to minimise stress to the prawn post larvae, which are normally benthic and not accustomed to ambient light.
Range finder experiments
To determine the pesticide concentration range over which post-larval prawns are sensitive, a quick survival experiment that bracketed the range of sensitivities reported for other crustaceans was performed. Three replicates of ten prawns each were distributed into log step 10 concentrations for each of the selected insecticides. After 24 hours, the number of PL’s surviving was counted.
Daily renewal tests
The first series of experiments used daily renewal of solutions in an attempt to keep exposure concentrations constant. Ten post larval prawns were added to one of five replicate flasks for each insecticide
16
concentration. After 24 hours, surviving prawns were counted transferred to a new test solution. “Used” solutions were filtered for chemical analysis.
Static exposure tests
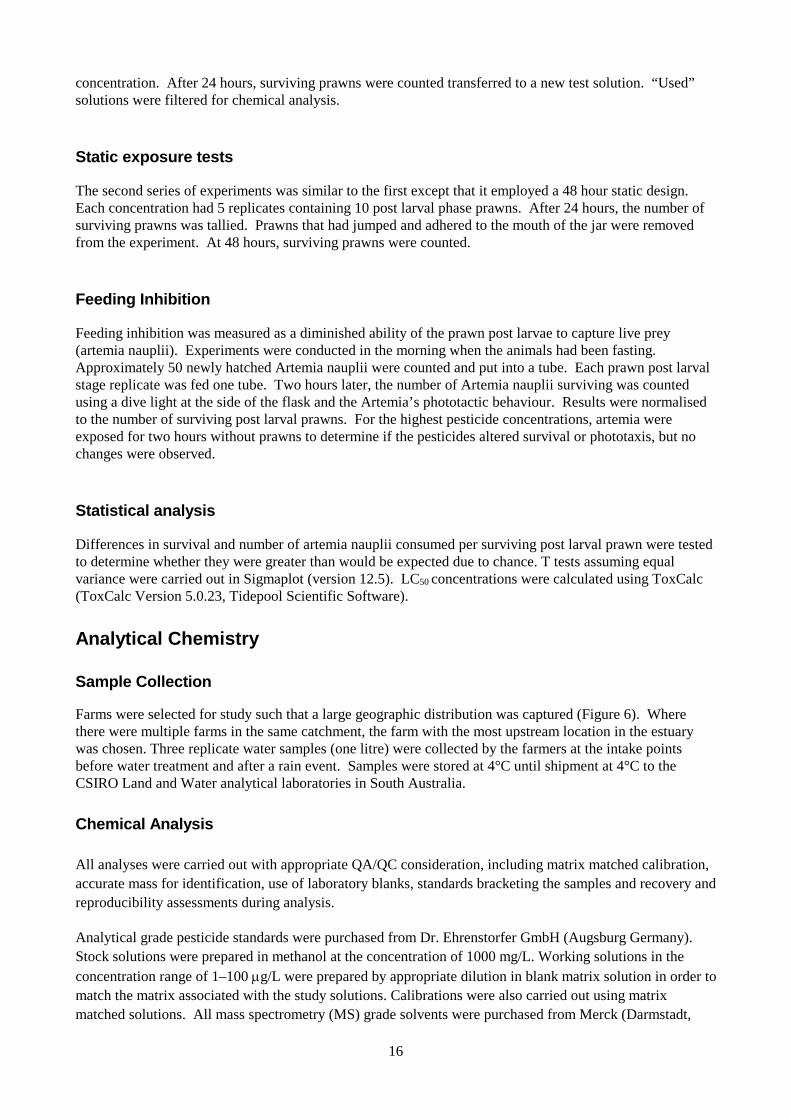
The second series of experiments was similar to the first except that it employed a 48 hour static design. Each concentration had 5 replicates containing 10 post larval phase prawns. After 24 hours, the number of surviving prawns was tallied. Prawns that had jumped and adhered to the mouth of the jar were removed from the experiment. At 48 hours, surviving prawns were counted.
Feeding Inhibition
Feeding inhibition was measured as a diminished ability of the prawn post larvae to capture live prey (artemia nauplii). Experiments were conducted in the morning when the animals had been fasting. Approximately 50 newly hatched Artemia nauplii were counted and put into a tube. Each prawn post larval stage replicate was fed one tube. Two hours later, the number of Artemia nauplii surviving was counted using a dive light at the side of the flask and the Artemia’s phototactic behaviour. Results were normalised to the number of surviving post larval prawns. For the highest pesticide concentrations, artemia were exposed for two hours without prawns to determine if the pesticides altered survival or phototaxis, but no changes were observed.
Statistical analysis
Differences in survival and number of artemia nauplii consumed per surviving post larval prawn were tested to determine whether they were greater than would be expected due to chance. T tests assuming equal variance were carried out in Sigmaplot (version 12.5). LC50 concentrations were calculated using ToxCalc (ToxCalc Version 5.0.23, Tidepool Scientific Software).
Analytical Chemistry
Sample Collection
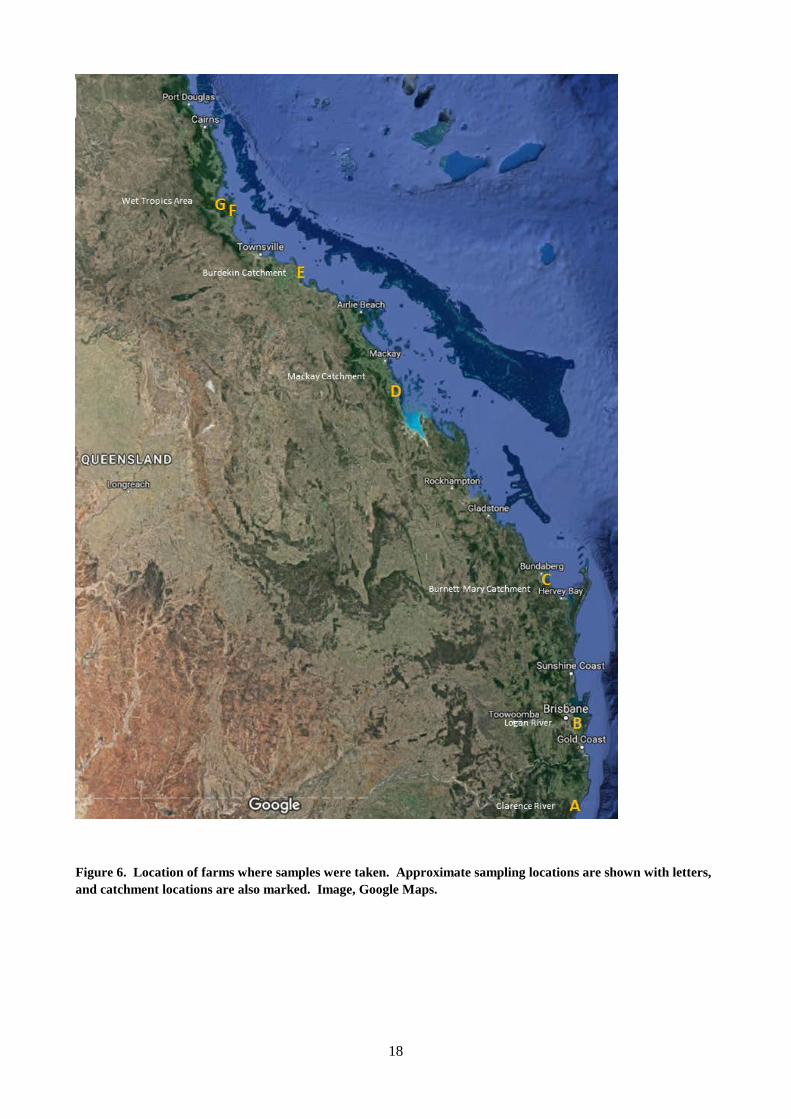
Farms were selected for study such that a large geographic distribution was captured (Figure 6). Where there were multiple farms in the same catchment, the farm with the most upstream location in the estuary was chosen. Three replicate water samples (one litre) were collected by the farmers at the intake points before water treatment and after a rain event. Samples were stored at 4°C until shipment at 4°C to the CSIRO Land and Water analytical laboratories in South Australia.
Chemical Analysis
All analyses were carried out with appropriate QA/QC consideration, including matrix matched calibration, accurate mass for identification, use of laboratory blanks, standards bracketing the samples and recovery and reproducibility assessments during analysis.
Analytical grade pesticide standards were purchased from Dr. Ehrenstorfer GmbH (Augsburg Germany). Stock solutions were prepared in methanol at the concentration of 1000 mg/L. Working solutions in the concentration range of 1–100 µg/L were prepared by appropriate dilution in blank matrix solution in order to match the matrix associated with the study solutions. Calibrations were also carried out using matrix matched solutions. All mass spectrometry (MS) grade solvents were purchased from Merck (Darmstadt,
17
Germany). The water used to prepare the solutions or mobile phase was purified in a Milli-Q-plus system (Millipore, Bedford, MA, USA).
Owing to low concentrations in the experimental and environmental samples, the water samples needed to be pre-concentrated using a standard solid phase extraction (SPE) procedure. For this purpose Meg Bond Elute Plexa (500mg 6ml, Agilent technologies, CA USA). SPE cartridges were used for sample clean-up and pre-concentration. Prior to loading the cartridges with seawater samples, SPE cartridges were conditioned with 3×2 mL of methanol, according to standard protocol. One litre of a seawater sample was passed through the SPE cartridge at a flow rate of 5 mL/minute. After loading the samples, the salts on the SPE cartridge were washed off with 50 mL of mill-Q water and then the cartridges were dried under vacuum. Following this the cartridges were eluted with three lots of 3 mL of methanol. The combined extracts were evaporated to dryness under a gentle stream of nitrogen and were reconstituted in 1 mL of methanol prior to use for residue analysis.
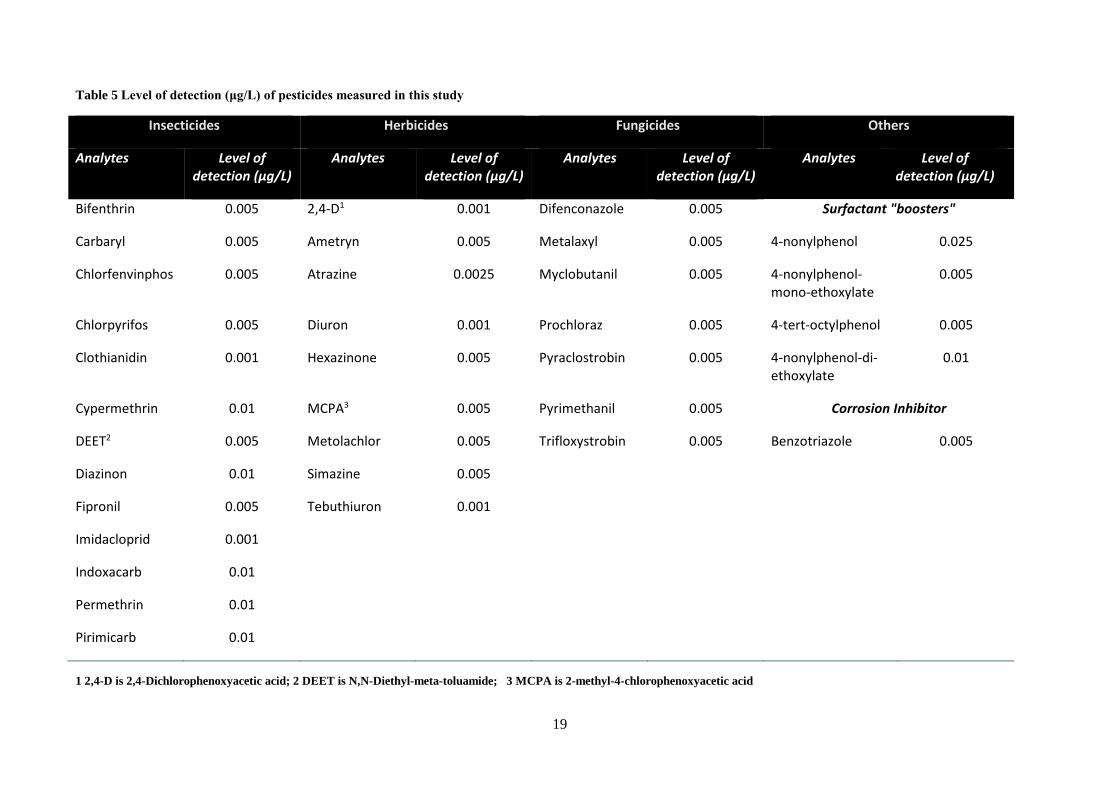
The residue analysis was carried out using a Liquid Chromatograph (LC) coupled with Triple Time of Flight mass spectrometry (LC - Triple TOF 5600, SCIEX, USA). Using gradient elution method, the two mobile phases used for separation of various pesticides were A) methanol and B) 10mM ammonium formate in 0.01% formic acid. The gradient elution scheme was chosen based on the chemistry of the molecule. An aliquot of 10 µL of MeOH extract was injected onto the LC column (Kinetex 2.6u C18 100*2.10mm, Phenomenex, USA). The total run time was 18 minutes. Accurate mass for each compound was used for identification and quantification. The concentrations were calculated using matrix-matched calibration curves using Analyst TF 1.7.1 software. Analytes included in the survey are shown in Table 5.
18
Figure 6. Location of farms where samples were taken. Approximate sampling locations are shown with letters, and catchment locations are also marked. Image, Google Maps.
19
Table 5 Level of detection (μg/L) of pesticides measured in this study
Insecticides Herbicides Fungicides Others
Analytes Level of detection (μg/L)
Analytes Level of detection (μg/L)
Analytes Level of detection (μg/L)
Analytes Level of detection (μg/L)
Bifenthrin 0.005 2,4-D1 0.001 Difenconazole 0.005 Surfactant "boosters"
Carbaryl 0.005 Ametryn 0.005 Metalaxyl 0.005 4-nonylphenol 0.025
Chlorfenvinphos 0.005 Atrazine 0.0025 Myclobutanil 0.005 4-nonylphenol-mono-ethoxylate
0.005
Chlorpyrifos 0.005 Diuron 0.001 Prochloraz 0.005 4-tert-octylphenol 0.005
Clothianidin 0.001 Hexazinone 0.005 Pyraclostrobin 0.005 4-nonylphenol-di-ethoxylate
0.01
Cypermethrin 0.01 MCPA3 0.005 Pyrimethanil 0.005 Corrosion Inhibitor
DEET2 0.005 Metolachlor 0.005 Trifloxystrobin 0.005 Benzotriazole 0.005
Diazinon 0.01 Simazine 0.005
Fipronil 0.005 Tebuthiuron 0.001
Imidacloprid 0.001
Indoxacarb 0.01
Permethrin 0.01
Pirimicarb 0.01
1 2,4-D is 2,4-Dichlorophenoxyacetic acid; 2 DEET is N,N-Diethyl-meta-toluamide; 3 MCPA is 2-methyl-4-chlorophenoxyacetic acid
20
Results and Discussion
Toxicity Assessments
Range Finder Results
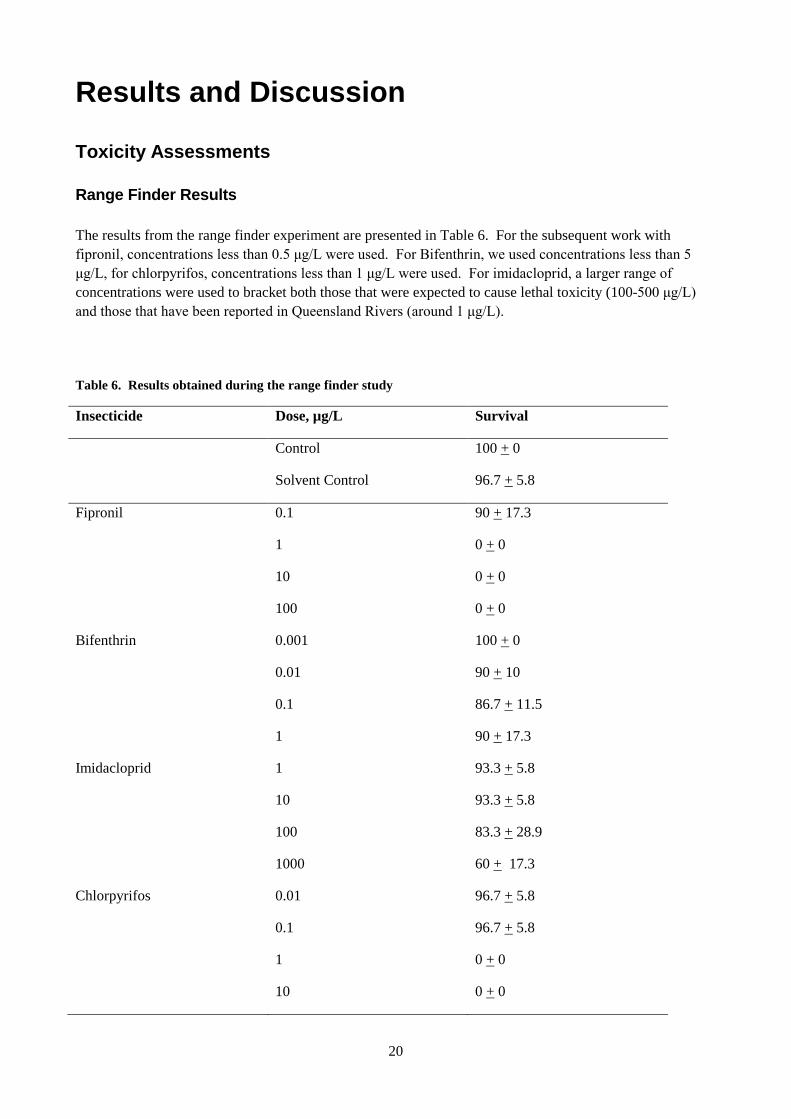
The results from the range finder experiment are presented in Table 6. For the subsequent work with fipronil, concentrations less than 0.5 μg/L were used. For Bifenthrin, we used concentrations less than 5 μg/L, for chlorpyrifos, concentrations less than 1 μg/L were used. For imidacloprid, a larger range of concentrations were used to bracket both those that were expected to cause lethal toxicity (100-500 μg/L) and those that have been reported in Queensland Rivers (around 1 μg/L).
Table 6. Results obtained during the range finder study
Insecticide Dose, µg/L Survival
Control 100 + 0
Solvent Control 96.7 + 5.8
Fipronil 0.1 90 + 17.3
1 0 + 0
10 0 + 0
100 0 + 0
Bifenthrin 0.001 100 + 0
0.01 90 + 10
0.1 86.7 + 11.5
1 90 + 17.3
Imidacloprid 1 93.3 + 5.8
10 93.3 + 5.8
100 83.3 + 28.9
1000 60 + 17.3
Chlorpyrifos 0.01 96.7 + 5.8
0.1 96.7 + 5.8
1 0 + 0
10 0 + 0
21
Fipronil
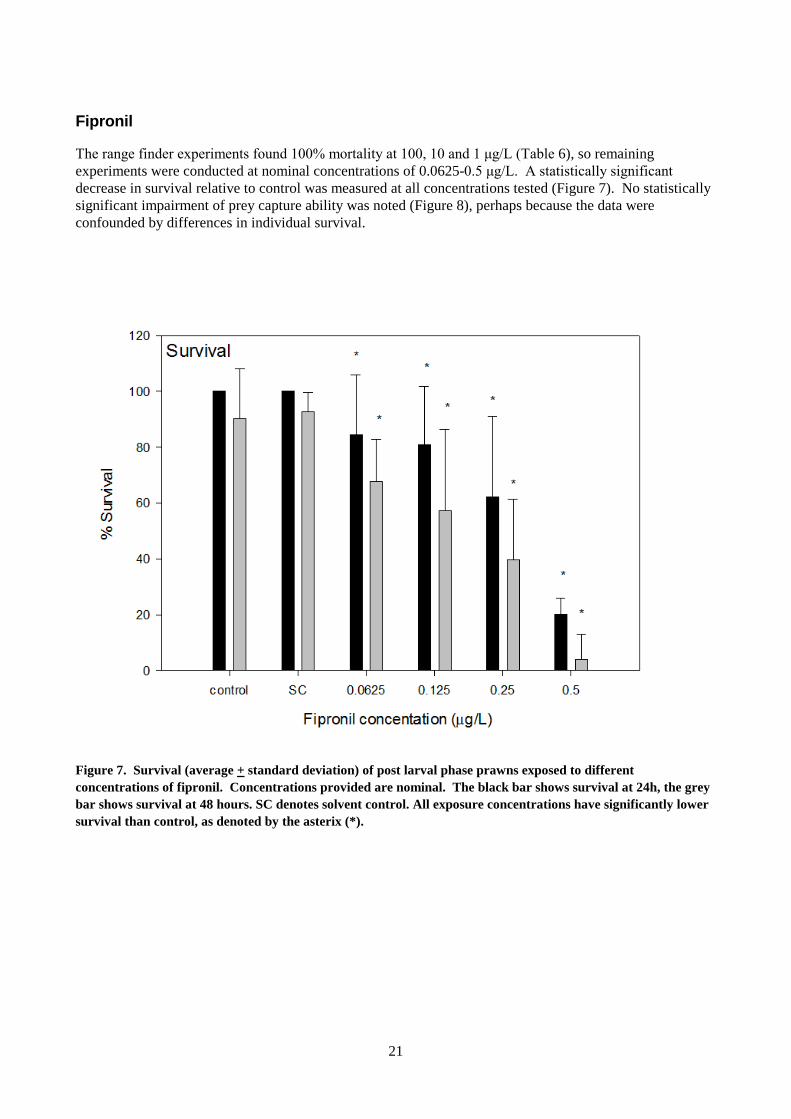
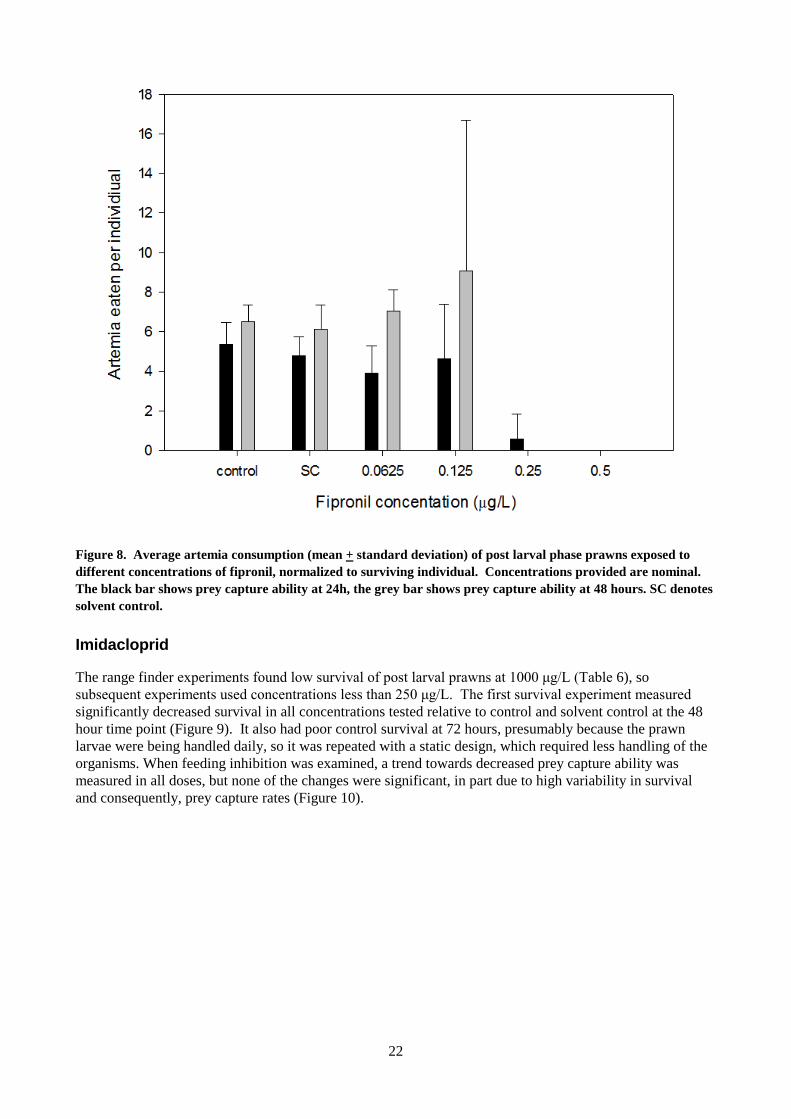
The range finder experiments found 100% mortality at 100, 10 and 1 μg/L (Table 6), so remaining experiments were conducted at nominal concentrations of 0.0625-0.5 μg/L. A statistically significant decrease in survival relative to control was measured at all concentrations tested (Figure 7). No statistically significant impairment of prey capture ability was noted (Figure 8), perhaps because the data were confounded by differences in individual survival.
Figure 7. Survival (average + standard deviation) of post larval phase prawns exposed to different concentrations of fipronil. Concentrations provided are nominal. The black bar shows survival at 24h, the grey bar shows survival at 48 hours. SC denotes solvent control. All exposure concentrations have significantly lower survival than control, as denoted by the asterix (*).
22
Figure 8. Average artemia consumption (mean + standard deviation) of post larval phase prawns exposed to different concentrations of fipronil, normalized to surviving individual. Concentrations provided are nominal. The black bar shows prey capture ability at 24h, the grey bar shows prey capture ability at 48 hours. SC denotes solvent control.
Imidacloprid
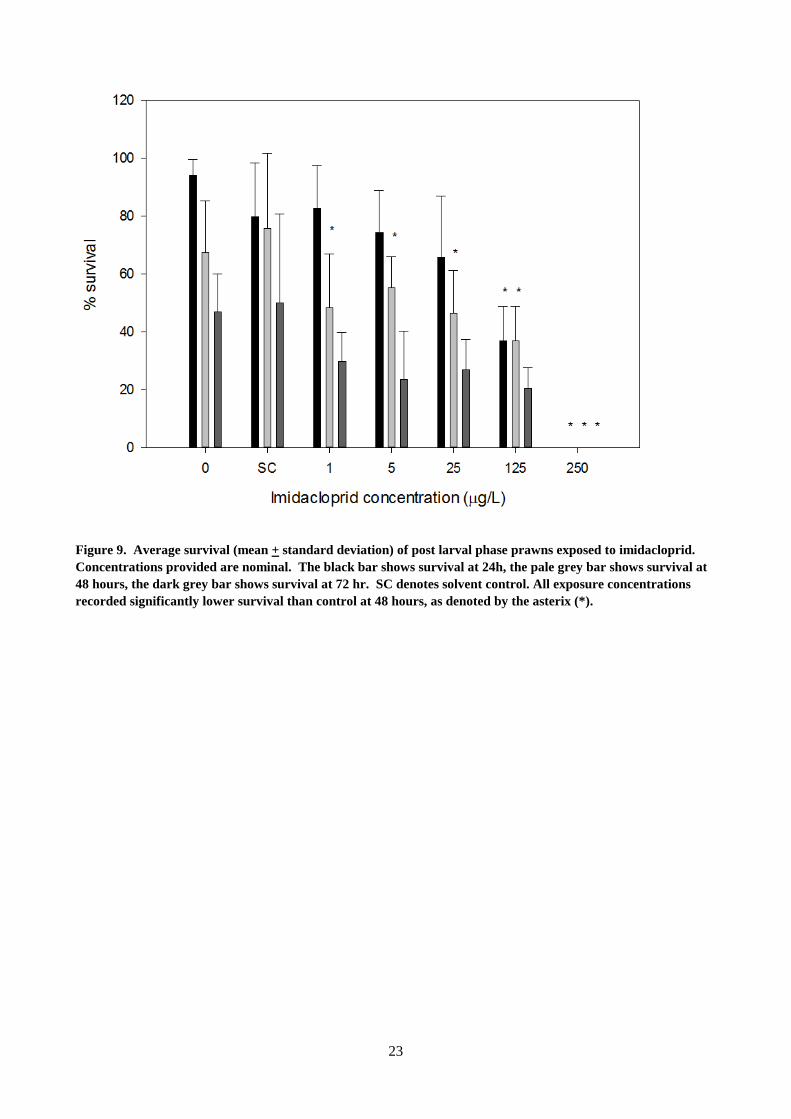
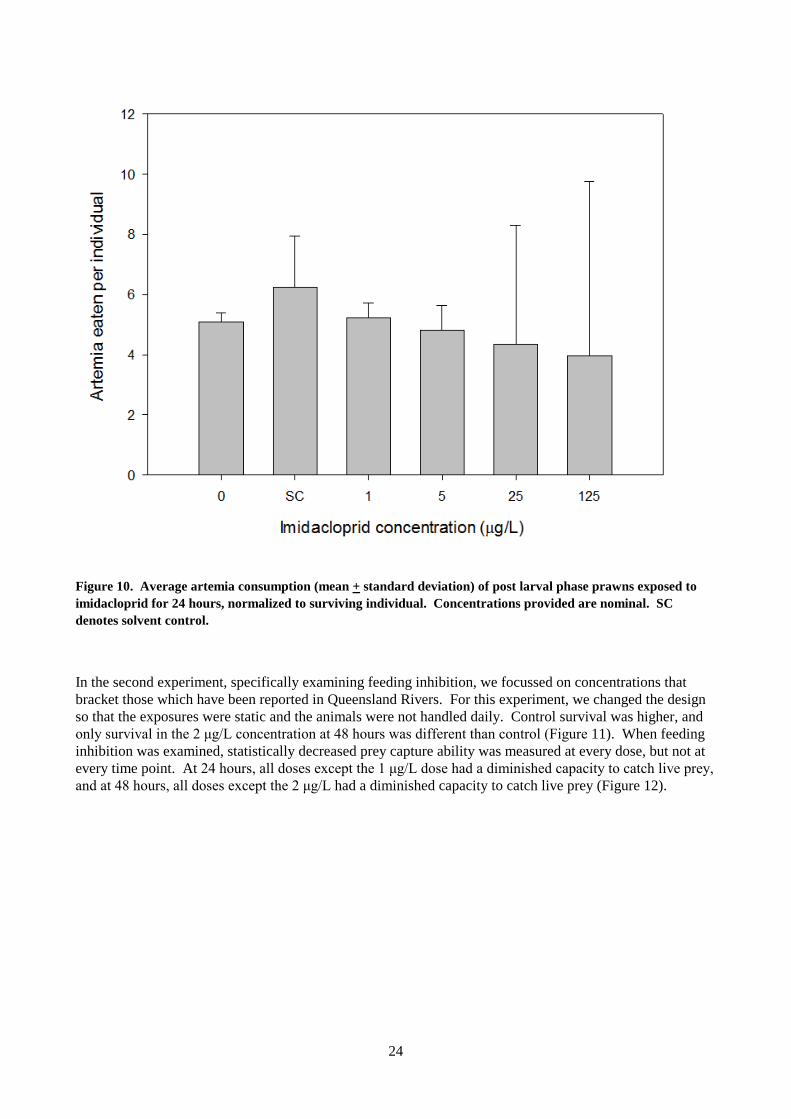
The range finder experiments found low survival of post larval prawns at 1000 μg/L (Table 6), so subsequent experiments used concentrations less than 250 μg/L. The first survival experiment measured significantly decreased survival in all concentrations tested relative to control and solvent control at the 48 hour time point (Figure 9). It also had poor control survival at 72 hours, presumably because the prawn larvae were being handled daily, so it was repeated with a static design, which required less handling of the organisms. When feeding inhibition was examined, a trend towards decreased prey capture ability was measured in all doses, but none of the changes were significant, in part due to high variability in survival and consequently, prey capture rates (Figure 10).
23
Figure 9. Average survival (mean + standard deviation) of post larval phase prawns exposed to imidacloprid. Concentrations provided are nominal. The black bar shows survival at 24h, the pale grey bar shows survival at 48 hours, the dark grey bar shows survival at 72 hr. SC denotes solvent control. All exposure concentrations recorded significantly lower survival than control at 48 hours, as denoted by the asterix (*).
24
Figure 10. Average artemia consumption (mean + standard deviation) of post larval phase prawns exposed to imidacloprid for 24 hours, normalized to surviving individual. Concentrations provided are nominal. SC denotes solvent control.
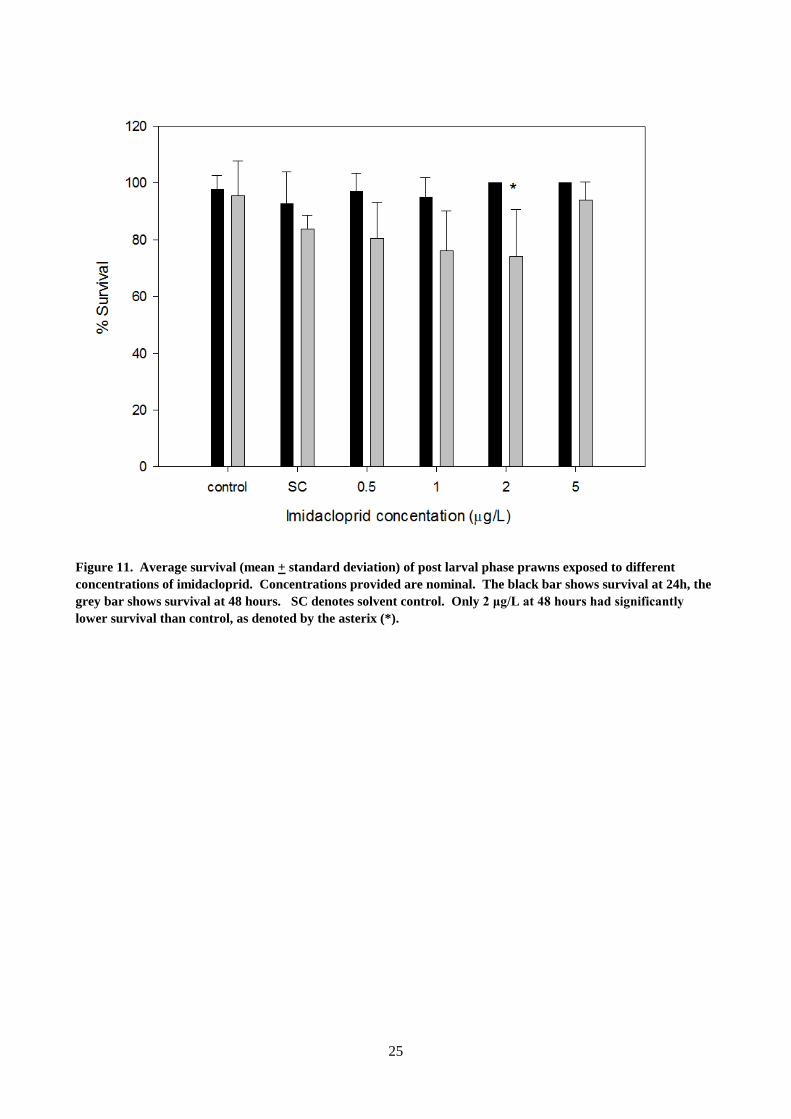
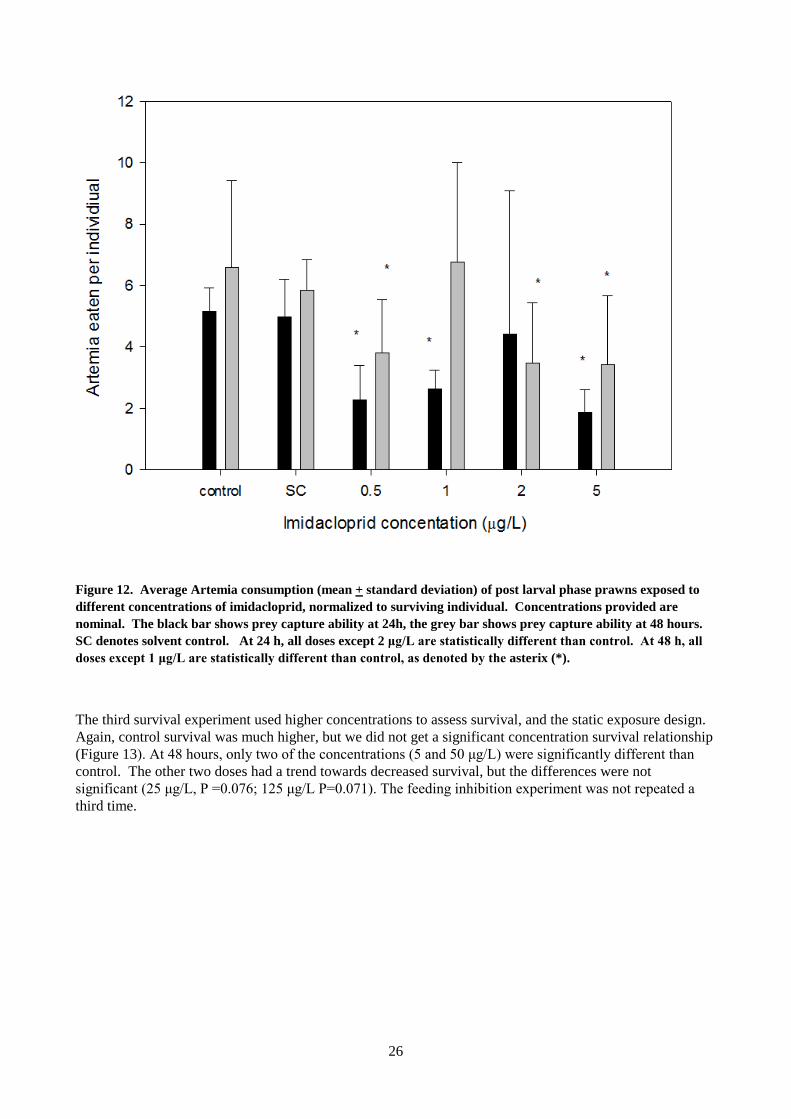
In the second experiment, specifically examining feeding inhibition, we focussed on concentrations that bracket those which have been reported in Queensland Rivers. For this experiment, we changed the design so that the exposures were static and the animals were not handled daily. Control survival was higher, and only survival in the 2 μg/L concentration at 48 hours was different than control (Figure 11). When feeding inhibition was examined, statistically decreased prey capture ability was measured at every dose, but not at every time point. At 24 hours, all doses except the 1 μg/L dose had a diminished capacity to catch live prey, and at 48 hours, all doses except the 2 μg/L had a diminished capacity to catch live prey (Figure 12).
25
Figure 11. Average survival (mean + standard deviation) of post larval phase prawns exposed to different concentrations of imidacloprid. Concentrations provided are nominal. The black bar shows survival at 24h, the grey bar shows survival at 48 hours. SC denotes solvent control. Only 2 μg/L at 48 hours had significantly lower survival than control, as denoted by the asterix (*).
26
Figure 12. Average Artemia consumption (mean + standard deviation) of post larval phase prawns exposed to different concentrations of imidacloprid, normalized to surviving individual. Concentrations provided are nominal. The black bar shows prey capture ability at 24h, the grey bar shows prey capture ability at 48 hours. SC denotes solvent control. At 24 h, all doses except 2 μg/L are statistically different than control. At 48 h, all doses except 1 μg/L are statistically different than control, as denoted by the asterix (*).
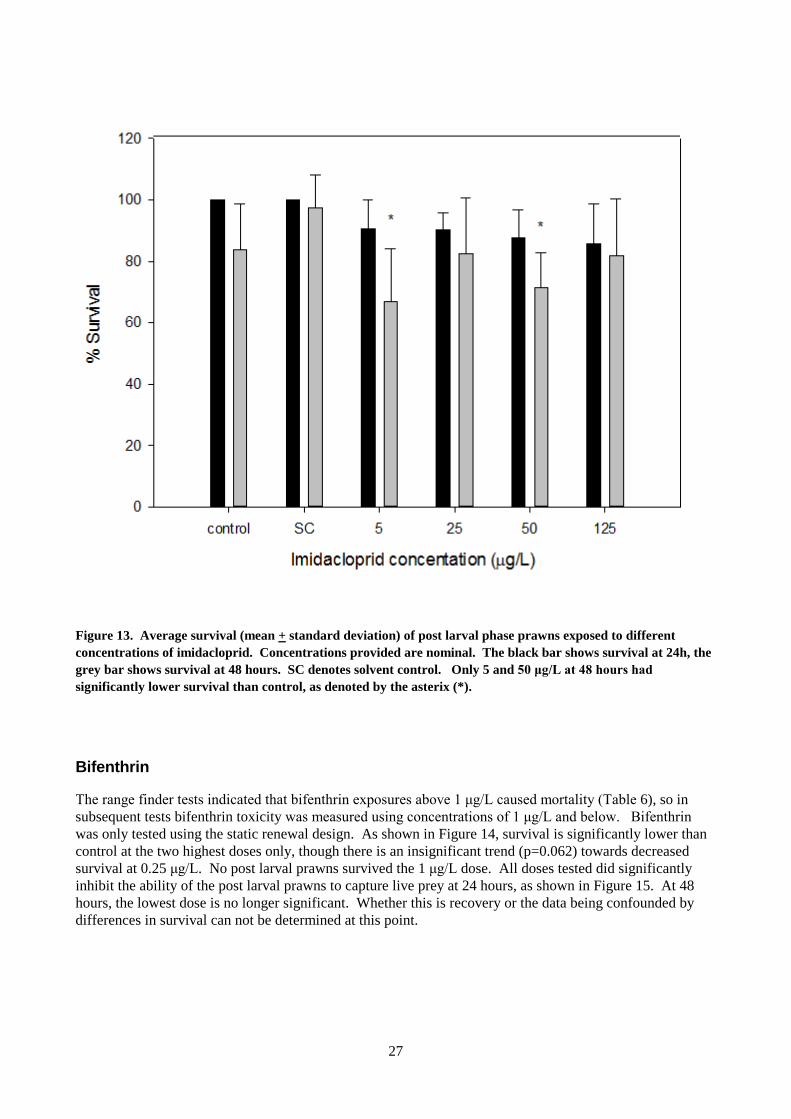
The third survival experiment used higher concentrations to assess survival, and the static exposure design. Again, control survival was much higher, but we did not get a significant concentration survival relationship (Figure 13). At 48 hours, only two of the concentrations (5 and 50 μg/L) were significantly different than control. The other two doses had a trend towards decreased survival, but the differences were not significant (25 μg/L, P =0.076; 125 μg/L P=0.071). The feeding inhibition experiment was not repeated a third time.
27
Figure 13. Average survival (mean + standard deviation) of post larval phase prawns exposed to different concentrations of imidacloprid. Concentrations provided are nominal. The black bar shows survival at 24h, the grey bar shows survival at 48 hours. SC denotes solvent control. Only 5 and 50 μg/L at 48 hours had significantly lower survival than control, as denoted by the asterix (*).
Bifenthrin
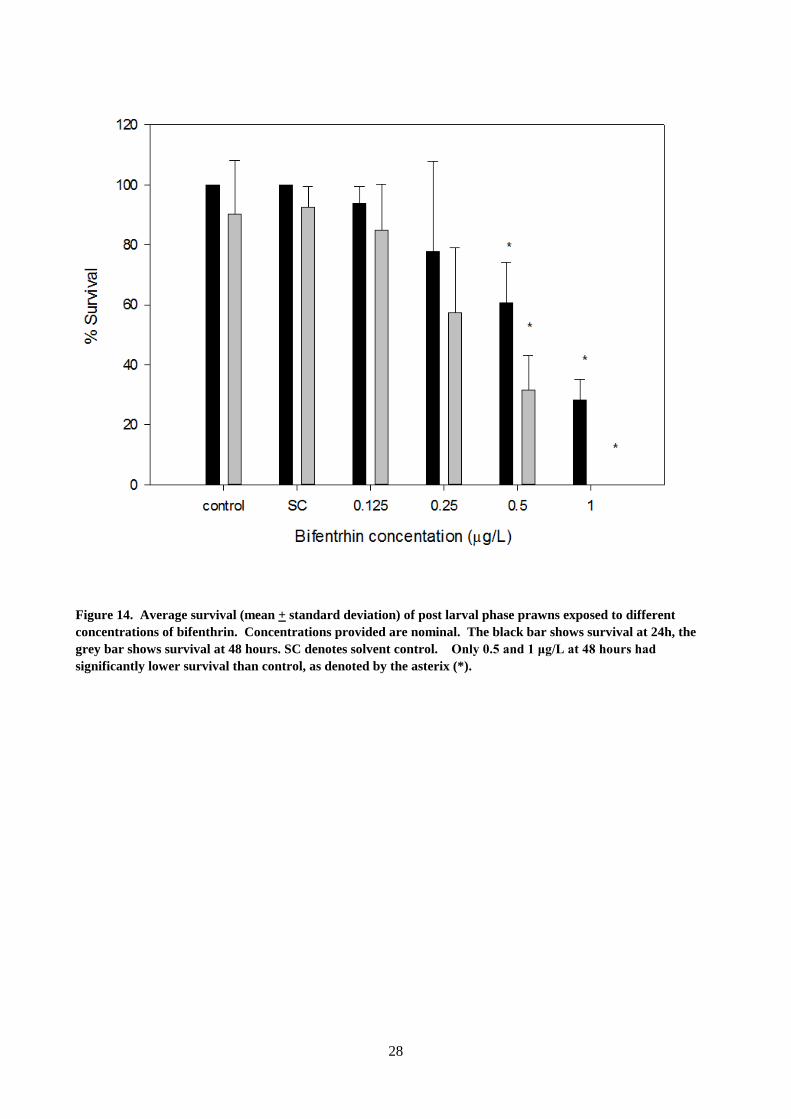
The range finder tests indicated that bifenthrin exposures above 1 μg/L caused mortality (Table 6), so in subsequent tests bifenthrin toxicity was measured using concentrations of 1 μg/L and below. Bifenthrin was only tested using the static renewal design. As shown in Figure 14, survival is significantly lower than control at the two highest doses only, though there is an insignificant trend (p=0.062) towards decreased survival at 0.25 μg/L. No post larval prawns survived the 1 μg/L dose. All doses tested did significantly inhibit the ability of the post larval prawns to capture live prey at 24 hours, as shown in Figure 15. At 48 hours, the lowest dose is no longer significant. Whether this is recovery or the data being confounded by differences in survival can not be determined at this point.
28
Figure 14. Average survival (mean + standard deviation) of post larval phase prawns exposed to different concentrations of bifenthrin. Concentrations provided are nominal. The black bar shows survival at 24h, the grey bar shows survival at 48 hours. SC denotes solvent control. Only 0.5 and 1 μg/L at 48 hours had significantly lower survival than control, as denoted by the asterix (*).
29
Figure 15. Average artemia consumption (mean + standard deviation) of post larval phase prawns exposed to differing concentrations of bifenthrin, normalized to surviving individual. Concentrations provided are nominal. The black bar shows prey capture ability at 24h, the grey bar shows prey capture ability at 48 hours. SC denotes solvent control. At 24 h, all doses are statistically different than control, as denoted by the asterix (*).
Chlorpyrifos
In the range finder experiments, no post larval prawns survived in concentrations greater than 1 μg/L (Table 6). Therefore, in subsequent testing, exposures focussed on concentrations of 0.5 μg/L and less. Chlorpyrifos toxicity was measured twice, first in daily renewal tests, then in static tests. As shown in Figure 16, survival was diminished in the 0.5 μg/L treatment after 48 and 72 hours. However, when the test was repeated, no change in survival was observed (data not shown), perhaps because the prawns used were day 15 instead of day 10. In addition, no feeding inhibition was measured in prawn post larvae exposed to Chlorpyrifos (data not shown).
30
Figure 16. Average survival (mean + standard deviation) of post larval phase prawns exposed to differeing concentrations of Chlorpyrifos. Concentrations provided are nominal. The black bar shows survival at 24h, the pale grey bar shows survival at 48 hours, the dark grey bar. 0.5 ug/L doses have diminished survival, relative to control, at 48 and 72 hours, as denoted by the asterix (*).
In this series of experiments, lethal toxicity was measured in post-larval prawns exposed to the four different insecticides. Feeding inhibition was measured in two of the four tested compounds. However, the experiments were constrained by the narrow window of opportunity to work with this life stage. Since post-larval prawns were available for a few weeks only, short exposures were necessary. As chlorpyrifos, in particular, is more toxic as it is metabolised, greater toxicity may have been found with longer exposures. Also, the animals were sensitive to handling, so the solutions could not be renewed. As a consequence, the toxicity of imidacloprid may have been underestimated. In addition, the animals sensitivity to being handled meant that it was not practical to isolate them to measure feeding inhibition, meaning that our measures may not have been as precise as would be desired. Nevertheless, these few experiments provide all the data that, to our knowledge, exist in the scientific literature on the sensitivity of post-larval prawns to modern insecticides and thus will be very helpful in their risk assessment.
Of the insecticides studied, fipronil had the greatest effects on post-larval prawns, as measured via survival (Table 7). Imidacloprid had the least impact on survival. However, both imidacloprid and bifenthrin inhibited feeding, which would impair survival if the exposure was prolonged.
31
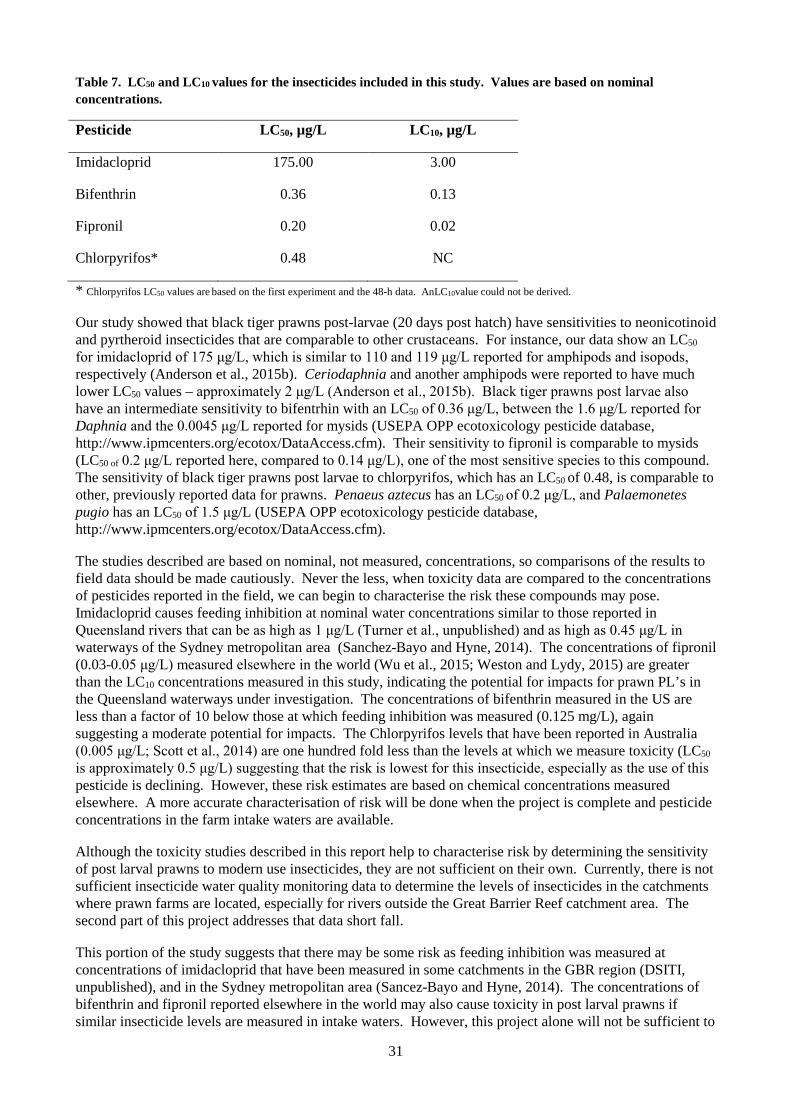
Table 7. LC50 and LC10 values for the insecticides included in this study. Values are based on nominal concentrations.
Pesticide LC50, µg/L LC10, µg/L
Imidacloprid 175.00 3.00
Bifenthrin 0.36 0.13
Fipronil 0.20 0.02
Chlorpyrifos* 0.48 NC
* Chlorpyrifos LC50 values are based on the first experiment and the 48-h data. AnLC10value could not be derived.
Our study showed that black tiger prawns post-larvae (20 days post hatch) have sensitivities to neonicotinoid and pyrtheroid insecticides that are comparable to other crustaceans. For instance, our data show an LC50 for imidacloprid of 175 μg/L, which is similar to 110 and 119 μg/L reported for amphipods and isopods, respectively (Anderson et al., 2015b). Ceriodaphnia and another amphipods were reported to have much lower LC50 values – approximately 2 μg/L (Anderson et al., 2015b). Black tiger prawns post larvae also have an intermediate sensitivity to bifentrhin with an LC50 of 0.36 μg/L, between the 1.6 μg/L reported for Daphnia and the 0.0045 μg/L reported for mysids (USEPA OPP ecotoxicology pesticide database, http://www.ipmcenters.org/ecotox/DataAccess.cfm). Their sensitivity to fipronil is comparable to mysids (LC50 of 0.2 μg/L reported here, compared to 0.14 μg/L), one of the most sensitive species to this compound. The sensitivity of black tiger prawns post larvae to chlorpyrifos, which has an LC50 of 0.48, is comparable to other, previously reported data for prawns. Penaeus aztecus has an LC50 of 0.2 μg/L, and Palaemonetes pugio has an LC50 of 1.5 μg/L (USEPA OPP ecotoxicology pesticide database, http://www.ipmcenters.org/ecotox/DataAccess.cfm).
The studies described are based on nominal, not measured, concentrations, so comparisons of the results to field data should be made cautiously. Never the less, when toxicity data are compared to the concentrations of pesticides reported in the field, we can begin to characterise the risk these compounds may pose. Imidacloprid causes feeding inhibition at nominal water concentrations similar to those reported in Queensland rivers that can be as high as 1 μg/L (Turner et al., unpublished) and as high as 0.45 μg/L in waterways of the Sydney metropolitan area (Sanchez-Bayo and Hyne, 2014). The concentrations of fipronil (0.03-0.05 μg/L) measured elsewhere in the world (Wu et al., 2015; Weston and Lydy, 2015) are greater than the LC10 concentrations measured in this study, indicating the potential for impacts for prawn PL’s in the Queensland waterways under investigation. The concentrations of bifenthrin measured in the US are less than a factor of 10 below those at which feeding inhibition was measured (0.125 mg/L), again suggesting a moderate potential for impacts. The Chlorpyrifos levels that have been reported in Australia (0.005 μg/L; Scott et al., 2014) are one hundred fold less than the levels at which we measure toxicity (LC50 is approximately 0.5 μg/L) suggesting that the risk is lowest for this insecticide, especially as the use of this pesticide is declining. However, these risk estimates are based on chemical concentrations measured elsewhere. A more accurate characterisation of risk will be done when the project is complete and pesticide concentrations in the farm intake waters are available.
Although the toxicity studies described in this report help to characterise risk by determining the sensitivity of post larval prawns to modern use insecticides, they are not sufficient on their own. Currently, there is not sufficient insecticide water quality monitoring data to determine the levels of insecticides in the catchments where prawn farms are located, especially for rivers outside the Great Barrier Reef catchment area. The second part of this project addresses that data short fall.
This portion of the study suggests that there may be some risk as feeding inhibition was measured at concentrations of imidacloprid that have been measured in some catchments in the GBR region (DSITI, unpublished), and in the Sydney metropolitan area (Sancez-Bayo and Hyne, 2014). The concentrations of bifenthrin and fipronil reported elsewhere in the world may also cause toxicity in post larval prawns if similar insecticide levels are measured in intake waters. However, this project alone will not be sufficient to
32
fully characterise the risks posed by insecticides on prawn farming operations. The catchments used for prawn farming may contain a suite of different and potentially interacting compounds, studies examining the potential interactions of different pesticides should be conducted as well. Many of the compounds studied, including fipronil, partition to sediments, studies should be conducted examining the role of a sedimentary route of exposure on post larval prawns. Finally, these compounds could be impacting the health of wild crustaceans, including brood stock. These impacts may be the result of direct toxicity or may instead result from impacts on smaller invertebrates that make up the food supply for prawn post larvae and early life stages of many aquatic species.
Chemical Analyses
Insecticides
Imidacloprid was detected in every catchment except the Clarence River and the Burdekin River catchment (Table 8). In some cases, the concentrations were only slightly above the detection limits, but in the Mackay catchment, concentrations ranged from 0.2 -0.42 μg/L imidacloprid. This is consistent with values in the literature, where concentrations between 0.1- 5 μg/L imidacloprid can be measured in other agriculturally impacted water systems worldwide (Sanchez Bayo et al., 2016). Feeding inhibition was measured in this project at imidacloprid concentrations greater than 0.5 μg/L, and previous studies have measured sub-lethal effects at concentrations as low as 0.065 μg/L imidacloprid (van Dijk et al., 2013; Figure 17). Measured concentrations are about half the 1 μg/L imidacloprid at which mortality is reported for ostracods, the most sensitive of the crustaceans (reviewed by Anderson et al., 2015b) (although it is much lower than the LC50 reported in this work). In the Burnett-Mary and Logan catchments, the concentrations measured were lower, but still exceeded European water quality standards of 0.01 μg/L imidacloprid (Table 9; Smit et al., 2015).
Fipronil was detected at only one site, in the Logan catchment (Table 8). Of the catchments surveyed, this catchment has the highest proportion of residential land use. This finding is consistent with the overseas literature, which primarily finds fipronil in residential and urban environments (e.g. Wu et al., 2015, Weston and Lydy, 2014). As shown in Figure 17, the highest concentration measured (0.07 μg/L) would be expected to cause mortality of post larval stage prawns, as determined by both this project and studies reported in the US EPA database. However, fipronil would be expected to partition into sediments (e.g. Wu et al., 2015, Weston and Lydy, 2014), so accumulation in the pond sediments may pose a greater risk to post-larval prawns than concentrations measured in the intake water.
Bifenthrin was also detected only in samples from the Logan River catchment (Table 8). Again, the higher proportion of residential land use in this catchment relative to the others may explain this finding. The highest concentration measured (20 ng/L) is in the range where mortality has been reported in the literature (Ding et al., 2012; Harwood et al., 2013), although it is below the concentrations of 0.1 and 0.5 μg/L bifenthrin, respectively, at which mortality and feeding inhibition were measured in this study (Figure 17) . Like fipronil, bifenthrin would be expected to bind to sediments (Holmes et al., 2008), so water column measurements may underestimate the risk of bifenthrin exposures to prawn larvae.
Chlorpyrifos was detected in samples from the Logan River, and occasionally at concentrations just above the levels of detection in other samples (Table 8). The highest concentration measured (40 ng/L), is above the trigger values (e.g. the concentrations at which toxic effects to some component of the ecosystem have a greater probability of occurring) (ANZECC/ARMCANZ 2000; GBRMPA, 2014). The highest concentration is about half of the 80 ng/L where sub-lethal impacts have been reported in literature studies (Figure 17), and approximately one tenth of the LC50 measured of 480 ng/L in this project (summarised in Section 4). These concentrations also exceed GBRMPA guideline trigger values (Table 3). As with fipronil and bifenthrin, chlorpyrifos partitions to sediment, so water column measures may underestimate the risk (Giddings et al., 2014).

33
As shown in Figure 17 and Table 8, the insect repellent DEET (N,N-diethyl-meta-toluamide) was found at comparatively high concentrations (greater than 1 μg/L) at one site in the Wet Tropics. Other surveys in Queensland have also reported elevated concentrations of DEET (DSITI, pers. comm.). There is very little information about the environmental toxicity of DEET in either the scientific literature or the US EPA ecotoxicology database, but the data that do exist suggests that DEET is overtly toxic only at very high concentrations (g/L). This is consistent with DEET’s known mode of action as a deterrent, meaning that insects avoid contact with the substance but it does not kill them. However, some studies have suggested that exposure to DEET may make food less palatable to decapod crustaceans (Aggio et al., 2012). Because of this, it is possible that simultaneous exposure to DEET and some of the other insecticides may exacerbate feeding inhibition.
Clothiandin, a neonicotinoid insecticide with similar toxic impacts to imidacloprid, was measured at 0.005 μg/L in samples from the Logan River only. These concentrations were much lower than the 1 μg/L levels expected to cause a toxic impact (Figure 17). All other insecticides included in the study (listed in Table 5) were below the levels of detection at all sites.
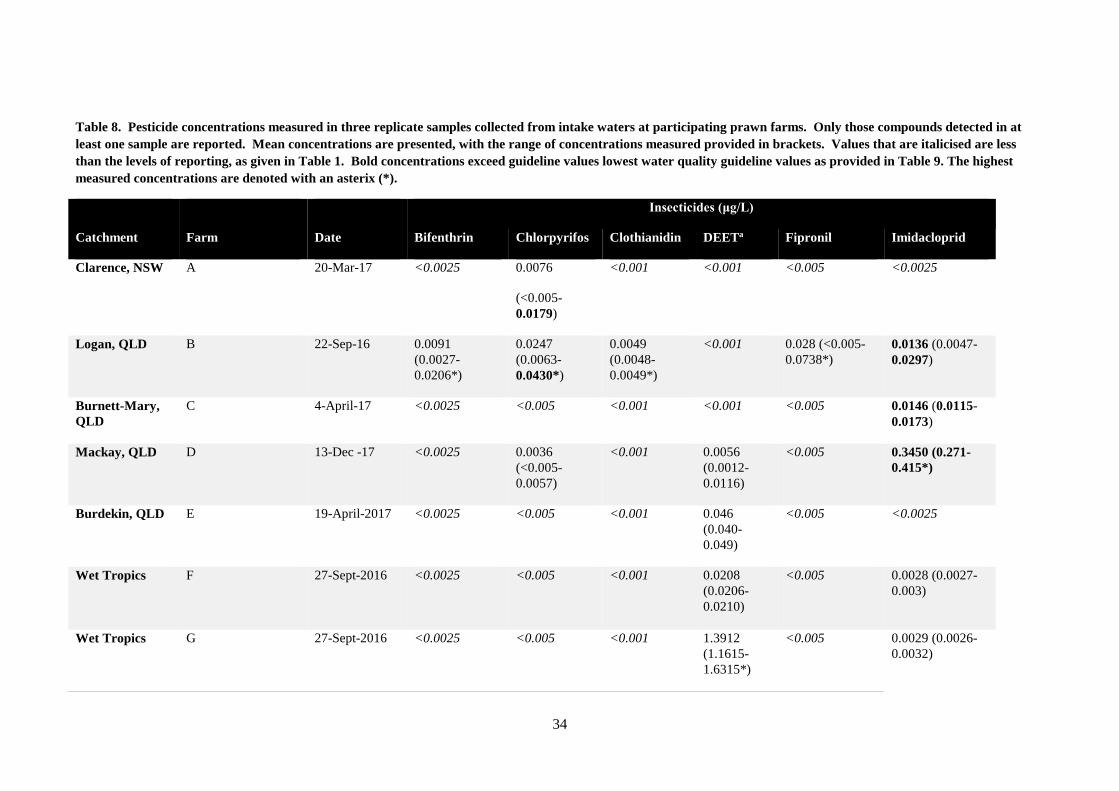
34
Table 8. Pesticide concentrations measured in three replicate samples collected from intake waters at participating prawn farms. Only those compounds detected in at least one sample are reported. Mean concentrations are presented, with the range of concentrations measured provided in brackets. Values that are italicised are less than the levels of reporting, as given in Table 1. Bold concentrations exceed guideline values lowest water quality guideline values as provided in Table 9. The highest measured concentrations are denoted with an asterix (*).
Insecticides (μg/L)
Catchment Farm Date Bifenthrin Chlorpyrifos Clothianidin DEETa Fipronil Imidacloprid
Clarence, NSW A 20-Mar-17
<0.0025 0.0076
(<0.005-0.0179)
<0.001 <0.001 <0.005 <0.0025
Logan, QLD B 22-Sep-16 0.0091 (0.0027-0.0206*)
0.0247 (0.0063-0.0430*)
0.0049 (0.0048-0.0049*)
<0.001 0.028 (<0.005-0.0738*)
0.0136 (0.0047-0.0297)
Burnett-Mary, QLD
C 4-April-17 <0.0025 <0.005 <0.001 <0.001 <0.005 0.0146 (0.0115-0.0173)
Mackay, QLD D 13-Dec -17 <0.0025 0.0036 (<0.005-0.0057)
<0.001 0.0056 (0.0012-0.0116)
<0.005 0.3450 (0.271-0.415*)
Burdekin, QLD E 19-April-2017 <0.0025 <0.005 <0.001 0.046 (0.040-0.049)
<0.005 <0.0025
Wet Tropics F 27-Sept-2016 <0.0025 <0.005 <0.001 0.0208 (0.0206-0.0210)
<0.005 0.0028 (0.0027-0.003)
Wet Tropics G 27-Sept-2016 <0.0025 <0.005 <0.001 1.3912 (1.1615-1.6315*)
<0.005 0.0029 (0.0026-0.0032)
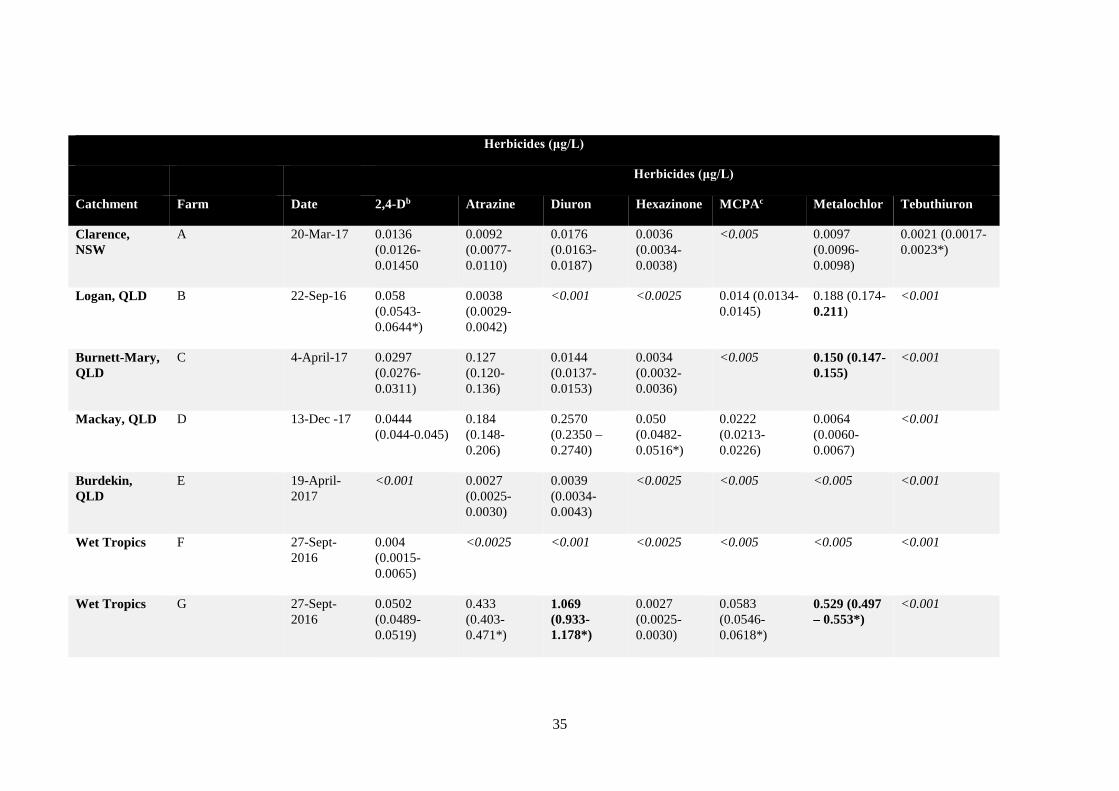
35
Herbicides (μg/L)
Herbicides (μg/L)
Catchment Farm Date 2,4-Db Atrazine Diuron Hexazinone MCPAc Metalochlor Tebuthiuron
Clarence, NSW
A 20-Mar-17
0.0136 (0.0126-0.01450
0.0092 (0.0077-0.0110)
0.0176 (0.0163- 0.0187)
0.0036 (0.0034-0.0038)
<0.005 0.0097 (0.0096-0.0098)
0.0021 (0.0017-0.0023*)
Logan, QLD B 22-Sep-16 0.058 (0.0543-0.0644*)
0.0038 (0.0029-0.0042)
<0.001 <0.0025 0.014 (0.0134-0.0145)
0.188 (0.174-0.211)
<0.001
Burnett-Mary, QLD
C 4-April-17 0.0297 (0.0276-0.0311)
0.127 (0.120-0.136)
0.0144 (0.0137-0.0153)
0.0034 (0.0032-0.0036)
<0.005 0.150 (0.147-0.155)
<0.001
Mackay, QLD D 13-Dec -17 0.0444 (0.044-0.045)
0.184 (0.148-0.206)
0.2570 (0.2350 – 0.2740)
0.050 (0.0482-0.0516*)
0.0222 (0.0213-0.0226)
0.0064 (0.0060-0.0067)
<0.001
Burdekin, QLD
E 19-April-2017
<0.001 0.0027 (0.0025-0.0030)
0.0039 (0.0034-0.0043)
<0.0025 <0.005 <0.005 <0.001
Wet Tropics F 27-Sept-2016
0.004 (0.0015-0.0065)
<0.0025 <0.001 <0.0025 <0.005 <0.005 <0.001
Wet Tropics G 27-Sept-2016
0.0502 (0.0489-0.0519)
0.433 (0.403- 0.471*)
1.069 (0.933-1.178*)
0.0027 (0.0025-0.0030)
0.0583 (0.0546-0.0618*)
0.529 (0.497 – 0.553*)
<0.001
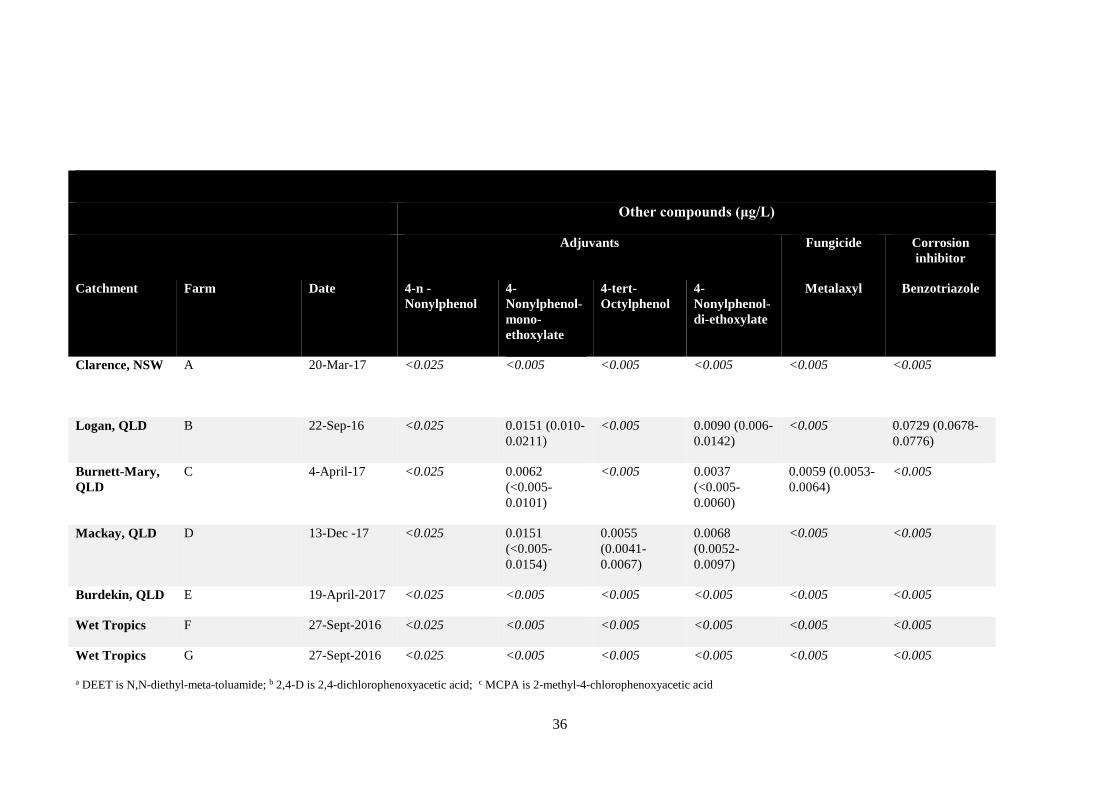
36
Other compounds (μg/L)
Adjuvants Fungicide Corrosion inhibitor
Catchment Farm Date 4-n -Nonylphenol
4-Nonylphenol-mono-ethoxylate
4-tert-Octylphenol
4-Nonylphenol-di-ethoxylate
Metalaxyl
Benzotriazole
Clarence, NSW A 20-Mar-17
<0.025 <0.005 <0.005 <0.005 <0.005 <0.005
Logan, QLD B 22-Sep-16 <0.025 0.0151 (0.010-0.0211)
<0.005 0.0090 (0.006-0.0142)
<0.005 0.0729 (0.0678-0.0776)
Burnett-Mary, QLD
C 4-April-17 <0.025 0.0062 (<0.005-0.0101)
<0.005 0.0037 (<0.005-0.0060)
0.0059 (0.0053-0.0064)
<0.005
Mackay, QLD D 13-Dec -17 <0.025 0.0151 (<0.005-0.0154)
0.0055 (0.0041-0.0067)
0.0068 (0.0052-0.0097)
<0.005 <0.005
Burdekin, QLD E 19-April-2017 <0.025 <0.005 <0.005 <0.005 <0.005 <0.005
Wet Tropics F 27-Sept-2016 <0.025 <0.005 <0.005 <0.005 <0.005 <0.005
Wet Tropics G 27-Sept-2016 <0.025 <0.005 <0.005 <0.005 <0.005 <0.005
a DEET is N,N-diethyl-meta-toluamide; b 2,4-D is 2,4-dichlorophenoxyacetic acid; c MCPA is 2-methyl-4-chlorophenoxyacetic acid
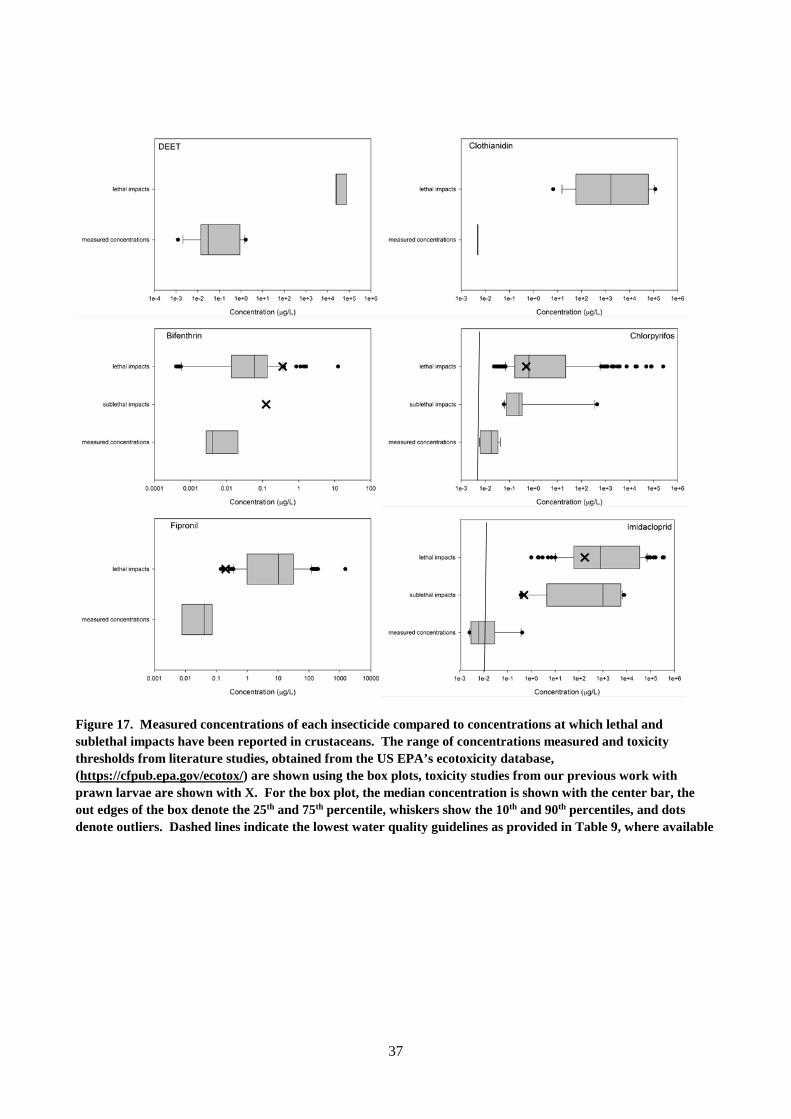
37
Figure 17. Measured concentrations of each insecticide compared to concentrations at which lethal and sublethal impacts have been reported in crustaceans. The range of concentrations measured and toxicity thresholds from literature studies, obtained from the US EPA’s ecotoxicity database, (https://cfpub.epa.gov/ecotox/) are shown using the box plots, toxicity studies from our previous work with prawn larvae are shown with X. For the box plot, the median concentration is shown with the center bar, the out edges of the box denote the 25th and 75th percentile, whiskers show the 10th and 90th percentiles, and dots denote outliers. Dashed lines indicate the lowest water quality guidelines as provided in Table 9, where available
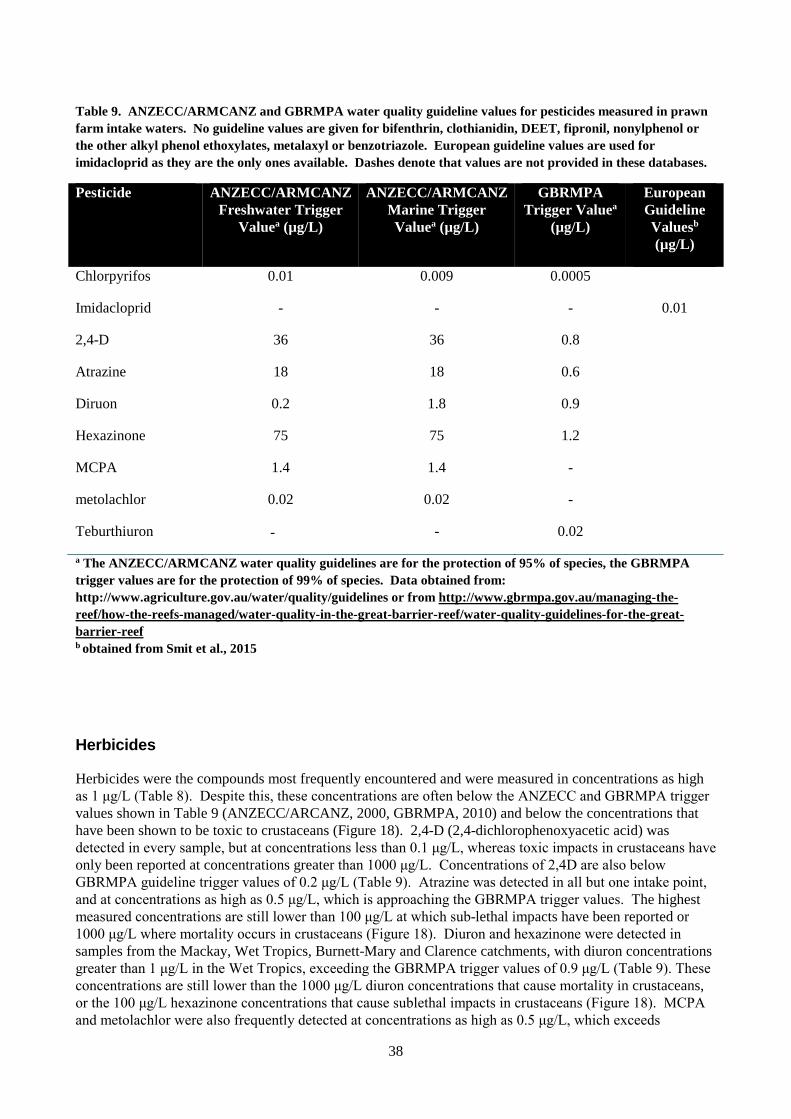
38
Table 9. ANZECC/ARMCANZ and GBRMPA water quality guideline values for pesticides measured in prawn farm intake waters. No guideline values are given for bifenthrin, clothianidin, DEET, fipronil, nonylphenol or the other alkyl phenol ethoxylates, metalaxyl or benzotriazole. European guideline values are used for imidacloprid as they are the only ones available. Dashes denote that values are not provided in these databases.
Pesticide ANZECC/ARMCANZ Freshwater Trigger
Valuea (µg/L)
ANZECC/ARMCANZ Marine Trigger Valuea (µg/L)
GBRMPA Trigger Valuea
(µg/L)
European Guideline Valuesb
(µg/L)
Chlorpyrifos 0.01 0.009 0.0005
Imidacloprid - - - 0.01
2,4-D 36 36 0.8
Atrazine 18 18 0.6
Diruon 0.2 1.8 0.9
Hexazinone 75 75 1.2
MCPA 1.4 1.4 -
metolachlor 0.02 0.02 -
Teburthiuron - - 0.02
a The ANZECC/ARMCANZ water quality guidelines are for the protection of 95% of species, the GBRMPA trigger values are for the protection of 99% of species. Data obtained from: http://www.agriculture.gov.au/water/quality/guidelines or from http://www.gbrmpa.gov.au/managing-the-reef/how-the-reefs-managed/water-quality-in-the-great-barrier-reef/water-quality-guidelines-for-the-great-barrier-reef b obtained from Smit et al., 2015
Herbicides
Herbicides were the compounds most frequently encountered and were measured in concentrations as high as 1 μg/L (Table 8). Despite this, these concentrations are often below the ANZECC and GBRMPA trigger values shown in Table 9 (ANZECC/ARCANZ, 2000, GBRMPA, 2010) and below the concentrations that have been shown to be toxic to crustaceans (Figure 18). 2,4-D (2,4-dichlorophenoxyacetic acid) was detected in every sample, but at concentrations less than 0.1 μg/L, whereas toxic impacts in crustaceans have only been reported at concentrations greater than 1000 μg/L. Concentrations of 2,4D are also below GBRMPA guideline trigger values of 0.2 μg/L (Table 9). Atrazine was detected in all but one intake point, and at concentrations as high as 0.5 μg/L, which is approaching the GBRMPA trigger values. The highest measured concentrations are still lower than 100 μg/L at which sub-lethal impacts have been reported or 1000 μg/L where mortality occurs in crustaceans (Figure 18). Diuron and hexazinone were detected in samples from the Mackay, Wet Tropics, Burnett-Mary and Clarence catchments, with diuron concentrations greater than 1 μg/L in the Wet Tropics, exceeding the GBRMPA trigger values of 0.9 μg/L (Table 9). These concentrations are still lower than the 1000 μg/L diuron concentrations that cause mortality in crustaceans, or the 100 μg/L hexazinone concentrations that cause sublethal impacts in crustaceans (Figure 18). MCPA and metolachlor were also frequently detected at concentrations as high as 0.5 μg/L, which exceeds

39
ANZECC/ARMCANZ guidelines (Table 9). These compounds have not been well studied from an ecotoxicological perspective, but the data that do exist suggest that toxic impacts in crustaceans occur at concentrations greater than 1000 μg/L. Tebuthiuron was measured in concentrations only slightly above the levels of detection in samples from the Logan River, and are below GBRMPA trigger values. These levels are not expected to have a toxic impact. No other herbicides (Table 5) were measured in the samples collected for this study.
Although the concentrations of herbicides measured in this survey would not be expected to directly impact the prawn larvae, exposure to herbicides at these concentrations may increase the toxic impacts of exposure to the insecticides. For example, mixtures of atrazine, imidacloprid and atrazine were more toxic to grass shrimp than exposure to either imidacloprid or fipronil alone, even though the grass shrimp were comparatively insensitive to atrazine (Key et al., 1997). The potential for toxic impacts of exposures to mixtures should be considered.
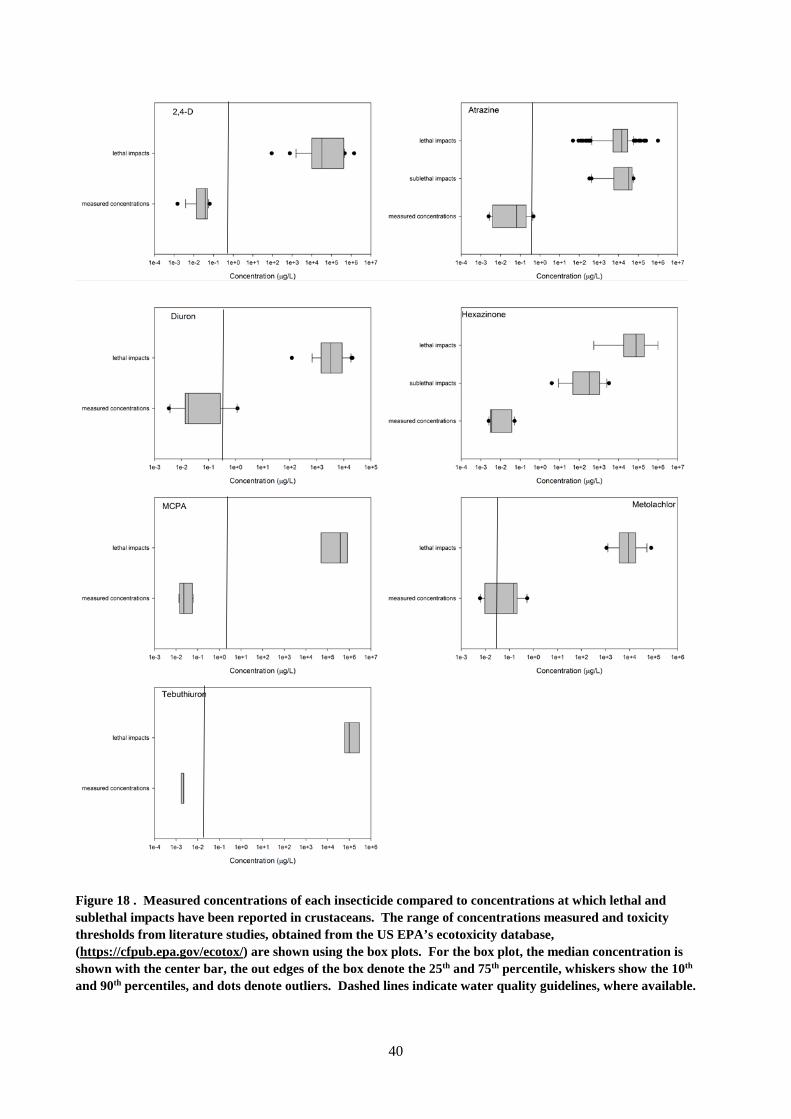
40
Figure 18 . Measured concentrations of each insecticide compared to concentrations at which lethal and sublethal impacts have been reported in crustaceans. The range of concentrations measured and toxicity thresholds from literature studies, obtained from the US EPA’s ecotoxicity database, (https://cfpub.epa.gov/ecotox/) are shown using the box plots. For the box plot, the median concentration is shown with the center bar, the out edges of the box denote the 25th and 75th percentile, whiskers show the 10th and 90th percentiles, and dots denote outliers. Dashed lines indicate water quality guidelines, where available.
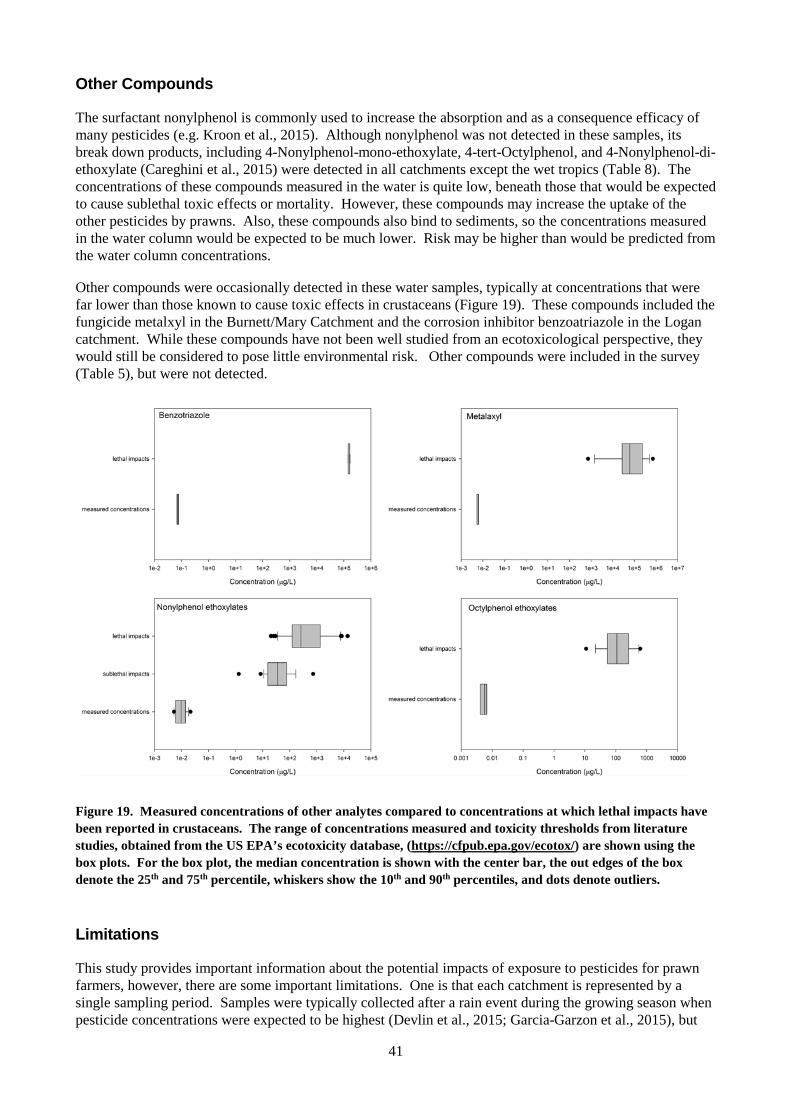
41
Other Compounds
The surfactant nonylphenol is commonly used to increase the absorption and as a consequence efficacy of many pesticides (e.g. Kroon et al., 2015). Although nonylphenol was not detected in these samples, its break down products, including 4-Nonylphenol-mono-ethoxylate, 4-tert-Octylphenol, and 4-Nonylphenol-di-ethoxylate (Careghini et al., 2015) were detected in all catchments except the wet tropics (Table 8). The concentrations of these compounds measured in the water is quite low, beneath those that would be expected to cause sublethal toxic effects or mortality. However, these compounds may increase the uptake of the other pesticides by prawns. Also, these compounds also bind to sediments, so the concentrations measured in the water column would be expected to be much lower. Risk may be higher than would be predicted from the water column concentrations.
Other compounds were occasionally detected in these water samples, typically at concentrations that were far lower than those known to cause toxic effects in crustaceans (Figure 19). These compounds included the fungicide metalxyl in the Burnett/Mary Catchment and the corrosion inhibitor benzoatriazole in the Logan catchment. While these compounds have not been well studied from an ecotoxicological perspective, they would still be considered to pose little environmental risk. Other compounds were included in the survey (Table 5), but were not detected.
Figure 19. Measured concentrations of other analytes compared to concentrations at which lethal impacts have been reported in crustaceans. The range of concentrations measured and toxicity thresholds from literature studies, obtained from the US EPA’s ecotoxicity database, (https://cfpub.epa.gov/ecotox/) are shown using the box plots. For the box plot, the median concentration is shown with the center bar, the out edges of the box denote the 25th and 75th percentile, whiskers show the 10th and 90th percentiles, and dots denote outliers.
Limitations
This study provides important information about the potential impacts of exposure to pesticides for prawn farmers, however, there are some important limitations. One is that each catchment is represented by a single sampling period. Samples were typically collected after a rain event during the growing season when pesticide concentrations were expected to be highest (Devlin et al., 2015; Garcia-Garzon et al., 2015), but
42
none the less, we can not be certain they represent the highest concentrations as we do not know when pesticides are applied. The samples from the Burdekin, however, were collected outside of the peak period of pesticide application, and a few weeks after Cyclone Debbie, which made landfall 31 March 2017, so the system may have been flushed. Concentrations measured in this sample may not be typical of the watershed as a consequence and may have lower than normal pesticide concentrations. Continuous monitoring with passive samplers may be a better way to calculate exposure.
This study also assumes that the risk is driven by the water borne pesticides. For imidacloprid, which is highly water soluble (Smit et al., 2015), this assumption is probably valid, but the other insecticides, such as bifenthin, fipronil and chlorpyrifos, are more likely to bind to sediment (Holmes et al., 2008, Giddings et al., 2014). These pesticides may build up in ponds over time and may pose a risk to prawn aquaculture that is greater than would be predicted by a single water column measure. Additional sediment based studies may be required to properly assess the risk.
Another important qualification of this study is that the risk is based on single exposure only, and does not evaluate chemical mixtures. The vast majority of laboratory studies, including those conducted as part of this project, test the impacts of exposure to single compounds, even though it’s known that most environments are contaminated with a mixture of different classes of compounds. Compounds with similar modes of action may have an additive effect, and compound that inhibit pesticide metabolising enzymes may have a synergistic effect.
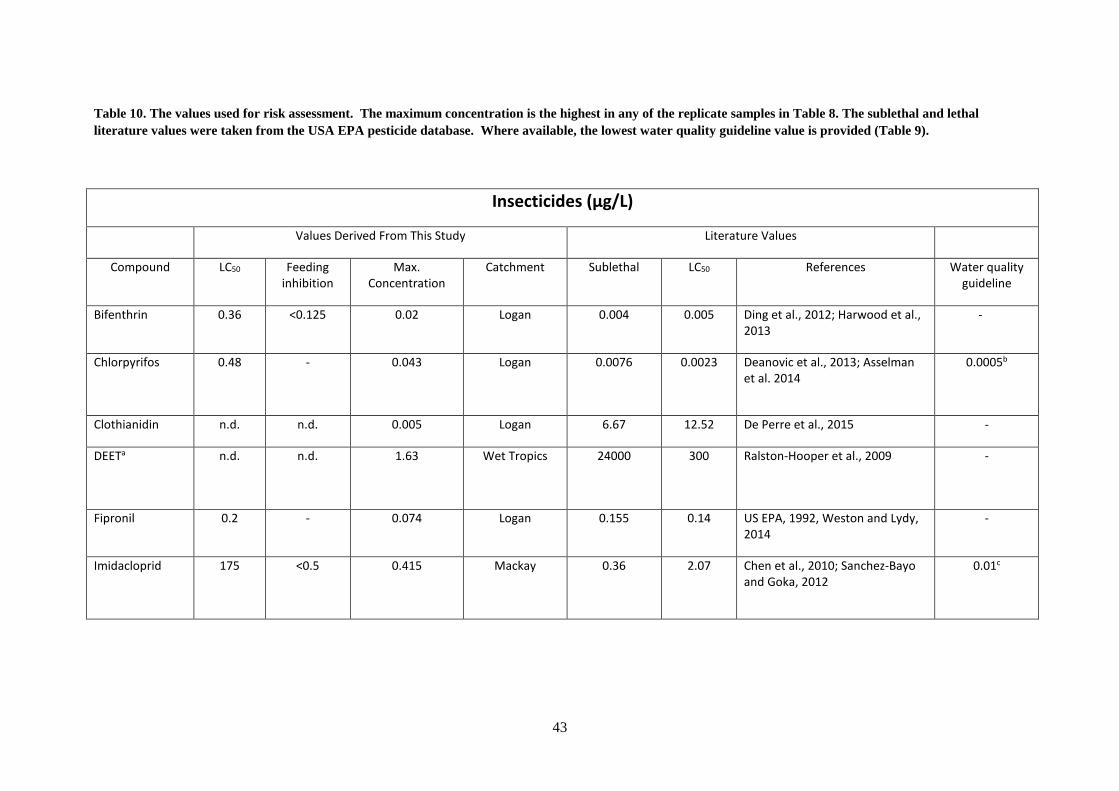
43
Table 10. The values used for risk assessment. The maximum concentration is the highest in any of the replicate samples in Table 8. The sublethal and lethal literature values were taken from the USA EPA pesticide database. Where available, the lowest water quality guideline value is provided (Table 9).
Insecticides (µg/L)
Values Derived From This Study Literature Values
Compound LC50 Feeding inhibition
Max. Concentration
Catchment Sublethal LC50 References Water quality guideline
Bifenthrin 0.36 <0.125 0.02 Logan 0.004 0.005 Ding et al., 2012; Harwood et al., 2013
-
Chlorpyrifos 0.48 - 0.043 Logan 0.0076
0.0023 Deanovic et al., 2013; Asselman et al. 2014
0.0005b
Clothianidin n.d. n.d. 0.005 Logan 6.67 12.52 De Perre et al., 2015 -
DEETa n.d. n.d. 1.63 Wet Tropics 24000
300 Ralston-Hooper et al., 2009 -
Fipronil 0.2 - 0.074 Logan 0.155 0.14 US EPA, 1992, Weston and Lydy, 2014
-
Imidacloprid 175 <0.5 0.415 Mackay 0.36
2.07 Chen et al., 2010; Sanchez-Bayo and Goka, 2012
0.01c
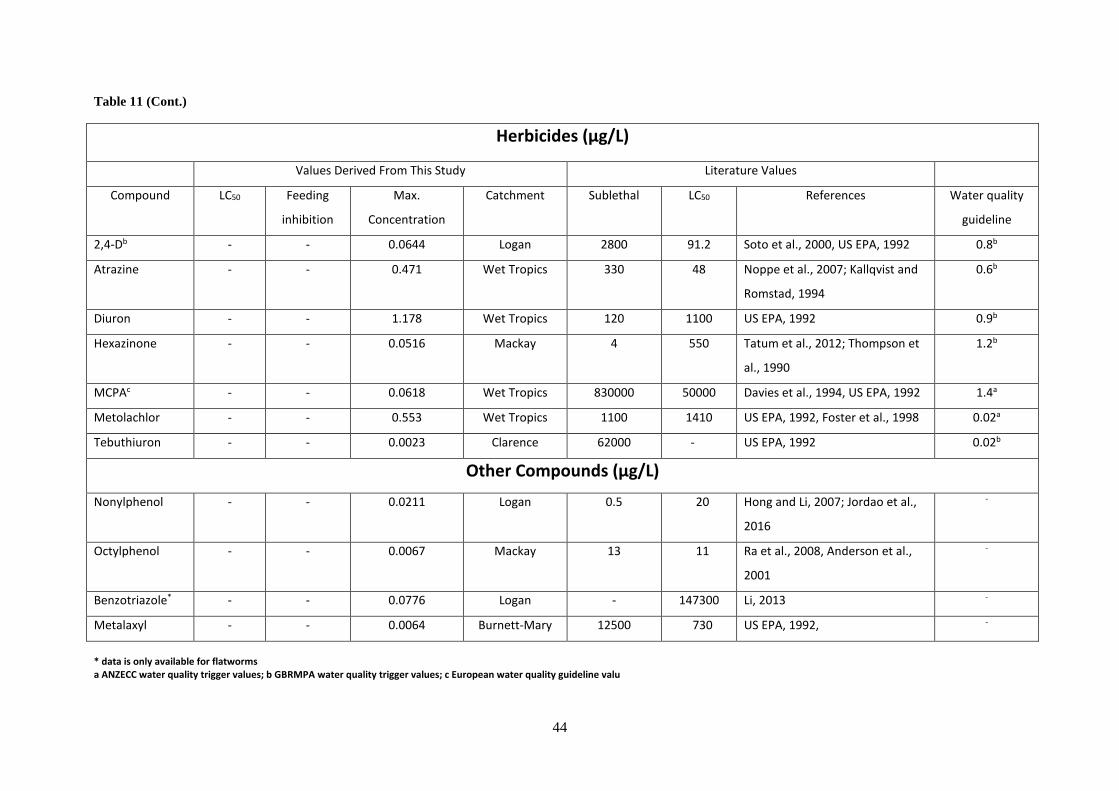
44
Table 11 (Cont.)
Herbicides (µg/L)
Values Derived From This Study Literature Values
Compound LC50 Feeding
inhibition
Max.
Concentration
Catchment Sublethal LC50 References Water quality
guideline
2,4-Db - - 0.0644 Logan 2800 91.2 Soto et al., 2000, US EPA, 1992 0.8b
Atrazine - - 0.471 Wet Tropics 330 48 Noppe et al., 2007; Kallqvist and
Romstad, 1994
0.6b
Diuron - - 1.178 Wet Tropics 120 1100 US EPA, 1992 0.9b
Hexazinone - - 0.0516 Mackay 4 550 Tatum et al., 2012; Thompson et
al., 1990
1.2b
MCPAc - - 0.0618 Wet Tropics 830000 50000 Davies et al., 1994, US EPA, 1992 1.4a
Metolachlor - - 0.553 Wet Tropics 1100 1410 US EPA, 1992, Foster et al., 1998 0.02a
Tebuthiuron - - 0.0023 Clarence 62000 - US EPA, 1992 0.02b
Other Compounds (µg/L)
Nonylphenol - - 0.0211 Logan 0.5 20 Hong and Li, 2007; Jordao et al.,
2016
-
Octylphenol - - 0.0067 Mackay 13 11 Ra et al., 2008, Anderson et al.,
2001
-
Benzotriazole* - - 0.0776 Logan - 147300 Li, 2013 -
Metalaxyl - - 0.0064 Burnett-Mary 12500 730 US EPA, 1992, -
* data is only available for flatworms a ANZECC water quality trigger values; b GBRMPA water quality trigger values; c European water quality guideline valu
45
Conclusions and Implications Review of the international scientific literature suggested the possibility of risk of toxic impacts in prawn post larvae exposed to pesticides present in Queensland estuaries, however, given the range in sensitivities of different crustaceans to imidacloprid in particular and the potential for dilution of contaminants in estuarine environments, this risk needed to be confirmed. Our toxicological assessments in this study suggested that prawns have sensitivities to imidacloprid, chlorpyrifos, bifenthrin and fipronil at concentrations that are comparable to other crustaceans, and are susceptible to imidacloprid and bifenthrin induced feeding inhibition. Furthermore, our analysis of the pesticide concentrations in prawn farm intake waters suggests that in at least some samples, concentrations of all four insecticides are high enough to cause negative impacts on post larval growth and survival (Table 10). Some of these measured pesticide concentrations are also above the lowest concentrations that have been reported to be harmful to crustaceans in literature studies (Table 10). In addition, herbicides were found at elevated concentrations, in some cases above water quality criteria (Table 10). Although these measured herbicide concentrations are much below those that cause direct harm to crustaceans, they could cause indirect impacts by disrupting either algal cultures or the food chain, or could cause interactive impacts.
46
Recommendations For this project, the results will be further disseminated via a presentation at the upcoming Australian Prawn Farmer’s Association conference (Gold Coast, QLD, 1-2 August). The results are also being prepared for publication, ideally in Ecotoxicology and Environmental Safety. We are in ongoing discussions with Queensland Department of Science, Information Technology and Innovation to partner with them to do additional estuarine monitoring for pesticide contamination.
Further development
While this initial study confirms the potential for impacts, further studies are needed to properly assess any negative consequences. Some of the areas for future study include:
• Assessment of pesticide concentrations in pond sediments as well as the toxicological impacts associated with these exposures;
• Additional assessment of the behavioural changes associated with insecticide exposure, including prolonged or repeated exposures;
• Assessment of the impacts of exposures to chemical mixtures;
• Assessment of the efficacy of water treatment systems of potentially impacted farms.
• Additional monitoring at regular intervals to determine seasonal variation of pesticide concentrations.
47
Extension and Adoption The project has been extended and communicated to the community as a whole through conversations with members of the Australian Prawn Farmer’s Association and conversations with state agencies (including Queensland Department of Science, Information Technology and Innovation, Queensland Department of Environment and Heritage Protection, New South Wales Department of Primary Industries). The research will be communicated to the broader scientific community via publication and presentations at the APFA conference.
48
Glossary Acetylcholinesterase: an enzyme that breaks down neurotansmitters , stopping nerves from signalling
and allowing them to return to a resting state.
Depuration: Excreting a compound from the body.
EC50: The concentration required to impact 50% of a population. Used for endpoints other than survival.
Enzyme: A protein that carries out a specific function (usually a biochemical reaction) in a cell.
Enzyme inhibition: when a chemical binds to an enzyme and prevents it from carrying out that chemical reaction.
Ergosterol: a compound found in the cell membrane of fungi
In vitro: studies conducted in cell lines are other simulations of living systems.
LC50: The concentration required to kill 50% of a population. Inversely related to toxicity (compounds with a low LC50 are very toxic, compounds with a high LC50 are less toxic).
Metabolite: A break down product or the end product of metabolism.
Mixed Function Oxidases: enzymes that break down organic compounds in cells.
Mode of action: The physiological pathway by which a contaminant causes toxicity.
Neonicotinoid Insecticide: a class of insecticide that are similar to nicotine and inhibit insect nervous systems by altering nicotinic acetylcholinesterase receptors, causing effects similar to acetylcholinestase inhibition.
Organophosphate Insecticide: an organic phosphorus containing pesticide that causes toxicity via nerve damage by inhbiting acetylcholine esterase.
Pesticide load: The amount of pesticide entering a system in year. Pesticide loads are typically modelled.
Pesticide Concentration: The measured amount of pesticide in a volume of sample. Pesticide concentrations are typically measured.
Phenylpyrazole insecticide: a class of compounds that inhibits the insect nervous system by blocking GABA gated nerve channels.
Photosystem II inhibiting herbicides: a class of compounds that disrupt the proteins that plants use to capture energy from light during photosynthesis
Pyrethriod Insecticide: any insecticide created from the pyrethrin compounds normally produced by Chrystanthemums. They prevent voltage sensitive gates in the nerve from closing.
Range finder: A series of experiments used to identify the concentrations at which an organism is sensitive; e.g. the concentrations at which subsequent studies will be conducted.
Regression Analysis: using the mathematical relationships between two variables to make predictions.

49
Species Sensitivity Distribution: also SSD. A plot that enables both the comparison of the sensitivity of different taxa to a compound and enables the prediction of save concentrations of that compound.
Toxicity Identification Evaluation: also TIE. A series of toxicity tests designed to identify the toxic agent in a complex mixture.
Trigger value: a pesticide concentration that indicates increased possibility of negative consequences.
Water Solubility: The amount of a compound that will dissolve in water.

50
Project materials developed Hook, S.E., Doan, H., Gonzago, D., Musson, D., Du, J., Kookana, R., Sellars, M., Kumar, A. in preparation. Modern use pesticides impacts on prawn aquaculture: a risk assessment for North Eastern Australia. To be submitted to Ecotoxicology and Environmental Safety.
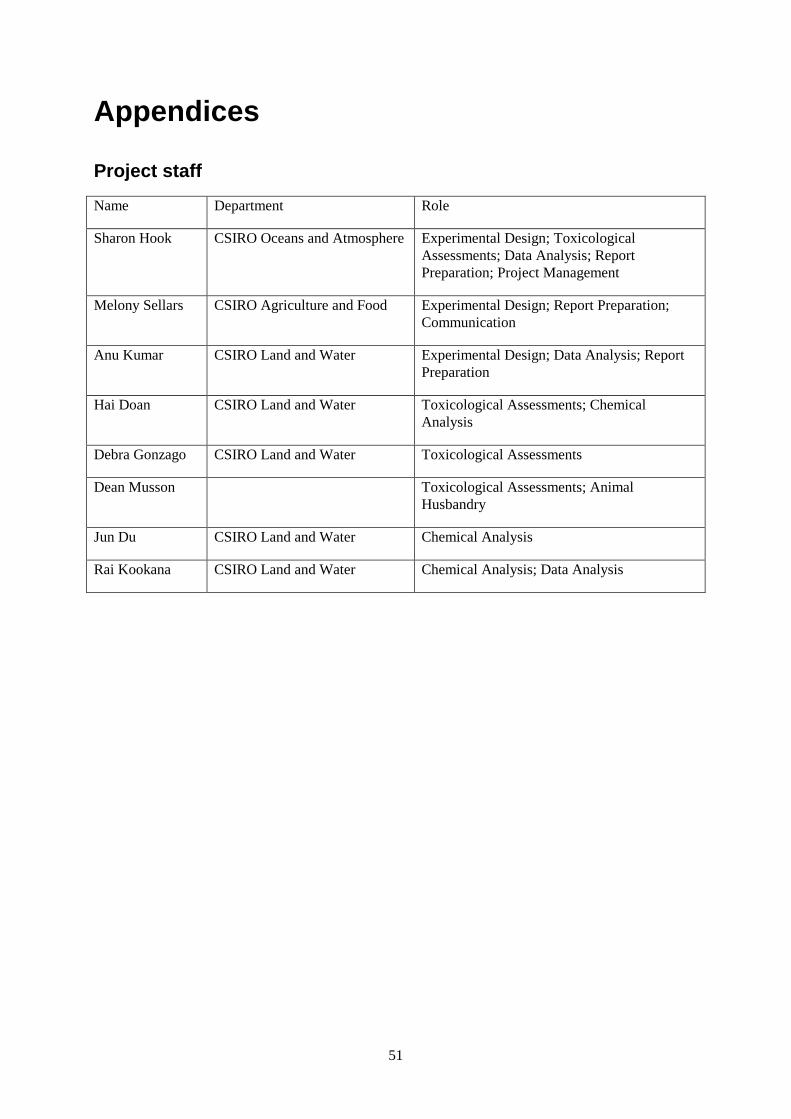
51
Appendices
Project staff Name Department Role
Sharon Hook CSIRO Oceans and Atmosphere Experimental Design; Toxicological Assessments; Data Analysis; Report Preparation; Project Management
Melony Sellars CSIRO Agriculture and Food Experimental Design; Report Preparation; Communication
Anu Kumar CSIRO Land and Water Experimental Design; Data Analysis; Report Preparation
Hai Doan CSIRO Land and Water Toxicological Assessments; Chemical Analysis
Debra Gonzago CSIRO Land and Water Toxicological Assessments
Dean Musson Toxicological Assessments; Animal Husbandry
Jun Du CSIRO Land and Water Chemical Analysis
Rai Kookana CSIRO Land and Water Chemical Analysis; Data Analysis
52
References
Agatz, A., Ashauer, R., Brown, C.D., 2014. Imidacloprid perturbs feeding of Gammarus pulex at environmentally relevant concentrations. Environmental Toxicology and Chemistry 33, 648-653. Aggio J.F., Tieu, R., Wei, A., Derby, C.D. 2012. Oesphageal chemoreceptors of blue crabs, Callinectes sapidus, sense chemical deterrents and can block ingestion of food. The journal of Experimental Biology 215: 1700-1710. Aguilera,L., Marquetti, M.D.C., Navarro, A., Bisset, J. 1995. Effects of Three Organophosphorus Insecticides in the Reproductive Potential of Culex quinquefasciatus. Mem. Inst. Oswaldo Cruz 90: 411-413 Andersen, H.R., Wollenberger, L., Halling-Sorensen, B., Kusk K.O. 2001. Development of Copepod Nauplii to Copepodites - a Parameter for Chronic Toxicity Including Endocrine Disruption. Environmental Toxicology and Chemistry 20: 2821-2829. Anderson, B.S., Phillips, B.M., Hunt, J, Siegler, K., Voorhees, J.P., Smalling, K., Kuivila, K., Hamilton, M., Ramasinghe, J.A., Tjeerdema, R.S. 2014. Impacts of pesticides in a Central California estuary. Environmental monitoring and assessment 186: 1801-1814. Anderson, B.S., Phillips, B.M., Voorhees, J.P., Petersen, M.A., Jennings, L.L., Fojut, T.L., Vasquez, M.E., Siegler, C., Tjeerdema, R.S., 2015a. Relative Toxicity of Bifenthrin to Hyalella azteca in 10 Day Versus 28 Day Exposures. Integrated Environmental Assessment and Management 11, 319-328. Anderson, J.C., Dubetz, C., Palace, V.P., 2015b. Neonicotinoids in the Canadian aquatic environment: A literature review on current use products with a focus on fate, exposure, and biological effects. Science of the Total Environment 505, 409-422. ANZECC/ARMCANZ, 2000a. Australian guidelines for water quality monitoring and reporting. Australian and New Zealand Environment and Conservation Council/Agricultural and Resource Management Council of Australia and New Zealand, Canberra, ACT.
Asselman,J., Janssen, C.R., Smagghe, G., De Schamphelaere, K.A.C. 2014. Ecotoxicity of Binary Mixtures of Microcystis aeruginosa and Insecticides to Daphnia pulex. Environmental Pollution 188:56-63
Boone, M.D., Bishop, C.A., Boswell, L.A., Brodman, R.D., Burger, J., Davidson, C., Gochfeld, M., Hoverman, J.T., Neuman-Lee, L.A., Relyea, R.A., Rohr, J.R., Salice, C., Semlitsch, R.D., Sparling, D., Weir, S., 2014. Pesticide Regulation amid the Influence of Industry. Bioscience 64, 917-922. Careghini, A., Mastorgio, A.F., Saponaro, S., Sezenna, E. 2015. Bisphenol A, nonylphenols, benzophenones and benzotriazoles in soils, groundwater, surface water, sediments, and food: a review. Environmental Science and Pollution Research 22:5711-5741.
Chen,X.D., Culbert, E. , Hebert, V., Stark, J.D. 2010. Mixture Effects of the Nonylphenyl Polyethoxylate, R-11 and the Insecticide, Imidacloprid on Population Growth Rate and Other Parameters of the Crustacean, Ceriodaphnia dubia. Ecotoxicology and Environmental Safety 73: 132-137
53
Clark, S.L., Ogle, R.S., Gantner, A., Hall, L.W., Jr., Mitchell, G., Giddings, J., McCoole, M., Dobbs, M., Henry, K., Valenti, T., 2015. Comparative sensitivity of field and laboratory populations of Hyalella azteca to the pyrethroid insecticides bifenthrin and cypermethrin. Environmental Toxicology and Chemistry 34: 2250-2262. Davies,P.E., Cook, L.S.J., Goenarso, D. 1994. Sublethal Responses to Pesticides of Several Species of Australian Freshwater Fish and Crustaceans and Rainbow Trout. Environmental Toxicology and Chemistry 13: 1341-1354 De Perre,C., Murphy, T.M., Lydy, M.J. 2015. Fate and Effects of Clothianidin in Fields Using Conservation Practices. Environmental Toxicology and Chemistry 34: 258-265 Deanovic,L.A., Markiewicz, D., Stillway, M., Fong, S., Werner., I. 2013. Comparing the Effectiveness of Chronic Water Column Tests with the Crustaceans Hyalella azteca (Order: Amphipoda) and Ceriodaphnia dubia (Order: Cladocera) in Detecting Toxicity of Current-Use Insecticides. Environmental Toxicology and Chemistry 32:707-712
Devlin, M. Lewis, S., Davis, A, Smith, R., Negri, A., Thompson, M., Poggio, M. 2015. Advancing our understanding of the source, management, transport and impacts of pesticides on the Great Barrier Reef. A report for the Queensland Department of Environment and Heritage Protection. Tropical Water and Aquatic Ecosystem Research (TropWATER) Publication, James Cook University, Cairns, 134 pp.
Ding,Y., Landrum, P.F. You, J., Harwood, A.D., Lydy, M.J. 2012. Use of Solid Phase Microextraction to Estimate Toxicity: Relating Fiber Concentrations to Toxicity - Part I. Environmental Toxicology and Chemistry 31: 2159-2167
Douglas, M.R., Rohr, J.R., Tooker, J.F., 2015. Neonicotinoid insecticide travels through a soil food chain, disrupting biological control of non-target pests and decreasing soya bean yield. Journal of Applied Ecology 52, 250-260. Fernandes, M.E.S., Alves, F.M., Pereira, R.C., Aquino, L.A., Fernandes, F.L., Zanuncio, J.C., 2016. Lethal and sublethal effects of seven insecticides on three beneficial insects in laboratory assays and field trials. Chemosphere 156, 45-55. Foster,S., Thomas, M., Korth, W. 1998. Laboratory-Derived Acute Toxicity of Selected Pesticides to Ceriodaphnia dubia. Australasian Journal of Ecotoxicology 4: 53-59 Garzon-Garcia, A., Wallace, R., Huggins, R., Turner, R.D.R., Smith, R.A., Orr, D., Ferguson, B., Gardiner, R., Thomson, B., Warne, M. St. J. 2015. Total suspended solids, nutrient and pesticide loads (2013-2014) for rivers that discharge to the Great Barrier Reef – Great Barrier Reef Catchment Loads Monitoring Program. Department of Science, Information Technology and Innovation. Brisbane.
Giddings, JM, Williams, WM, Solomon, KR, Giesy, JP. 2014. Risks to Aquatic Organisms from Use of Chlorpyrifos in the United States. Reviews of Environmental Contamination and Toxicology. 231: 119-162. Great Barrier Reef Marine Park Authority. 2010. Water quality guidelines for the Great Barrier Reef Marine Park 2010 [electronic resource] / GreatBarrier Reef Marine Park Authority. Halstead NT, Civitello DJ, Rohr JR. 2015. Comparative toxicities of organophosphate and pyrethroid insecticides to aquatic macroarthropods. Chemosphere 135: 265-271.
54
Harwood,A.D., Landrum, P.F., Lydy, M.J. 2013. Bioavailability-Based Toxicity Endpoints of Bifenthrin for Hyalella azteca and Chironomus dilutus. Chemosphere 90: 1117-1122 Hasenbien, S., Connon, R.E., Lawler, S.P., Giest, J. 2015. A comparison of the sublethal and lethal toxicity of four pesticides in Hyalella azteca and Chironomus dilutus. Environmental Science and pollution research 22: 11327-11339. Hayasaka, D., Suzuki, K., Nomura, T., Nishiyama, M., Nagai, T., Sanchez-Bayo, F., Goka, K., 2013. Comparison of acute toxicity of two neonicotinoid insecticides, imidacloprid and clothianidin, to five cladoceran species. Journal of Pesticide Science 38, 44-47. Holmes, R.W., Anderson, B.S., Phillips, B.M., Hunt, J.W., Crane, D.B., Mekebri, A., Connor, V., 2008. Statewide investigation of the role of pyrethroid pesticides in sediment toxicity in California's urhan waterways. Environmental science & technology 42, 7003-7009. Hong, L., Li, M.H. 2007. Acute Toxicity of 4-Nonylphenol to Aquatic Invertebrates in Taiwan. Bulletin of Environmental Contamination and Toxicology 78: 445-449 Hook, S.E., Osborn, H.L., Spadaro, D.A., Simpson, S.L., 2014. Assessing mechanisms of toxicant response in the amphipod Melita plumulosa through transcriptomic profiling. Aquatic toxicology 146, 247-257. Hunt, L., Bonetto, C., Resh, V.H., Buss, D.F., Fanelli, S., Marrochi, N., Lydy, M.J., 2016. Insecticide concentrations in stream sediments of soy production regions of South America. Science of the Total Environment 547, 114-124. Huynh, C.K., Poquette, S.R., Whitlow, W.L., 2014. Pyrethroid pesticide effects on behavioral responses of aquatic isopods to danger cues. Environmental Science and Pollution Research 21, 5211-5216. Jordao,R., Garreta, E., Campos, B., Lemos, M.F.L., Soares, A.M.V.M., Tauler, R., Barata, C. 2016. Compounds Altering Fat Storage in Daphnia magna. Sci. Total Environ.545/546:127-136 Kallqvist,T., Romstad, R. 1994. Effects of Agricultural Pesticides on Planktonic Algae and Cyanobacteria -- Examples of Interspecies Sensitivity Variations. Norwegian Journal of Agricultural Science Supplemental 13:117-131 Key, P., Chung, K., Siewicki, T., Fulton, M. 2007. Toxicity of three pesticides individually and in mixture to larval grass shrimp (Palaemonetes pugio). Ecotoxicology and Environmental Safety. 68: 272-277. Kroon, F.J., Hook, S.E., Metcalfe, S., Jones, D., 2015. Altered levels of endocrine biomarkers in juvenile barramundi (Lates calcarifer; Bloch) following exposure to commercial herbicide and surfactant formulations. Environmental toxicology and chemistry Kuivila, K.M., Foe, C.G., 1995. Concentrations, transport and biological effects of dormant spray pesticides in the San Francisco estuary, California. Environmental Toxicology and Chemistry 14, 1141-1150. Kuivila, K.M., Hladik, M.L., Ingersoll, C.G., Kemble, N.E., Moran, P.W., Calhoun, D.L., Nowell, L.H., Gilliom, R.J., 2012. Occurrence and Potential Sources of Pyrethroid Insecticides in Stream Sediments from Seven U.S. Metropolitan Areas. Environmental Science & Technology 46, 4297-4303.
55
Kumar, A., Doan, H., Barnes, M., Chapman, J.C., Kookana, R.S., 2010. Response and recovery of acetylcholinesterase activity in freshwater shrimp, Paratya australiensis (Decapoda: Atyidae) exposed to selected anti-cholinesterase insecticides. Ecotoxicology and environmental safety 73, 1503-1510. Leung, K.M.Y., Merrington, G., Warne, M.S., Wenning, R.J., 2014. Scientific derivation of environmental quality benchmarks for the protection of aquatic ecosystems: challenges and opportunities. Environmental Science and Pollution Research 21, 1-5. Lewis, S.E., Silburn, D.M., Kookana, R.S., Shaw, M., 2016. Pesticide Behavior, Fate, and Effects in the Tropics: An Overview of the Current State of Knowledge. Journal of Agricultural and Food Chemistry 64, 3917-3924. Li, M.H. 2013. Acute Toxicity of Industrial Endocrine-Disrupting Chemicals, Natural and Synthetic Sex Hormones to the Freshwater Planarian, Dugesia japonica. Toxicology and Environmental Chemistry 95(6): 984-991 Maul, J.D., Brennan, A.A., Harwood, A.D., Lydy, M.J. 2008. Effect of sediment associated pyrethroids, fipronil, and metabolites on Chironomus tentans growth rate, body mass, condition index, immobilization, and survival. Environmental Toxicology and Chemistry 27: 2582-2590. Minderhout,T., Kendall, T.Z., Krueger, H.O. 2008. DEET: A Semi-Static Life-Cycle Toxicity Test with the Cladoceran (Daphnia magna). Project 319A-128. Wildlife International: 82 p. Mugni, H., Paracampo, A., Demetrio, P., Pardi, M., Bulus, G., Ronco, A., Bonetto, C., 2016. Toxicity Persistence of Chlorpyrifos in Runoff from Experimental Soybean Plots to the Non-target Amphipod Hyalella curvispina: Effect of Crop Management. Archives of Environmental Contamination and Toxicology 70, 257-264. Noppe,H., Ghekiere, A., Verslycke, T., De Wulf, E., Verheyden, K., Monteyne, E., Polfliet, K., Van Caeter, P., Janssen, C.R., De Brabander, H.F. 2007. Distribution and Ecotoxicity of Chlorotriazines in the Scheldt Estuary (B-Nl). Environmental Pollution 147: 668-676 Norgaard, K.B., Cedergreen, N. 2010. Pesticide cocktails can interact synergistically on aquatic crustaceans. Environmetal Science and Pollution Research 17: 957-967. Nyman, A.-M., Hintermeister, A., Schirmer, K., Ashauer, R., 2013. The Insecticide Imidacloprid Causes Mortality of the Freshwater Amphipod Gammarus pulex by Interfering with Feeding Behavior. PloS one 8, e62472. Osterberg, J.S., Darnell, K.M., Blickley, T.M., Romano, J.A., Rittschof, D., 2012. Acute toxicity and sub-lethal effects of common pesticides in post-larval and juvenile blue crabs, Callinectes sapidus. Journal of Experimental Marine Biology and Ecology 424, 5-14. Pathiratne, A., Kroon, F.J., 2016. Using species sensitivity distribution approach to assess the risks of commonly detected agricultural pesticides to Australia's tropical freshwater ecosystems. Environmental Toxicology and Chemistry 35, 419-428. Phillips, B.M., Anderson, B.S., Voorhees, J.P., Hunt, J.W., Holmes, R.W., Mekebri, A., Connor, V., Tjeerdema, R.S., 2010. The contribution of pyrethroid pesticides to sediment toxicity in four urban creeks in California, USA. Journal of Pesticide Science 35, 302-309.
56
Ra, J.S., Oh, S.Y., Lee, B.C., Kim, S.D. 2008. The Effect of Suspended Particles Coated by Humic Acid on the Toxicity of Pharmaceuticals, Estrogens, and Phenolic Compounds. Environment International 34: 184-192 Ralston-Hooper,K., Hardy, J., Hahn, L., Ochoa-Acuna, H., Lee, L.S., Mollenhauer, R., Sepulveda, M.S.2009. Acute and Chronic Toxicity of Atrazine and Its Metabolites Deethylatrazine and Deisopropylatrazine on Aquatic Organisms Rondeau, G., Sanchez-Bayo, F., Tennekes, H.A., Decourtye, A., Ramirez-Romero, R., Desneux, N., 2014. Delayed and time-cumulative toxicity of imidacloprid in bees, ants and termites. Scientific Reports 4. Ryberg, K.R., Gilliom, R.J., 2015. Trends in pesticide concentrations and use for major rivers of the United States. Science of the Total Environment 538, 431-444. Sanchez-Bayo,F., Goka, K. 2012. Evaluation of Suitable Endpoints for Assessing the Impacts of Toxicants at the Community Level. Ecotoxicology 21: 667-680 Sánchez-Bayo, F., Hyne, R.V. 2014. Detection and analysis of neonicotinoids in river waters - Development of a passive sampler for three commonly used insecticides. Chemosphere 99, 143-151. Sánchez-Bayo, F., Goka, K ., Hayasaka, D (2016) Contamination of the aquatic environment with neonicotinoids and its implication for ecosystems Frontiers in Environmental Science 4: 71 Scott, P.D., Bartkow, M., Blockwell, S.J., Coleman, H.M., Khan, S.J., Lim, R., McDonald, J.A., Nice, H., Nugegoda, D., Pettigrove, V., Tremblay, L.A., Warne, MSJ, Leusch, F.D.L. 2014. A National Survey of Trace Organic Contaminants in Australian Rivers. Journal of Environmental Quality 43: 1702-1712. Shao, X., Xia, S., Durkin, K.A., Casida, J.E., 2013. Insect nicotinic receptor interactions in vivo with neonicotinoid, organophosphorus, and methylcarbamate insecticides and a synergist. Proceedings of the National Academy of Sciences of the United States of America 110, 17273-17277. Smit, C.E., Posthuma-Doodeman, C., van Vlaardingen, P.L.A., de Jong, F.M.W., 2015. Ecotoxicity of Imidacloprid to Aquatic Organisms: Derivation of Water Quality Standards for Peak and Long-Term Exposure. Human and Ecological Risk Assessment 21, 1608-1630. Solomon, K.R., Giddings, J.M., Maund, S.J., 2001. Probabilistic risk assessment of cotton pyrethroids: I. Distributional analyses of laboratory aquatic toxicity data. Environmental Toxicology and Chemistry 20, 652-659. Soto,E., A. Larrain, Bay-Schmith, E. 2000. Sensitivity of Ampelisca araucana Juveniles (Crustacea: Amphipoda) to Organic and Inorganic Toxicants in Tests of Acute Toxicity. Bulletin of Environmental Contamination and Toxicology 64: 574-578. Stark, J.D., Vargas, R.I. 2005. Toxicity and Hazard assessment of fipronil to Daphnia pulex. Ecotoxicology and Environmental Safety 62:11-16. Stevens, M.M., Burdett, A.S., Mudford, E.M., Helliwell, S., Doran, G., 2011. The acute toxicity of fipronil to two non-target invertebrates associated with mosquito breeding sites in Australia. Acta Tropica 117, 125-130. Tatum,V.L., Borton, D.L., Streblow, W.R., Louch, J., Shepard J.P. 2012. Acute Toxicity of Commonly Used Forestry Herbicide Mixtures to Ceriodaphnia dubia and Pimephales promelas. Environ. Toxicol.27(12): 671-684.
57
Thompson,D.G., Holmes, S.B., Pitt, D.G., Solomon, K.R., Wainio-Keizer, K.L. 1990 Applying Concentration-Response Theory to Aquatic Enclosure Studies. In: R.L.Graney, J.H.Kennedy, and J.H.Rodgers (Eds.), Aquatic Mesocosm Studies in Ecological Risk Assessment, Lewis Publishers, Boca Raton, FL 11:129-156. U.S. Environmental Protection Agency. 1992. Pesticide Ecotoxicity Database (Formerly: Environmental Effects Database (EEDB)) Environmental Fate and Effects Division, U.S.EPA, Washington, D.C. Van Dijk, T.C., Van Staalduinen, M.A., Van der Sluijs, J.P., 2013. Macro-Invertebrate Decline in Surface Water Polluted with Imidacloprid. PloS one 8. Weston, D.P., Asbell, A.M., Hecht, S.A., Scholz, N.L., Lydy, M.J., 2011. Pyrethroid insecticides in urban salmon streams of the Pacific Northwest. Environmental pollution 159, 3051-3056. Weston, D.P., Lydy, M.J., 2014. Toxicity of the Insecticide Fipronil and Its Degradates to Benthic Macroinvertebrates of Urban Streams. Environmental science & technology 48, 1290-1297. Weston, D.P., Schlenk, D., Riar, N., Lydy, M.J., Brooks, M.L., 2015. Effects of pyrethroid insecticides in urban runoff on chinook salmon, steelhead trout, and their invertebrate prey. Environmental Toxicology and Chemistry 34, 649-657. Wu, J., Lu, J., Lu, H., Lin, Y., Wilson, P.C., 2015. Occurrence and ecological risks from fipronil in aquatic environments located within residential landscapes. Science of the Total Environment 518, 139-147. Xie, L.T., Thrippleton, K., Irwin, M.A., Siemering, G.S., Mekebri, A., Crane, D., Berry, K., Schlenk, D., 2005. Evaluation of estrogenic activities of aquatic herbicides and surfactants using an rainbow trout vitellogenin assay. Toxicological Sciences 87, 391-398. Xu, E.G., Bui, C., Lamerdin, C., Schlenk, D., 2016. Spatial and temporal assessment of environmental contaminants in water, sediments and fish of the Salton Sea and its two primary tributaries, California, USA, from 2002 to 2012. Science of the Total Environment 559, 130-140. Zhao, J.S., Chen, B.Y., 2016. Species sensitivity distribution for chlorpyrifos to aquatic organisms: Model choice and sample size. Ecotoxicology and Environmental Safety 125, 161-169.