Embed Size (px)
Citation preview
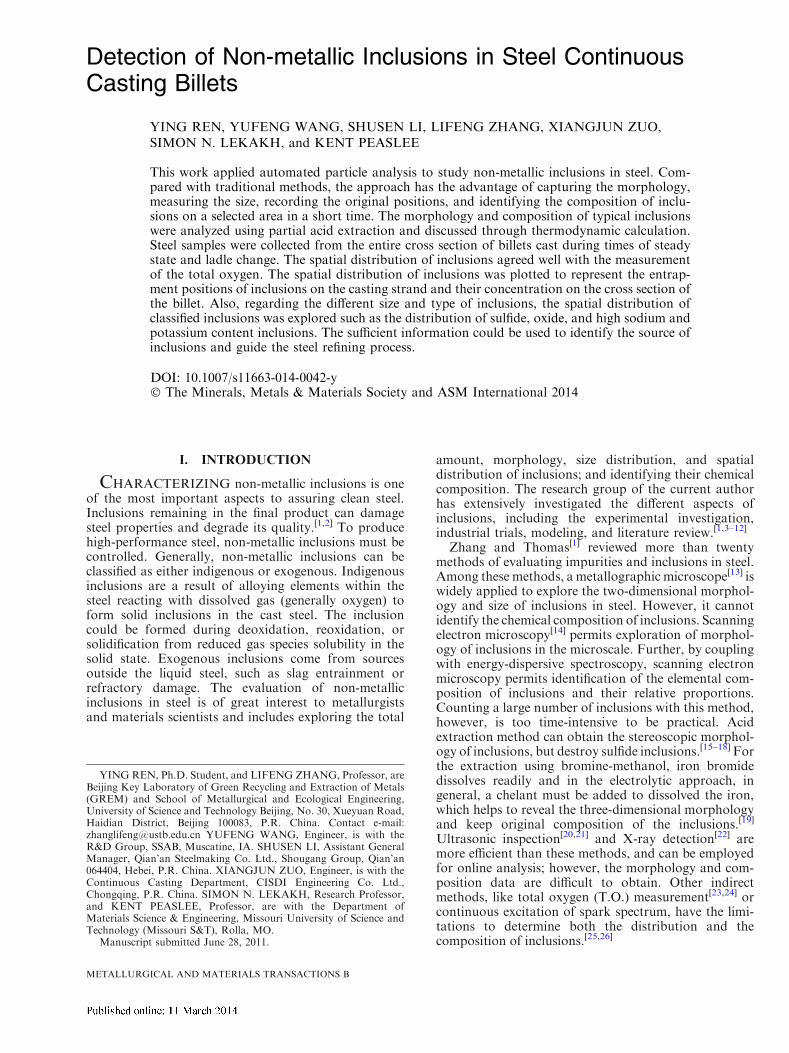
Detection of Non-metallic Inclusions in Steel ContinuousCasting Billets
YING REN, YUFENG WANG, SHUSEN LI, LIFENG ZHANG, XIANGJUN ZUO,SIMON N. LEKAKH, and KENT PEASLEE
This work applied automated particle analysis to study non-metallic inclusions in steel. Com-pared with traditional methods, the approach has the advantage of capturing the morphology,measuring the size, recording the original positions, and identifying the composition of inclu-sions on a selected area in a short time. The morphology and composition of typical inclusionswere analyzed using partial acid extraction and discussed through thermodynamic calculation.Steel samples were collected from the entire cross section of billets cast during times of steadystate and ladle change. The spatial distribution of inclusions agreed well with the measurementof the total oxygen. The spatial distribution of inclusions was plotted to represent the entrap-ment positions of inclusions on the casting strand and their concentration on the cross section ofthe billet. Also, regarding the different size and type of inclusions, the spatial distribution ofclassified inclusions was explored such as the distribution of sulfide, oxide, and high sodium andpotassium content inclusions. The sufficient information could be used to identify the source ofinclusions and guide the steel refining process.
DOI: 10.1007/s11663-014-0042-y� The Minerals, Metals & Materials Society and ASM International 2014
I. INTRODUCTION
CHARACTERIZING non-metallic inclusions is oneof the most important aspects to assuring clean steel.Inclusions remaining in the final product can damagesteel properties and degrade its quality.[1,2] To producehigh-performance steel, non-metallic inclusions must becontrolled. Generally, non-metallic inclusions can beclassified as either indigenous or exogenous. Indigenousinclusions are a result of alloying elements within thesteel reacting with dissolved gas (generally oxygen) toform solid inclusions in the cast steel. The inclusioncould be formed during deoxidation, reoxidation, orsolidification from reduced gas species solubility in thesolid state. Exogenous inclusions come from sourcesoutside the liquid steel, such as slag entrainment orrefractory damage. The evaluation of non-metallicinclusions in steel is of great interest to metallurgistsand materials scientists and includes exploring the total
amount, morphology, size distribution, and spatialdistribution of inclusions; and identifying their chemicalcomposition. The research group of the current authorhas extensively investigated the different aspects ofinclusions, including the experimental investigation,industrial trials, modeling, and literature review.[1,3–12]
Zhang and Thomas[1] reviewed more than twentymethods of evaluating impurities and inclusions in steel.Among these methods, a metallographic microscope[13] iswidely applied to explore the two-dimensional morphol-ogy and size of inclusions in steel. However, it cannotidentify the chemical composition of inclusions. Scanningelectron microscopy[14] permits exploration of morphol-ogy of inclusions in the microscale. Further, by couplingwith energy-dispersive spectroscopy, scanning electronmicroscopy permits identification of the elemental com-position of inclusions and their relative proportions.Counting a large number of inclusions with this method,however, is too time-intensive to be practical. Acidextraction method can obtain the stereoscopic morphol-ogy of inclusions, but destroy sulfide inclusions.[15–18] Forthe extraction using bromine-methanol, iron bromidedissolves readily and in the electrolytic approach, ingeneral, a chelant must be added to dissolved the iron,which helps to reveal the three-dimensional morphologyand keep original composition of the inclusions.[19]
Ultrasonic inspection[20,21] and X-ray detection[22] aremore efficient than these methods, and can be employedfor online analysis; however, the morphology and com-position data are difficult to obtain. Other indirectmethods, like total oxygen (T.O.) measurement[23,24] orcontinuous excitation of spark spectrum, have the limi-tations to determine both the distribution and thecomposition of inclusions.[25,26]
YING REN, Ph.D. Student, and LIFENG ZHANG, Professor, areBeijing Key Laboratory of Green Recycling and Extraction of Metals(GREM) and School of Metallurgical and Ecological Engineering,University of Science and Technology Beijing, No. 30, Xueyuan Road,Haidian District, Beijing 100083, P.R. China. Contact e-mail:[email protected] YUFENG WANG, Engineer, is with theR&D Group, SSAB, Muscatine, IA. SHUSEN LI, Assistant GeneralManager, Qian’an Steelmaking Co. Ltd., Shougang Group, Qian’an064404, Hebei, P.R. China. XIANGJUN ZUO, Engineer, is with theContinuous Casting Department, CISDI Engineering Co. Ltd.,Chongqing, P.R. China. SIMON N. LEKAKH, Research Professor,and KENT PEASLEE, Professor, are with the Department ofMaterials Science & Engineering, Missouri University of Science andTechnology (Missouri S&T), Rolla, MO.
Manuscript submitted June 28, 2011.
METALLURGICAL AND MATERIALS TRANSACTIONS B
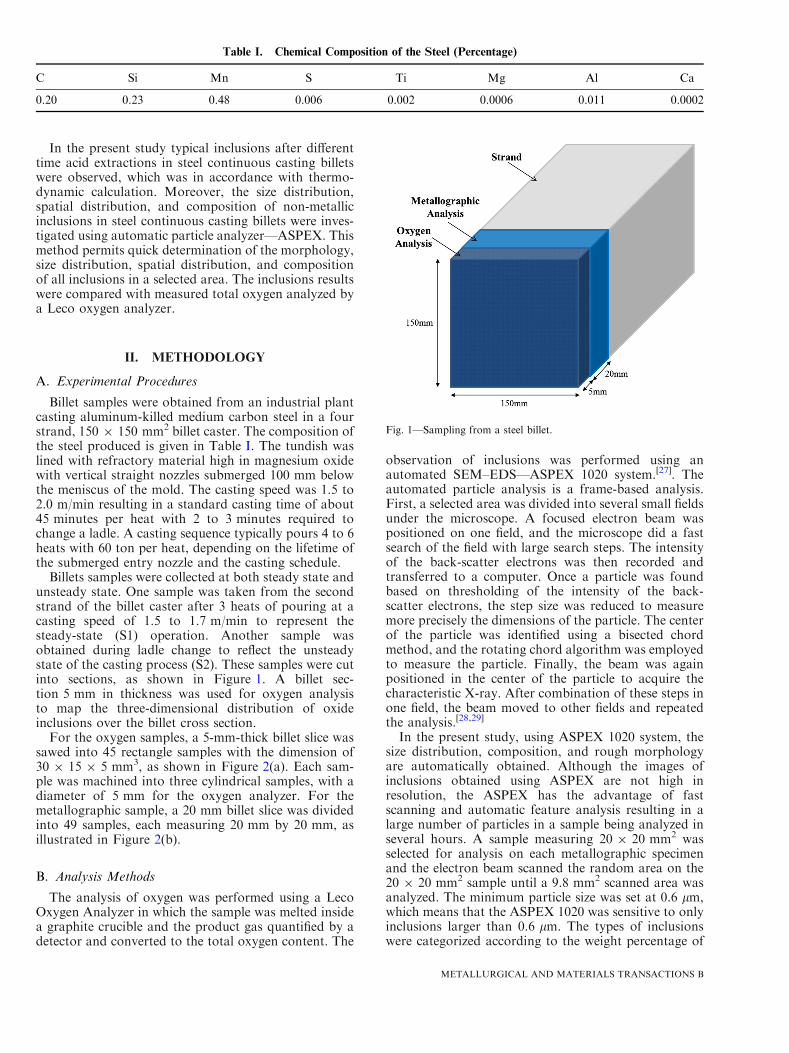
In the present study typical inclusions after differenttime acid extractions in steel continuous casting billetswere observed, which was in accordance with thermo-dynamic calculation. Moreover, the size distribution,spatial distribution, and composition of non-metallicinclusions in steel continuous casting billets were inves-tigated using automatic particle analyzer—ASPEX. Thismethod permits quick determination of the morphology,size distribution, spatial distribution, and compositionof all inclusions in a selected area. The inclusions resultswere compared with measured total oxygen analyzed bya Leco oxygen analyzer.
II. METHODOLOGY
A. Experimental Procedures
Billet samples were obtained from an industrial plantcasting aluminum-killed medium carbon steel in a fourstrand, 150 9 150 mm2 billet caster. The composition ofthe steel produced is given in Table I. The tundish waslined with refractory material high in magnesium oxidewith vertical straight nozzles submerged 100 mm belowthe meniscus of the mold. The casting speed was 1.5 to2.0 m/min resulting in a standard casting time of about45 minutes per heat with 2 to 3 minutes required tochange a ladle. A casting sequence typically pours 4 to 6heats with 60 ton per heat, depending on the lifetime ofthe submerged entry nozzle and the casting schedule.
Billets samples were collected at both steady state andunsteady state. One sample was taken from the secondstrand of the billet caster after 3 heats of pouring at acasting speed of 1.5 to 1.7 m/min to represent thesteady-state (S1) operation. Another sample wasobtained during ladle change to reflect the unsteadystate of the casting process (S2). These samples were cutinto sections, as shown in Figure 1. A billet sec-tion 5 mm in thickness was used for oxygen analysisto map the three-dimensional distribution of oxideinclusions over the billet cross section.
For the oxygen samples, a 5-mm-thick billet slice wassawed into 45 rectangle samples with the dimension of30 9 15 9 5 mm3, as shown in Figure 2(a). Each sam-ple was machined into three cylindrical samples, with adiameter of 5 mm for the oxygen analyzer. For themetallographic sample, a 20 mm billet slice was dividedinto 49 samples, each measuring 20 mm by 20 mm, asillustrated in Figure 2(b).
B. Analysis Methods
The analysis of oxygen was performed using a LecoOxygen Analyzer in which the sample was melted insidea graphite crucible and the product gas quantified by adetector and converted to the total oxygen content. The
observation of inclusions was performed using anautomated SEM–EDS—ASPEX 1020 system.[27]. Theautomated particle analysis is a frame-based analysis.First, a selected area was divided into several small fieldsunder the microscope. A focused electron beam waspositioned on one field, and the microscope did a fastsearch of the field with large search steps. The intensityof the back-scatter electrons was then recorded andtransferred to a computer. Once a particle was foundbased on thresholding of the intensity of the back-scatter electrons, the step size was reduced to measuremore precisely the dimensions of the particle. The centerof the particle was identified using a bisected chordmethod, and the rotating chord algorithm was employedto measure the particle. Finally, the beam was againpositioned in the center of the particle to acquire thecharacteristic X-ray. After combination of these steps inone field, the beam moved to other fields and repeatedthe analysis.[28,29]
In the present study, using ASPEX 1020 system, thesize distribution, composition, and rough morphologyare automatically obtained. Although the images ofinclusions obtained using ASPEX are not high inresolution, the ASPEX has the advantage of fastscanning and automatic feature analysis resulting in alarge number of particles in a sample being analyzed inseveral hours. A sample measuring 20 9 20 mm2 wasselected for analysis on each metallographic specimenand the electron beam scanned the random area on the20 9 20 mm2 sample until a 9.8 mm2 scanned area wasanalyzed. The minimum particle size was set at 0.6 lm,which means that the ASPEX 1020 was sensitive to onlyinclusions larger than 0.6 lm. The types of inclusionswere categorized according to the weight percentage of
Table I. Chemical Composition of the Steel (Percentage)
C Si Mn S Ti Mg Al Ca
0.20 0.23 0.48 0.006 0.002 0.0006 0.011 0.0002
Fig. 1—Sampling from a steel billet.
METALLURGICAL AND MATERIALS TRANSACTIONS B
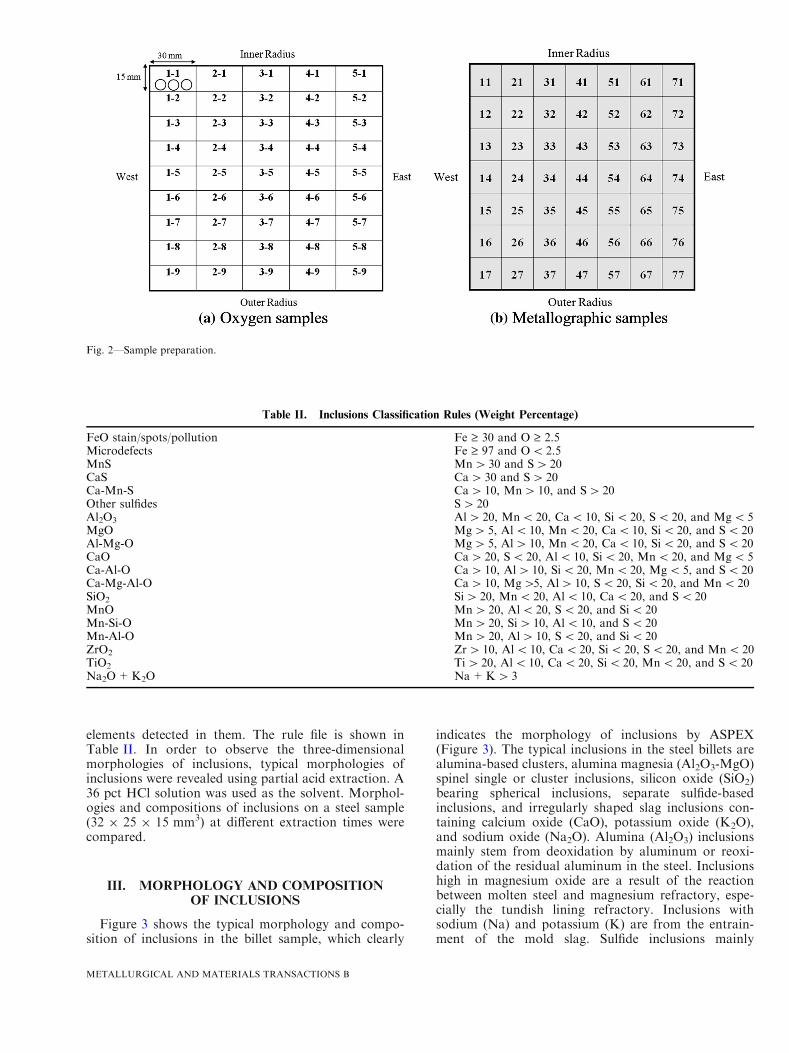
elements detected in them. The rule file is shown inTable II. In order to observe the three-dimensionalmorphologies of inclusions, typical morphologies ofinclusions were revealed using partial acid extraction. A36 pct HCl solution was used as the solvent. Morphol-ogies and compositions of inclusions on a steel sample(32 9 25 9 15 mm3) at different extraction times werecompared.
III. MORPHOLOGY AND COMPOSITIONOF INCLUSIONS
Figure 3 shows the typical morphology and compo-sition of inclusions in the billet sample, which clearly
indicates the morphology of inclusions by ASPEX(Figure 3). The typical inclusions in the steel billets arealumina-based clusters, alumina magnesia (Al2O3-MgO)spinel single or cluster inclusions, silicon oxide (SiO2)bearing spherical inclusions, separate sulfide-basedinclusions, and irregularly shaped slag inclusions con-taining calcium oxide (CaO), potassium oxide (K2O),and sodium oxide (Na2O). Alumina (Al2O3) inclusionsmainly stem from deoxidation by aluminum or reoxi-dation of the residual aluminum in the steel. Inclusionshigh in magnesium oxide are a result of the reactionbetween molten steel and magnesium refractory, espe-cially the tundish lining refractory. Inclusions withsodium (Na) and potassium (K) are from the entrain-ment of the mold slag. Sulfide inclusions mainly
Fig. 2—Sample preparation.
Table II. Inclusions Classification Rules (Weight Percentage)
FeO stain/spots/pollution Fe ‡ 30 and O ‡ 2.5Microdefects Fe ‡ 97 and O< 2.5MnS Mn> 30 and S> 20CaS Ca> 30 and S> 20Ca-Mn-S Ca> 10, Mn> 10, and S> 20Other sulfides S> 20Al2O3 Al> 20, Mn< 20, Ca< 10, Si< 20, S< 20, and Mg< 5MgO Mg> 5, Al< 10, Mn< 20, Ca< 10, Si< 20, and S< 20Al-Mg-O Mg> 5, Al> 10, Mn< 20, Ca< 10, Si< 20, and S< 20CaO Ca> 20, S< 20, Al< 10, Si< 20, Mn< 20, and Mg< 5Ca-Al-O Ca> 10, Al> 10, Si< 20, Mn< 20, Mg< 5, and S< 20Ca-Mg-Al-O Ca> 10, Mg>5, Al> 10, S< 20, Si< 20, and Mn< 20SiO2 Si> 20, Mn< 20, Al< 10, Ca< 20, and S< 20MnO Mn> 20, Al< 20, S< 20, and Si< 20Mn-Si-O Mn> 20, Si> 10, Al< 10, and S< 20Mn-Al-O Mn> 20, Al> 10, S< 20, and Si< 20ZrO2 Zr> 10, Al< 10, Ca< 20, Si< 20, S< 20, and Mn< 20TiO2 Ti> 20, Al< 10, Ca< 20, Si< 20, Mn< 20, and S< 20Na2O+K2O Na+K> 3
METALLURGICAL AND MATERIALS TRANSACTIONS B
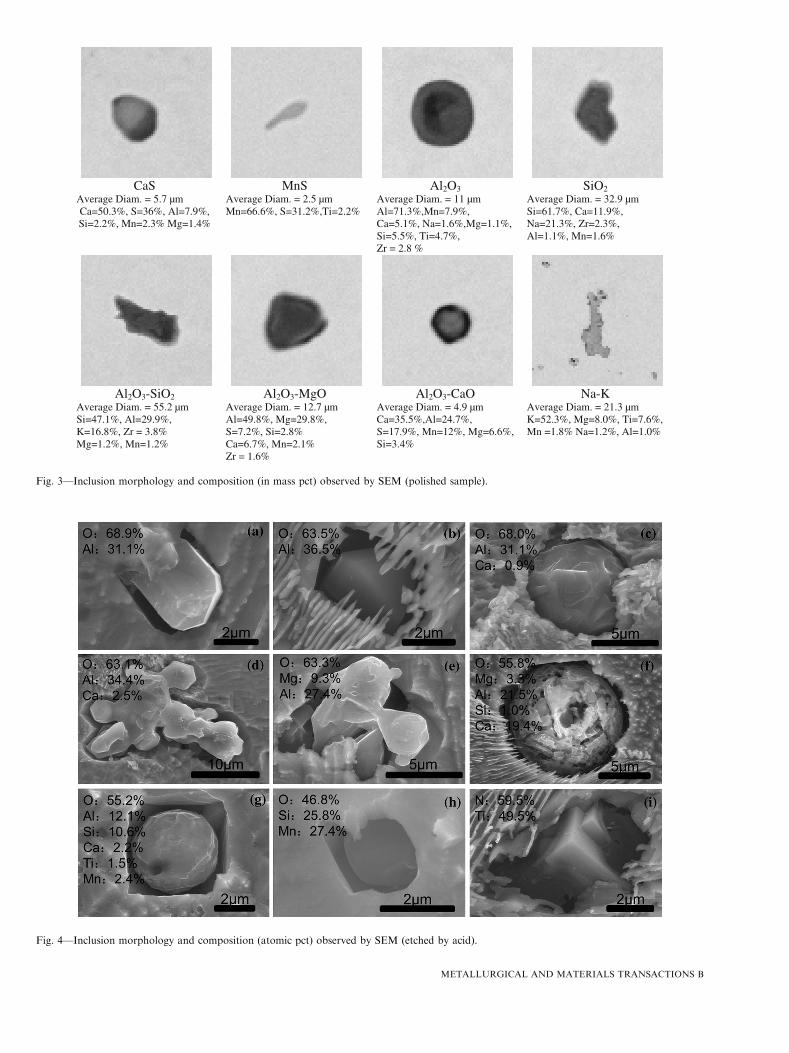
CaSAverage Diam. = 5.7 µmCa=50.3%, S=36%, Al=7.9%, Si=2.2%, Mn=2.3% Mg=1.4%
MnSAverage Diam. = 2.5 µmMn=66.6%, S=31.2%,Ti=2.2%
Al2O3Average Diam. = 11 µmAl=71.3%,Mn=7.9%, Ca=5.1%, Na=1.6%,Mg=1.1%,Si=5.5%, Ti=4.7%,Zr = 2.8 %
SiO2Average Diam. = 32.9 µmSi=61.7%, Ca=11.9%,Na=21.3%, Zr=2.3%, Al=1.1%, Mn=1.6%
Al2O3-SiO2Average Diam. = 55.2 µmSi=47.1%, Al=29.9%,K=16.8%, Zr = 3.8%Mg=1.2%, Mn=1.2%
Al2O3-MgOAverage Diam. = 12.7 µmAl=49.8%, Mg=29.8%,S=7.2%, Si=2.8%Ca=6.7%, Mn=2.1%Zr = 1.6%
Al2O3-CaOAverage Diam. = 4.9 µmCa=35.5%,Al=24.7%,S=17.9%, Mn=12%, Mg=6.6%, Si=3.4%
Na-KAverage Diam. = 21.3 µmK=52.3%, Mg=8.0%, Ti=7.6%,Mn =1.8% Na=1.2%, Al=1.0%
Fig. 3—Inclusion morphology and composition (in mass pct) observed by SEM (polished sample).
Fig. 4—Inclusion morphology and composition (atomic pct) observed by SEM (etched by acid).
METALLURGICAL AND MATERIALS TRANSACTIONS B
No.Compositions
(atom %)Inclusions after different time acid extraction
(a)
O 69.1%
Al 28.0%
Ca 2.9%
(b)
O 67.2%
Mg 6.0
Al 25.9%
Ca 0.9%
(c)
O 60.0%
Al 39.1%
Ca 0.9%
(d)
O 58.5%
Al 26.2%
Ca 15.3%
(e)
O 68.8%
Al 8.7%
Si 15.0%
Mn 7.4%
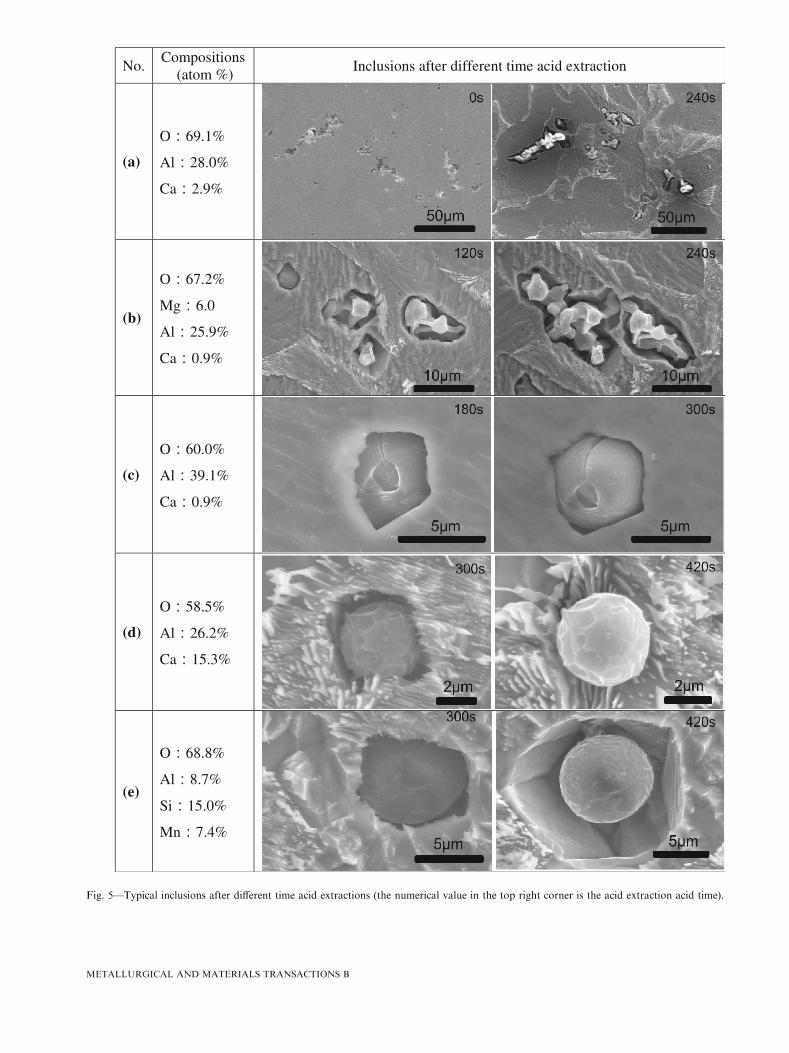
Fig. 5—Typical inclusions after different time acid extractions (the numerical value in the top right corner is the acid extraction acid time).
METALLURGICAL AND MATERIALS TRANSACTIONS B
precipitate during cooling and solidification of the steel.The optical resolution from ASPEX was set for provid-ing sufficient information to determine the diameter,area, and perimeter of inclusions with reasonable
analytical time and storage space for thousands ofcounted inclusions.The morphology and composition of typical inclu-
sions etched by acid were detected using SEM–EDS
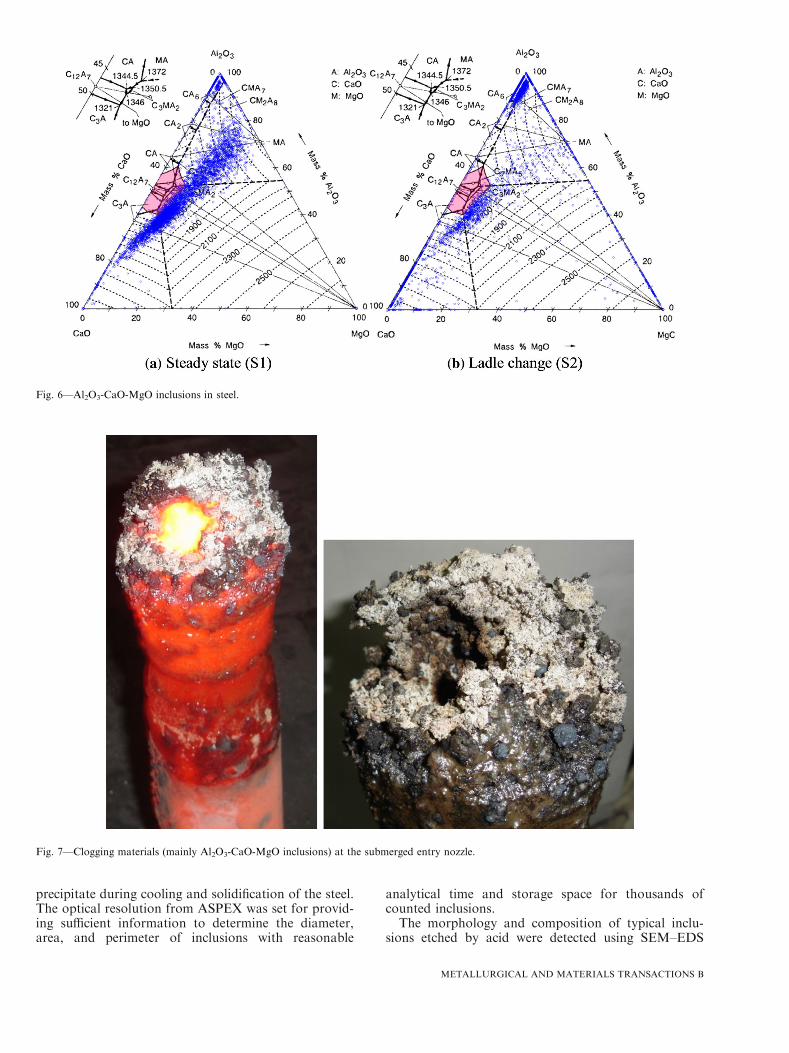
Fig. 6—Al2O3-CaO-MgO inclusions in steel.
Fig. 7—Clogging materials (mainly Al2O3-CaO-MgO inclusions) at the submerged entry nozzle.
METALLURGICAL AND MATERIALS TRANSACTIONS B
(Figure 4). Figures 4(a) through (d) are plate-like,angular, spherical, and irregular Al2O3-based inclusions.Precipitation of different shape individual aluminaparticles along with the decrease of supersaturationdegree of deoxidizing elements in the initial stage ofholding time after deoxidation occurred.[18] Meanwhile,plenty of Al2O3-MgO spinel inclusions were generated,as shown in Figure 4(e). There were spherical calciumaluminate and silicon aluminate inclusions (Figures 4(f)and (g)). Spherical Si-Mn-O inclusions and hexahedral-like TiN inclusions were also found, as shown inFigures 4(h) and (i). After the acid extraction, CaSand MnS disappeared since sulfide reacted with theacid.[15,17]
The three-dimensional morphologies of inclusionswere revealed using partial acid extraction (Figure 5).After acid extraction, separate Al2O3 and Al2O3-MgOsingle particles were revealed to big clustered inclusions(Figures 5(a) and (b)). In Figure 5(c), the diameter ofspherical Al2O3-based inclusions after 300s acid extrac-tion was larger than that under 180s acid extractioncondition. Inclusions of Al2O3-CaO and Al-Si-Mn-Oshown in Figures 5(d) and (e) were nearly spherical dueto the fact that their melting temperature was lower thanthe temperature of the molten steel.
Figure 6 shows the ternary diagram of oxides basedon the chemical composition of Al2O3, CaO, and MgO.Each individual spot in this ternary diagram representsthe composition of an inclusion. In continuous casting,solid particles can attach to the nozzle and may blockthe path of the molten steel. To prevent nozzle clogging,inclusions should be in the liquid state. However, thecomposition distribution indicates that most inclusionswere solid under casting temperature. Only a few were inthe liquid state, as illustrated by the shaded region[temperature <1773 K (1500 �C)] in the ternary dia-gram. The samples from both steady state (S1) and ladlechange (S2) show that many particles were close to theAl2O3 region. Excess MgO would raise the melting pointof inclusions. Several inclusions on the ternary diagramhad magnesium oxide contents greater than 30 pct,indicating that the melting temperature of these particleswas over 2573 K (2300 �C), and thus these inclusionswere solid throughout the casting process. Since many
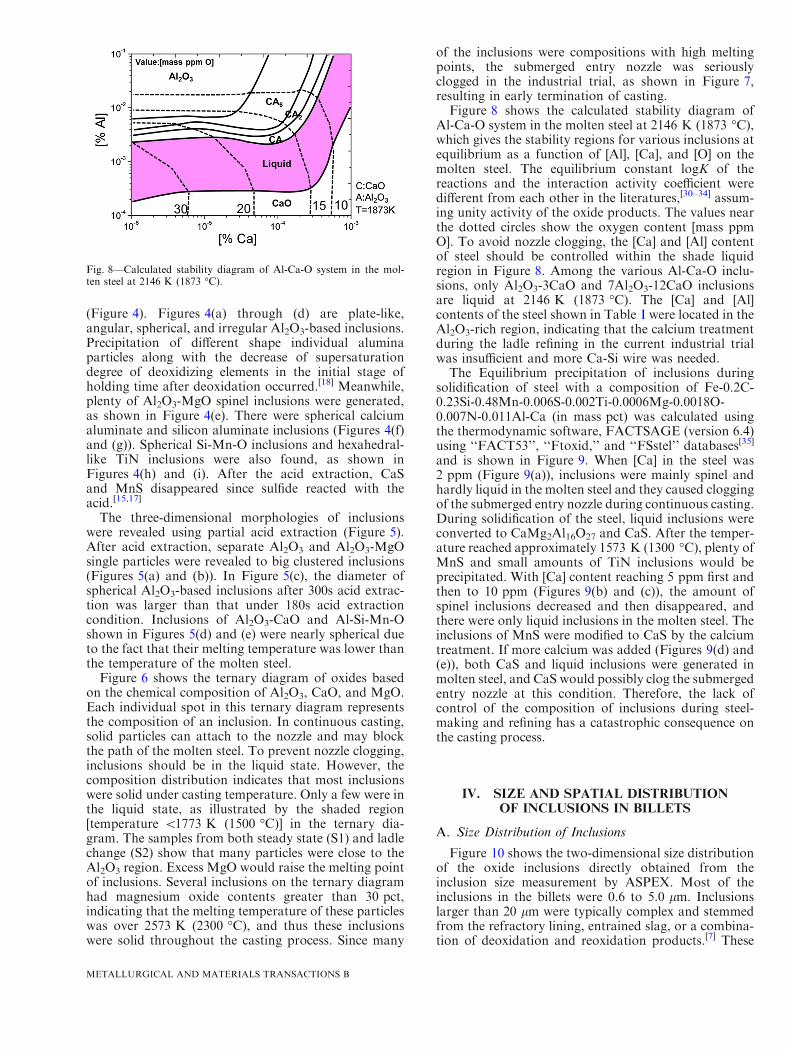
of the inclusions were compositions with high meltingpoints, the submerged entry nozzle was seriouslyclogged in the industrial trial, as shown in Figure 7,resulting in early termination of casting.Figure 8 shows the calculated stability diagram of
Al-Ca-O system in the molten steel at 2146 K (1873 �C),which gives the stability regions for various inclusions atequilibrium as a function of [Al], [Ca], and [O] on themolten steel. The equilibrium constant logK of thereactions and the interaction activity coefficient weredifferent from each other in the literatures,[30–34] assum-ing unity activity of the oxide products. The values nearthe dotted circles show the oxygen content [mass ppmO]. To avoid nozzle clogging, the [Ca] and [Al] contentof steel should be controlled within the shade liquidregion in Figure 8. Among the various Al-Ca-O inclu-sions, only Al2O3-3CaO and 7Al2O3-12CaO inclusionsare liquid at 2146 K (1873 �C). The [Ca] and [Al]contents of the steel shown in Table I were located in theAl2O3-rich region, indicating that the calcium treatmentduring the ladle refining in the current industrial trialwas insufficient and more Ca-Si wire was needed.The Equilibrium precipitation of inclusions during
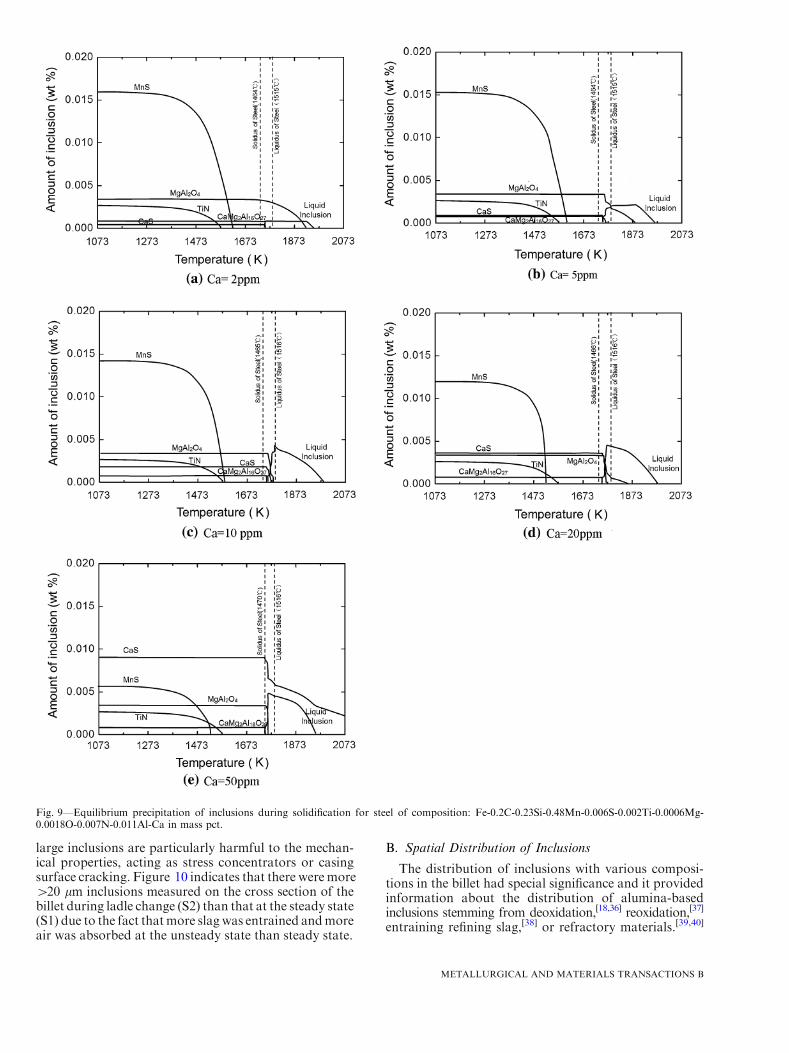
solidification of steel with a composition of Fe-0.2C-0.23Si-0.48Mn-0.006S-0.002Ti-0.0006Mg-0.0018O-0.007N-0.011Al-Ca (in mass pct) was calculated usingthe thermodynamic software, FACTSAGE (version 6.4)using ‘‘FACT53’’, ‘‘Ftoxid,’’ and ‘‘FSstel’’ databases[35]
and is shown in Figure 9. When [Ca] in the steel was2 ppm (Figure 9(a)), inclusions were mainly spinel andhardly liquid in the molten steel and they caused cloggingof the submerged entry nozzle during continuous casting.During solidification of the steel, liquid inclusions wereconverted to CaMg2Al16O27 and CaS. After the temper-ature reached approximately 1573 K (1300 �C), plenty ofMnS and small amounts of TiN inclusions would beprecipitated. With [Ca] content reaching 5 ppm first andthen to 10 ppm (Figures 9(b) and (c)), the amount ofspinel inclusions decreased and then disappeared, andthere were only liquid inclusions in the molten steel. Theinclusions of MnS were modified to CaS by the calciumtreatment. If more calcium was added (Figures 9(d) and(e)), both CaS and liquid inclusions were generated inmolten steel, and CaS would possibly clog the submergedentry nozzle at this condition. Therefore, the lack ofcontrol of the composition of inclusions during steel-making and refining has a catastrophic consequence onthe casting process.
IV. SIZE AND SPATIAL DISTRIBUTIONOF INCLUSIONS IN BILLETS
A. Size Distribution of Inclusions
Figure 10 shows the two-dimensional size distributionof the oxide inclusions directly obtained from theinclusion size measurement by ASPEX. Most of theinclusions in the billets were 0.6 to 5.0 lm. Inclusionslarger than 20 lm were typically complex and stemmedfrom the refractory lining, entrained slag, or a combina-tion of deoxidation and reoxidation products.[7] These
Fig. 8—Calculated stability diagram of Al-Ca-O system in the mol-ten steel at 2146 K (1873 �C).
METALLURGICAL AND MATERIALS TRANSACTIONS B
large inclusions are particularly harmful to the mechan-ical properties, acting as stress concentrators or casingsurface cracking. Figure 10 indicates that there weremore>20 lm inclusions measured on the cross section of thebillet during ladle change (S2) than that at the steady state(S1) due to the fact thatmore slag was entrained andmoreair was absorbed at the unsteady state than steady state.
B. Spatial Distribution of Inclusions
The distribution of inclusions with various composi-tions in the billet had special significance and it providedinformation about the distribution of alumina-basedinclusions stemming from deoxidation,[18,36] reoxidation,[37]
entraining refining slag,[38] or refractory materials.[39,40]
Fig. 9—Equilibrium precipitation of inclusions during solidification for steel of composition: Fe-0.2C-0.23Si-0.48Mn-0.006S-0.002Ti-0.0006Mg-0.0018O-0.007N-0.011Al-Ca in mass pct.
METALLURGICAL AND MATERIALS TRANSACTIONS B
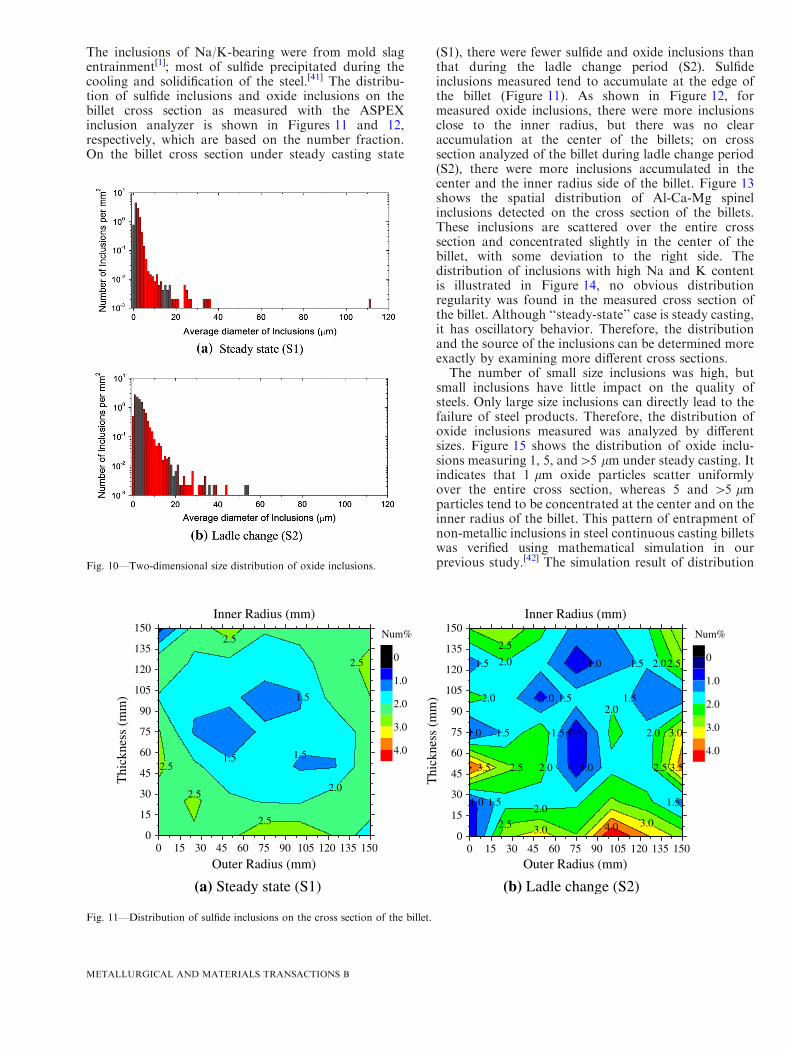
The inclusions of Na/K-bearing were from mold slagentrainment[1]; most of sulfide precipitated during thecooling and solidification of the steel.[41] The distribu-tion of sulfide inclusions and oxide inclusions on thebillet cross section as measured with the ASPEXinclusion analyzer is shown in Figures 11 and 12,respectively, which are based on the number fraction.On the billet cross section under steady casting state
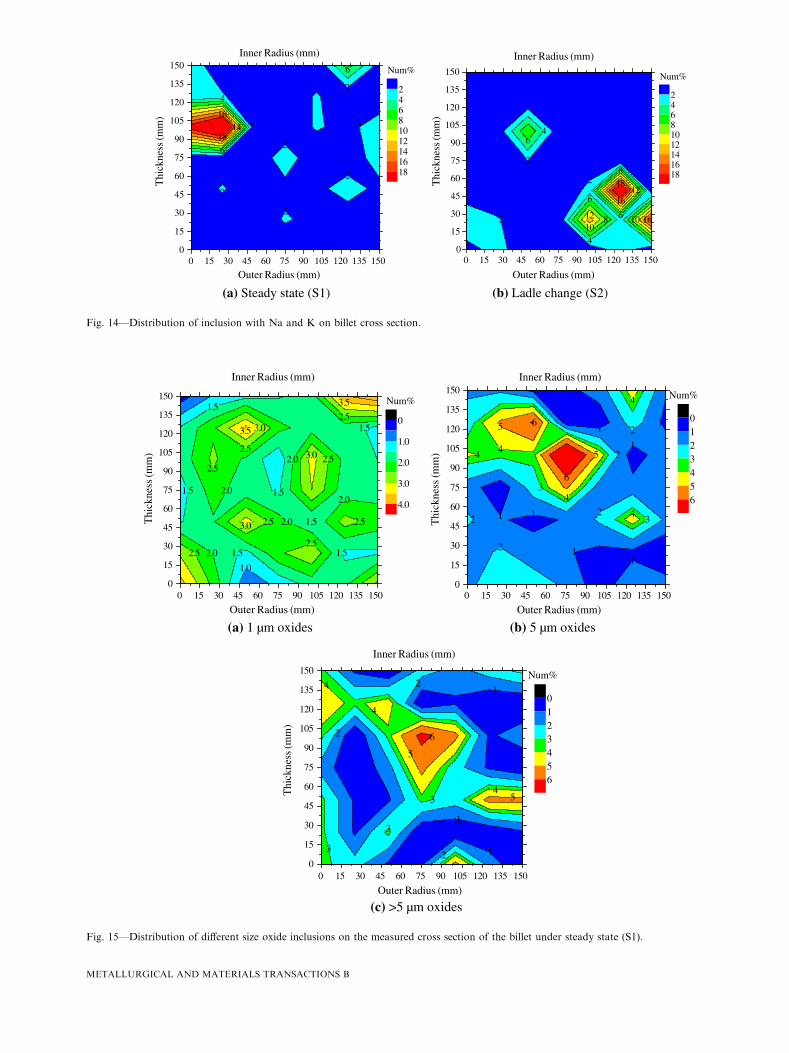
(S1), there were fewer sulfide and oxide inclusions thanthat during the ladle change period (S2). Sulfideinclusions measured tend to accumulate at the edge ofthe billet (Figure 11). As shown in Figure 12, formeasured oxide inclusions, there were more inclusionsclose to the inner radius, but there was no clearaccumulation at the center of the billets; on crosssection analyzed of the billet during ladle change period(S2), there were more inclusions accumulated in thecenter and the inner radius side of the billet. Figure 13shows the spatial distribution of Al-Ca-Mg spinelinclusions detected on the cross section of the billets.These inclusions are scattered over the entire crosssection and concentrated slightly in the center of thebillet, with some deviation to the right side. Thedistribution of inclusions with high Na and K contentis illustrated in Figure 14, no obvious distributionregularity was found in the measured cross section ofthe billet. Although ‘‘steady-state’’ case is steady casting,it has oscillatory behavior. Therefore, the distributionand the source of the inclusions can be determined moreexactly by examining more different cross sections.The number of small size inclusions was high, but
small inclusions have little impact on the quality ofsteels. Only large size inclusions can directly lead to thefailure of steel products. Therefore, the distribution ofoxide inclusions measured was analyzed by differentsizes. Figure 15 shows the distribution of oxide inclu-sions measuring 1, 5, and>5 lm under steady casting. Itindicates that 1 lm oxide particles scatter uniformlyover the entire cross section, whereas 5 and >5 lmparticles tend to be concentrated at the center and on theinner radius of the billet. This pattern of entrapment ofnon-metallic inclusions in steel continuous casting billetswas verified using mathematical simulation in ourprevious study.[42] The simulation result of distributionFig. 10—Two-dimensional size distribution of oxide inclusions.
2.0
2.5
2.5
2.5
2.5
1.5
1.5
1.5
2.5
0 15 30 45 60 75 90 105 120 135 1500
15
30
45
60
75
90
105
120
135
150
Thi
ckne
ss (
mm
)
Inner Radius (mm)
Outer Radius (mm)
0
1.0
2.0
3.0
4.0
Num%
1.0 1.52.0
2.0
1.5
2.5
2.0
2.0
1.5
3.0
2.0
2.52.5
2.5
2.5
3.01.5
3.0 4.0
2.0
1.5
3.5 3.5
1.5
1.0 1.5
1.5
1.0
1.0
2.01.0
0.5
0 15 30 45 60 75 90 105 120 135 1500
15
30
45
60
75
90
105
120
135
150
Thi
ckne
ss (
mm
)
Inner Radius (mm)
Outer Radius (mm)
0
1.0
2.0
3.0
4.0
Num%
(a) Steady state (S1) (b) Ladle change (S2)
Fig. 11—Distribution of sulfide inclusions on the cross section of the billet.
METALLURGICAL AND MATERIALS TRANSACTIONS B
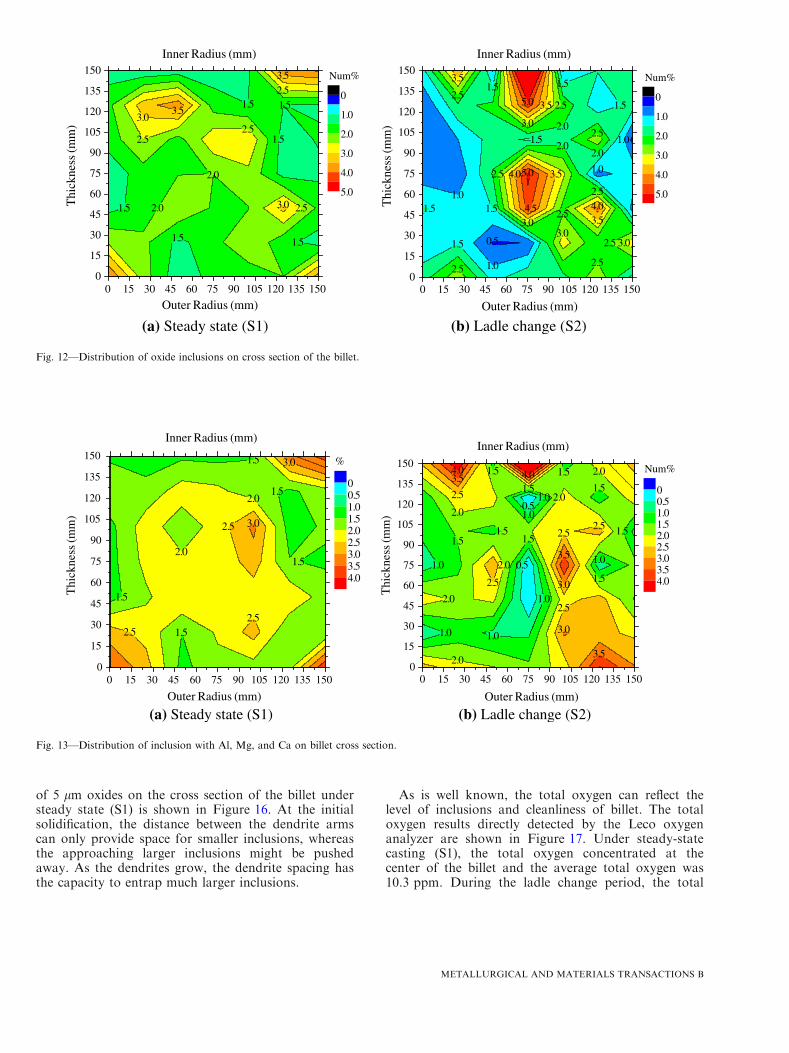
of 5 lm oxides on the cross section of the billet understeady state (S1) is shown in Figure 16. At the initialsolidification, the distance between the dendrite armscan only provide space for smaller inclusions, whereasthe approaching larger inclusions might be pushedaway. As the dendrites grow, the dendrite spacing hasthe capacity to entrap much larger inclusions.
As is well known, the total oxygen can reflect thelevel of inclusions and cleanliness of billet. The totaloxygen results directly detected by the Leco oxygenanalyzer are shown in Figure 17. Under steady-statecasting (S1), the total oxygen concentrated at thecenter of the billet and the average total oxygen was10.3 ppm. During the ladle change period, the total
2.0
2.0
1.5
1.5
1.5
2.5
1.5
1.5
3.5
1.5
2.52.5
3.0
2.5
3.5
3.0
0 15 30 45 60 75 90 105 120 135 1500
15
30
45
60
75
90
105
120
135
150
Inner Radius (mm)
Outer Radius (mm)
Thi
ckne
ss (m
m)
0
1.0
2.0
3.0
4.0
5.0
Num%
1.5
1.5
2.0
2.0
1.0
2.5
3.0
3.52.5
5.0
2.5
1.5
1.0
2.52.5
1.5
3.0
3.5
1.5 2.5
2.5
3.0
3.5
1.0
4.0
2.5
1.5
2.0
4.53.5
2.5
3.0
1.0
0.5
5.0
4.0
1.5
0 15 30 45 60 75 90 105 120 135 1500
15
30
45
60
75
90
105
120
135
150
Inner Radius (mm)
Outer Radius (mm)
Thi
ckne
ss (m
m)
0
1.0
2.0
3.0
4.0
5.0
Num%
(a) Steady state (S1) (b) Ladle change (S2)
Fig. 12—Distribution of oxide inclusions on cross section of the billet.
2.5
2.0
1.5
1.5
3.0
1.5
1.5
2.5
1.5
2.0
2.5
3.0
0 15 30 45 60 75 90 105 120 135 1500
15
30
45
60
75
90
105
120
135
150
Inner Radius (mm)
Outer Radius (mm)
Thi
ckne
ss (m
m)
00.51.01.52.02.53.03.54.0
%
2.0
2.0
1.5
2.5
2.0
1.5
2.0
2.5
1.5
1.0
3.5
3.5
1.0
4.0
2.0
1.54.0 1.5
1.0
1.0
2.0
2.5
1.5
0.51.5
3.0
1.0
1.0
2.5
1.5 2.5
1.5
3.5
0.5
1.0
3.0
0 15 30 45 60 75 90 105 120 135 1500
15
30
45
60
75
90
105
120
135
150
Inner Radius (mm)
Outer Radius (mm)
Thi
ckne
ss (m
m)
00.51.01.52.02.53.03.54.0
Num%
(a) Steady state (S1) (b) Ladle change (S2)
Fig. 13—Distribution of inclusion with Al, Mg, and Ca on billet cross section.
METALLURGICAL AND MATERIALS TRANSACTIONS B
2.5 2.0
2.0
1.5
1.52.5
3.5
1.5
1.0
1.5
1.5
2.0
2.0
2.0 2.52.5
1.5
2.5
2.5
3.0
3.0
2.5
2.5
3.0
3.5
1.5
0 15 30 45 60 75 90 105 120 135 1500
15
30
45
60
75
90
105
120
135
150
Inner Radius (mm)
Outer Radius (mm)
Thi
ckne
ss (m
m)
0
1.0
2.0
3.0
4.0
Num%
2
3
1
1
2
2
1
1
4
2
4
4
4
2
5
5
6
1 1 3
1
4
6
0 15 30 45 60 75 90 105 120 135 1500
15
30
45
60
75
90
105
120
135
150Inner Radius (mm)
Outer Radius (mm)
Thi
ckne
ss (m
m)
0123456
Num%
(a) 1 µm oxides (b) 5 µm oxides
0 15 30 45 60 75 90 105 120 135 1500
15
30
45
60
75
90
105
120
135
150
1
4 12
1
2
5
4
3
3
3
2
4
5
Inner Radius (mm)
Outer Radius (mm)
Thi
ckne
ss (m
m)
0123456
Num%
6
(c) >5 µm oxides
Fig. 15—Distribution of different size oxide inclusions on the measured cross section of the billet under steady state (S1).
2
4
6
14 216
2
18
6
2
2
2
2
0 15 30 45 60 75 90 105 120 135 1500
15
30
45
60
75
90
105
120
135
150Inner Radius (mm)
Outer Radius (mm)
Thi
ckne
ss (m
m)
24681012141618
Num%
2
2
10 16
2
6
4
8
6
4
12
8
16
10
6
18
12
0 15 30 45 60 75 90 105 120 135 1500
15
30
45
60
75
90
105
120
135
150
Inner Radius (mm)
Outer Radius (mm)
Thi
ckne
ss (m
m)
24681012141618
Num%
(a) Steady state (S1) (b) Ladle change (S2)
Fig. 14—Distribution of inclusion with Na and K on billet cross section.
METALLURGICAL AND MATERIALS TRANSACTIONS B
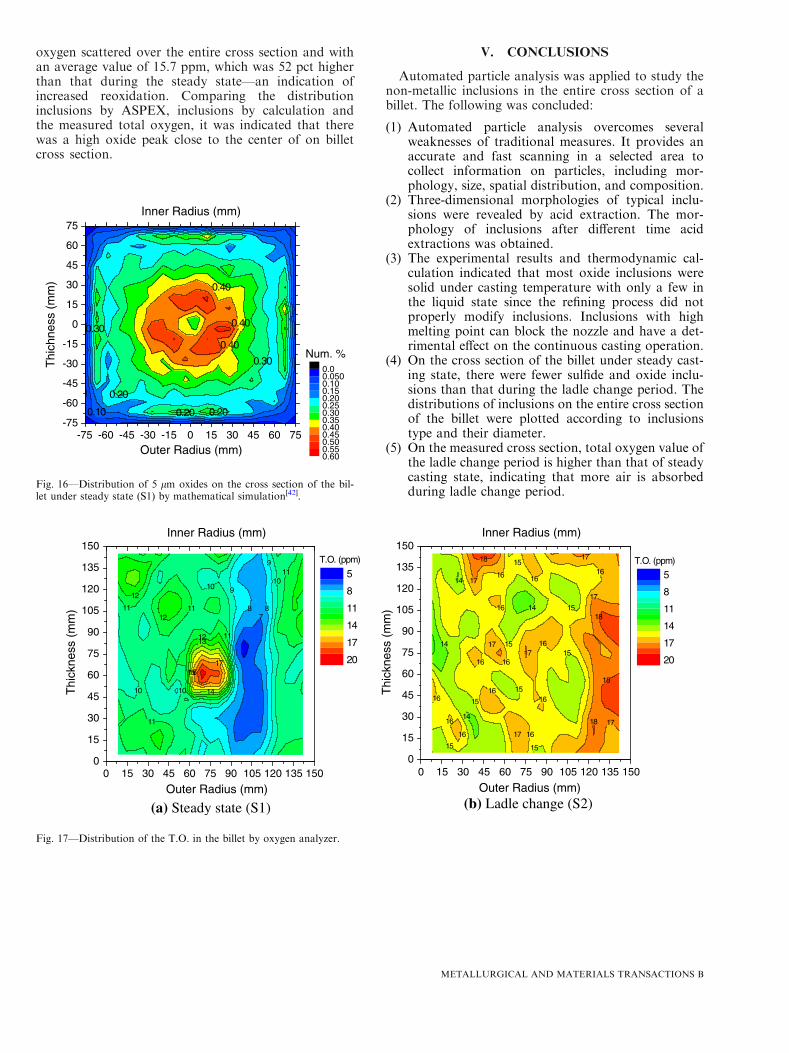
oxygen scattered over the entire cross section and withan average value of 15.7 ppm, which was 52 pct higherthan that during the steady state—an indication ofincreased reoxidation. Comparing the distributioninclusions by ASPEX, inclusions by calculation andthe measured total oxygen, it was indicated that therewas a high oxide peak close to the center of on billetcross section.
V. CONCLUSIONS
Automated particle analysis was applied to study thenon-metallic inclusions in the entire cross section of abillet. The following was concluded:
(1) Automated particle analysis overcomes severalweaknesses of traditional measures. It provides anaccurate and fast scanning in a selected area tocollect information on particles, including mor-phology, size, spatial distribution, and composition.
(2) Three-dimensional morphologies of typical inclu-sions were revealed by acid extraction. The mor-phology of inclusions after different time acidextractions was obtained.
(3) The experimental results and thermodynamic cal-culation indicated that most oxide inclusions weresolid under casting temperature with only a few inthe liquid state since the refining process did notproperly modify inclusions. Inclusions with highmelting point can block the nozzle and have a det-rimental effect on the continuous casting operation.
(4) On the cross section of the billet under steady cast-ing state, there were fewer sulfide and oxide inclu-sions than that during the ladle change period. Thedistributions of inclusions on the entire cross sectionof the billet were plotted according to inclusionstype and their diameter.
(5) On the measured cross section, total oxygen value ofthe ladle change period is higher than that of steadycasting state, indicating that more air is absorbedduring ladle change period.
0.10 0.200.20
0.20
0.30
0.40
0.40
0.40
0.30
-75 -60 -45 -30 -15 0 15 30 45 60 75-75
-60
-45
-30
-15
0
15
30
45
60
75 Inner Radius (mm)
Outer Radius (mm)
Thi
chne
ss (
mm
)
0.00.0500.100.150.200.250.300.350.400.450.500.550.60
Num. %
Fig. 16—Distribution of 5 lm oxides on the cross section of the bil-let under steady state (S1) by mathematical simulation[42].
10 9
8 8
9
10
11
11
11
12
10
11
7
1213
11
14
15
10
1617
12
0 15 30 45 60 75 90 105 120 135 1500
15
30
45
60
75
90
105
120
135
150 Inner Radius (mm)
Outer Radius (mm)
Thi
ckne
ss (
mm
)
5
8
11
14
17
20
T.O. (ppm)
15
16
17
15
16
16
18
14
17
18
17
16
18
15
16
17
1515
16
15
16
1516
14
16
16
14
16
16
17
18
14
16
15
17
17
0 15 30 45 60 75 90 105 120 135 1500
15
30
45
60
75
90
105
120
135
150 Inner Radius (mm)
Outer Radius (mm)
Thi
ckne
ss (
mm
)
5
8
11
14
17
20
T.O. (ppm)
(a) Steady state (S1) (b) Ladle change (S2)
Fig. 17—Distribution of the T.O. in the billet by oxygen analyzer.
METALLURGICAL AND MATERIALS TRANSACTIONS B
ACKNOWLEDGMENTS
The authors are grateful for support from theNational Science Foundation China (Grant Nos.51274034 and 51334002), Beijing Key Laboratory ofGreen Recycling and Extraction of Metals (GREM),the Laboratory of Green Process Metallurgy andModeling (GPM2), and the High Quality steel Consor-tium (HQSC) at the School of Metallurgical and Eco-logical Engineering at University of Science andTechnology Beijing (USTB), China.
REFERENCES1. L. Zhang and B.G. Thomas: ISIJ Int., 2003, vol. 43 (3), pp. 271–
91.2. T. Ehara, Y. Kurose, and T. Fujimura: 79th Steelmaking Confer-
ence Proceeding, ISS, Warrendale, PA, 1996, vol. 79, pp. 485–86.3. L. Zhang and B.G. Thomas: 7th European Electric Steelmaking
Conference, Venice, Italy, Associazione Italiana di Metallurgia,Milano, 2002, vol. II, pp. 277–86.
4. L. Zhang, B.G. Thomas, K. Cai, L. Zhu, and J. Cui: ISSTech2003,ISS, Warrendale, PA, 2003, pp. 141–56.
5. L. Zhang: Steel Res. Int., 2006, vol. 77 (3), pp. 258–69.6. L. Zhang: J. Iron. Steel Res. Int., 2006, vol. 13 (4), pp. 1–8.7. L. Zhang and B.G. Thomas: Metall. Mater. Trans. B, 2006,
vol. 37B, pp. 733–61.8. S. Liu, S. Niu, M. Liang, C. Li, X. Zuo, L. Zhang, and X. Wang:
Proceedings of AISTech 2007 Iron & Steel Technology Conferenceand Exposition, AIST, Warrendale, PA, 2007, vol. II, pp. 771–80.
9. S. Liu, X. Zuo, L. Zhang, S. Niu, M. Liang, C. Li, and X. Wang:Clean Steel 2007, 2007, pp. 272–82.
10. X. Zuo, M. Long, J. Gao, Y. Wang, and L. Zhang: Iron SteelTechnol., 2010, vol. 7 (10), pp. 65–76.
11. Y. Ren, Y. Chen, X. Yang, S. Yang, L. Zhang, X. Ding, J. Li, S.Li, and F. Liu: AISTech 2012 Proceedings, 2012, pp. 1171–77.
12. Y. Ren, L. Zhang, S. Yang, and W. Yang: AISTech 2013 Pro-ceedings, 2013, pp. 1159–66.
13. R. Kiessling: Met. Sci., 1980, vol. 15 (5), pp. 161–72.14. R. Rastogi and A.W. Cramb: 2001 Steelmaking Conference Pro-
ceedings, ISS, Warrendale, 2001, vol. 84, pp. 789–829.15. S. Li, L. Zhang, and X. Zuo: Proceedings of Materials Science and
Technology(MS&T)2008,AIST,Warrendale, PA, 2008, pp. 1259–69.16. K. Kawamura, S. Watanabe, and M. Yamada: Tetsu-to-Hagane,
1972, vol. 58 (14), pp. 2060–66.
17. L. Zhang, S. Li, J. Wang, and X. Zuo: Iron Steel (Chin.), 2009,vol. 44 (3), pp. 75–80.
18. W. Yang, X. Wang, L. Zhang, and W. Wang: Steel Res. Int., 2013,vol. 84 (9), pp. 878–91.
19. J. Tan and P.C. Pistorius: AISTech 2013 Iron and Steel TechnologyConference, May 6, 2013–May 9, 2013, Pittsburgh, PA, U.S.A.,Association for Iron and Steel Technology, AISTECH, 2013, vol.1, pp. 1301–11.
20. P.C. Glaws, R.V. Fryan, and D.M. Keener: 74th SteelmakingConference Proceedings, ISS, Warrendale, PA, 1991, vol. 74,pp. 247–64.
21. M. Iwasaki, N. Suzuki, T. Ohshiro, H. Utsumi, K. Miyake, and K.Sahara: R&D Res. Dev. Kobe Steel Eng. Rep., 1985, vol. 35 (3),pp. 73–76.
22. R.C. Sussman, M. Burns, X. Huang, and B.G. Thomas: 10thProcess Technology Conference Proceedings, Iron and Steel Soci-ety, Warrendale, PA, 1992, vol. 10, pp. 291–304.
23. C. Bonilla: 78th Steelmaking Conference Proceedings, ISS, War-rendale, PA, 1995, vol. 78, pp. 743–52.
24. H. Gao: Steelmaking (Chin.), 2000, vol. 16 (2), pp. 38–43.25. M. Goransson, F. Reinholdsson, and K. Willman: I Smaker, 1999,
vol. 26 (5), pp. 53–58.26. Q. Zhang, L. Wang, and X. Wang: ISIJ Int., 2006, vol. 46 (10),
pp. 1421–26.27. http://www.aspexcorp.com/Solutions/Software/MQAtrade.aspx.28. F. Schamber: Introduction to Automated Particle Analysis by
Focused Electron Beam, ASPEX Corporation, Report, 2009.29. V. Singh, S. Lekakh, and K. Peaslee: 62nd SFSA Technical and
Operating Conference, 2008.30. The Japan Society for the Promotion of Science: Steelmaking Data
Sourcebook, Gordon and Breach Science, New York, 1988.31. B. Hallstedl: J. Am. Ceram. Soc., 1990, vol. 73 (1), pp. 15–23.32. H. Itoh, M. Hino, and S. Ban-Ya: Metall. Mater. Trans. B, 1997,
vol. 28B, pp. 953–56.33. H. Ohta and H. Suito: Metall. Mater. Trans. B, 1997, vol. 28B,
pp. 1131–39.34. K. Taguchi, H. Ono-Nakazat, T. Usui, K. Marukawa, K. Katogi,
and H. Kosaka: ISIJ Int., 2005, vol. 45 (11), pp. 1572–76.35. http://www.factsage.com/.36. K. Mukai, H. Sakao, and K. Sano: ISIJ Int., 1969, vol. 9,
pp. 196–203.37. C. Wang, N. Verma, Y. Kwon, W. Tiekink, N. Kikuchi, and S.
Sridhar: ISIJ Int., 2011, vol. 51 (3), pp. 375–81.38. D. Bouris and G. Bergeles: Metall. Mater. Trans. B, 1998,
vol. 29B, pp. 641–49.39. V. Brabie: ISIJ Int., 1996, vol. 36 (Supplement), pp. S109–12.40. V. Brabie: Steel Res. Int., 1997, vol. 2, pp. 54–60.41. M. Imagumbai: ISIJ Int., 1994, vol. 34 (11), pp. 896–905.42. Y. Wang and L. Zhang: JOM, 2012, vol. 64 (9), pp. 1063–74.
METALLURGICAL AND MATERIALS TRANSACTIONS B