Embed Size (px)
Citation preview
I J C T A, 9(5), 2016, pp. 63-67© International Science Press
Detection of Leukemia inBlood Microscope ImagesIndira P.*, Ganesh Babu T. R.**, Vidhya K.***
ABSTRACT
Leukemia is a cancer of the blood and bone marrow, the spongy tissue inside the bones where blood cells are made.Acute myeloid leukemia (AML) is one of the most common types of leukemia among adults. The signs and symptomsof leukemia are non-specific in nature and also they are similar to the symptoms of other common disorders.Manual microscopic examination of stained blood smear or bone marrow aspirate is the only way to effectivediagnosis of leukemia. But this method is time consuming and less accurate. In this paper, a technique for automaticdetection and classification of AML in blood smear is presented. K-means algorithm is used for segmentation. Bothspatial and spectral features are used for classification. Genetic algorithm is used for optimizing the spectral features.Local ternary pattern is used for texture description. Blood microscope images were tested and the performance ofthe classifier was analyzed.
Keywords: Acute myelogenous leukemia (AML), Feature extraction, Genetic algorithm, Classification.
1. INTRODUCTION
Leukemia is a type of cancer. All cancers begin in cells which make up blood and other tissues. Bonemarrow is the soft material in the center of most bones. In people with leukemia, the bone marrow producesabnormal white blood cells [1]. These abnormal cells may crowd out normal white blood cells, red bloodcells and platelets. Acute myeloid leukemia (AML) is one of the most common types of leukemiaamong adults.
The initial symptoms of AML are not specific and are similar to other disease such as generalizedweakness, anemia, fever, joint pain, etc. Currently, the microscopic investigation of blood cells is performedmanually by hematologists through visual identification under the microscopic. However the manualrecognition method is time consuming . Moreover diagnostic confusion also occurs due to imitation ofsimilar signs by other disorders. Digital image processing methods have been applied for automaticclassification and detection of acute myeloid leukemia [9], [3]-[6], [13]. Earlier gray level images wereused for segmentation. It is proved that [3] color images present more reliable image segmentation thangray level images.
The work in [10], [11] employs k-means clustering algorithm for segmentation. It is an unsupervisedcolor based segmentation method. The work in [1] uses local binary pattern for texture classification. Xian-Hua et al. [2] proposed the use of robust local ternary pattern for texture classification as the local binarypattern is sensitive to noise. The work in [1], [4], [10], [11] uses spatial features for classification. Many ofthe systems presented in literature uses SVM classifier. It has been proved by the work of Jing Zhou et al.[12] that the use of genetic algorithm for parameter optimization improves the classification capability ofSVM classifier. The common drawback in these systems is that many of them classify only sub images.
* Department of Electronics and Communication Engineering, Shri Andal Alagar College of Engineering, India
** Department of Electronics and Communication Engineering, Shri Andal Alagar College of Engineering, India
*** Department of Electronics and Communication Engineering, Vel Tech, India
64 Indira P., Ganesh Babu T. R. and Vidhya K.
The work in [1] has proposed a system to classify whole images. But local binary pattern is used for textureclassification which is sensitive to noise.
The goal of the proposed work is to design a fully automated classifier for detecting and classifyingacute myeloid leukemia. This paper is structured as follows. Section II focuses on the proposed methodology.Section III gives the results obtained. Section IV presents conclusion and future work.
2. METHODOLOGY
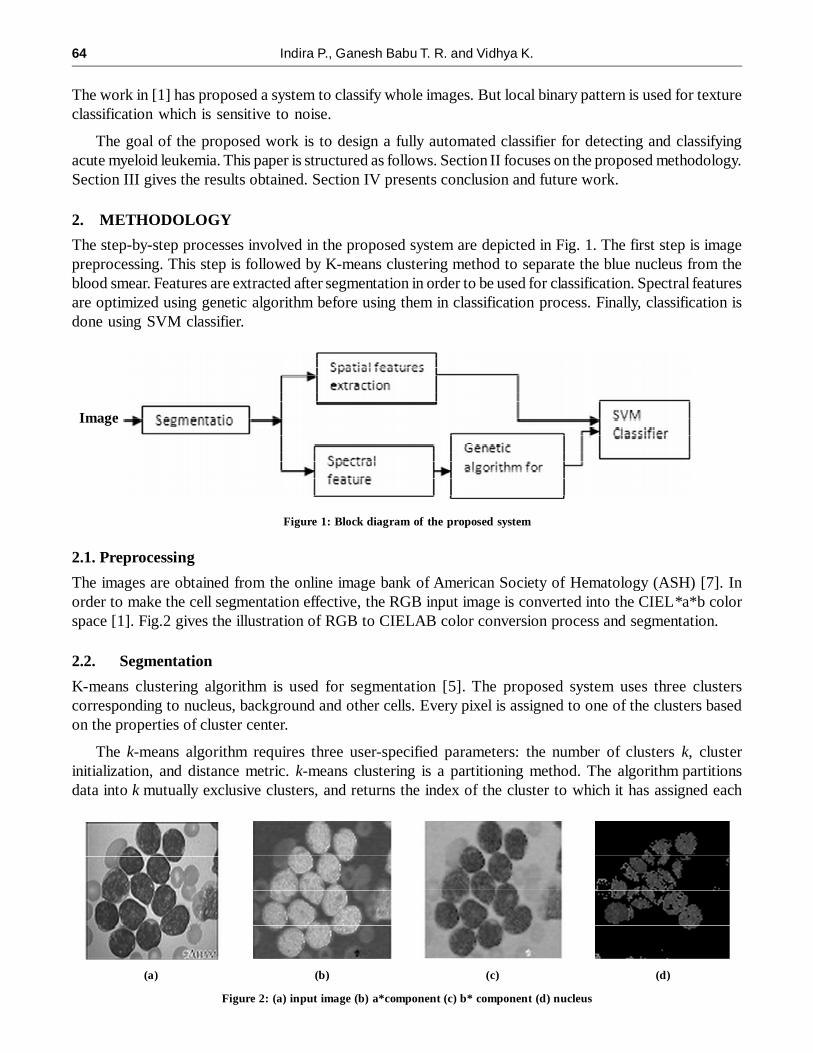
The step-by-step processes involved in the proposed system are depicted in Fig. 1. The first step is imagepreprocessing. This step is followed by K-means clustering method to separate the blue nucleus from theblood smear. Features are extracted after segmentation in order to be used for classification. Spectral featuresare optimized using genetic algorithm before using them in classification process. Finally, classification isdone using SVM classifier.
Figure 1: Block diagram of the proposed system
Image
2.1. Preprocessing
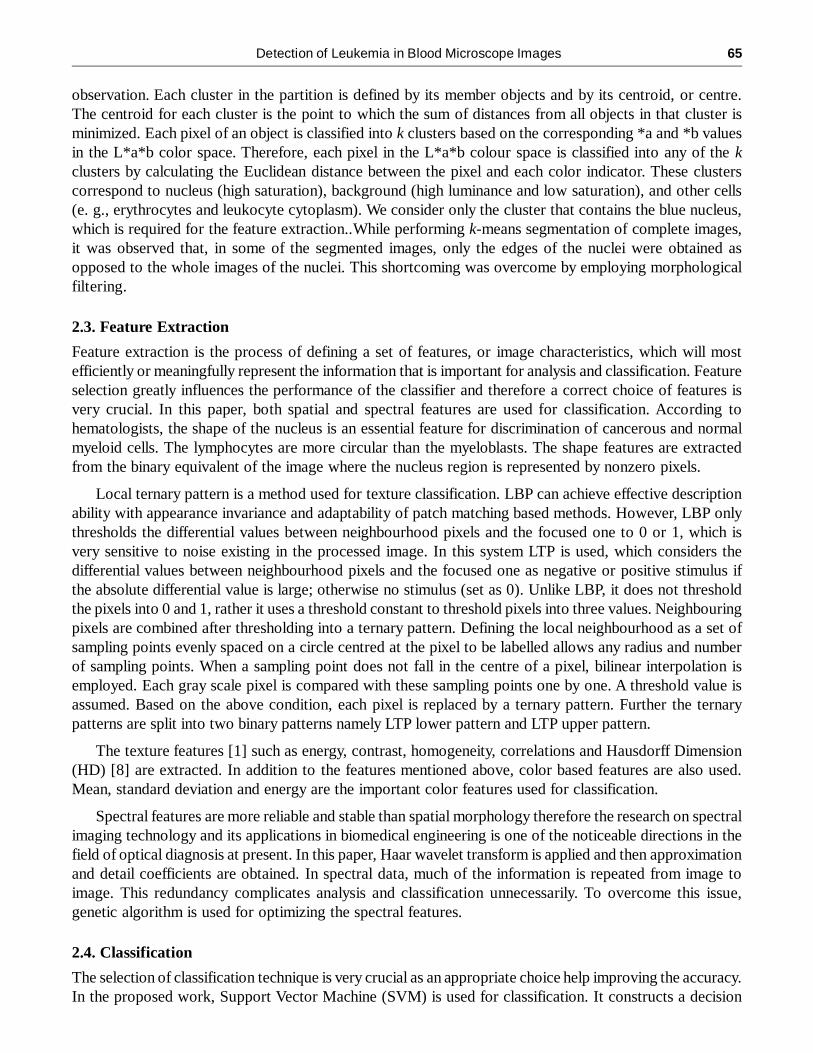
The images are obtained from the online image bank of American Society of Hematology (ASH) [7]. Inorder to make the cell segmentation effective, the RGB input image is converted into the CIEL*a*b colorspace [1]. Fig.2 gives the illustration of RGB to CIELAB color conversion process and segmentation.
2.2. Segmentation
K-means clustering algorithm is used for segmentation [5]. The proposed system uses three clusterscorresponding to nucleus, background and other cells. Every pixel is assigned to one of the clusters basedon the properties of cluster center.
The k-means algorithm requires three user-specified parameters: the number of clusters k, clusterinitialization, and distance metric. k-means clustering is a partitioning method. The algorithm partitionsdata into k mutually exclusive clusters, and returns the index of the cluster to which it has assigned each
(a) (d)(c)(b)
Figure 2: (a) input image (b) a*component (c) b* component (d) nucleus
Detection of Leukemia in Blood Microscope Images 65
observation. Each cluster in the partition is defined by its member objects and by its centroid, or centre.The centroid for each cluster is the point to which the sum of distances from all objects in that cluster isminimized. Each pixel of an object is classified into k clusters based on the corresponding *a and *b valuesin the L*a*b color space. Therefore, each pixel in the L*a*b colour space is classified into any of the kclusters by calculating the Euclidean distance between the pixel and each color indicator. These clusterscorrespond to nucleus (high saturation), background (high luminance and low saturation), and other cells(e. g., erythrocytes and leukocyte cytoplasm). We consider only the cluster that contains the blue nucleus,which is required for the feature extraction..While performing k-means segmentation of complete images,it was observed that, in some of the segmented images, only the edges of the nuclei were obtained asopposed to the whole images of the nuclei. This shortcoming was overcome by employing morphologicalfiltering.
2.3. Feature Extraction
Feature extraction is the process of defining a set of features, or image characteristics, which will mostefficiently or meaningfully represent the information that is important for analysis and classification. Featureselection greatly influences the performance of the classifier and therefore a correct choice of features isvery crucial. In this paper, both spatial and spectral features are used for classification. According tohematologists, the shape of the nucleus is an essential feature for discrimination of cancerous and normalmyeloid cells. The lymphocytes are more circular than the myeloblasts. The shape features are extractedfrom the binary equivalent of the image where the nucleus region is represented by nonzero pixels.
Local ternary pattern is a method used for texture classification. LBP can achieve effective descriptionability with appearance invariance and adaptability of patch matching based methods. However, LBP onlythresholds the differential values between neighbourhood pixels and the focused one to 0 or 1, which isvery sensitive to noise existing in the processed image. In this system LTP is used, which considers thedifferential values between neighbourhood pixels and the focused one as negative or positive stimulus ifthe absolute differential value is large; otherwise no stimulus (set as 0). Unlike LBP, it does not thresholdthe pixels into 0 and 1, rather it uses a threshold constant to threshold pixels into three values. Neighbouringpixels are combined after thresholding into a ternary pattern. Defining the local neighbourhood as a set ofsampling points evenly spaced on a circle centred at the pixel to be labelled allows any radius and numberof sampling points. When a sampling point does not fall in the centre of a pixel, bilinear interpolation isemployed. Each gray scale pixel is compared with these sampling points one by one. A threshold value isassumed. Based on the above condition, each pixel is replaced by a ternary pattern. Further the ternarypatterns are split into two binary patterns namely LTP lower pattern and LTP upper pattern.
The texture features [1] such as energy, contrast, homogeneity, correlations and Hausdorff Dimension(HD) [8] are extracted. In addition to the features mentioned above, color based features are also used.Mean, standard deviation and energy are the important color features used for classification.
Spectral features are more reliable and stable than spatial morphology therefore the research on spectralimaging technology and its applications in biomedical engineering is one of the noticeable directions in thefield of optical diagnosis at present. In this paper, Haar wavelet transform is applied and then approximationand detail coefficients are obtained. In spectral data, much of the information is repeated from image toimage. This redundancy complicates analysis and classification unnecessarily. To overcome this issue,genetic algorithm is used for optimizing the spectral features.
2.4. Classification
The selection of classification technique is very crucial as an appropriate choice help improving the accuracy.In the proposed work, Support Vector Machine (SVM) is used for classification. It constructs a decision
66 Indira P., Ganesh Babu T. R. and Vidhya K.
surface in the feature space that bisects the two categories, i.e., cancerous and noncancerous, and maximizesthe margin of separation between two classes of points. In this paper, linear SVM classifier is used as it iscomputationally inexpensive and it achieves good performance.
3. EXPERIMENTAL RESULTS
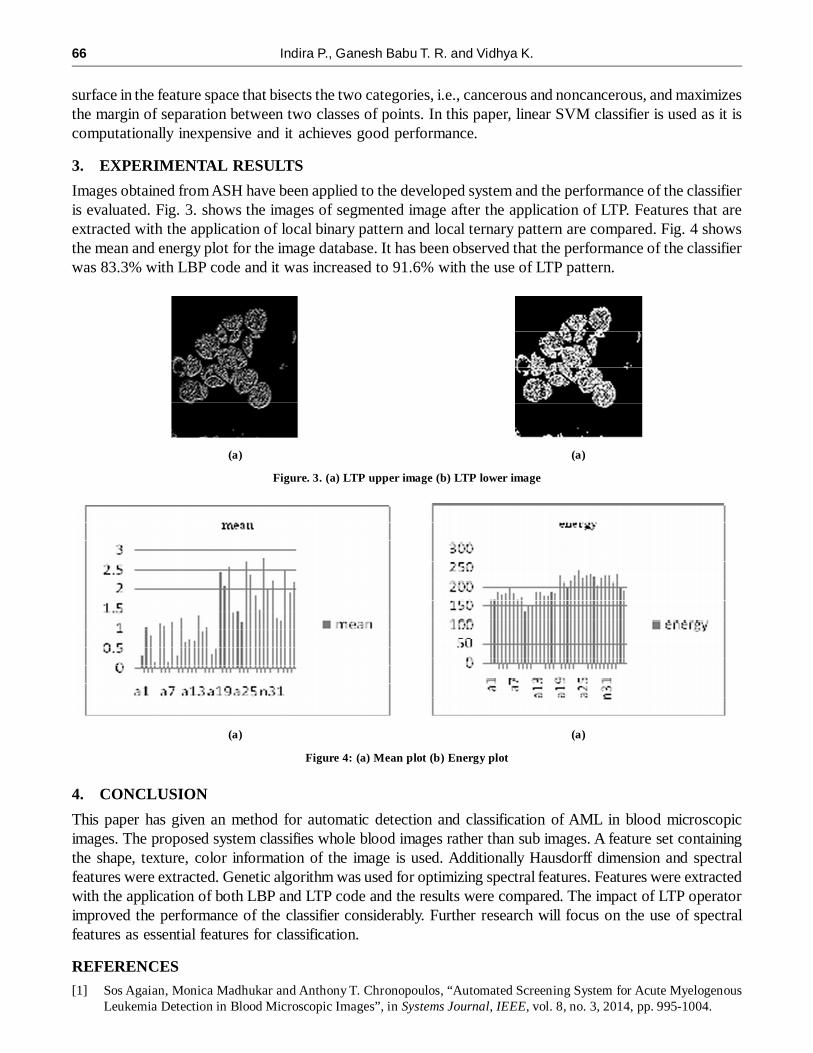
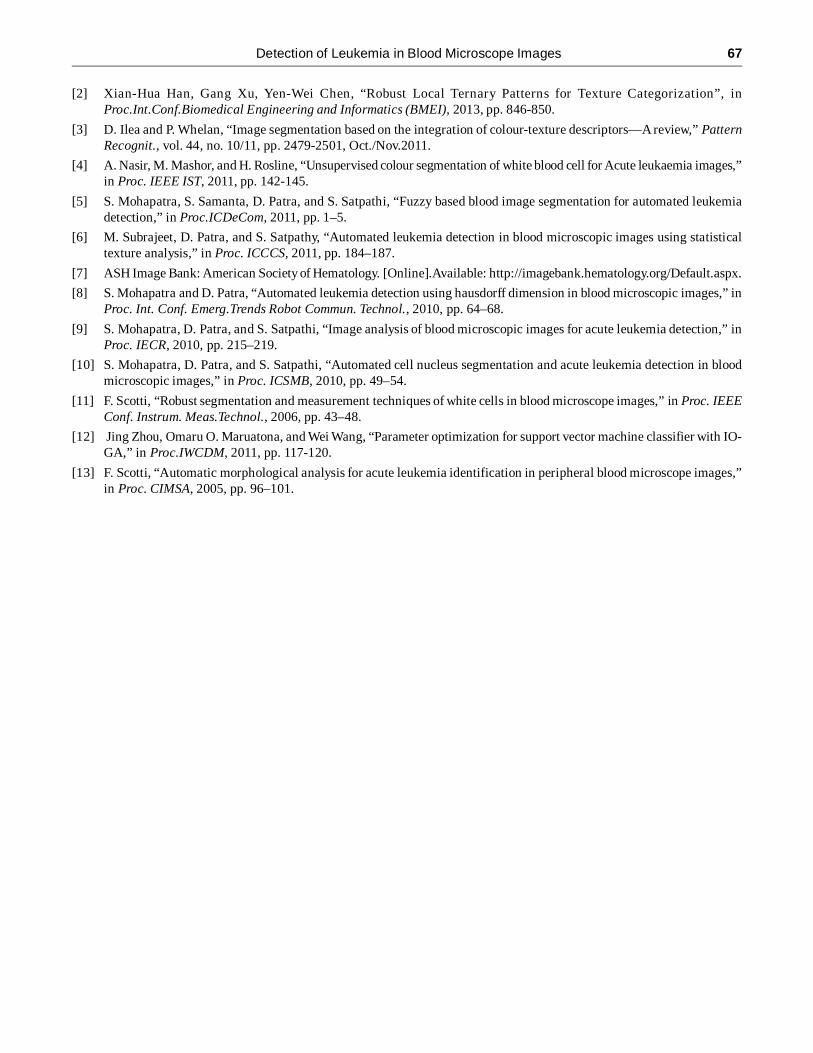
Images obtained from ASH have been applied to the developed system and the performance of the classifieris evaluated. Fig. 3. shows the images of segmented image after the application of LTP. Features that areextracted with the application of local binary pattern and local ternary pattern are compared. Fig. 4 showsthe mean and energy plot for the image database. It has been observed that the performance of the classifierwas 83.3% with LBP code and it was increased to 91.6% with the use of LTP pattern.
Figure. 3. (a) LTP upper image (b) LTP lower image
(a) (a)
Figure 4: (a) Mean plot (b) Energy plot
(a) (a)
4. CONCLUSION
This paper has given an method for automatic detection and classification of AML in blood microscopicimages. The proposed system classifies whole blood images rather than sub images. A feature set containingthe shape, texture, color information of the image is used. Additionally Hausdorff dimension and spectralfeatures were extracted. Genetic algorithm was used for optimizing spectral features. Features were extractedwith the application of both LBP and LTP code and the results were compared. The impact of LTP operatorimproved the performance of the classifier considerably. Further research will focus on the use of spectralfeatures as essential features for classification.
REFERENCES
[1] Sos Agaian, Monica Madhukar and Anthony T. Chronopoulos, “Automated Screening System for Acute MyelogenousLeukemia Detection in Blood Microscopic Images”, in Systems Journal, IEEE, vol. 8, no. 3, 2014, pp. 995-1004.
Detection of Leukemia in Blood Microscope Images 67
[2] Xian-Hua Han, Gang Xu, Yen-Wei Chen, “Robust Local Ternary Patterns for Texture Categorization”, inProc.Int.Conf.Biomedical Engineering and Informatics (BMEI), 2013, pp. 846-850.
[3] D. Ilea and P. Whelan, “Image segmentation based on the integration of colour-texture descriptors—A review,” PatternRecognit., vol. 44, no. 10/11, pp. 2479-2501, Oct./Nov.2011.
[4] A. Nasir, M. Mashor, and H. Rosline, “Unsupervised colour segmentation of white blood cell for Acute leukaemia images,”in Proc. IEEE IST, 2011, pp. 142-145.
[5] S. Mohapatra, S. Samanta, D. Patra, and S. Satpathi, “Fuzzy based blood image segmentation for automated leukemiadetection,” in Proc.ICDeCom, 2011, pp. 1–5.
[6] M. Subrajeet, D. Patra, and S. Satpathy, “Automated leukemia detection in blood microscopic images using statisticaltexture analysis,” in Proc. ICCCS, 2011, pp. 184–187.
[7] ASH Image Bank: American Society of Hematology. [Online].Available: http://imagebank.hematology.org/Default.aspx.
[8] S. Mohapatra and D. Patra, “Automated leukemia detection using hausdorff dimension in blood microscopic images,” inProc. Int. Conf. Emerg.Trends Robot Commun. Technol., 2010, pp. 64–68.
[9] S. Mohapatra, D. Patra, and S. Satpathi, “Image analysis of blood microscopic images for acute leukemia detection,” inProc. IECR, 2010, pp. 215–219.
[10] S. Mohapatra, D. Patra, and S. Satpathi, “Automated cell nucleus segmentation and acute leukemia detection in bloodmicroscopic images,” in Proc. ICSMB, 2010, pp. 49–54.
[11] F. Scotti, “Robust segmentation and measurement techniques of white cells in blood microscope images,” in Proc. IEEEConf. Instrum. Meas.Technol., 2006, pp. 43–48.
[12] Jing Zhou, Omaru O. Maruatona, and Wei Wang, “Parameter optimization for support vector machine classifier with IO-GA,” in Proc.IWCDM, 2011, pp. 117-120.
[13] F. Scotti, “Automatic morphological analysis for acute leukemia identification in peripheral blood microscope images,”in Proc. CIMSA, 2005, pp. 96–101.