Embed Size (px)
Citation preview
Detection of High Potential Gold Mineralization Areas Using Landsat 8
Data in Northeastern Sudan
AHMED SALAH OSMAN ALI
A thesis submitted in fulfilment of the requirements for the award
of the degree of Master of Remote Sensing
Faculty of Geoinformation and real estate
Universiti Teknologi Malaysia
JUNE 2014

III
This thesis is dedicated to my beloved Mother, Father, Family and friends
Thanks a lot for your kind help and encouragement

IV
ACKNOWLEDGEMENTS
I would like to take this opportunity to express my deepest gratitude and appreciation
to my supervisor Dr. Amin Beiranvand Pour for his constructive advice, guidance,
commitment and supportive encouragement throughout this project and also for Prof. Sr. Dr.
Mazlan Hashim.
I am really thankful of Geoinformation and Real Estate faculty for complete
assistance during all stages of the project and my course coordinator MR. Abd Wahid Rasib.
V
ABSTRACT
This investigation used Landsat 8 data for mapping lithological units and alteration
zones to detect high potential areas for gold mineralization in Red Sea Hills in Sudan part of
the Arabian-Nubian Shield (ANS). The study area contains three gold mines part of Ariab
mining district in Red Sea Hills, Northeastern Sudan. There are three types of gold deposits
in the study area (Supergene deposits, polymetallic massive sulphide deposits and The
Ganaet deposits) are being mined in Hadal Auatib mine, Hassai mine and Kamoeb mine. The
objective of this study was to find new high potential areas for gold mineralization in the
area. Color composite, band ratio, principle component analysis, directional filtering,
minimum noise fraction (MNF), spectral angle mapper (SAM), matched filtering (MF) and
Mixture-Tuned Matched-Filtering (MTMF) were used for geological mapping in this study.
The results of this study showed the distribution of the lithological units and the hydrothermal
alteration zones along with new high potential areas for gold mineralization which can be
used in the future and proved the ability of Landsat data in mapping these feature. The
results indicate that Landsat 8 data are capable to identify lithological units and alteration
zones at a regional scale. However the identification of specific hydrothermal alteration zone
is not feasible. High potential areas have been identified in the study area. Fieldwork verified
the image processing results.
VI
ABSTRAK
Penyiasatan ini digunakan Landsat 8 data untuk pemetaan unit lithological dan zon
pengubahan untuk mengesan bidang yang berpotensi tinggi untuk mineral emas di Red Sea
Hills di Sudan sebahagian daripada Perisai Arab-Nubian (ANS). Kawasan kajian
mengandungi tiga lombong emas sebahagian daripada daerah perlombongan Ariab di Red
Sea Hills, Timur Laut Sudan. Terdapat tiga jenis deposit emas di kawasan kajian (deposit
Supergene, polymetallic deposit sulfida besar-besaran dan Deposit Ganaet) sedang
dilombong di Hadal Auatib saya, Hassai lombong dan Kamoeb saya. Objektif kajian ini
adalah untuk mencari kawasan yang berpotensi tinggi baru untuk mineral emas di kawasan
itu. Komposit warna, nisbah band, analisis komponen dasarnya, penapisan arah, sebahagian
kecil bunyi minimum (MNF), sudut mapper spektrum (SAM), penapisan dipadankan (MF)
dan Campuran-ditala Dipadankan-Penapisan (MTMF) telah digunakan untuk pemetaan
geologi dalam kajian ini . Keputusan kajian ini menunjukkan pengagihan unit lithological dan
zon perubahan hidroterma bersama-sama dengan kawasan-kawasan yang berpotensi tinggi
baru untuk mineral emas yang boleh digunakan pada masa akan datang dan membuktikan
keupayaan data Landsat dalam pemetaan ciri ini. Keputusan menunjukkan bahawa Landsat 8
data mampu untuk mengenal pasti unit lithological dan zon pengubahan pada skala serantau.
Walau bagaimanapun pengenalpastian khusus zon perubahan hidroterma tidak boleh
dilaksanakan. Kawasan berpotensi telah dikenal pasti dalam kawasan kajian. Kerja lapangan
disahkan keputusan pemprosesan imej.
VII
TABLE OF CONTENTS
Chapter NO. TITLE PAGE
DECLARATION II
DECLARATION III
ACKNOWLEDGEMENTS IV
ABSTRACT V
TABLE OF CONTENTS VI
LIST OF FIGURES VIII
LIST OF TABLES X
1 INTRODUCTION 1
1.1 Background of the Study 1
1.2 Statement of the Problem 5
1.4 Objectives of the Study 6
1.5 Scope of the study 7
1.6 Significance of the study 9
2 LITERATURE REVIEW 10
2.1 Gold 10
2.2 lithological mapping and alteration zones 14
2.3 Gold Mineralization in Sudan 17
2.4 Visible near-infrared and shortwave infrared radiation spectra of hydrothermal
alteration minerals 19
3 METHODOLOGY 23
3.1 Geological setting 23
3.2 Remote sensing data and software 27
3.3 Processing techniques 29
VIII
3.3.1 Color Composite Images 29
3.3.2 Band Ratios (BR) 31
3.3.3 Principal Components Analysis (PCA) 33
3.3.4 Minimum noise fraction (MNF) 35
3.3.5 Spectral angle mapper (SAM) 36
3.3.6 Matched Filtering 37
3.3.7 Mixture-Tuned Matched Filtering 37
3.3.8 Directional Filtering 38
3.4 Field reconnaissance and validation 39
4 RESULTS AND ANALYSIS 41
4.1 Introduction 41
4.2 The results of conventional image processing methods 44
4.2.1 Color composite 44
4.2.2 Band ratio 48
4.2.3 Principle component analysis 55
4.2.4 Directional filtering 60
4.3 Minimum noise fraction (MNF) 62
4.4 Spectral mapping methods 66
4.5 Validation of the result 71
4.6 Field verification 72
4.7 Comparison between remote sensing techniques 77
4.6 Mineral potential map 78
4.7 Summary 83
5 CONCLUSION AND RECOMMENDATIONS 85
5.1 Conclusion 85
5.2 Recommendations 87
REFERENCES 88
IX
LIST OF FIGURES
FIGURE NO. TITLE PAGE
Figure 1.1 The Arabian Nubian Shield (ANS). 7
Figure 1.2 Gold mines in the Arabian Nubian Shield. 8
Figure 2.1 Geological setting of the hydrothermal alteration zones associated with gold
deposit. 11
Figure 2.2 World gold production in 2010. 12
Figure 2.3 Gold world production since 1880. 13
Figure 2.4 Images for Hassai mine in the study area. 19
Figure 2.5 (A) Laboratory spectra of epidote, calcite, muscovite, kaolinite, chlorite and
alunite. (B) Laboratory spectra of limonite, jarosite, hematite and goethite
(Clark et al., 1993). 21
Figure 3.1 Tectono-statigraphic section of the regional series (Cottard 1986). 25
Figure 3.2 Geological map for the study area (Cottard 1986). 26
Figure 3-3 Bands and wavelength for Landsat ETM+ and Landsat 8. 29
Figure 3.4 Reflectance spectra of the iron oxide (hematite) and iron hydroxide (goethite)
(from Clark et al., 1993). 32
Figure 3.5 Reflectance spectra of kaolinite (1.5-6.0 μm plot). 33
Figure 3.6 SAM formula 36
Figure 3.7 Flow chart for the study. 40
Figure 4.1 Google Earth image for the mines in the study area. 42
Figure 4.2 Landsat 8 image for the study area. 43
Figure 4.3 Color composite (2, 5, and 7) RGB. 45
Figure 4.4 Color composite (6, 5, and 7) RGB. 46
Figure 4.5 Color composite (10, 11, and 7) RGB. 47
Figure 4.6 Band ratio image 4/2. 49
Figure 4.7 Band ratio 6/7 image showing the kaolinite, montmorillonite and clay
minerals. 50
Figure 4.8 Part of the study area using 6/5 ratio for mapping ferrous minerals. 51
X
Figure 4.9 Color composite (4/2, 6/7 and 10) RGB. 52
Figure 4.10 Color composite (4/2, 6/5 and 6/7) RGB. 54
Figure 4.11 Result from PCA. (A) PC1; (B) PC2; (C) PC3. 58
Figure 4.12 RGB image from PCA result (PC1, PC2 and PC3). 59
Figure4.13 The directional filtering applied in the image. 61
Figure4.14 MNF result for part of the study area. 64
Figure4.15 MNF result band (4, 5 and6) showing the mines and prospects. 65
Figure4.16 SAM result (4, 5, 6) RGB. 67
Figure4.17 MF result band (2, 5 and6) showing the mines and prospects. 68
Figure4.18 MTMF result band (2, 5 and6) showing the mines and prospects. 70
Figure 4.19 Field photographs showing the geomorphology, rock units and hydrothermally
altered rocks. 75
Figure 4.20 Directional filter image showing the structure of the area. 80
Figure 4.21 A map for the potential areas created from PCA result band 7, band 4 and
directional filter for band 3. 81
Figure 4.22 The final map showing the geology and the hydrothermal alteration zones in
the study area. 82
XI
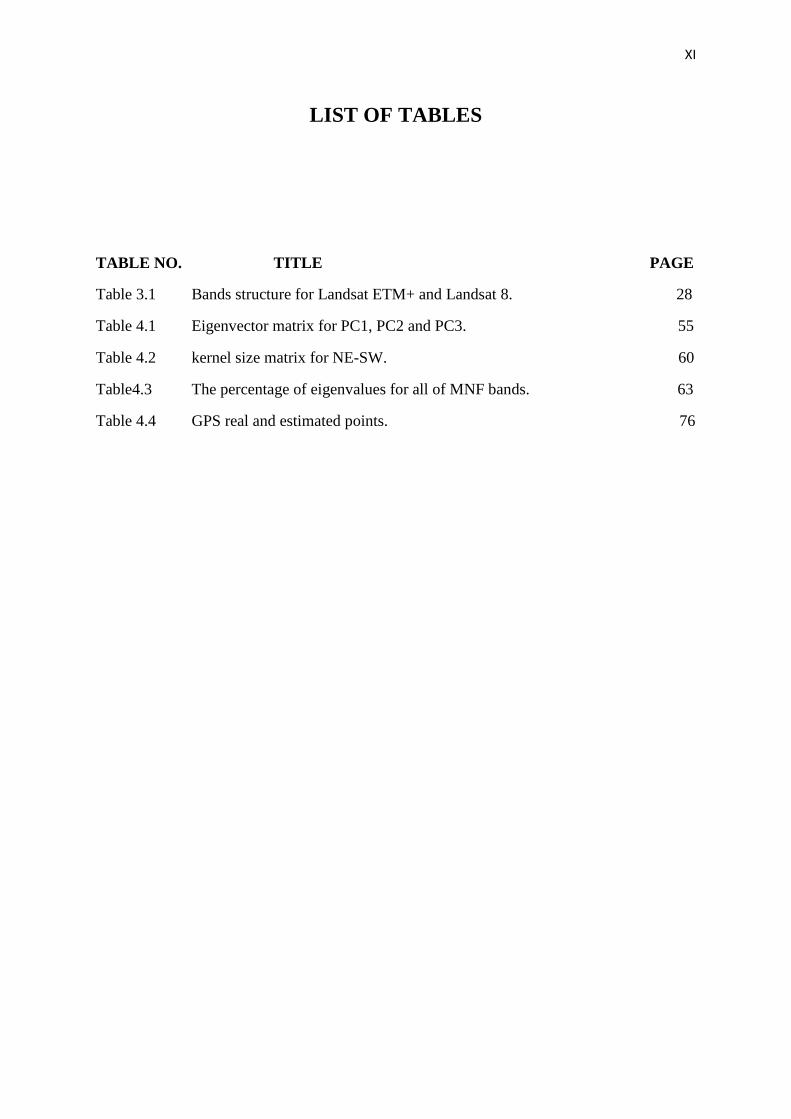
LIST OF TABLES
TABLE NO. TITLE PAGE
Table 3.1 Bands structure for Landsat ETM+ and Landsat 8. 28
Table 4.1 Eigenvector matrix for PC1, PC2 and PC3. 55
Table 4.2 kernel size matrix for NE-SW. 60
Table4.3 The percentage of eigenvalues for all of MNF bands. 63
Table 4.4 GPS real and estimated points. 76
XII
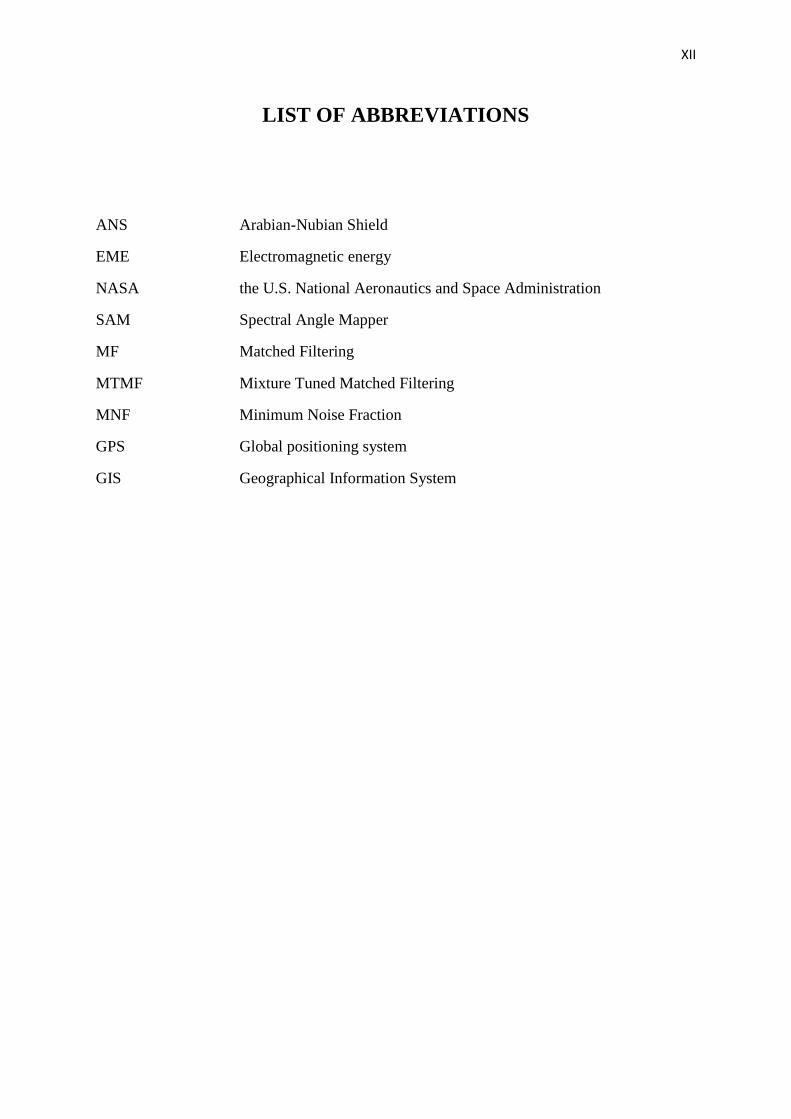
LIST OF ABBREVIATIONS
ANS Arabian-Nubian Shield
EME Electromagnetic energy
NASA the U.S. National Aeronautics and Space Administration
SAM Spectral Angle Mapper
MF Matched Filtering
MTMF Mixture Tuned Matched Filtering
MNF Minimum Noise Fraction
GPS Global positioning system
GIS Geographical Information System
CHAPTER 1
INTRODUCTION
1.1 Background of the study
Remote sensing technology can be used to derive useful information about
the terrain in earth science. Minerals resources are important natural assets and it is a
nation‘s best interest to stimulate a greater understanding of its indigenous wealth.
Any industry in the world in one way or another need minerals, so any country in the
world need to explore its Stock from minerals for their economy improvement.
The real begging to use remote sensing technology in minerals exploration
came after the Second World War, where the aerial photogrammetry was used at that
time. After satellite lunching, remote sensing technique was becoming profitable
when using in geological applications. This technique includes acquiring,
processing, and interpreting images and related data, acquired from aircraft and
satellites that measure the interaction between features and electromagnetic energy.
(Di Tommaso and Rubinstein, 2007; El Desouky et al., 2008; Gabr et al., 2010;
Massironi et al., 2008; Pour and Hashim, 2011).
Nowadays, 73 earth science satellites currently operate under national and
regional government auspices or under commercial ownership. In 2005, the U.S.
National Aeronautics and Space Administration (NASA) alone were flying 80
2
instruments on 18 spacecraft. These instruments use remote sensing technologies
that include scatterometers, multispectral and hyperspectral imagers, polarimetric
and sounding radiometers, radar and laser altimeters, sounding LIDAR and radar,
and synthetic aperture radar (NASA 2003). The instruments provide more than 1,800
science data products for study of physical, geophysical, biochemical, and other
parameters (Macauley and Vukovich, 2005).
Remote sensing applications are used for mineral exploration in two
applications (map geology and the faults and fractures that localize ore deposits, and
recognize hydrothermally altered rocks by their spectral signatures). Multispectral
satellite images are used to interpret both structure and hydrothermal alteration. The
use of digital process TM ratio images can identify two assemblages of hydrothermal
alteration minerals (iron oxides and clays minerals). Hyperspectral imaging systems
can identify individual species of iron and clay minerals, which can provide details
of hydrothermal zoning (Sabins, 1999).
Remote sensing images have been widely and successfully used for
mineral exploration for decades. Although gold cannot be detected directly by any
remote sensing method, the presence of minerals such as iron oxides and clay
minerals, whose diagnostic spectral signatures, (in the visible/shortwave infrared
portion of the electromagnetic spectrum) could be used as indicators for
identification of hydrothermal alteration zones, which are associated with gold
occurrences ( GRAS, 1990; Kujjo, 2010).
In term of multispectral satellites, SPOT, Landsat Multi-Spectral Scanner
(MSS), Landsat Thematic Mapper (TM) and ASTER are the major satellites that are
using for mapping geology for regional scale. Landsat Thematic Mapper /Enhanced
Thematic Mapper+ (TM/ETM+) images were used for exploring alteration minerals
3
associated with epithermal gold and copper mineralization. SWIR bands (bands 5
and 7) of TM/ETM+ satellites have been used to identify hydroxyl-bearing minerals
of copper/gold exploration (Clark et al., 1991; Cocks et al., 1998; Kruse, 1999;
Abdelsalam and Stern, 2000; Perry, 2004; Hallman and Ramsey, 2004). The
Advanced Spaceborne Thermal Emission and Reflection Radiometer remote sensor
(ASTER) has good resolution in the SWIR bands for mapping hydrothermal
alteration mineral zones with porphyry copper and epithermal gold mineralization.
On the other hand, the hyperspectral where the image has more than 100 bands has
been used in satellites and aircrafts platform. Some of the airborne that has been used
in hyperspectral spectroscopy are HyMap and AVIRIS, where in term of satellites
there is Hyperion sensor (Kavak, 2005; Pour and Hashim, 2011; Clark et al., 1991;
Cocks et al., 1998).
NASA has launched two generations of unmanned Landsat satellites that
have acquired valuable remote sensing data for mineral exploration and other
applications. Both generations were placed in sun-synchronous orbits that provide
repetitive images of the entire earth, except for the extreme Polar Regions. The first
generation Landsats (1, 2, and 3) operated from 1972 to 1985 and is essentially
replaced by the second generation. The second generation (Landsats 4, 5 and 7) were
launched in 1982 and continue to the present. Landsat 6 of the second generation
was launched in 1993, but failed to reach orbit. Images are acquired by the thematic
mapper TM, which is an optical-mechanical cross-track scanner. An oscillating scan
mirror sweeps the field of view of the optical system across the terrain at a right
angle to the satellite orbit path. A spectrometer separates solar energy that is
reflected from the earth‘s surface into narrow wavelength intervals called spectral
bands. Each band is recorded as a separate image. The recent one was Landsat 8,
which was launched on 11 Feb 2013 (Also known as the Landsat Data Continuity
Mission). Landsat(TM/ETM+) images have been used in minerals mapping and
detection in many studies (Sabins, 1999; Ramadan and Abdel Fattah, 2010).
4
Gold exploration in Sudan has begun since Pharaonic ages (3,000 years
ago), but the number of the people and dry hot weather caused the mining procedure
to be patchy and fugacious in process. The period that can be consider as a regularly
and continuous mining period is the British Colonization years from 1900 to 1956.
Of course there was some Mining Ahli along the boundaries with Ethiopia, The
Democratic Republic of Congo, Uganda, Central African Republic, and based on
artisanal mining. Although that mineral exploration began in Sudan before in the
surrounding countries, and there is stocks of a various types of minerals (chromite ,
gold, iron, silver, manganese, copper, iron, mica, and graphite), there still are no
fitting evaluations of stores and numerous mineral events remain unexploited
because of wrong prospecting systems (GRAS, 1990; Kujjo, 2010).
The best possible utilization of mineral investigation techniques was
postponed until the 1970's, throughout which the Sudanese Geological Survey
placed more than 50 gold handling destinations. Consequently, joint wanders
between Sudan and outside organizations in the 1980's have furnished chances for
the provision of up to date innovations to gold investigation. Subsequently,
significant revelations of gold stores in the Red Sea Hills empowered the quest for
gold in ranges of quartz veins, as well as in rocks connected with gossans.
Gold investigation and abuse in Sudan goes once more to the Farah and
Turkish periods. Gold used to be investigated by utilization of customary strategies
at Nahral-Neel, Blue Nile and northern Sudan. The antiquated locales uncovered at
those regions were something like twelve destinations. Gold is found at al-Mazroub
territory where Gossanic proofs holding gold metal and other related mineral have
been uncovered. Geophysical studies have been directed over a zone of something
like 13.5 square kilometers stretched out at longitude 4.5 kms (north/south) and
scope 3 kms (east/west). These studies have demonstrated vicinity of expansions of
Gossanic confirmations in profundities that are evaluated at 150 meters inside the
ground. Gold mineral and other related minerals have additionally been run across at
5
Block No. The medium of gold metal in the dirt and waterways stores measure to
300 and 6oo particles in a million separately.
The study area is a part of the Arabian Nubian Shield (ANS), which it
exposure of Precambrian crystalline rocks on the flanks of the Red Sea. The
Precambrian crystalline rocks are for the most part Neoproterozoic in age.
Topographically and from north to south the ANS incorporates the countries of
Israel, Jordan, Egypt, Sudan, Eritrea, Ethiopia, Yemen, and Somalia. The ANS in the
north is uncovered as a component of the Sahara Desert and Arabian Desert, and in
the south in the Ethiopian Highlands, Asir territory of Arabia and Yemen Highlands.
1.2 Statement of problem
The key elements in minerals exploration are to gain understanding of
geologic area through lithological mapping and to assist in defining potential target
areas. To map bedrock and identify presence and abundance of specific minerals at
specific scale, it is possible to use remote sensing techniques. Remote sensing is a
useful tool to lithological and alteration zones structure (Sabins, 1999).
Sudan is one of the African nations which appreciate imposing land
differing qualities. Its topographical guide contains numerous sorts of rocks going
from sedimentary rocks, to basal rocks and molten rocks. Because of the
geographical structures which go once more to a large number of years together with
the development of tectonic plates and mainland and maritime sliding, immense
mineral materials of budgetary quality were shaped in Sudan. These mineral
possibilities are conveyed as per their surroundings of starting point where ophiolite
6
rocks are found in the Red Sea, Blue Nile, Qalalnahal and northeast of Nuba
Mountains regions, where these zones are rich of minerals of financial esteem, for
example, chromite, magnesite aspestos and talc.
The study area had received less attention in terms of geological research
in the past. However, some projects have been carried out, most of which aim at the
appraisal of surface, groundwater resources and mining area structure. Among the
researchers are Andrew and Karkanis (1945), Mansour and Samuel (1957), Gabert et
al. (1961), Rodis and Iskander (1963). In addition, suitable image processing
techniques are used to extract useful geological information from the Landsat 8 data
for arid-semiarid regions.
1.4 Objectives
The objectives of this research are:
1. To conduct a remote sensing investigation for gold exploration purpose in
the northeastern Sudan (Hassai mining area, Red Sea Estate).
2. To detect high potential area of gold mineralization using Landsat 8 data.
3. To run adequate image processing techniques to discriminate lithological
units and structural elements in the study area.
4. To produce geological map contains high potential gold occurrence
locations.
7
1.5 Scope of the study.
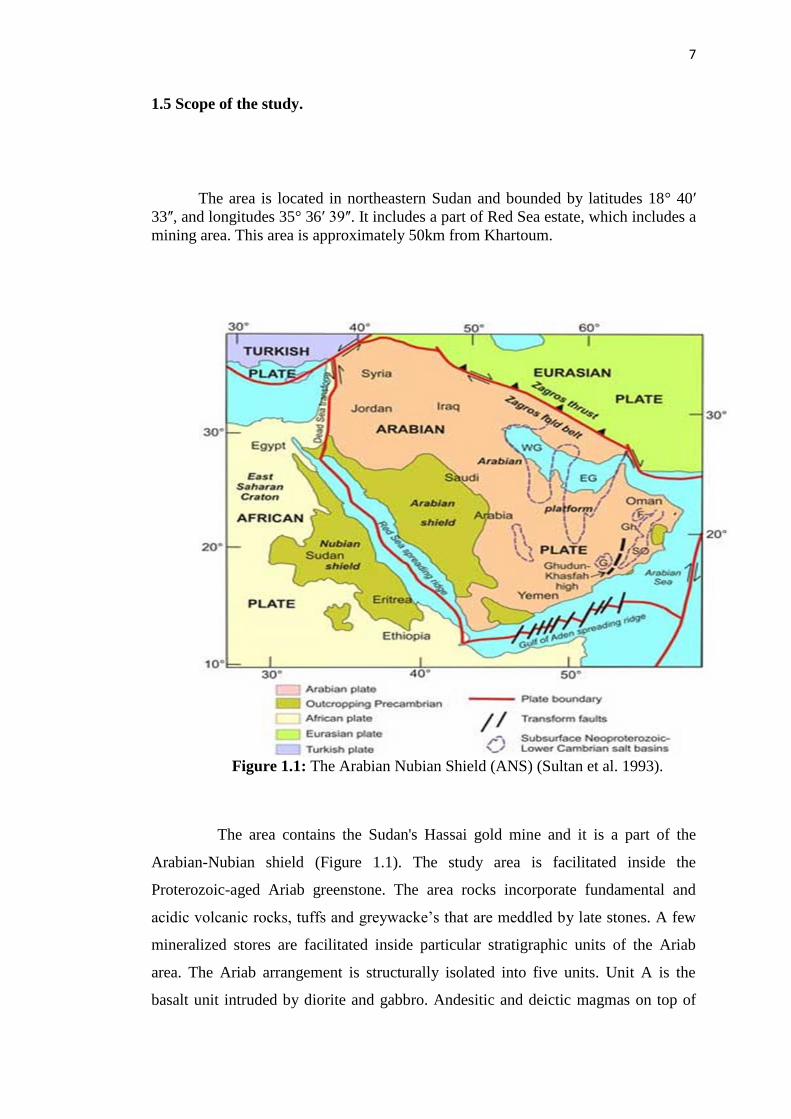
The area is located in northeastern Sudan and bounded by latitudes 18° 40ʹ
33ʺ, and longitudes 35° 36ʹ 39ʺ. It includes a part of Red Sea estate, which includes a
mining area. This area is approximately 50km from Khartoum.
Figure 1.1: The Arabian Nubian Shield (ANS) (Sultan et al. 1993).
The area contains the Sudan's Hassai gold mine and it is a part of the
Arabian-Nubian shield (Figure 1.1). The study area is facilitated inside the
Proterozoic-aged Ariab greenstone. The area rocks incorporate fundamental and
acidic volcanic rocks, tuffs and greywacke‘s that are meddled by late stones. A few
mineralized stores are facilitated inside particular stratigraphic units of the Ariab
area. The Ariab arrangement is structurally isolated into five units. Unit A is the
basalt unit intruded by diorite and gabbro. Andesitic and deictic magmas on top of
8
pyroclastic rocks are facilitated in Unit B, a thick halfway unit. The third unit
designated C is acidic in nature and incorporates sodium-rich rhyolite and
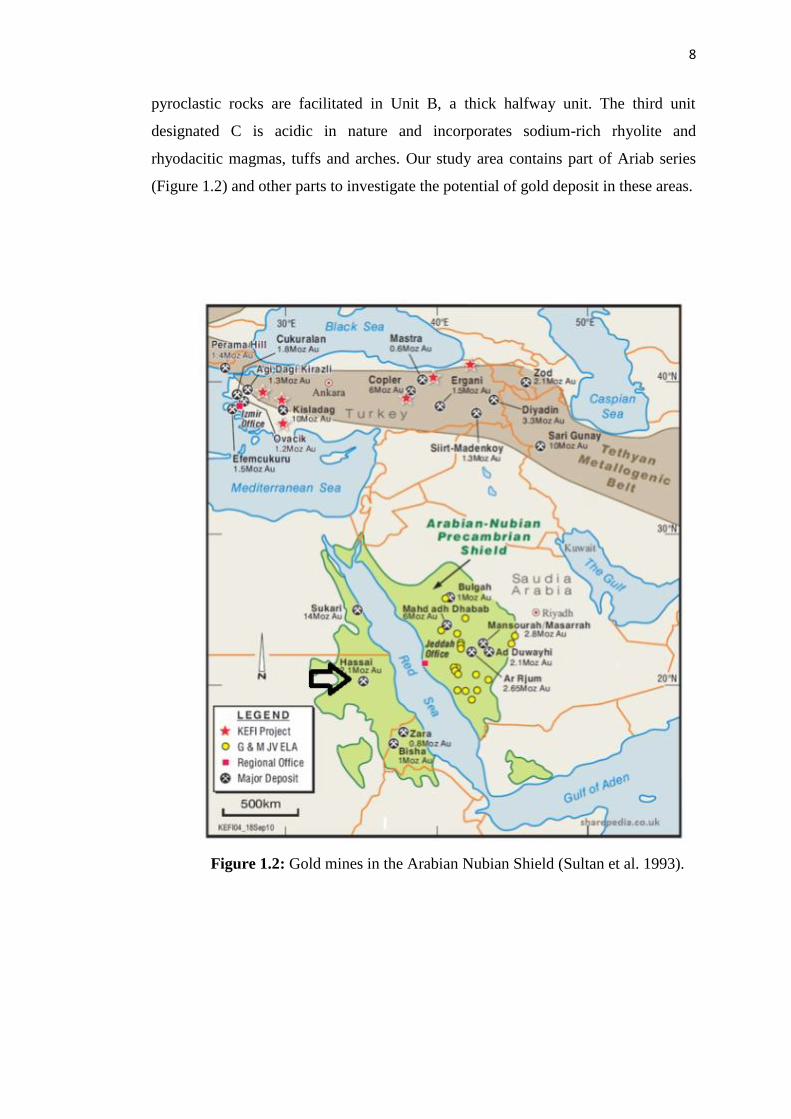
rhyodacitic magmas, tuffs and arches. Our study area contains part of Ariab series
(Figure 1.2) and other parts to investigate the potential of gold deposit in these areas.
Figure 1.2: Gold mines in the Arabian Nubian Shield (Sultan et al. 1993).
9
1.6 Significance of the study
This study attempted to identify and analyze the role of remote
sensing technology and especially Landsat data in lithological mapping and
the identification of hydrothermal alteration zones. The benefit of this study
will return to the country of Sudan in the future by using the results to
identify the high potential areas for gold mineralization in the study area.
Landsat 8 data was used in this study due to the unavailability of the
other remote sensing data that are associated with the identification of the
individual species of iron and clay minerals in the study area. The results of
this remote sensing study can be useful for the field of mineral exploration in
Sudan and for future research in the area to start from the result of this study.
88
REFERENCES
Abdel-Rahman, M., 1993. Geochemical and geotectonic controls of the metallogenic
evolution of selected ophiolite complexes from the Sudan. Berliner
geowissenschaftliche Abhandlungen 145,175.
Abdelsalam, M.G., Stern, R.J., 1993. Tectonic evolution of the Nakasib suture, Red
Sea Hills, Sudan: Evidence for a late Precambrian Wilson cycle. Journal of the
Geological Society of London 150, 393–404.
Abdelsalam,M.G., Stern, R.J., 1996. Sutures and Shear Zones in the Arabian-Nubian
Shield. Journal of African Earth Sciences 23, 289–310.
Abdelsalam, M. and Stern, R. (2000). Mapping gossans in arid regions with Landsat
TM and SIR-C images, the Beddaho Alteration Zone in northern Eritrea. Journal of
African Earth Sciences, 30(4), 903-916.
Ahmed, F.,1975. The geology of J. Qeili igneous complex, central Sudan. Geol.
Rdsch., 64, (3), p.835-846.
Almond D. C. 1984. The concept of ―Pan-African Episode‖ and ―Mozambique
Belt‖ in relation to the geology of East and North-East Africa. Bull. Fac. Earth Sci.
King abdulaziz Univ., Jeddah. 6 (1983), p. 71-87.
Aloub, O. A. and Elsamani, Y. 1991. The geology of gold deposits in the Red Sea
Hills of the Sudan: Pan-African tectono-metamorphic models. Bull. GRAS, Sudan,
39, 30p.
Berhe, S.M. (1990) Ophiolites in Northeastern and East Africa: implications for
proterozoic crustal growth. Journal Geoleological Society. London, v. 147, p. 41-57.
Berhe, S.M.; Rotheryjd.A. (1986) Interactive processing of satellite images for
structural and lithological mapping in northeast Africa. Geological Magazine, v.
123, p. 393-403.
Bhan, S.K., Bhattacharya, A., Guha, P.K., Ravindran, K.V., 1991. IRS-1A
applications in geology and mineral-resources. Current Science 61, 247–251.
Bilotti, F., Shaw, J.H., Brennan, P.A., 2000. Quantitative structural analysis with
stereoscopic remote sensing imagery. AAPG Bulletin 84, 727–740.
Burns R. G., 1988. Gossans on Mars; Proc. Lunar Planet Sci. Conf. 18, Cambridge
Univ. Press, P 713-721.
89
Boccaletti, M., Bonini, M., Mazzuoli, R., Abebe, B., Piccardi, L., Tortorici, L., 1998.
Quaternary oblique extensional tectonics in the Ethiopian Rift (Horn of Africa).
Tectonophysics 287, 97–116.
Boardman, J. W., 1998, Automated spectral unmixing of AVIRIS data using convex
geometry concepts: in Summaries, Fourth JPL Airborne Geoscience Workshop, JPL
Publication 93-26, v. 1, p. 11 - 14.
Chavez, P.S., Sides, S.C., Anderson, J.A., 1991. Comparison of 3 different methods
to merge multiresolution and multispectral data—Landsat TM and SPOT
panchromatic. Photogrammetric Engineering and Remote Sensing 57, 295–303.
Chen, J. Y., and I. S. Reed, 1987, A detection algorithm for optical targets in clutter,
IEEE Trans. on Aerosp. Electron.Syst., vol. AES-23, no. 1.
Clark, R.N., King, T.V.V., Klejwa, M. and Swayze, G.A. (1990). High spectral
resolution reflectance spectroscopy of minerals. Journal of Geophysical Research,
95, 12653-12680.
Clark, R.N., Swayze, G.A., Gallagher, A., Gorelick, N. and Kruse, F.A. (1991).
Mapping with imaging spectrometer data using the complete band shape least-
squares algorithm simultaneously fit to multiple spectral features from multiple
materials. In: Proceedings, 3rd Airborne Visible/Infrared Imaging Spectrometer
(AVIRIS) Workshop, p. 2–3.
Clark, R.N., Swayze, G.A., Gallagher, A., King, T.V.V. and Calvin, W.M. (1993).
The U.S. Geological Survey, Digital Spectral Library: Version 1: 0.2 to 3.0 microns:
U.S. Geological Survey Open File Report 93-592, 1340 p., http://speclab.cr.usgs.gov
(August 1999).
Cloutis, E.A. (1996). Hyperspectral geological remote sensing: evaluation of
analytical techniques. International Journal of Remote Sensing, 17 (12), 2215-2242.
Cocks, T., R. Jenssen, A. Stewart, I. Wilson. and T. Shields. (1998). The HyMap
Airborne Hyperspectral Sensor: The System, Calibration and Performance. Proc.
1st EARSeL Workshop on Imaging Spectroscopy (M. Schaepman, D. Schläpfer, and
K.I. Itten, Eds.), 6-8 October 1998, Zurich, EARSeL, Paris, p. 37-43.
Cottard, F. Deschamps, Y. Bernadet, G. and El Samani, Y. 1986b. Gold deposits of
Ariab area. BRGM Rep. No. 86 SDN 110, Khartoum, 55p.
Crippen, R.E., Blom, R.G., 2001. Unveiling the lithology of vegetated terrains in
remotely sensed imagery. Photogrammetric Engineering and Remote Sensing 67,
935–943.
Crippen, R.E., Blom, R.G., Ieee, 1991. Measurement of Subresolution Terrain
Displacements using SPOT Panchromatic Imagery. IEEE, New York.
Crippen, R.E., Blom, R.G., Environm Res Inst, M.,1996. Detection, measurement,
visualization, and analysis of seismic crustal deformation. In: Proceedings of the
Eleventh Thematic Conference: Geologic Remote Sensing—Practical Solutions for
Real World Problems, Vol I. Environmental Research Inst. Michigan, Ann Arbor.
90
Crosta, A. P., and Rabelo, A., 1993. Assessing of Landsat TM for hydrothermal
alteration mapping in central western Brazil . Proceedings of Ninth Thematic
conference geologic remote sensing Pasadinea, p. 1053-61, California, USA.
Di Tommaso, I., Rubinstein, N., 2007. Hydrothermal alteration mapping using
ASTER data in the Infiernillo porphyry deposit, Argentina. Ore Geol. Rev. 32, 275–
290.
Drury, S.A.; Berhe, S.M. (1993) Accretion tectonics in northern Eritrea revealed by
remotely sensed imagery. Geological Magazine, v.130, p.177-190.
El Desouky, H.A., Muchez, P., Dewaele, S., Boutwood, A., Tyler, R., 2008.
Postorogenic origin of the stratiform Cu mineralization at Lufukwe, Lufilian
Foreland, Democratic Republic of Congo. Econ. Geol. 103, 555–582.
Ferrier, G, White, K, Griffiths, G, Bryant, R, Stefouli, M, 2002. The mapping of
hydrothermal alteration zones on the island of Lesvos, Greece using an integrated
remote sensing dataset. International Journal of Remote Sensing 23, 341–356.
Fraser, A., Huggins, P., Rees, J., Cleverly, P., 1997. A satellite remote sensing
technique for geological structure horizon mapping. International Journal of Remote
Sensing 18, 1607–1615.
Gad, S., Kusky, T., 2006. Lithological mapping in the Eastern Desert of Egypt, the
Barramiya area, using Landsat thematic mapper (TM). Journal of African Earth
Sciences 44, 196–202
Gabr, S., Ghulam, A., Kusky, T., 2010. Detecting areas of high-potential gold
mineralization using ASTER data. Ore Geol. Rev. 38, 59–69
GRAS, 1989. Base metal in the Sudan, GRAS Rep. Sudan
GRAS, 1995. Gold in Sudan. GRAS Rep. Sudan
GRAS, 2004. Geological map of the Sudan. GRAS Rep, Sudan.
Goetz, A.F.H., Rowan, L.C., 1981. Geologic remote-sensing. Science 211, 781–791.
Gomez, C., Delacourt, C., Allemand, P., Ledru, P., Wackerle, R., 2005. Using
ASTER remote sensing data set for geological mapping, in Namibia. Physics and
Chemistry of the Earth 30, 97–108.
Harsanyi, J. C., and C. I. Chang, 1994, Hyperspectral image classification and
dimensionality reduction: An orthogonal subspace projection approach: IEEE
Trans. Geosci. and Remote Sens., v. 32, p. 779-785.
Hellman M.J and Ramsey M.S. (2004). Analysis of hot springs and associated
deposits in Yellowstone National Park using ASTER and AVIRIS remote sensing.
Journal of Volcanology and Geothermal Research, 135, 195- 219.
Hunt, G. R. and Salisbury, J. W. (1974). Mid-infrared spectral behavior of igneous
rocks. Technical Report AFRCL-TR-75-0356, US Air Force Cambridge Research
Laboratory, Cambridge, MA.
91
Hunt, G. (1977). Spectral signatures of particulate minerals in the visible and near
infrared. Geophysics, 42, 501-513.
Hunt, G,R. and Ashley, P. (1979). Spectra of altered rocks in the visible and near
infrared. Economic Geology, 74, 1613-1629.
Huntington, J.F. (1996). The role of remote sensing in finding hydrothermal mineral
deposits on Earth. Evolution of Hydrothermal Ecosystems on Earth (and Mars?).
Wiley, England, p. 214-234.
Kavak, K.S., 2005. Recognition of gypsum geohorizons in the Sivas Basin (Turkey)
using ASTER and Landsat ETM+ images. International Journal of Remote Sensing
26, 4583–4596.
Kavak, K.S., Inan, S., 2002. Enhancement facilities of SPOT XS imagery in remote
sensing geology: an example from the Sivas Tertiary Basin (central
Anatolia/Turkey). International Journal of Remote Sensing 23, 701–710.
Kaya, S., Muftuoglu, O., Tuysuz, O., 2004. Tracing the geometry of an active fault
using remote sensing and digital elevation model: Ganos segment, North Anatolian
Fault zone, Turkey. International Journal of Remote Sensing 25, 3843–3855.
Kazmin, V. (1973) Geological map of Ethiopia (scale 1:2 million). Addis Ababa,
Geological Survey.
Kenea, N. H. 1997. Improved geological mapping using Lansat TM data, Southern
Red Sea Hills, Sudan: PC and HIS decorrelation stretching. Intern. Journal of
Remote sensing, 18, (12), p. 1233-1244.
Kröner, A. et al. 1987. Pan-African crustal evolution in the Nubian segment of
northeastern Africa. Am. Geophys. Union Geodynamic Series, 17, p. 235-257.
Kruse, F. A., Boardman, J. W. and Huntington, J. F. (1999). Fifteen Years of
Hyperspectral Data: Northern Grapevine Mountains, Nevada: in Proceedings of the
8th JPL Airborne Earth Science Workshop: Jet Propulsion Laboratory Publication,
JPL Publication, 99-17, p. 247- 258.
Kujjo, May 2010, APPLICATION OF REMOTE SENSING FOR GOLD
EXPLORATION IN THE NUBA MOUNTAINS, SUDAN, master thesis, Bowling
Green State University.
Kusky, T.M, Abdelsalam, M, Tucker, R., Stern, R., 2003. Evolution of the East
African and Related Orogens, and the Assembly of Gondwana. Special Issue of
Precambrian Research 123, 81–344.
Lee, S, Talib, J.A., 2005. Probabilistic landslide susceptibility and factor effect
analysis Environmental Geology 47, 982–990.
Macdonald, I.R., Guinasso, N.L., Ackleson, S.G., Amos, J.F., Duckworth, R.,
Sassen, R., Brooks, J.M., 1993. Natural oil slicks in the Gulf of Mexico visible from
space. Journal of Geophysical Research—Oceans 98, 16351–16364.
92
Massironi, M.L., Bertoldi, P., Calafa, D., Visona, A., Bistacchi, C., Giardino, A.,
Schiavo, B., 2008. Interpretation and processing of ASTER data for geological
mapping and granitoids detection in the Saghro massif (eastern Anti-Atlas,
Morocco). Geosphere 4 (4), 736–759.
Miller, M.M.; DIXON, T.H. (1992) Late Proterozoic evolution of the northern part
of the Hamisama zone, northeast Sudan: constraints on Pan-African accretionary
tectonism. Journal Geological Society. London, v.149, p.743-750.
Molly K. Macauley and Fred M. Vukovich, Earth Science Remote Sensing Data—
Contributions to Natural Resources Policymaking, August 2005 RFF DP 05-35.
Mumby, P.J., Green, E.P., Edwards, A.J., Clark, C.D., 1997. Coral reef habitat-
mapping: how much detail can remote sensing provide? Marine Biology 130, 193–
202
Omer, M. K., 1983. The geology of the Nubian Sandstones formationin Sudan,
stratigraphy, sedimentation dynamics, and diagenesis. Geol. Miner. Resour. Dep.,
Khartoum, Sudan, 227p.
Oppenheimer, C., Francis, P.W., Rothery, D.A., Carlton, R.W.T., Glaze, L.S., 1993.
Infrared image-analysis of volcanic thermal features—Lascar volcano, Chili, 1984–
1992. Journal of Geophysical Research—Solid Earth 98, 4269–4286.
Paplinski, 1998, Directional Filtering in Edge Detection, IEEE transaction on image
processing, VOL. 7, NO. 4
Pour, B.A., Hashim, M (2011 a). Identification of hydrothermal alteration minerals
for exploring of porphyry copper deposit using ASTER data, SE Iran. Journal of
Asian Earth Sciences 42, 1309-1323.
Pour, B.A., Hashim, M (2012 a). The application of ASTER remote sensing data to
porphyry copper and epithermal gold deposits. Ore Geology Reviews 44, 1-9.
Pour, B. A., Hashim, M (2012 b). Identifying areas of high economic-potential
copper mineralization using ASTER data in Urumieh-Dokhtar Volcanic Belt, Iran.
Advances in Space Research 49, 753-769.
Pour, B. A., Hashim, M (2011 b). Spectral transformation of ASTER and the
discrimination of hydrothermal alteration minerals in a semi-arid region, SE Iran.
International Journal of the Physical Sciences 6(8), 2037-2059.
Schetselaar, E.M., Chung, C.J.F., Kim, K.E., 2000. Integration of Landsat TM,
gamma rays, magnetic, and field data to discriminate lithological units in vegetated
granite-gneiss terrain. Remote Sensing of Environment 71, 89–105
Singhroy, V., Mattar, K.E., Gray, A.L., 1998. Landslide characterisation in Canada
using interferometric SAR and combined SAR and TM images. In: Susskind, J.,
Singhroy, V., Tanaka, S. (Eds.), Remote Sensing: Inversion Problems and Natural
Hazards. Stuffler, T., Kaufmann, C., Hofer, S., Forster, K.P., Schreier, G., Mueller,
A., Eckardt, A., Bach, H., Penne, B., Benz, U., Haydn, R., 2007. The EnMAP
hyperspectral imager—an advanced optical payload for future applications in Earth
observation programmes. Acta Astronautica 61, 115–120.
93
Sultan, M. Becker, R.; Arvidson, R.E.; Shore, P.; Stern, R,J.; EL Alfy, Z.; Attia, R.I.
(1993) New constraints on red sea rifting from correlations of Arabian and Nubian
Neoproterozoic outcrops. Tectonics, v. 12, n. 6, p. 1303-1319.
Sultan, M.; Becker, R.; Arvidson, R.E.; Shore, P.; Stern, R,J.; EL Alfy, Z.; Guinness,
E.A. (1992) Nature of the Red Sea crust: a controversy revisited. Geology, v.20, p.
593-596.
Sultan, M; Arvidson. R.E.; Duncan, I.J.; Stern, R.J.; EL Kaliouby, B. (1988).
Extension of the Najd shear system from Saudi Arabia to the central Eastern Desert
of Egypt based on integrated field and Landsat observations. Tectonics, v.7, n. 6, p.
1291-1306.
Sultan, M.; Arvidson, R. E.; Sturcho, N. C.; Guinness, E. A. (1987) Lithological
mapping in arid regions with Landsat thematic mapper data: Meatiq dome, Egypt.
Geological Society American Bulletin, v. 99, p.748-762.
Sultan, M.; Arvidson, R. E.; Sturchio, N.C. (1986) Mapping of serpentinites in the
eastern desert of egypt by using Landsat thematic mapper data. Geology, v. 14, p.
995-999.
Stocker, A. D., I. S. Reed, and X. Yu, 1990, Mulitdimensional signal processing for
electrooptical target detection, Proc, SPIE Int. Soc. Opt. Eng., vol. 1305.
Tombe, M. A. 2006 Image processing techniques for geological mapping of
Kurmuk-Qeissan area. GRAS, 25p.
Vail, J. R. 1978. Outline of the geology and mineral deposits of the Democratic
Republic of the Sudan and adjacent areas. Overseas Geol. Miner. Resour., London,
49, p. 1-67.
Van der Meer. 2012, Multi- and hyperspectral geologic remote sensing: A review,
International Journal of Applied Earth Observation and Geoinformation, 14 (2012)
112–128
Whiteman, A. J. 1970. The geology of the Sudan Republic. Clarendon press: Oxford,
290p.
Yesou, H., Besnus, Y., Rolet, J., 1993. Extraction of spectral information from
Landsat TM data and merger with SPOT panchromatic imagery - a contribution to
the study of geological structures. Isprs Journal of Photogrammetry and Remote
Sensing 48, 23–36
Yu, X., I. S. Reed, and A. D. Stocker, 1993, Comparative performance analysis of
adaptive multispectral detectors, IEEE Trans. on Signal Processing, vol. 41, no. 8.

![TETRABUTYLPHOSPHONIUM TRIFLUOROACETATE ([P ]CF … · Osmosis kehadapan (FO) diiktiraf sebagai teknologi membran berpotensi yang menggunakan tenaga yang rendah untuk penyahgaraman](https://img.pdfslide.us/doc/110x75/5cae970688c9938f4d8d37da/tetrabutylphosphonium-trifluoroacetate-p-cf-osmosis-kehadapan-fo-diiktiraf.jpg)