Embed Size (px)
Citation preview

Detection of glomeruli in renal pathologyby mutual comparison of multiple staining modalities
M. Temerinac-Ott∗, G. Forestier†, J. Schmitz‡, M. Hermsen§, J.H. Brasen‡, F. Feuerhake‡ and C. Wemmert∗∗ICube, University of Strasbourg, France†MIPS, University of Haute Alsace, France
‡RUMC, Radboud University Medical Center, Nijmegen, The Netherlands§Institute for Pathology, MHH, Hannover Medical School, Germany
Abstract—We evaluate the detection of glomerular structuresin whole slide images (WSIs) of histopathological slides stainedwith multiple histochemical and immuno-histochemical stainingusing a convolutional neural network (CNN) based approach. Wemutually compare the CNN performance on different stainings(Jones H&E, PAS, Sirius Red and CD10) and we present a novelapproach to improve glomeruli detection on one staining by tak-ing into account the classification results from differently stainedconsecutive sections of the same tissue. Using this integrativeapproach, the detection rate (F1-score) on a single stain can beimproved by up to 30%.
I. INTRODUCTION
The detection of glomeruli plays an important role in renalbiopsy evaluation. As an example, for grading of biopsies afterkidney transplantation according to the Banff classificationscheme [1] the minimal glomeruli number is seven (marginallyrepresentative) or more. Ten glomeruli are adequate and rep-resentative. Further examples for the relevance of detectingglomeruli include quantification of morphological changes(e.g., sclerotic glomeruli), vascular pathology, and infiltrationby immune cells. Most steps of biopsy evaluation are per-formed in so-called ”routine” staining protocols (e.g., H&E,PAS), and various specific immunohistochemistry (IHC), orhistochemistry staining methods are used to delineate differentadditional relevant structures, such as integrity of the basallamina (e.g., PAS, Jones), complement expression on vascularendothelium (e.g. C4d), and many others.
The digitization of microscopical slides to whole slideimages (WSI) has led to a new research field often referred toas ”digital pathology”, broadening the technological capabili-ties and adding to the conventional biopsy evaluation, wheretissue sections on glass slides are visually analyzed by trainedpathologists using a light microscope. The emerging newdigital methods enable storage and analysis of image-baseddata beyond visual inspection, complementing establishedworkflows, and increasing efficiency in some aspects, suchas high-throughput quantification. However, many questionsremain open on how to transfer formalized expert knowledgeto computer systems and how to increase objectivity andreproducibility of WSI analysis [2], [3].
Formalin-fixed and paraffin-embedded (FFPE) renal tissuewas serially sectioned, resulting in 2-3 micrometers thicksections. The renal tissue analyzed for this study was obtainedfrom kidneys which were taken out due to a tumor (nephrec-tomies) and small needle biopsies. The tissue parts usedfrom the nephrectomies were tumor-free and showed normal
morphology. Due to their big size and thus high numbersof glomeruli (in relation to the biopsies) these nephrectomysamples were used as a first training set for the detection ofglomeruli.
The prepared sections from biopsies or from nephrectomiescan be stained with different markers for certain cell typeslike T-cells, B-cells, macrophages or certain tissue or cellsubcompartments. Standard staining techniques in the clinicalroutine are usually limited to one or two IHC markers on onesection. This, and the different histochemical staining modal-ities that highlight distinct compartments, requires evaluationof consecutive sections from the same tissue. The alignmentof the different markers is ”computed” in the brain of thepathologists while viewing one slide after the other underthe microscope, focusing on diagnostically relevant regions.Automatic detection of glomeruli might complement diagnos-tic procedures by counting normal and sclerotic glomeruli orevaluating immune cell infiltration.
Previous published work on detection of glomeruli inmouse renal samples [4] was done using Histogram of OrientedGradients (HOG) features and Support Vector Machine (SVM)to first detect windows containing glomeruli candidates. Asegmentation algorithm was then applied to extract the pre-cise boundaries of the detected glomeruli. An approach fordetecting glomeruli using Fitzgibon’s ellipse fitting method inhuman tissue was presented in [5] and applied to WSIs ofsections stained with the histochemical Masson’s trichrome. Ak-means classification based approach for glomeruli detectionon CD68 and CD34 double stainings was presented in [6].Deep Learning showed superior results for detecting tumors inWSI [7] and was recently successfully applied to automateddetection of specific regions of interest in WSI of breast tissue,specifically lobular areas in the human mammary gland [8].
In this paper, we address three questions that are importantfor detecting glomeruli: (1) Which of the currently existingmethods is best suitable for detecting glomeruli in WSI? (2)What differences can be found for the detection in differentstainings? (3) How can we mutually combine the informationfrom multiple stainings to achieve better detection results?
II. GLOMERULI DETECTION
A. Context
A glomerulus consists of a ball-like network of specializedcapillaries, representing the filter of the functional renal unitcalled nephron. The filtrated primary urine is collected in the
(a) CD10 (b) PAS
(c) Sirius Red (d) Jones H&E
Fig. 1: Same glomerulus in consecutive section, visualized withdifferent stainings.
surrounding cup-like structure named bowman’s capsule andtransferred to the tubular apparatus, which concentrates thefiltrate from up to 200 liters of primary urine to 1.5 litersof final urine. In Fig. 1 we show how the same glomerulusis represented in several serial sections stained with differentstaining modalities. While the whole object is delineated, itis obvious that different tissue components are highlighted:CD10 stains the glomerular podocytes, Bowman’s epitheliumand proximal tubules; Jones silver and PAS stain glomerularbasement membranes, and Sirius Red stains connective tissue(collagen). Therefore, the added information obtained by dif-ferent techniques is superior to single staining, and beyondvisually detecting glomeruli some diagnostic tasks require tocombine information from multiple modalities.
Reliable detection of glomeruli in different staining modal-ities is also relevant for another aspect: Sequential sections ofthe same 3-dimensional structure may provide additional im-portant information that is lost when the nearly 2-dimensional,only few microns thick sections are evaluated one by one. Forexample, loss or artificial changes of the morphology (e.g., dueto tissue processing or sectioning) can be compensated, if thesame glomerular structure is better represented in neighboringcutting levels.
B. HOG features classifier
Histogram of Oriented Gradients (HOG) [9] is a powerfuland fast tool for detecting objects in images. It has alreadybeen applied in brightfield pathological images analysis forcell detection of human prostate cancer cells [10].
As a preprocessing step we use morphological operations toseparate the tissue from the white background. The training isperformed using patches from the tissue only. HOG featuresare extracted on the annotated glomeruli, using the VLFeatlibrary and the HOG cell size of 8 on rescaled glomeruliimages of size 64×64×3. A SVM model is trained usingthe positive glomeruli examples and applied to all the pixelsfrom the tissue using the sliding window approach, thereby
producing a score for each pixel of the tissue. The detectionis computed for multiple scales (2−1, 2−0.75, ..., 21.75, 22) ofthe image. We use hard negative mining to select the negativeexamples and iterate the training of the SVM model for sevenrounds. For testing, the learned SVM model is applied to anew image and the top 200 detections with the highest scoreare returned.
C. CNN classifier
Deep learning has proven its efficiency in WSI analysis [7].A Convolutional Neural Network (CNN) [11] has the abilityto learn a hierarchical description of visual patterns from a setof annotated examples, and then make accurate predictions fornew visual inputs. By combining patch–based image analysiswith CNNs, it is possible to automatically detect glomeruli inrenal histological images.
For patch–based image analysis, we assume that it ispossible to predict the class of a pixel by observing itsneighboring pixels. We settled on a square neighborhood ofsize 128 µm which is enough to cover the major part of thecross-section of a glomerulus with its surroundings (glomeruliare approximately 0.2 mm in diameter; size of glomeruli insections firstly depends on cutting plane through the three-dimensional ball structure, secondly shrinkage due to tissuefixation leads to smaller diameter in the sections). It is thenpossible to generate, for each pixel, a description of the patchcentered on this pixel (i.e. a square RGB patch describedby 32 × 32 × 3 values). The resolution of the patch is 4µm/pixel. In images annotated by a pathologist, each patchcan be considered positive or negative according to its centralpixel: if a pixel is in an annotated glomerulus, then its patchis positive, otherwise it is negative.
Our CNN is a function that can predict the class of a patch(positive or negative) based on its featureless description. Theassociated deep network architecture (Table I) is designed toperform multiclass classification of small RGB images [12],which is conveniently similar to the task of patch classification.We initialize the network using random weights drawn from azero-mean Gaussian distribution.
Input 32 × 32 × 3Convolution layer kernels: 32; size: 5 × 5; padding: 2Max–pooling layer size: 3 × 3; stride: 2Activation layer Rectified Linear Unit (ReLU)Convolution layer kernels: 32; size: 5 × 5; padding: 2Activation layer ReLUAverage-pooling layer size: 3 × 3; stride: 2Convolution layer kernels: 64; size: 5 × 5; padding: 2Activation layer ReLUAverage–pooling layer size: 3 × 3; stride: 2Fully connected layer neurons: 64Fully connected layer neurons: 2
TABLE I: Network architecture adapted from CIFAR10 Quickexample to two classes.
D. Combining image information from multiple stainings bymutual comparison
In order to confirm the detection of glomeruli in consec-utive sections of the same tissue, which were stained usingdifferent stainings, we propose to first co-register the sections
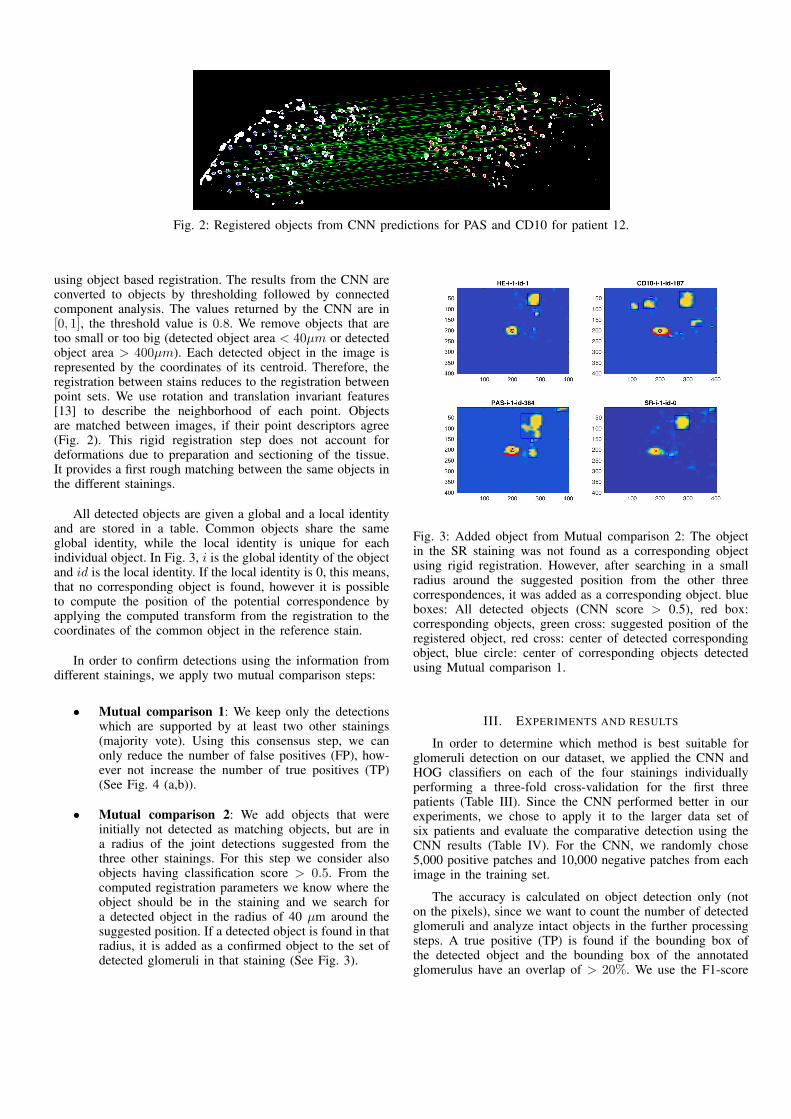
Fig. 2: Registered objects from CNN predictions for PAS and CD10 for patient 12.
using object based registration. The results from the CNN areconverted to objects by thresholding followed by connectedcomponent analysis. The values returned by the CNN are in[0, 1], the threshold value is 0.8. We remove objects that aretoo small or too big (detected object area < 40µm or detectedobject area > 400µm). Each detected object in the image isrepresented by the coordinates of its centroid. Therefore, theregistration between stains reduces to the registration betweenpoint sets. We use rotation and translation invariant features[13] to describe the neighborhood of each point. Objectsare matched between images, if their point descriptors agree(Fig. 2). This rigid registration step does not account fordeformations due to preparation and sectioning of the tissue.It provides a first rough matching between the same objects inthe different stainings.
All detected objects are given a global and a local identityand are stored in a table. Common objects share the sameglobal identity, while the local identity is unique for eachindividual object. In Fig. 3, i is the global identity of the objectand id is the local identity. If the local identity is 0, this means,that no corresponding object is found, however it is possibleto compute the position of the potential correspondence byapplying the computed transform from the registration to thecoordinates of the common object in the reference stain.
In order to confirm detections using the information fromdifferent stainings, we apply two mutual comparison steps:
• Mutual comparison 1: We keep only the detectionswhich are supported by at least two other stainings(majority vote). Using this consensus step, we canonly reduce the number of false positives (FP), how-ever not increase the number of true positives (TP)(See Fig. 4 (a,b)).
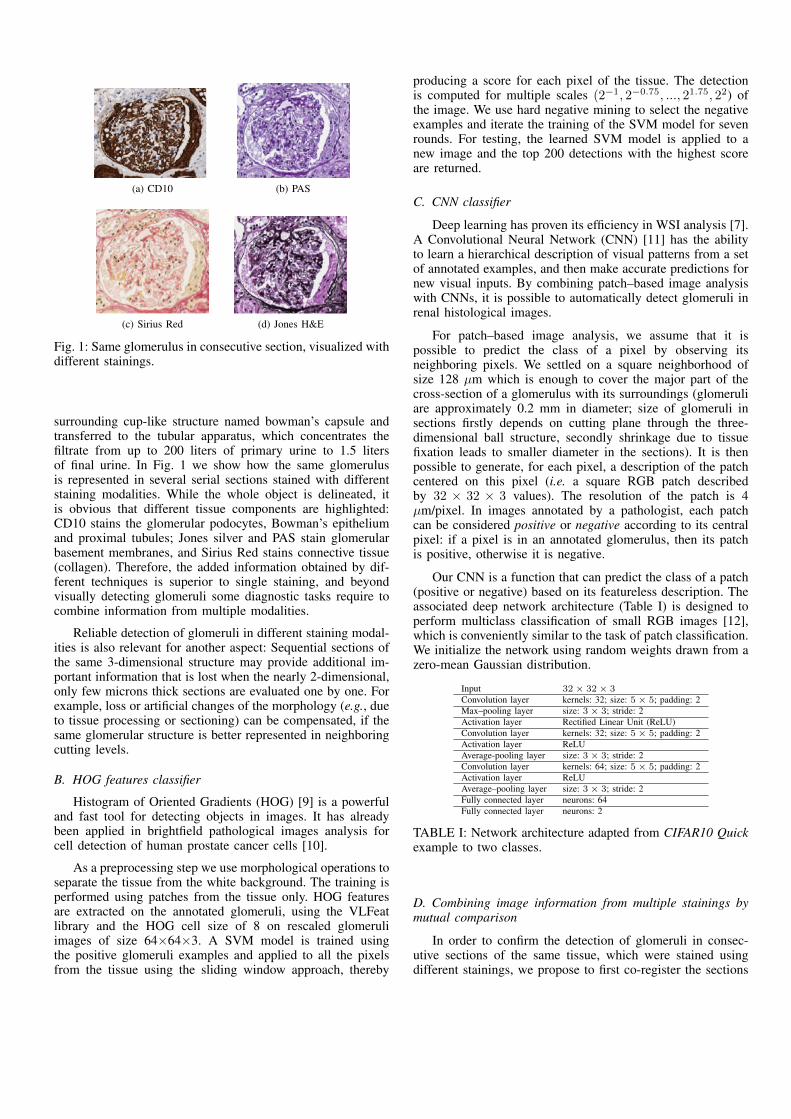
• Mutual comparison 2: We add objects that wereinitially not detected as matching objects, but are ina radius of the joint detections suggested from thethree other stainings. For this step we consider alsoobjects having classification score > 0.5. From thecomputed registration parameters we know where theobject should be in the staining and we search fora detected object in the radius of 40 µm around thesuggested position. If a detected object is found in thatradius, it is added as a confirmed object to the set ofdetected glomeruli in that staining (See Fig. 3).
Fig. 3: Added object from Mutual comparison 2: The objectin the SR staining was not found as a corresponding objectusing rigid registration. However, after searching in a smallradius around the suggested position from the other threecorrespondences, it was added as a corresponding object. blueboxes: All detected objects (CNN score > 0.5), red box:corresponding objects, green cross: suggested position of theregistered object, red cross: center of detected correspondingobject, blue circle: center of corresponding objects detectedusing Mutual comparison 1.
III. EXPERIMENTS AND RESULTS
In order to determine which method is best suitable forglomeruli detection on our dataset, we applied the CNN andHOG classifiers on each of the four stainings individuallyperforming a three-fold cross-validation for the first threepatients (Table III). Since the CNN performed better in ourexperiments, we chose to apply it to the larger data set ofsix patients and evaluate the comparative detection using theCNN results (Table IV). For the CNN, we randomly chose5,000 positive patches and 10,000 negative patches from eachimage in the training set.
The accuracy is calculated on object detection only (noton the pixels), since we want to count the number of detectedglomeruli and analyze intact objects in the further processingsteps. A true positive (TP) is found if the bounding box ofthe detected object and the bounding box of the annotatedglomerulus have an overlap of > 20%. We use the F1-score
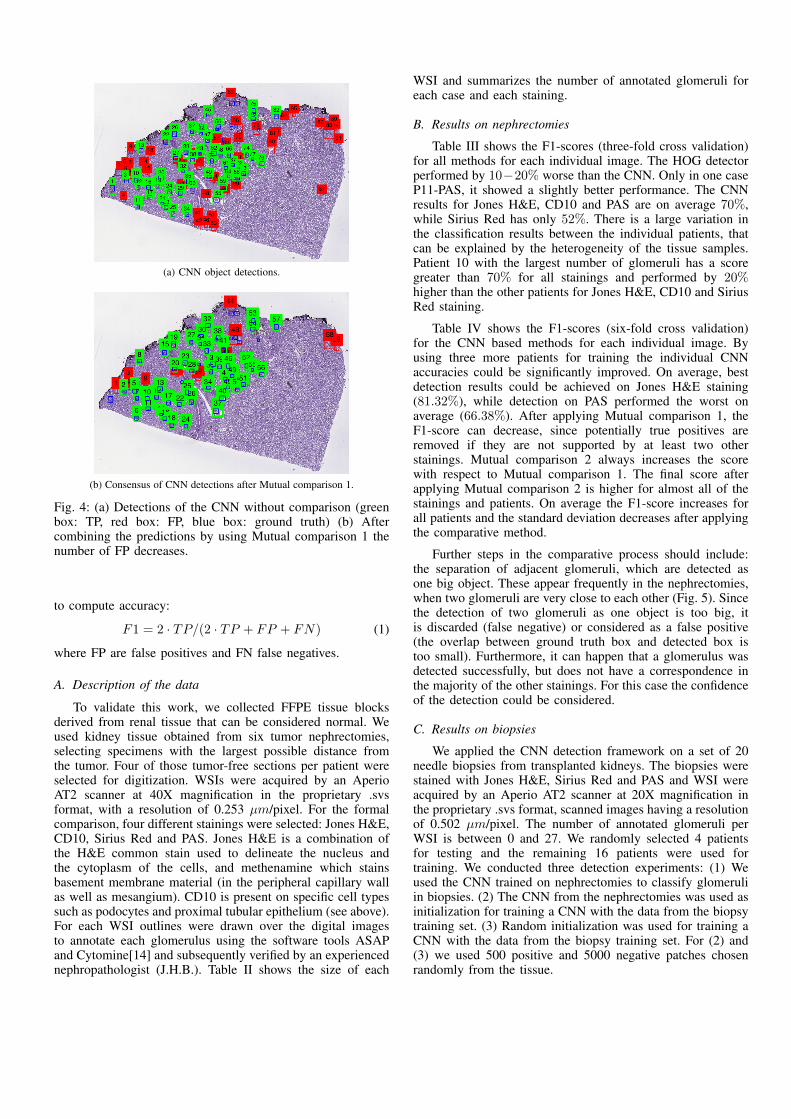
(a) CNN object detections.
(b) Consensus of CNN detections after Mutual comparison 1.
Fig. 4: (a) Detections of the CNN without comparison (greenbox: TP, red box: FP, blue box: ground truth) (b) Aftercombining the predictions by using Mutual comparison 1 thenumber of FP decreases.
to compute accuracy:
F1 = 2 · TP/(2 · TP + FP + FN) (1)
where FP are false positives and FN false negatives.
A. Description of the data
To validate this work, we collected FFPE tissue blocksderived from renal tissue that can be considered normal. Weused kidney tissue obtained from six tumor nephrectomies,selecting specimens with the largest possible distance fromthe tumor. Four of those tumor-free sections per patient wereselected for digitization. WSIs were acquired by an AperioAT2 scanner at 40X magnification in the proprietary .svsformat, with a resolution of 0.253 µm/pixel. For the formalcomparison, four different stainings were selected: Jones H&E,CD10, Sirius Red and PAS. Jones H&E is a combination ofthe H&E common stain used to delineate the nucleus andthe cytoplasm of the cells, and methenamine which stainsbasement membrane material (in the peripheral capillary wallas well as mesangium). CD10 is present on specific cell typessuch as podocytes and proximal tubular epithelium (see above).For each WSI outlines were drawn over the digital imagesto annotate each glomerulus using the software tools ASAPand Cytomine[14] and subsequently verified by an experiencednephropathologist (J.H.B.). Table II shows the size of each
WSI and summarizes the number of annotated glomeruli foreach case and each staining.
B. Results on nephrectomies
Table III shows the F1-scores (three-fold cross validation)for all methods for each individual image. The HOG detectorperformed by 10−20% worse than the CNN. Only in one caseP11-PAS, it showed a slightly better performance. The CNNresults for Jones H&E, CD10 and PAS are on average 70%,while Sirius Red has only 52%. There is a large variation inthe classification results between the individual patients, thatcan be explained by the heterogeneity of the tissue samples.Patient 10 with the largest number of glomeruli has a scoregreater than 70% for all stainings and performed by 20%higher than the other patients for Jones H&E, CD10 and SiriusRed staining.
Table IV shows the F1-scores (six-fold cross validation)for the CNN based methods for each individual image. Byusing three more patients for training the individual CNNaccuracies could be significantly improved. On average, bestdetection results could be achieved on Jones H&E staining(81.32%), while detection on PAS performed the worst onaverage (66.38%). After applying Mutual comparison 1, theF1-score can decrease, since potentially true positives areremoved if they are not supported by at least two otherstainings. Mutual comparison 2 always increases the scorewith respect to Mutual comparison 1. The final score afterapplying Mutual comparison 2 is higher for almost all of thestainings and patients. On average the F1-score increases forall patients and the standard deviation decreases after applyingthe comparative method.
Further steps in the comparative process should include:the separation of adjacent glomeruli, which are detected asone big object. These appear frequently in the nephrectomies,when two glomeruli are very close to each other (Fig. 5). Sincethe detection of two glomeruli as one object is too big, itis discarded (false negative) or considered as a false positive(the overlap between ground truth box and detected box istoo small). Furthermore, it can happen that a glomerulus wasdetected successfully, but does not have a correspondence inthe majority of the other stainings. For this case the confidenceof the detection could be considered.
C. Results on biopsies
We applied the CNN detection framework on a set of 20needle biopsies from transplanted kidneys. The biopsies werestained with Jones H&E, Sirius Red and PAS and WSI wereacquired by an Aperio AT2 scanner at 20X magnification inthe proprietary .svs format, scanned images having a resolutionof 0.502 µm/pixel. The number of annotated glomeruli perWSI is between 0 and 27. We randomly selected 4 patientsfor testing and the remaining 16 patients were used fortraining. We conducted three detection experiments: (1) Weused the CNN trained on nephrectomies to classify glomeruliin biopsies. (2) The CNN from the nephrectomies was used asinitialization for training a CNN with the data from the biopsytraining set. (3) Random initialization was used for training aCNN with the data from the biopsy training set. For (2) and(3) we used 500 positive and 5000 negative patches chosenrandomly from the tissue.
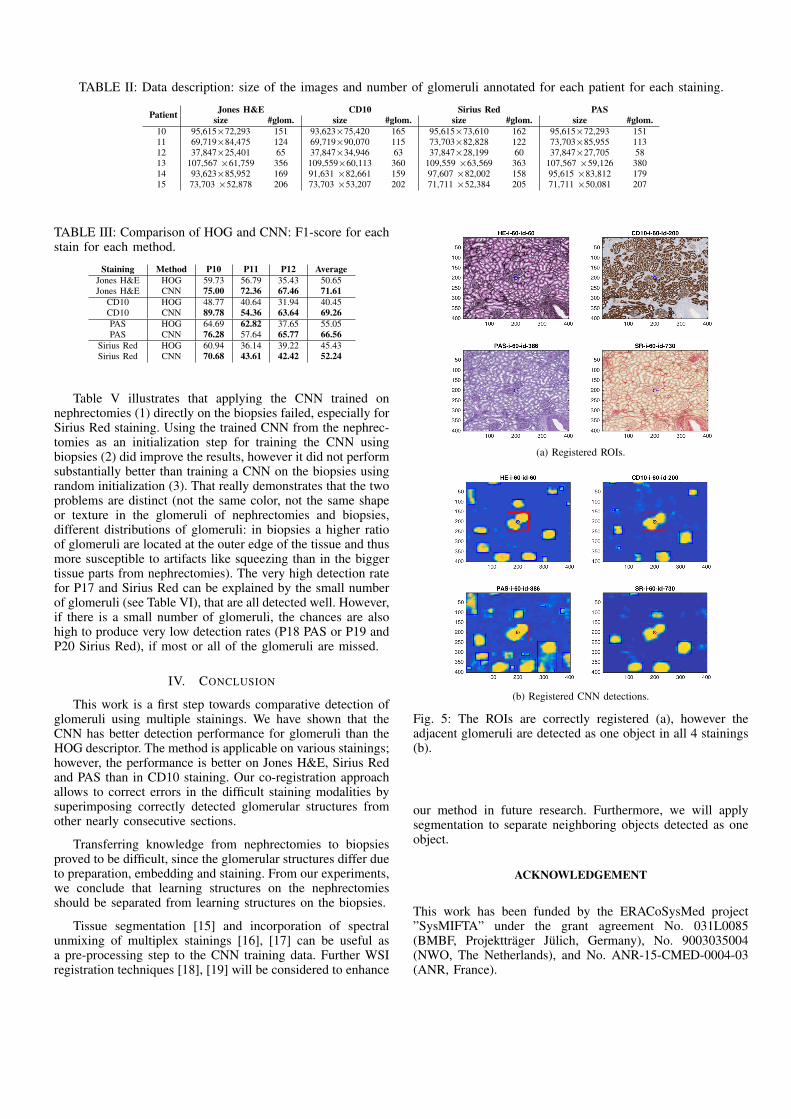
TABLE II: Data description: size of the images and number of glomeruli annotated for each patient for each staining.
Patient Jones H&E CD10 Sirius Red PASsize #glom. size #glom. size #glom. size #glom.
10 95,615×72,293 151 93,623×75,420 165 95,615×73,610 162 95,615×72,293 15111 69,719×84,475 124 69,719×90,070 115 73,703×82,828 122 73,703×85,955 11312 37,847×25,401 65 37,847×34,946 63 37,847×28,199 60 37,847×27,705 5813 107,567 ×61,759 356 109,559×60,113 360 109,559 ×63,569 363 107,567 ×59,126 38014 93,623×85,952 169 91,631 ×82,661 159 97,607 ×82,002 158 95,615 ×83,812 17915 73,703 ×52,878 206 73,703 ×53,207 202 71,711 ×52,384 205 71,711 ×50,081 207
TABLE III: Comparison of HOG and CNN: F1-score for eachstain for each method.
Staining Method P10 P11 P12 AverageJones H&E HOG 59.73 56.79 35.43 50.65Jones H&E CNN 75.00 72.36 67.46 71.61
CD10 HOG 48.77 40.64 31.94 40.45CD10 CNN 89.78 54.36 63.64 69.26PAS HOG 64.69 62.82 37.65 55.05PAS CNN 76.28 57.64 65.77 66.56
Sirius Red HOG 60.94 36.14 39.22 45.43Sirius Red CNN 70.68 43.61 42.42 52.24
Table V illustrates that applying the CNN trained onnephrectomies (1) directly on the biopsies failed, especially forSirius Red staining. Using the trained CNN from the nephrec-tomies as an initialization step for training the CNN usingbiopsies (2) did improve the results, however it did not performsubstantially better than training a CNN on the biopsies usingrandom initialization (3). That really demonstrates that the twoproblems are distinct (not the same color, not the same shapeor texture in the glomeruli of nephrectomies and biopsies,different distributions of glomeruli: in biopsies a higher ratioof glomeruli are located at the outer edge of the tissue and thusmore susceptible to artifacts like squeezing than in the biggertissue parts from nephrectomies). The very high detection ratefor P17 and Sirius Red can be explained by the small numberof glomeruli (see Table VI), that are all detected well. However,if there is a small number of glomeruli, the chances are alsohigh to produce very low detection rates (P18 PAS or P19 andP20 Sirius Red), if most or all of the glomeruli are missed.
IV. CONCLUSION
This work is a first step towards comparative detection ofglomeruli using multiple stainings. We have shown that theCNN has better detection performance for glomeruli than theHOG descriptor. The method is applicable on various stainings;however, the performance is better on Jones H&E, Sirius Redand PAS than in CD10 staining. Our co-registration approachallows to correct errors in the difficult staining modalities bysuperimposing correctly detected glomerular structures fromother nearly consecutive sections.
Transferring knowledge from nephrectomies to biopsiesproved to be difficult, since the glomerular structures differ dueto preparation, embedding and staining. From our experiments,we conclude that learning structures on the nephrectomiesshould be separated from learning structures on the biopsies.
Tissue segmentation [15] and incorporation of spectralunmixing of multiplex stainings [16], [17] can be useful asa pre-processing step to the CNN training data. Further WSIregistration techniques [18], [19] will be considered to enhance
(a) Registered ROIs.
(b) Registered CNN detections.
Fig. 5: The ROIs are correctly registered (a), however theadjacent glomeruli are detected as one object in all 4 stainings(b).
our method in future research. Furthermore, we will applysegmentation to separate neighboring objects detected as oneobject.
ACKNOWLEDGEMENT
This work has been funded by the ERACoSysMed project”SysMIFTA” under the grant agreement No. 031L0085(BMBF, Projekttrager Julich, Germany), No. 9003035004(NWO, The Netherlands), and No. ANR-15-CMED-0004-03(ANR, France).
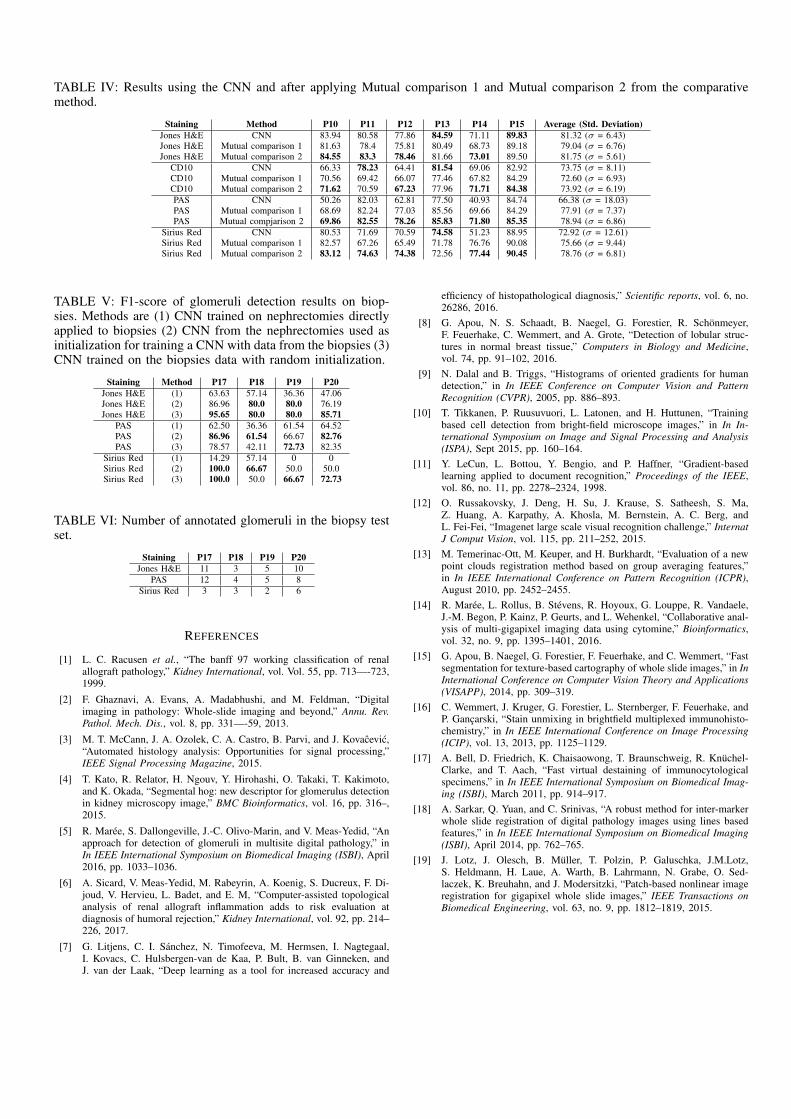
TABLE IV: Results using the CNN and after applying Mutual comparison 1 and Mutual comparison 2 from the comparativemethod.
Staining Method P10 P11 P12 P13 P14 P15 Average (Std. Deviation)Jones H&E CNN 83.94 80.58 77.86 84.59 71.11 89.83 81.32 (σ = 6.43)Jones H&E Mutual comparison 1 81.63 78.4 75.81 80.49 68.73 89.18 79.04 (σ = 6.76)Jones H&E Mutual comparison 2 84.55 83.3 78.46 81.66 73.01 89.50 81.75 (σ = 5.61)
CD10 CNN 66.33 78.23 64.41 81.54 69.06 82.92 73.75 (σ = 8.11)CD10 Mutual comparison 1 70.56 69.42 66.07 77.46 67.82 84.29 72.60 (σ = 6.93)CD10 Mutual comparison 2 71.62 70.59 67.23 77.96 71.71 84.38 73.92 (σ = 6.19)PAS CNN 50.26 82.03 62.81 77.50 40.93 84.74 66.38 (σ = 18.03)PAS Mutual comparison 1 68.69 82.24 77.03 85.56 69.66 84.29 77.91 (σ = 7.37)PAS Mutual compjarison 2 69.86 82.55 78.26 85.83 71.80 85.35 78.94 (σ = 6.86)
Sirius Red CNN 80.53 71.69 70.59 74.58 51.23 88.95 72.92 (σ = 12.61)Sirius Red Mutual comparison 1 82.57 67.26 65.49 71.78 76.76 90.08 75.66 (σ = 9.44)Sirius Red Mutual comparison 2 83.12 74.63 74.38 72.56 77.44 90.45 78.76 (σ = 6.81)
TABLE V: F1-score of glomeruli detection results on biop-sies. Methods are (1) CNN trained on nephrectomies directlyapplied to biopsies (2) CNN from the nephrectomies used asinitialization for training a CNN with data from the biopsies (3)CNN trained on the biopsies data with random initialization.
Staining Method P17 P18 P19 P20Jones H&E (1) 63.63 57.14 36.36 47.06Jones H&E (2) 86.96 80.0 80.0 76.19Jones H&E (3) 95.65 80.0 80.0 85.71
PAS (1) 62.50 36.36 61.54 64.52PAS (2) 86.96 61.54 66.67 82.76PAS (3) 78.57 42.11 72.73 82.35
Sirius Red (1) 14.29 57.14 0 0Sirius Red (2) 100.0 66.67 50.0 50.0Sirius Red (3) 100.0 50.0 66.67 72.73
TABLE VI: Number of annotated glomeruli in the biopsy testset.
Staining P17 P18 P19 P20Jones H&E 11 3 5 10
PAS 12 4 5 8Sirius Red 3 3 2 6
REFERENCES
[1] L. C. Racusen et al., “The banff 97 working classification of renalallograft pathology,” Kidney International, vol. Vol. 55, pp. 713—-723,1999.
[2] F. Ghaznavi, A. Evans, A. Madabhushi, and M. Feldman, “Digitalimaging in pathology: Whole-slide imaging and beyond,” Annu. Rev.Pathol. Mech. Dis., vol. 8, pp. 331—-59, 2013.
[3] M. T. McCann, J. A. Ozolek, C. A. Castro, B. Parvi, and J. Kovacevic,“Automated histology analysis: Opportunities for signal processing,”IEEE Signal Processing Magazine, 2015.
[4] T. Kato, R. Relator, H. Ngouv, Y. Hirohashi, O. Takaki, T. Kakimoto,and K. Okada, “Segmental hog: new descriptor for glomerulus detectionin kidney microscopy image,” BMC Bioinformatics, vol. 16, pp. 316–,2015.
[5] R. Maree, S. Dallongeville, J.-C. Olivo-Marin, and V. Meas-Yedid, “Anapproach for detection of glomeruli in multisite digital pathology,” inIn IEEE International Symposium on Biomedical Imaging (ISBI), April2016, pp. 1033–1036.
[6] A. Sicard, V. Meas-Yedid, M. Rabeyrin, A. Koenig, S. Ducreux, F. Di-joud, V. Hervieu, L. Badet, and E. M, “Computer-assisted topologicalanalysis of renal allograft inflammation adds to risk evaluation atdiagnosis of humoral rejection,” Kidney International, vol. 92, pp. 214–226, 2017.
[7] G. Litjens, C. I. Sanchez, N. Timofeeva, M. Hermsen, I. Nagtegaal,I. Kovacs, C. Hulsbergen-van de Kaa, P. Bult, B. van Ginneken, andJ. van der Laak, “Deep learning as a tool for increased accuracy and
efficiency of histopathological diagnosis,” Scientific reports, vol. 6, no.26286, 2016.
[8] G. Apou, N. S. Schaadt, B. Naegel, G. Forestier, R. Schonmeyer,F. Feuerhake, C. Wemmert, and A. Grote, “Detection of lobular struc-tures in normal breast tissue,” Computers in Biology and Medicine,vol. 74, pp. 91–102, 2016.
[9] N. Dalal and B. Triggs, “Histograms of oriented gradients for humandetection,” in In IEEE Conference on Computer Vision and PatternRecognition (CVPR), 2005, pp. 886–893.
[10] T. Tikkanen, P. Ruusuvuori, L. Latonen, and H. Huttunen, “Trainingbased cell detection from bright-field microscope images,” in In In-ternational Symposium on Image and Signal Processing and Analysis(ISPA), Sept 2015, pp. 160–164.
[11] Y. LeCun, L. Bottou, Y. Bengio, and P. Haffner, “Gradient-basedlearning applied to document recognition,” Proceedings of the IEEE,vol. 86, no. 11, pp. 2278–2324, 1998.
[12] O. Russakovsky, J. Deng, H. Su, J. Krause, S. Satheesh, S. Ma,Z. Huang, A. Karpathy, A. Khosla, M. Bernstein, A. C. Berg, andL. Fei-Fei, “Imagenet large scale visual recognition challenge,” InternatJ Comput Vision, vol. 115, pp. 211–252, 2015.
[13] M. Temerinac-Ott, M. Keuper, and H. Burkhardt, “Evaluation of a newpoint clouds registration method based on group averaging features,”in In IEEE International Conference on Pattern Recognition (ICPR),August 2010, pp. 2452–2455.
[14] R. Maree, L. Rollus, B. Stevens, R. Hoyoux, G. Louppe, R. Vandaele,J.-M. Begon, P. Kainz, P. Geurts, and L. Wehenkel, “Collaborative anal-ysis of multi-gigapixel imaging data using cytomine,” Bioinformatics,vol. 32, no. 9, pp. 1395–1401, 2016.
[15] G. Apou, B. Naegel, G. Forestier, F. Feuerhake, and C. Wemmert, “Fastsegmentation for texture-based cartography of whole slide images,” in InInternational Conference on Computer Vision Theory and Applications(VISAPP), 2014, pp. 309–319.
[16] C. Wemmert, J. Kruger, G. Forestier, L. Sternberger, F. Feuerhake, andP. Gancarski, “Stain unmixing in brightfield multiplexed immunohisto-chemistry,” in In IEEE International Conference on Image Processing(ICIP), vol. 13, 2013, pp. 1125–1129.
[17] A. Bell, D. Friedrich, K. Chaisaowong, T. Braunschweig, R. Knuchel-Clarke, and T. Aach, “Fast virtual destaining of immunocytologicalspecimens,” in In IEEE International Symposium on Biomedical Imag-ing (ISBI), March 2011, pp. 914–917.
[18] A. Sarkar, Q. Yuan, and C. Srinivas, “A robust method for inter-markerwhole slide registration of digital pathology images using lines basedfeatures,” in In IEEE International Symposium on Biomedical Imaging(ISBI), April 2014, pp. 762–765.
[19] J. Lotz, J. Olesch, B. Muller, T. Polzin, P. Galuschka, J.M.Lotz,S. Heldmann, H. Laue, A. Warth, B. Lahrmann, N. Grabe, O. Sed-laczek, K. Breuhahn, and J. Modersitzki, “Patch-based nonlinear imageregistration for gigapixel whole slide images,” IEEE Transactions onBiomedical Engineering, vol. 63, no. 9, pp. 1812–1819, 2015.