Embed Size (px)
Citation preview

Detection of genre-specific musical instruments:The case of the mellotron
Carlos Gustavo Román Echeverri
MASTER THESIS UPF / 2011
Master in Sound and Music Computing
Master thesis supervisor:Perfecto Herrera
Department of Information and Communication Technologies Universitat Pompeu Fabra, Barcelona

Contents1 Introduction........................................................................................................................3
1.1Motivation......................................................................................................................31.2Goals and organization.................................................................................................3
2 State-of-the-art...................................................................................................................52.1Problem Statement.......................................................................................................52.2Classification in Music..................................................................................................62.3On timbre......................................................................................................................62.4Automatic instrument classification..............................................................................72.5Descriptors....................................................................................................................92.6Techniques..................................................................................................................102.7Proposed approach for detecting musical instruments in polyphonic audio..............112.8The mellotron..............................................................................................................12
3 Methodology.....................................................................................................................163.1Collections..................................................................................................................163.2Feature extraction.......................................................................................................173.3Machine Learning ......................................................................................................173.4Additional implementations.........................................................................................203.5Test and Evaluation....................................................................................................20
4 Experiments and results..................................................................................................224.1Initial experiment. Nimrod: Comparing classical music pieces with their versions for mellotron..........................................................................................................................22
4.1.1Description...........................................................................................................224.1.2Procedure............................................................................................................224.1.3Results and discussion........................................................................................23
4.2Specific instrument experiments: flutes, strings, choir...............................................254.2.1Description ..........................................................................................................254.2.2Procedure............................................................................................................264.2.3Julia Dream: Comparing flute and mellotron flute samples in polyphonic music.....................................................................................................................................274.2.4Watcher of the Skies: Comparing strings and mellotron strings samples in polyphonic music.........................................................................................................294.2.5Exit Music: Comparing choir and mellotron choir samples in polyphonic music .....................................................................................................................................314.2.6Results and discussion........................................................................................33
4.3Final Experiments: combining databases ..................................................................334.3.1Kashmir: combining strings, flute and choir samples..........................................344.3.2Space Oddity: comparing mellotron sounds with rock/pop and electronic music samples.......................................................................................................................364.3.3Epitaph: comparing mellotron samples with specific instruments and generic rock/pop and electronic music samples......................................................................374.3.4Results and discussion........................................................................................38
5 Conclusions......................................................................................................................395.1On the project.............................................................................................................395.2On the methodology...................................................................................................395.3Future work.................................................................................................................40

1 Introduction
1.1 Motivation and goalsThis document addresses the problem of detection of musical instruments in polyphonic audio, exemplifying this specific task by analyzing the mellotron, a vintage sampler used in popular music. In current Music Computing scenarios it is common to find research about automatically describing, classifying and labeling pieces of music. One of the most interesting features that can be analyzed in this topic is precisely that of musical instruments. Instrumentation in music is a very important field of description, which leads to a larger discussion involving, amongst others, the way we perceive sound. This provides an interesting way to approach and comprehend music, not only as some form of data in the information age, but as one of the essential milestones on which cultures and societies are built and developed.
General goals intended to be achieved in this project involve making a comprehensive state-of-the-art review, familiarizing with several renown methods and techniques, establish a well-defined methodology, designing and running several experiments that, from different perspectives, could eventually lead to a general understanding of the problem.
This project took advantage of research currently conducted in the Music Technology Group at Universitat Pompeu Fabra. Primarily, the basic methodology for the project was taken from the work of Ferdinand Fuhrmann, as supervised by Perfecto Herrera. Part of this project was selected and presented in the Reading Mediated Minds: Empathy with Persons and Characters in Media and Art Works Summer School organized by the CCCT (Center for Creation, Content and Technology) at the Amsterdam University College in July 2011, which goes to show the potential of the topic not only for the specific Music Information Retrieval field, but also for other different and broader scientific areas as diverse as cognitive sciences or computational musicology, proving how vast, pertinent and relevant the topic is and the many possibilities for researching in several areas of knowledge nowadays.
1.2 Organization
The first section is dedicated to the problem statement and current state-of-the-art. Here, the specific field of Music Information Retrieval is addressed, including: the importance of classification; the historical issue of timbre in music; the importance and possible applications of automatic musical instrument search, retrieval and classification; the way low-level audio description can be accomplished; reviewing some previously research and techniques used for accomplishing the task; describing the proposed approach to instrument detection in polyphonic audio; and finally, a comprehensive technical description of the instrument selected, along with some of its more relevant features.
The second section refers to the methodology. Here, specific aspects of the method selected are explained in detail, including details on the music collections used, the feature extraction process, the feature selection methods, specific machine learning techniques employed and its characteristics, the testing and evaluation methodologies chosen and

some additional features implemented for accomplishing the different tasks.
The third section refers to the experiments and results, which are grouped according to the main goals being pursued. Specific characteristics for every experiment are explained, and their outcome is shown and analyzed. The final section summarizes the main outcome from the experiments. General insights on the project and its methodology are presented. Some future perspectives for this and similar projects are commented.

2 State-of-the-art2.1 Problem Statement
The 20th Century started and ended with two major changes that would radically transform the way music is conceived, created, distributed and consumed in many different levels, affecting at the same time different social, cultural, artistic and scientific fields: firstly, the creation, development and expansion of technologies for sound recording at the dawn of the last century; secondly, the appearance of computers, the subsequent digital revolution and the emergence of information societies at the dusk of the century. Nowadays, access to music somehow is always mediated by technologies. Technology has always played a crucial role in the process of conjugating the dualism of physical energy in the real world with the inner mental representations. A musical reality could be defined as the outcome of a “corporeal immersion in sound energy” (Leman, 2008: 4). But in order to approach the plethora of complex phenomena that emerge from this musical experience, descriptions constitute an immediate means to accomplish a rational understanding of them. Descriptions provide a signification within a specific cultural context, having into account that the experience of music is a subjective one, and that the matters to be described are not always directly observable. The field of musicology has historically addressed this problem of interpreting music through a linguistic-based description, which is a way to encode the musical experience by means of symbolic communication. Leman (2008) refers to this processes as musical signification practices. This practices, employ verbal descriptions as a way to get people in contact with different possible meanings that can be extracted from music. In current musicological trends, it has been proposed to broaden the traditional historical or theoretical approaches to music analysis in order to include cognitive and computational models (Louhivuori, 1997). The development of audio technologies have also provided a new tool for the analysis and comprehension of music. Composer Béla Bartók was for instance one of the first in realizing the potential of recording technologies at the beginning of the 20th century for the analysis and research of popular folkloric music, addressing the objectivity of recorded musical material when describing accurately subtle musical details and features (Bartók, 1979). Current systematic musicology takes advantage of the computational models, computing techniques and databases for the rational study of music from disciplinary perspectives as diverse as psychoacoustics, digital sound processing or ethnomusicology (Leman & Schneider, 1997).
Furthermore, nowadays musical culture is almost completely dependent on technological infrastructures, specially regarding the production, creation and distribution of music. Music is available in unceasingly growing amounts and the expanding world-wide networks provide access to it. This represents a new opportunity not only for employing media technology as a platform to physically access music, but also as a tool for the description (or automatic description) of music. In the last few years, the field of Music Information Retrieval (MIR) has dealt with the issue of categorizing, processing, classifying and labeling music files in large databases, keeping into account the ever-increasing amount of data and the pluralist and multicultural nature of the music material. But these collections represent much more than 'browsable' data: they constitute indeed the “musical 'memory' of the world” (Kranenburg et al, 2010: 18). One way to look at MIR is as one of the main mass technologies who are addressing the problem of the gap between the physical world of sound and the perceptual realm of sense (Polotti and Rocchesso, 2008).

Content-based access to music is then a very active field of research, and in this way, these huge collections of digital music belonging to any historical period or geographic location could be eventually accessible and available to anyone, from musicians, historians, musicologists, scholars, scientists to members of the general public. This implies however the necessity of reconsidering or perhaps creating new models for analyzing and organizing music and developing different techniques to accomplish that goal, sometimes trying approaches other than those implemented by the Western musical tradition. This also could mean a new starting point to accomplish a rational understanding of music (Leman & Schneider, 1997).
2.2 Classification in Music One of the ways of creating and consolidating a body of knowledge in any field starts by means of classification. Classifications in music can be seen as abstractions about the social function of musical aspects for a specific culture in a specific period of time, and thus can only be understood within that specific context. One of the most relevant features in audio content description is precisely classification according to different criteria (Herrera et al, 2002). This classification systems can relate to specific sound and musical features, or to more abstract and culturally subjective semantic descriptions. Dealing with large databases implies then the development of classification systems, that can correspond to traditional and cultural schemes previously implemented, or correspond to new proposals for taxonomies by reviewing the classes and categories in music that have been spread culturally throughout the years by different media. Precisely, the classification of musical instruments has been a constant in the development and consolidation of several musical cultures through history, as shown by the fact that it has been implemented in one of the oldest known classification devices in history, the mandala (Kartomi, 1990). In the current MIR context then, the main goal for this classification task would be to find how specific encodings of physical energy could be related to higher-level descriptions, in this case, musical instruments (Leman, 2008). Although many of these historical models rely on social, cultural or religious foundations, from the perceptual point of view, a musical instrument is intrinsically related to the timbre sensation it produces.
2.3 On timbre The difficulty of defining timbre from a strictly scientific and objective point view has been pointed out several times (e.g. Sethares, 1999, O'Callaghan 2007). Historically, Herman von Helmholtz and Carl Seashore were some of the first of relating perceptual attributes of the sound to specific physical properties at the end of the 19 th century (Ferrer, 2009). Some current standardized definitions have proven to be incomplete, either by trying to define timbre by what it is not, or by oversimplifying the concept until the point of misrepresentation. Example of these are the notion of timbre as the quality that allows to distinguish between two sounds with the same pitch and loudness (as in the American National Standards Institute definition) or simplifications such as timbre being defined exclusively by the spectrum envelope or a set of overtones. Indeed, timbre as an audible difference can be metaphorically exemplified by a visual counterpart as the look of a face (O’Callaghan, 2007), where a certain set of characteristics for audible features are arranged in a specific way that allows them to be identifiable as a unit, that is, the face of a specific sound. These characteristics depend not only on the object itself as an independent source of sound but on the medium where the acoustic event takes place. This combination of source and medium shows the importance of analyzing every

instrument within a specific context.
Describing timbre from a perceptual point of view, usually implies bringing synaesthetic semantic descriptors, i.e. properties and attributes that are often associated with senses other than hearing such as visual features (colourful, colourless) or tactile characteristics (dullness, sharpness) to the way a specific sound is characterized. This way of relating visual sensations and concepts to auditory perception is not exclusive of timbral perception (for instance, in pitch perceptual description visual features such as 'height' or 'chroma' are also employed). However, there is not a single and direct connection or association between physical and acoustic measurable features and specific related timbres, which means that in order to describe timbre accurately, a multiple approach addressing features that go beyond the physical attributes of sound waves must be achieved. Timbre thus cannot be placed into a one-dimensional unit within a single classification method, where all possible timbres could be scaled and ordered. Instead, the most adequate approach to timbre description is multidimensional scaling based on similarity tests, for trying to find computational models that represent the way human perception operates (Sethares, 1999). However, timbre as a perceptual feature is basically a human sensation, thus a machine does not have so far a method to describe it or categorize it the same way humans do. In music, every phenomenon related to timbre is directly linked to the instrument producing the sound: timbre is determined by the physical properties of the instrument as well as the range of possibilities of producing sounds with a musical purpose. The timbre of a specific musical instrument is perceived as remaining constant across any change in frequency or loudness.
Timbre perception is crucial when identifying a source, recognizing an object and naming it. In the MIR context, the human timbral perception can be translated to the recognition of a specific musical instrument when searching and analyzing audio files in large databases. Timbre description and analysis actually depends on perceptual features which could be extracted and computed from audio recordings by means of signal processing, and are not available or explicit in other representation forms, such as the score. In that way, this approach to music information retrieval -based on the sound features of the instrument instead of other melodic, harmonic or rhythmical models- could be used to create automatic classification techniques.
2.4 Automatic instrument classification The automatic description of a piece of music by finding a particular musical instrument or group of instruments, involves analyzing the direct source of the physical sound, and the way it is categorized or grouped linguistically. When creating a computational model for identifying and classifying musical instruments, the equivalent human performance should also be taken into account. Some studies show that even subjects with musical training rarely show a positive recognition greater than 90%, depending in the number of categories used, and in the most difficult cases the value of identification goes down to a 40% (Herrera et al, 2006). For instance, families of instruments are more easily identifiable than singular instruments. It is also common to confuse an instrument with another one having a very similar timbre. Subjects can improve their discrimination performance by listening and training by comparison pairs of instruments, or by listening to instruments within a broader context, instead of isolated or sustained musical notes (Herrera et al, 2006).
There are several general classification schemes that must be taken into account beforehand in order to optimize the automatic classifier. For instance, a very basic distinction that could be relevant for creating a computational model is that of differencing
between pitched (instrument that can play a relatively wide range of frequencies or notes) and non-pitched instruments (basically, what we refer to as percussive instruments). In pitched musical instruments, for example, sometimes the overtones define some timbral sensations and serve as cues for identification. In non-pitched musical instruments -as it is the case of some percussive instruments-, features such as attack and decay time are more relevant to help discriminate and classify the sounds (Fuhrmann, Haro, Herrera, 2009).
The main goal would be then to determine specific musical instrumentation in audio recordings based on facets related to the timbral sensation. It could be of some interest for several fields (musicology, psychoacoustics, commercial applications, etc) to retrieve and automatically classify pieces of music which make use of a certain musical instrument from a large database, regardless of the musical style, genre, time period or geographic location, or without taking into account any additional metadata. Some applications and motivations for using computational models for the automatic labeling and classification of musical instruments are:
• Finding the acoustic features that make the sound of an instrument identifiable or remarkable within a specific musical context. Thus, timbre can be used as an acoustic fingerprint (keeping in mind all possible range of sounds that a singular instrument can accomplish).
• Genre classifier. Culturally, there are instruments associated to a particular musical genre or style. Different research on genre classification usually employ global timbre description as one of the main relevant attributes. However, individual instruments are rarely taken into account in this task. Developing an instrument classifier could substantially improve a genre-classification performance.
• Geographical classifier. There are musical instruments associated to specific regions on the planet, so specific pieces of music are related to their geographic location. Gómez, Haro and Herrera (2009) showed how by including timbre features, performance in classifying geographically pieces of music is increased, helping complement other musical features such as tonal profiles.
• Historical classifier. In a similar way, musical instruments can be associated to specific historical periods. In both academic and popular music, the specific time of invention and development of an instrument determine its use in a well-defined temporal lapse. It could also be important to study the appearance of a specific instrument through time, finding the relative recurrence or historical usage.
• Musical ensembles classifier. Combination of timbres could be addressed through the detection of a closed set of instruments leading to ensemble classification, that could also be helpful in classifying music according to existent defined forms.
• Perceptually, instruments and their timbres are relevant to informativeness in audition. The presence of a single instrument or combination of instruments could define the overall texture or atmosphere in a piece of music. Similarly, the inclusion of an instrument in a specific section of the piece could create a contrast or distinctiveness that could be useful to analyze.
Several of this applications could be combined to achieve different classification systems. E.g. developing a virginals classifier could also help classifying music containing it by genre (classical, renaissance, early baroque), by historical period (16 th _17th century), by geographic area (northern Europe, Italy); or a conga classifier could help classifying music belonging to the latin genre (and subgenres such as salsa, merengue, reggaeton) from specific countries (Cuba, Puerto Rico, Dominican Republic) and so on. All of this requires a musicological/organological approach, getting to know the history, development and

context of the instrument and its more important physical characteristics.
2.5 Descriptors Now we refer to probably one of the most important tools when trying to connect abstract digital information in audio files with well-defined semantic concepts related to human perception. Several temporal and spectral features are decoded by humans from the cochlea to the primary auditory cortex in order to discriminate the sound source, which is subsequently labeled in higher auditory centers (Herrera et al, 2006). By computational means, some of these features -also called descriptors- can be extracted, quantified and coded from raw audio signals. These descriptors can be obtained from the time-domain signal, or from its spectrum in the frequency domain. It is extremely important to know the most relevant acoustic and perceptual features, not only of the musical instrument itself, but of the descriptors associated with a particular sound as well. Ideally, finding the most appropriate descriptors that help associate a different set of sounds coming from the same musical instrument. It could be the case that some descriptors are not relevant to the study and analysis of a specific instrument, and furthermore, its computational results could be misleading for the classification issue. By selecting a small set of pertinent descriptors, redundancy is avoided, computational time is decreased and ideally performance in detection should be more accurate. As it is difficult to know beforehand what are the descriptors that describe more accurately a specific musical instrument, some feature selection techniques must be applied (which will be explained in more detail in the Methodology section). As the amount of descriptors used in several state-of-the-art techniques for audio processing is too vast we present some of these features that could be eventually used as a starting point when describing the timbre of a sound, several more are well documented and standardized -for instance see (Peeters, 2004) for further reference-. The following descriptors are intended to serve as an overview (in section 4 Experiments and results, specific descriptors that prove to be relevant for this project are also commented)
• Energy descriptors. Although not intrinsically related to timbre, the description of power in a signal could be used in combination with other descriptors for specific instrument identification if required. Among these kind of descriptors, calculating the root mean square or RMS (related perceptually to the loudness of the sound) is commonly implemented. It can be calculated as follows (Serrà, 2007):
RMS= f s
n2−n1∑ [ x n]2 (2.1)
Where f s corresponds to the sampling rate, x(n) is the sampled signal and n2−n1 is the window length.
• Time descriptors. Obtained from the time-domain signal. Some of them are:◦ Log-attack time: defined as the logarithmic difference between the stop-attack
time (80%-90% of the maximum RMS value) and the start-attack time (20% of the maximum RMS value). It can be used for discriminating percussiveness in sounds.
◦ Temporal centroid: defined as the time averaged over the energy (RMS) envelop. Related to decay time, i.e. capability of the instrument of playing sustained notes. Useful for distinguishing percussive sounds.
◦ Zero-Crossing Rate: Averaged amount of times the signal crosses the horizontal zero axis. This descriptor is related to noisiness (the higher the value, the noisier the signal is).

• Spectral descriptors. Related to the spectral shape and structure, which are specific values in the frequency-domain. Some of them are:◦ Spectral centroid: Barycenter of the spectrum. It considers the spectrum as a
distribution where the values are the frequencies and the probabilities are the normalized amplitudes. In timbre perception, it can be related to brightness of a sound. It is correlated with the zero-crossing rate temporal descriptor. It is defined by (Peeters, 2003):
=∫ x.p x dx (2.2)Where x is the observed frequency and p(x) is the probability of observing x (normalized amplitudes).
◦ Spectral spread: Variance of the spectrum, i.e. spreadness around its mean value. Defined by (Peeters, 2003):
2=∫ x−2 . p xdx (2.3)Where x is the observed frequency, p(x) the normalized amplitude (probability), and is the spectral centroid.
◦ Spectral flatness: Computed for different frequency bands, it corresponds to the ratio between geometric and arithmetic means. It is related to the noisiness of a sound (high values), as opposed to being tone-like (low values), thus it gives hints in the noisy or tonal nature of a sound.
◦ Spectral irregularity (jaggedness of the spectrum).
• Mel-Frequency Cepstrum Coefficients (MFCC). A standard pre-processing technique in the field of speech, the MFCC represent a short-term power spectrum Mel scale (a non-linear scale of pitch perception). It is usually calculated in the following way (Serrà, 2007): divide the signal into windowed frames and for each one obtain the DFT (Discrete Fourier Transform), obtain the logarithm of the amplitude, map these values (log of the amplitudes) to the Mel scale by means of triangular overlapping and finally take the DCT (Discrete Cosine Transform). Although the MFCCs have proven adequate for timbral description (specifically in genre classification tasks), as they are defined by a mathematical abstraction it is not possible to relate precise MFCC values with specific physical characteristics of the sound. Nonetheless, MFCCs can help in discriminating the way specific polyphonic timbral mixtures sound (Aucouturier et al, 2005).
2.6 Techniques In Music Information Retrieval there has been a large quantity of research on timbre, where it has been employed mainly for genre classification, music similarity or overall global timbre description of a piece of audio. Specific musical instrument detection, retrieval and classification has been regularly researched using monophonic approaches, that is, using recordings of isolated monophonic sounds aiming at instrument recognition (Aucouturier and Pachet, 2002). This technique is accurate but sometimes unrealistic, if the final goal is to develop a system capable of dealing with more complex polyphonic audio with different combinations of instruments over a temporal line. Some research in instrument detection has also been carried by computing semantic tags associated to the appearance of the instrument and created and shared in digital social communities (Turnbull et al, 2008; Hoffmann et al, 2009; Eck et al, 2007). This technique however depends on the actual contribution by the communities, i.e. if a piece has not been tagged therefore cannot be classified. Polyphonic audio presents a basic complexity when comparing it to monophonic audio, which is the combination and mixture of several

frequency components in the spectrum coming from as many different sources are present in the recording (Fuhrmann et al, 2009). This overlapping of different sounds in polyphonic recordings makes the positive identification of individual pitches and onsets for every source a very difficult task.
Nonetheless, several approaches that actually employ the raw audio data for instrument detection in polyphonic signals can be mentioned, all of them using different techniques:
• f0 estimation and restriction, with a Gaussian classifier for identifying the solo instrument in Western classical music sonatas and concertos (Egglink and Brown, 2004).
• Learning techniques by training from weakly labeled mixtures of instruments (Little and Pardo, 2008).
• Linear Discriminative Analysis for feature weighting, in order to minimize the overlapping of sounds (Kitahara et al, 2007).
• Pre-processing to achieve source separation in the identification of percussive instruments (Gillet and Richard, 2008).
• Hidden Markov Models with inclusion of temporal information for automatic transcription of drums (Paulus and Klapuri, 2007).
• Training fixed combination of instruments -instead of solo instruments-, clustering them firstly and labeling them secondly (Essid et al, 2006).
• Extraction of pitched information from different sources for subsequent feature computation and clustering (Every, 2008).
• f0-estimation for source separation by Non-negative Matrix Factorization techniques (Heittola et al, 2009).
• Beat tracking, feature integration and fuzzy clustering (Pei and Hsu, 2009).
As it is shown, several procedures with different degrees of complexity have been implemented, but there is not an single, unified framework for dealing with the problem. There could be, however, simpler techniques for accomplishing the instrument detection task obtaining rather adequate performances. In the next section, one of such approaches is described.
2.7 Proposed approach for detecting musical instruments in polyphonic audio
It is possible to train classifiers with audio descriptors (temporally integrated from the raw feature values extracted from polyphonic audio data) using extensive datasets (Fuhrmann y Herrera, 2010; Fuhrmann, Haro y Herrera, 2009). The following is a general description of this approach (flow diagram can be seen in Fig. 1), in section 3 specific implementation of this approach for this project is explained in detail.

Fig. 1 Automatic instrument detection and classification flow diagram for polyphonic audio (taken from Furhmann, Haro and Herrera, 2009)
The procedure for computationally classifying sounds according to some audio features in a supervised manner (in opposition to the clustering technique of unsupervised learning), proceeds roughly in the following way:
1. Building a well-suited database for the instrument with an adequate annotation, as well a database for the counterpart, i.e. a collection including samples not containing the instrument.
2. Extracting audio features (descriptors), frame-based, computed over time (by means of statistical analysis) from the datasets. It is important to remark that no pre-processing is required in this process, the feature extraction is done directly in all pieces belonging to a particular collection.
3. Selecting the most relevant attributes by using specific feature selection techniques, that could be more accurate for describing timbrally the instrument, helping improve the performance and finding a model for the instrument sound.
4. Training, testing and classifying the data according to the selected descriptor sets model, using several machine learning techniques. Here, supervised learning techniques will be used, that is, training annotated data is used to produced an inferred function.
5. Comparing, analyzing and evaluating descriptors, models, techniques and classification results, according to this representation of the presence of an instrument in a piece of audio.
This general approach can be applied to basically any instrument. However, for the purpose of this project, this general task had to be limited. In the next section the selected instrument is presented, along with some of its most relevant technical and sound features.
2.8 The mellotronThe mellotron is a peculiar instrument in the history of 20th Century popular music. Modeled after the chamberlin, it is recognized as one of the first playback sample instruments in history. Originally, the idea behind the mellotron was to emulate the sound of a full-orchestra by means of recording individual instrument notes in tape strips, which are activated through playback. For instance, instead of recording a whole string section for accompaniment in a song, the mellotron could 'sample' individual notes of this string section, which then can be played by the performer in any necessary musical arrangement. The instrument can also be used in live settings, which makes it a very

adequate option whenever it is difficult to get the original instrument or instruments for the performance. However, the mellotron is not as commonly used as other keyboard controlled instruments, and this uniqueness makes it ideal for performing some specific classification tasks. For instance, developing a mellotron classifier could help also classify music by genre or more specifically by sub-genre (e.g. progressive rock, art rock) or time period (from the sixties onwards).
Fig. 2 M400 mellotron, with 35 keys, 35 magnetic tape strips and inner motor mechanism.
During the second half of the sixties decade, several groups of psychedelic and progressive rock started using the mellotron, prompted amongst others by the seminal piece Strawberry Fields Forever by The Beatles, which employed a flute mellotron throughout the song. Some bands such as King Crimson, Genesis or The Moody Blues made the mellotron a regular instrument in their compositions and then it became a trademark sound of a big portion of the progressive rock during the seventies. The mellotron usage decayed during the eighties decade, due probably to the huge diffusion and success of cheaper digital synthesizers which emulated the sound of traditional Western instruments by means of several synthesis techniques. However, the last decade saw a revival of the mellotron, several recordings in different genres that are using it can be found, not only as a vintage or 'retro' artifact, but as a main instrument and compositional tool (bands such as Oasis and Air, or artists such as Aimee Mann have included prominently the mellotron in their music). Its electro-mechanical nature (i.e. having characteristics both from electrically-enhanced and mechanic-powered musical instruments) makes it difficult to classify within a well-defined taxonomy. According to the Hornbostel-Sachs instrument classification system for instance, the mellotron would belong to its fifth category, electrophones, but when trying to classify it within any of the subcategories of this system, there is the problem of considering the multi-timbral nature of the recorded sounds from real instruments, or the fact that it presents electric action and electrical amplification.
Now we refer to some technical features of the mellotron which make it unique in the way its sound is constructed and its timbre is created, thus making it of special interest for the purpose of this research. The mellotron main mechanism lies in a bank of linear magnetic tape strips, in which sounds of different acoustic instruments are recorded. It uses a

regular Western keyboard as a way to control the pitch of the samples. Each key triggers a different tape strip, where individual notes belonging to a specific instrument have been recorded. Below every key, there is a tape and a magnetic head (the M400 model has 35 keys, with 35 magnetic heads and 35 tapes, while the Mark II model has the double amount, for instance). Monophonic sounds belonging to a single pitch or sequences of pitches can be played for a single instrument, but due to the fact that the mellotron is controlled by a keyboard, it is more usual to find recordings that use polyphonic sounds, that is, the performer pressing two or more keys at the same time playing different melodic lines. Furthermore, some mellotron models had up to three tracks in every tape, meaning that 3 different instruments or sounds could be recorded, and with a selector function a combination of two of them could be played simultaneously. When the instrument is switched on, a capstan (a metallic rotating spindle) is activated and remains turning constantly. Whenever a key is pressed, the strip makes contact with the magnetic head (the reader) and the tape is played. There is an eight-second limit for playing a steady note in the instrument, due to the physical limitations (length) of the tape strips (Vail, 2000). One of the main innovations in the mellotron is its working tape mechanism: instead of having two reels and playing a sound until the tape length is over (as in a regular tape player system), the tapes are looped and attached to springs that allow the strips to go back to the starting position, once a pressed key is released, or after the eight-second limit.
The mellotron was commonly used to replace the original acoustic instrument it represents, but in the process it adds a distinctive timbral feature that changes the perception of the piece as a whole. By using tapes, the mellotron can reproduce the attack of the instrument, fact that could be used as a temporal cue when obtaining the values of the descriptors. However, its timbre is perceived as having an additional sound to that of its acoustic counterpart, i.e. sounds from mellotron strings and a real string orchestra are perceived differently. It is important to address these specific features, because they could be of high relevance for trying to match specific descriptors with correlated physical characteristics. One of the most frequent sound deviations that can be found in tape mechanisms is the so-called wow and flutter effect, which corresponds to rapid variations in frequency due to irregular tape motion. In analog magnetic tapes it is also frequent to have tape hiss, which a high-frequency noise produced by the physical properties of the magnetic material. In some recordings, the characteristic sound of the spring coming back to the default position can be heard as well. Although different models of the mellotron (such as the M300, the MKII, the M400, etc) produce different sounds due to using different set of samples, or having slight variations in the working mechanism, these distinctions were not addressed for this project, instead trying to find an overall timbral description for the generic sound of the mellotron. For the purpose of this research we are focusing in some of the most frequent instrument samples used in the mellotron (though other samples were used as well for specific experiments):
• Strings section (covering samples featuring violins section and full string orchestra)• Flute. • Choir (including samples featuring male, female and mixed choir).
In section 3.1 there is a more detailed explanation of the different sound samples selected and the criteria for choosing them.
Now we refer to some possible research questions that can be asked and could constitute a guideline for the project:
• What are the physical properties that make the mellotron sounds to be perceived

differently to the equivalent acoustic instruments? • Can a machine be taught to detect the sound of this instrument?• Is there a feature in the timbre that allows us to group all sounds coming from the
mellotron, disregarding the kind of instrument being sampled?• In general terms, do these kind of 'rare' or specialized musical instruments have
distinctive sound features that can be recognized, described and characterized using low-level attributes?
There are also some additional challenges derived from the specific characteristics of the instrument itself, which make it pertinent for the purpose of this thesis:
• The mellotron constitutes one instrument with several timbres. The possibility of playing any instrument that has been previously recorded in a magnetic strip, makes the mellotron unique in its timbral diversity. However, all this different instruments are being mediated by the same physical mechanism, which could lead to an unified timbral feature.
• The mellotron sound is not very prominent in most of the recordings. It was commonly used as a background musical accompaniment, which means that sometimes several other instruments appear in the recordings with equal or more relative loudness than the mellotron. Also, in most of the recordings the mellotron does not play long continuous musical phrases, appearing only for a short period of time. Solo sections are hard to find as well.
• Recognition of this instrument proves to be difficult, even for human listeners . Although there have not been scientific studies on this specific task, there is a lot of information on the world wide web on this matter. For instance, the Planet Mellotron website1 lists at least 100 albums containing allegedly mellotron, some of them wrongly classified or very difficult to verify due to:◦ Not enough sonorous evidence. Sometimes, the alleged sound of the mellotron
is deeply buried in the mix, so it is difficult to be perceptually discriminated. As the mellotron samples the sound of other instruments, actual strings sections could for instance be mistaken for being a mellotron.
◦ Lack of meta-information. For instance, confirmation by musicians or producers of the usage of the instrument in a specific piece of music.
◦ Mistaken samples. It is common finding wrong information on a certain piece of music employing the mellotron. For instance, Led Zeppelin's original recording of Stairway to Heaven has been referred to as employing a mellotron flute in its beginning, when the sound comes actually from dubbed recorders. However, in their live shows they used in fact a mellotron for playing this section, which helped to create this confusion2.
1 http://www.planetmellotron.com/index.htm Planet Mellotron is a website where a comprehensive and extensive database of music recordings that include the mellotron is annotated and updated regularly. (last visited in July 2011)
2 Refer to http://www.planetmellotron.com/revledzep.htm for more information on this matter. (last visited in July 2011)

3 Methodology3.1 Collections
Two main tasks were defined for building the groundtruth: first, making a representative collection of recordings that employ the mellotron; second, building collections that include the 'real' acoustic instruments that are being sampled by the mellotron. The purpose here is to discriminate the mellotron from what is not, e.g. learning to differentiate between a mellotron choir sound from a real choir. In that way, it is possible to find the features that make the mellotron sound to be physically and perceptually distinctive. Ideally, the selected excerpts featuring the instrument must correspond to recordings from different songs, albums, artists, periods and musical genres, in order to cover a wide range of sonic possibilities. Also, in addition to fragments featuring the solo instrument, there must be a wide diversity of instrument combinations, taking into account the predominance level of the mellotron. Selection of excerpts belonging to the same song was discouraged, as well as excerpts belonging to the same album (trying to avoid the so-called album effect, where due to a unity of production techniques the sound similarity increases). Samples where the mellotron was deeply buried in the mix were not selected, because probably they would have confused the classifiers, adding difficulty to the task. These databases were reviewed by an expert. A total of 973 files were collected, segmented, annotated, classified and processed for different experiments (see table 1), with the following characteristics:
• Fragments of 30 seconds where the mellotron is constantly playing, that is, it features in every moment of the excerpt.
• WAV format was used, transferred from 192 Kbps (or more) MP3 or straight from audio compact discs.
• The samples were fragmented and converted from stereo to mono, using Audacity3.
Annotation was done according to the following categories: • If the excerpt features the mellotron:
◦ Solo (just mellotron) or polyphonic (in combination with other instruments)◦ Strings, Flute or Choir◦ Specific classical music pieces
• If the excerpt does not feature the mellotron:◦ Strings, Flute, or Choir ◦ Specific classical music pieces◦ Generic rock/pop and electronic music
Different styles of popular music were represented in the mellotron collection, amongst others (as categorized by Allmusic4): Prog-Rock, Psychedelic, Art Rock, Alternative/Indie Rock, Electronica, Ambient, Britpop, Blues-Rock. However, all the samples that constitute the mellotron groundtruth belong either to the Pop/Rock or the Electronic western music mega-genres (also as defined by Allmusic), with the exception of a small collection belonging to Classical.
3 http://audacity.sourceforge.net/ Audacity is a open-source freeware for editing sound. (Last visited on July 2011)4 http://www.allmusic.com/ Allmusic is a music guide website, providing basic data plus descriptive and relational
content for music, covering a wide range of genres and periods. (Last visited on July 2011)

Ground
truth
Mellotron Non-Mellotron
Strings Choir Flute Classical Music
Versions
Strings Choir Flute Classical Music
Originals
Rock/Pop &
Electronic General
CollectionSolo Poly Solo Poly Solo Poly
Amount
23 139 16 67 22 74 15 50 90 162 15 300
Total 356 617Table 1. Groundtruth details, total amount and classification for the different collections, for the classes
'Mellotron' and 'Non-mellotron'.
The collections for strings and flute in polyphonic audio were provided by Ferdinand Fuhrmann, taken from his own database employed in his research on the same topic. The collection for 'real' choir was built by selecting a representative amount of music from several genres (not only classical music) in order to avoid some possible 'genre' discrimination instead of 'instrument' distinction. A general collection of Pop/Rock was also built, intended for testing this last aspect, that is, the possibility of the classifier finding descriptors that classify genre instead of the specific presence of the mellotron; and for testing some of the models found against a non-used previously database.
3.2 Feature extraction Once the groundtruth collections were reviewed, the feature extraction was implemented in Essentia, which is a C++/python-based library for audio analysis (collection of algorithms) that includes standard signal processing and temporal, spectral and statistical descriptors. Here, the signal is cut into 2048 points frames (50ms), hop size of 1024, and for each frame short-time spectrum is computed and several temporal and spectral descriptors are obtained and aggregated to a pool. The default Essentia Extractor was used, which extracts pretty much all features useful for audio similarity. Every descriptor has the following statistical values, computed for all frames within a sample: mean, variance, first and second derivative mean and variance, minimum and maximum values. Some descriptors have only a single mean value, such is the case of the MFCCs, where the output consists of mean values for 13 different mel-Frequency coefficients. Descriptors containing metadata were not used. For all the experiments there will be 2 main classes, mellotron or non-mellotron, thus the models are dealing with a binary decision. However, every experiment would use different datasets, according to specific tasks that are explained in section 4. In this way, we make sure that a specific model works for several setups, timbral combinations or instruments sampled by the mellotron. A python script was used for changing the information containing all the extracted descriptors from the Essentia format (YAML files) into one of the Weka compatible formats (ARFF files). According to the intended experiment, a single file containing the database needed was created for both classes. In this ARFF file, information for all the excerpts and all features is included.
3.3 Machine Learning Machine learning evolved as a branch of the artificial intelligence field, developing algorithms that find behaviors and complex patterns from real world data. Machine

learning main purpose is to find useful approximations for modeling and predicting processes that follow some hidden regularities, but that are hard to detect manually due to the huge amount of information describing them (Alpaydin, 2004). It is crucial that these automatic systems are capable of learning and adapting, in order to have high predictive accuracy . They are also intended to provide training by means of efficient algorithms that are capable of processing massive amounts of data and find optimal solutions to specific problems. In this particular case, it is our intention to build descriptive models gaining knowledge from data, that lead eventually to predictive systems that anticipate to events in the future. Thus, supervised classification will be used, where the learning algorithm maps features to classes predefined by taxonomies. For the purpose of this project, open-source free software Weka5 from the University of Waikato was employed. Weka allows to preprocess, select features, classify or cluster data, creating predictive models by means of different machine learning techniques. The idea was to compare different of these techniques, in order to find the most appropriate for a specific task, or even finding patterns of performance throughout the experiments.
Two different feature evaluators were used, giving a number between 0 and 1, with 1 being the highest ranking possible and 0 the lowest (both use the Ranker search method, which ranks attributes by their individual evaluations):
• InfoGain, which evaluates the worth of an attribute by measuring the information gain with respect to the class.
• GainRatio, which evaluates the worth of an attribute by measuring the gain ratio with respect to the class.
Three different machine learning methods were selected for the experiments:
• Decision trees: According to the attributes values for the dataset, this classifier develops a decision tree, where the nodes denote the different attributes, the branches between nodes represent the values that the attributes have, and the terminal node (or leaf) gives a final classification decision value (see Fig. 3).
Fig. 3 Example of a decision tree, showing nodes (attributes), branches (values) and leaves (decision)6
For the experiments, the J48 decision tree was chosen (confidence factor 0.25 and 2 minimum instances per leaf).
5 Software and documentation are available for downloading in http://www.cs.waikato.ac.nz/ml/weka/ 6 Taken from http://www.doc.ic.ac.uk/~sgc/teaching/v231/lecture11.html (last visited August 2011)

• K-Nearest Neighbor: It is a lazy learning method (i.e. generalization beyond the training data is delayed until a query is received), it consists of classifying objects according to proximity in a feature space. Thus, an instance is classified by a majority vote of its neighbors.
Fig. 4 Example of a 3-NN classifier, where a decision is taken based on the three nearest neighbors7.
For this project, 1-NN was implemented, (IB1 in Weka), where an instance is assigned the class of its nearest neighbor in the feature space. It employs a simple distance measure to find the training instance closest to a given test instance, predicting the same class as this training instance.
• Support Vector Machines: A linear binary classifier, it builds a model based on training examples by assigning points into a high-dimensional space, assigning new examples into one category or another. Each category is mapped in a way that is as separate as possible from the other one.
Fig. 5 Example of a support vector machine classifier, showing the mapped categories, the margin between them and possible misclassified instances8.
In Weka, the SMO (Sequential Minimal Optimization) algorithm was used, this implementation normalizes all attributes by default, replacing missing values and transforming nominal attributes into binary ones.
7 Taken from http://cgm.cs.mcgill.ca/~soss/cs644/projects/perrier/ (last visited August 2011)8 Taken from http://www.gunnet.org/svm/ (last visited August 2011)

3.4 Additional implementations
In some experiments, additional features were implemented, such as:
• Employing different random seeds in the classifier evaluation options. The seed is the number used to initialize the random number generator. By using several random seeds and averaging the results obtained for a specific classifier, several data partitions are done for one specific evaluator and we get a more accurate idea of the performance of the model.
• Applying paired two-sample t-test to verify the statistical significance of the descriptors selected in one of the experiments. The t-test is an important statistical tool that applies to two sets of samples subjected to comparison with matched pairs of attributes. Usually, a null hypothesis is stated in which the means of both groups are equal. For testing it, a p-value is employed, which is the probability of having a test statistic as extreme as the one obtained, if the null hypothesis is true. A low p-value for the statistical test helps to reject the null hypothesis. Apart from the feature selection that Weka is performing, this additional test was implemented by transforming the ARFF file into the CSV format. Then, using Systat9 statistical analysis software, the t-test was performed and a reduced group of descriptors according to the p-value threshold was selected.
• Obtaining box plots for some relevant descriptors. This is a graph commonly used for showing a set of relevant statistical information: smallest and greatest values, lower and upper quartiles, and median. It also provides an easy visual evaluation for the detection of outliers. In that way, we can easily spot the main differences between datasets for specific features. This task was implemented in Systat as well.
3.5 Test and Evaluation
Mainly, two different classifier test options were used:• Cross-Validation: The classifier performs k-fold cross-validation, (k being the
number of subsamples) where through a subsequent series of partitions of the datasets, several training/testing operations are performed and their outcomes quantified. For instance, in a 10-fold cross-validation the original sample is partitioned into 10 sub-samples and one of them is used for testing, while the remaining 9 are used for training. This procedure is repeated 10 times and the outcomes averaged, assuring that every sub-sample is used once for testing and 9 times for training.
• Percentage split: The classifier is evaluated according to performance in a percentage of the data which is held out for testing. For instance, a percentage split of 66% means that 2/3 of the instances would be used for building the model, while the remaining 1/3 of the instances would be used for testing.
For the evaluation, we will focus on the effectiveness of the system (Serrà, 2007), that is, performance based on the accomplishment of the objectives. This will be specifically done by measuring the following Weka outputs:
• Percentage of correctly classified instances.
9 http://www.systat.com/ Software and documentation (last visited in July 2011)

• The recall of the system, that is, the proportion of relevant material actually retrieved in answer to a search request. In this binary task, it corresponds as well to the positive predictive value. It can be weighted for all classes or calculated individually for each class. It can be defined as:
recall= relevant instances ∩ retrieved instances relevant instances (3.1)
Or in other terms:
recall= true positivestrue positives false negatives (3.2)
• The precision of the model, that is, the proportion of retrieved material that is actually relevant. In this binary task, it corresponds as well to the sensitivity of the system. It can be weighted for all classes or calculated individually for each class. It can be defined as:
precision=relevant instances ∩retrieved instances retrieved instances (3.3)
Or in other terms:
precision= true positivestrue positives false positives (3.4)
• Precision and recall can also be condensed in the f-measure, which is the evenly weighted harmonic mean of precision and recall. It can be calculated as:
f measure= 2× recall × precision recall precision (3.5)

4 Experiments and results A series of experiments were sequentially designed in order to gather information about the specific descriptors that could help accomplish the tasks proposed (each experiment is named after one representative music piece from the collections used), by employing custom-built datasets classified according to instrumentation features. Two classes will be created then for each experiment, one for samples featuring the mellotron and one for samples not featuring the mellotron. The number of instances for each class will be the same in every experiment. First, an initial experiment about comparing specific pieces of music is presented, which is intended to be a guideline for the following experiments by making a direct timbral comparison between the mellotron and several instrument combination for equivalent musical phrases. Then, a series of experiments comparing three specific instruments settings (strings, flute, choir) is conducted, all of them for polyphonic music pieces. The final experiments, dealing with the totality of the collections and a larger number of instances, are intended to evaluate the findings from the previous experiments.
4.1 Initial experiment. Nimrod10: Comparing classical music pieces with their versions for mellotron
4.1.1 DescriptionFor this experiment, a special collection was built employing specific music for mellotron arranged by Mike Dickson from his album mellotronworks11. In these recordings, some classical music pieces are performed exclusively employing mellotron sounds, by recording individual instrument scores on it and mixing them afterwards. The purpose of this initial experiment was to compare directly classical music pieces with versions for mellotron. In this way, we are assuring that harmonic or melodic content are the same, so we can focus directly on the timbral differences. This pieces present several timbral combinations, belonging to different musical instruments from a typical Western orchestra. Furthermore, most of the mellotron versions employ the same original instrumentation of the orchestral pieces, so it is a direct comparison between the recording of the instrument and the main features the mellotron adds to the timbre when sampling those instruments. It is important to note that the mellotron collection, while having polyphonic sounds, all of them come from the mellotron, that is, there are no more non-mellotron instruments playing. Thus with this experiment we are referring to the following questions:
• Is it possible to differentiate the classical music pieces from their versions for mellotron by means of low-level descriptors?
• What are the most important descriptors that help discriminating instrument sounds and mellotron sounds in this collection?
4.1.2 ProcedureSome specificities in the procedure for this experiment:
10 One of the pieces in this collection is Nimrod, the variation IX (Adagio) of Edward Elgar's Enigma Variations. Elgar's musical enigma can be reminiscent of the mellotron timbral 'enigma' we are pursuing in this experiment.
11 http://www.mikedickson.org.uk/mellotronworks/index.html Several other recordings featuring the mellotron are available for free-downloading in the website (last visited in july 2011).
• Selecting and segmenting musical phrases (at least 30 seconds long) in each orchestral version.
• Selecting and segmenting the same musical phrases for the mellotron version, even if the length in seconds was different (i.e., disregarding tempo variations).
• Assuring similar melodic and harmonic content. This additional test was done by extracting the THPCP (Transposed Harmonic Pitch Class Profile), which is a tonal profile invariant to transposition (Gómez and Herrera, 2006) and then finding correlation values between the orchestral and mellotron sets.
• Finding the most relevant set of descriptors according to the Weka attribute evaluators.
• Applying a t-test to that set of descriptors for finding its statistical relevance.
• Testing the three different classifiers with a percentage split of 66%.
• Due to the size of the collection, the evaluation will focus mainly on the percentage of correctly classified instances, for the different set of descriptors and different machine learning techniques selected.
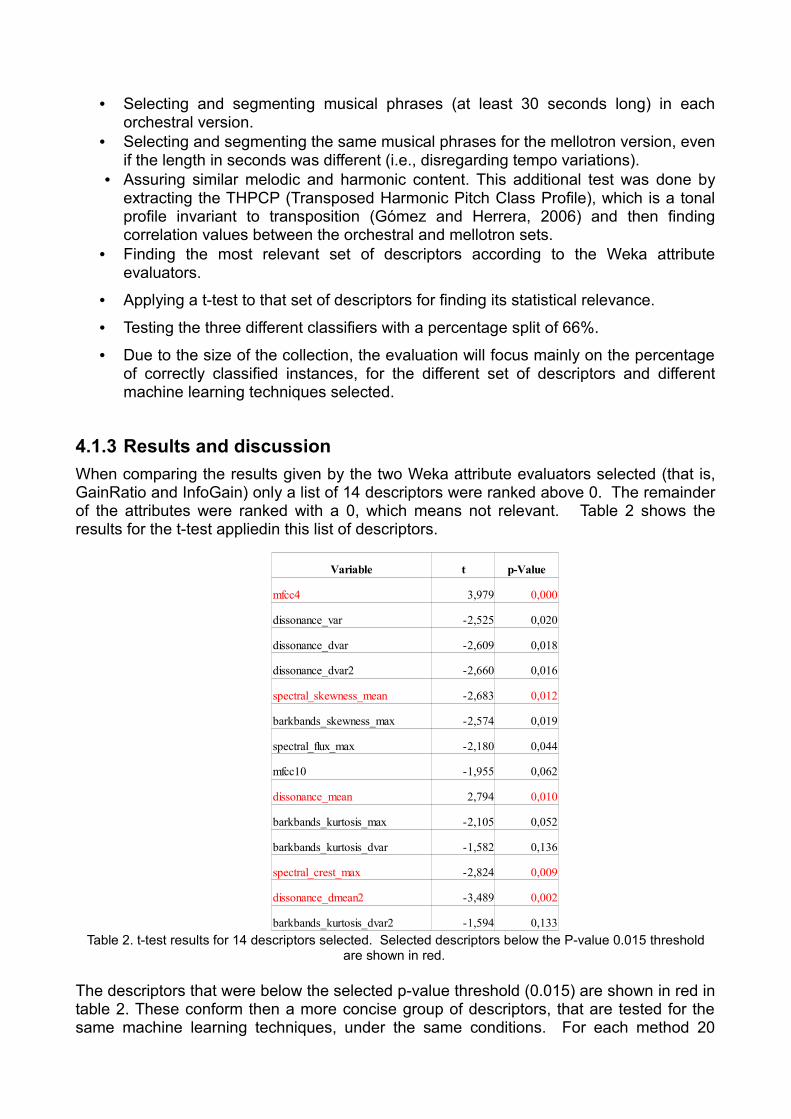
4.1.3 Results and discussionWhen comparing the results given by the two Weka attribute evaluators selected (that is, GainRatio and InfoGain) only a list of 14 descriptors were ranked above 0. The remainder of the attributes were ranked with a 0, which means not relevant. Table 2 shows the results for the t-test appliedin this list of descriptors.
Table 2. t-test results for 14 descriptors selected. Selected descriptors below the P-value 0.015 threshold are shown in red.
The descriptors that were below the selected p-value threshold (0.015) are shown in red in table 2. These conform then a more concise group of descriptors, that are tested for the same machine learning techniques, under the same conditions. For each method 20
Variable t p-Value
mfcc4 3,979 0,000
dissonance_var -2,525 0,020
dissonance_dvar -2,609 0,018
dissonance_dvar2 -2,660 0,016
spectral_skewness_mean -2,683 0,012
barkbands_skewness_max -2,574 0,019
spectral_flux_max -2,180 0,044
mfcc10 -1,955 0,062
dissonance_mean 2,794 0,010
barkbands_kurtosis_max -2,105 0,052
barkbands_kurtosis_dvar -1,582 0,136
spectral_crest_max -2,824 0,009
dissonance_dmean2 -3,489 0,002
barkbands_kurtosis_dvar2 -1,594 0,133
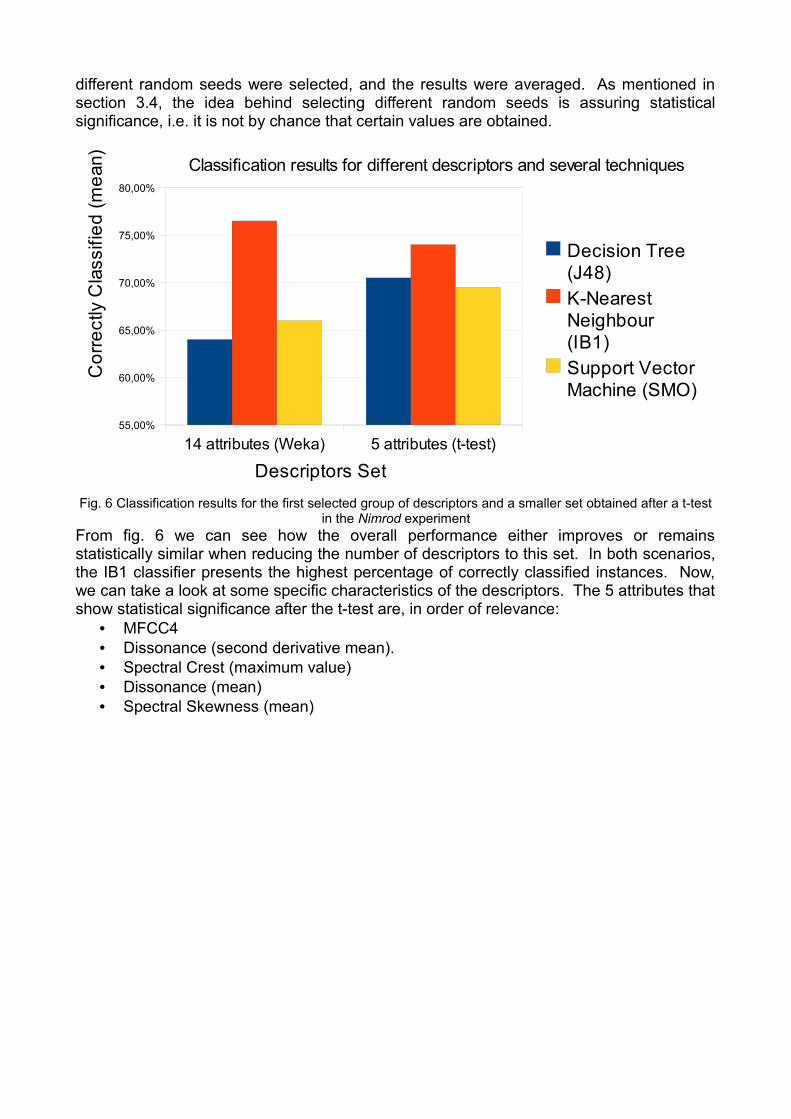
different random seeds were selected, and the results were averaged. As mentioned in section 3.4, the idea behind selecting different random seeds is assuring statistical significance, i.e. it is not by chance that certain values are obtained.
Fig. 6 Classification results for the first selected group of descriptors and a smaller set obtained after a t-test in the Nimrod experiment
From fig. 6 we can see how the overall performance either improves or remains statistically similar when reducing the number of descriptors to this set. In both scenarios, the IB1 classifier presents the highest percentage of correctly classified instances. Now, we can take a look at some specific characteristics of the descriptors. The 5 attributes that show statistical significance after the t-test are, in order of relevance:
• MFCC4• Dissonance (second derivative mean). • Spectral Crest (maximum value)• Dissonance (mean)• Spectral Skewness (mean)
14 attributes (Weka) 5 attributes (t-test)55,00%
60,00%
65,00%
70,00%
75,00%
80,00%
Classification results for different descriptors and several techniques
Decision Tree (J48)K-Nearest Neighbour (IB1)Support Vector Machine (SMO)
Descriptors Set
Cor
rect
ly C
lass
ified
(mea
n)

Fig. 7 Example of box plots for the MFCC4 in the two-sample t-test performed for the mellotron/orchestral classes in the Nimrod experiment
The MFFC4 corresponds to the fourth band of the mel-cepstrum coefficients. In fig. 7 we can see how the mellotron sounds have a larger mean value for the MFCC4 with a wider distribution, while orchestral sounds are lower and more equally distributed. From the box plot in fig. 7, we see how the MFCC4 constitutes one of the most relevant descriptors for differentiate the mellotron versions from the original versions. This indicates that there is indeed a feature in the polyphonic mixture of the mellotron sounds that allows us to group them according to the way they sound. The dissonance descriptors describe sensory dissonance (not musical theoretical dissonance), based on the roughness of the spectral peaks. According to the results, mellotron sounds are more dissonant. Spectral crest and spectral skewness refer to the flatness and the asymmetry around the mean value of the spectrum, respectively. Both are apparently relevant in this experiment.
Despite being a rather difficult task (comparing a lot of timbral possibilities in orchestral music with the inner sound qualities that the mellotron provides) in a small dataset, we have found evidence for defining a set of descriptors relevant for discriminating sounds from acoustic instruments and sounds coming from the mellotron. In general, these attributes correspond to specific spectral features that give us a model for discriminating the mellotron sound from a complex combination of instruments. This set of 5 descriptors selected will be used again for testing in the following experiments in order to prove the actual effectiveness in defining the mellotron timbre.
4.2 Specific instrument experiments: flutes, strings, choir
4.2.1 Description The mellotron, as mentioned earlier in this document, usually samples well-known Western instruments or ensembles. It is the intention of the next three experiments to compare and discriminate between sound from real instruments and sounds coming from the same instruments in their mellotron version. Collections belonging to three specific settings are used, involving the specific timbral characteristics of three musical instruments (or set of instruments): flute, strings and choir. Now, we intend to evaluate the overall

performance of the classifiers when dealing when different amount of relevant attributes, i.e. checking whether it is better in some specific cases to have more descriptors, or on the contrary if reducing the amount of descriptors will not affect significantly the performance and will lead to a more detailed and accurate characterization of the mellotron. Also, the 5 descriptors selected from the initial experiment will be tested, by adding them to the 5 highest ranked descriptor according to Weka, for every experiment. In that way, we can check if indeed the addition of this descriptors improves the performance of the classifiers, or if on the contrary they are not relevant for this classification task. Also, it is intended trying to avoid having too many descriptors, because that would reduce the specific description of the uniqueness of the mellotron timbre. Having too many parameters also increases the possibility of classifying according to random features, event which is commonly known as overfitting.
4.2.2 Procedure1. Comparing different set of descriptors according to the Weka attribute evaluators.
Weka has an Attribute Selected Classifier, which is an arbitrary classifier on data that has been reduced through attribute selection. With the Ranker Search method, it is possible to select a specific number of descriptors that correspond to the highest ranked by the feature evaluators. The amounts chosen for every set will be as follows: 50, 40, 30, 20, 10, 5 and finally those same 5 highest-ranked descriptors plus the 5 descriptors chosen from the first experiment.
2. Testing the classifiers (J48, IB1, SMO) employing 10-Fold Cross-Validation.3. Utilizing different random seeds for creating several data partitions and averaging
the evaluation results. 4. The evaluation will include this time -besides the percentage of correctly classified
instances the class f-measures for the different set of descriptors and different machine learning techniques selected. As the classifiers deal with a binary decision, the f-measure would be sufficient for comprising both precision and recall measures for each class.
5. Selecting a group of relevant descriptors according to the following criteria:1. Highest-ranked descriptors according those selected by the attribute evaluators.2. Highest averaged performance for the three machine learning methods.
In regard to the following three experiments, some general questions can be asked, that will define the goals for each individual experiment:
• Is it possible to differentiate the original instruments from the mellotron-sampled ones in a polyphonic context by means of low-level descriptors?
• Furthermore, do the mellotron sounds have some specific features that allow it to be detected, disregarding the amount and variety of other acoustic, electro-mechanic or electronic instruments that are mixed in the recordings?
• What are the most relevant set of descriptors for each task?• Does the set of descriptors obtained in the initial experiment improve the
classification performance of the models for this collections?

4.2.3 Julia Dream12: Comparing flute and mellotron flute samples in polyphonic music
Experiment detailsNumber of instances: 140Total number of attributes: 838
Fig. 8 Percentage of correctly classified instances for different sets of descriptors and three machine learning techniques in the Julia Dream experiment (flutes).
From fig. 8 it can be observed how the SMO classifier presents the highest classification values, above the other two methods, and how its performance increases when employing less attributes. It can be stated that the individual performance of the classifiers when selecting between 50 and 30 attributes does not present considerable changes. The less attributes used, the better performance J48 and SMO show, while for IB1 is the opposite: less attributes means less percentage of correctly classified instances. For IB1 and SMO the addition of the 5 general descriptors proves to be useful, helping improve the classification performance, especially in the IB1 case, where it improves around 5%. For the decision tree, adding these 5 descriptors actually decreases its performance, but only around 2%. However, this results belong to the overall weighted performance. It is also of interest to see individual performances for each class, that is, mellotron and non-mellotron.
12 Julia Dream (1968) by Pink Floyd -along with Strawberry Fields Forever by The Beatles- is perhaps one of the earliest examples of prominent use of the mellotron flute in a recording, adding an eerie pastoral effect to the song.
50 attributes40 attributes
30 attributes20 attributes
10 attributes5 attributes
5 attributes + 5 general
62,00%
64,00%
66,00%
68,00%
70,00%
72,00%
74,00%
76,00%
78,00%
80,00%
Decision Tree (J48)K-Nearest Neighbour (IB1)Support Vector Machine (SMO)

Fig. 9 F-measure values for the Mellotron and Non-mellotron classes, with different sets of descriptors and machine learning techniques in the Julia Dream experiment (flutes).
In general terms, fig. 9 shows how the f-measure for the Mellotron class has higher values than the Non-mellotron class, disregarding the method or set of descriptors used. This means that non-mellotron samples are are more likely to be classified as mellotron (false-positives) than the opposite, mellotron samples classified as non-mellotron (false-negatives). The highest overall class performance was for the mellotron with the support vector machine SMO. Indeed, the additional 5 descriptors from the Nimrod experiment in section 4.1 are helping to improve the f-measure in IB1 for the non-mellotron class, that is, the amount of false-positives (real strings) that are being classified as featuring the mellotron.
We have gathered evidence for saying that when using the 5 highest-ranked descriptors a rather good performance is obtained. These descriptors are:
• Spectral Crest (derivative variance)• Dissonance (derivative variance)• Spectral Crest (second derivative variance)• Spectral Energy Band Middle-High (maximum value)• Dissonance (second derivative variance)
These findings are interesting in the way that most of the descriptors are related to the set found in the initial experiment. Dissonance, again, seems to be very important for discriminating the sound of the mellotron, as well as Spectral Crest, for different statistical measures. This means that both the roughness of the spectral peaks and the spectrum flatness are relevant features in these datasets. The Spectral Energy Band Middle-High refers to specific differences in the energy of the spectrum calculated for the Middle-High band between the two classes.
50 attributes40 attributes
30 attributes20 attributes
10 attributes5 attributes
5 attributes + 5 general
0,550
0,600
0,650
0,700
0,750
0,800
0,850
J48 MellotronJ48 Non-mellotronIB1 MellotronIB1 Non-mellotronSMO MellotronSMO Non-mellotron
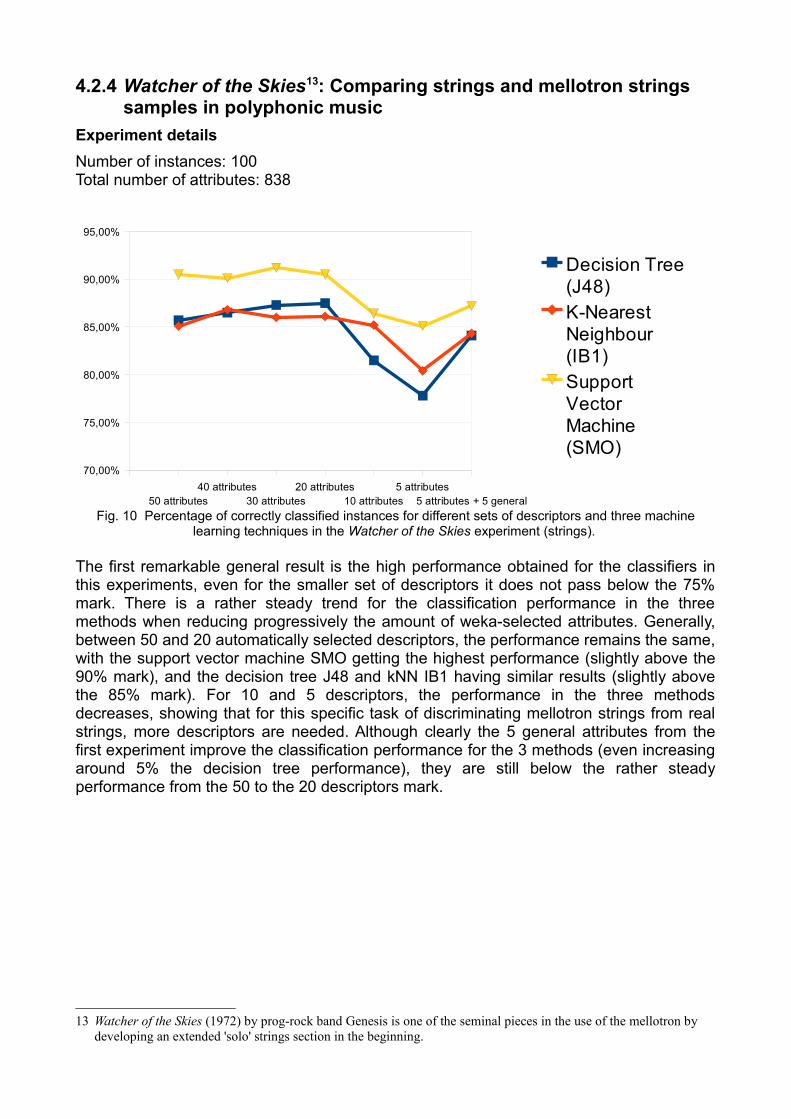
4.2.4 Watcher of the Skies13: Comparing strings and mellotron strings samples in polyphonic music
Experiment detailsNumber of instances: 100Total number of attributes: 838
Fig. 10 Percentage of correctly classified instances for different sets of descriptors and three machine learning techniques in the Watcher of the Skies experiment (strings).
The first remarkable general result is the high performance obtained for the classifiers in this experiments, even for the smaller set of descriptors it does not pass below the 75% mark. There is a rather steady trend for the classification performance in the three methods when reducing progressively the amount of weka-selected attributes. Generally, between 50 and 20 automatically selected descriptors, the performance remains the same, with the support vector machine SMO getting the highest performance (slightly above the 90% mark), and the decision tree J48 and kNN IB1 having similar results (slightly above the 85% mark). For 10 and 5 descriptors, the performance in the three methods decreases, showing that for this specific task of discriminating mellotron strings from real strings, more descriptors are needed. Although clearly the 5 general attributes from the first experiment improve the classification performance for the 3 methods (even increasing around 5% the decision tree performance), they are still below the rather steady performance from the 50 to the 20 descriptors mark.
13 Watcher of the Skies (1972) by prog-rock band Genesis is one of the seminal pieces in the use of the mellotron by developing an extended 'solo' strings section in the beginning.
50 attributes40 attributes
30 attributes20 attributes
10 attributes5 attributes
5 attributes + 5 general
70,00%
75,00%
80,00%
85,00%
90,00%
95,00%
Decision Tree (J48)K-Nearest Neighbour (IB1)Support Vector Machine (SMO)

Fig. 11 F-measure values for the Mellotron and Non-mellotron classes, with different sets of descriptors and machine learning techniques in the Watcher of the Skies experiment (strings).
In Fig. 11 it can be observed that the difference within classes is not too relevant. Both classes remain with statistically close values no matter the amount of attributes, or the machine learning technique selected. We can see that recognition of mellotron is slightly higher in general terms, but the amount of false-positives and false-negatives seems to be around a similar value. Despite the significant increase in the performance when adding the 5 descriptors from the first experiment, the highest general performance for the three methods still requires more descriptors. So in order to choose a relevant list of descriptors, we refer to the set of 20 descriptors. By comparing relative ranks between different evaluator methods (GainRatio and InfoGain), the list obtained is:
• Spectral Kurtosis (minimum value)• Bark Band 24 (maximum value)• Pitch (derivative variance)• Pitch (second derivative variance)• Pitch Instantaneous Confidence (minimum value)• Bark Bands Spread (maximum value)• Bark Band 23 (maximum value)• Bark Band 25 (maximum value)• Spectral Roll-off (maximum value)• Spectral Contrast 1 (variance)• Spectral Contrast 7 (variance)• Spectral Contrast 8 (variance)• Spectral Flux (maximum value)
Now we find a set of descriptors that did not show up in the previous experiments as being relevant for the classification tasks. Bark Bands, for instance, computes the spectrum energy contained in a given number of bands, which correspond to an extrapolation of the Bark band scale, a scale based on psychoacoustics models corresponding to the critical bands of hearing (Zwicker and Fastl, 1990). Here, a clear maximum value for higher bands is a pattern that emerges for the mellotron class. Similarly, the Bark Bands Spread is a general measure for the statistical dispersion for all Bark bands. The Spectral Kurtosis
50 attributes40 attributes
30 attributes20 attributes
10 attributes5 attributes
5 attributes + 5 general
0,700
0,750
0,800
0,850
0,900
0,950
J48 MellotronJ48 Non-mellotronIB1 MellotronIB1 Non-mellotronSMO MellotronSMO Non-mellotron

seems also to be relevant, hinting that the mellotron string sounds have a more peaked spectrum, while real strings present a flatter spectrum. Spectral Contrast is an octave-based descriptor that relates to the timbre of an audio signal and it has been proven relevant for music genre classification tasks (Akkermans, Serrà and Herrera, 2009). Spectral Flux (how quickly the power spectrum is changing) also appears on the list. It is important to mention that as the main purpose of this experiment is to compare real strings sections with mellotron-sampled ones, the majority of samples from the acoustic collection belongs to the Classical genre, while the mellotron collection as mentioned previously belongs in its totality to the Rock/Pop or Electronic genres. The set of descriptors found, (such as Spectral Contrast) plus the fact that a higher average performance than in the previous experiments was achieved, gives us indications about the model recognizing generic genre differences rather than specific instrumentation. This will be tested in subsequent experiments.
4.2.5 Exit Music14: Comparing choir and mellotron choir samples in polyphonic music
Experiment detailsNumber of instances: 134Total number of attributes: 838
Fig. 12 Percentage of correctly classified instances for different sets of descriptors and three machine learning techniques in the Exit Music experiment (choir).
SMO shows again the averaged highest performance for the different sets of descriptors. For the KNN technique, the highest performance happens around the 20 attributes mark, decreasing progressively for lower or higher number of attributes. The J48 and SMO show similar behavior, decreasing when reducing the number of descriptors and improving when adding the 5 general descriptors from the first experiment. This is remarkable especially for the decision tree model, unexpectedly increasing more than 10% when adding those 5 general descriptors. This is a relevant result, that shows how these five descriptors define some important conjunctions of features that improve the classification performance, and 14 Exit Music (For a Film) by Radiohead (1997) is a more recent example of the usage of mellotron choir, by
developing a dynamic chord-sequence in its middle-section.
50 attributes40 attributes
30 attributes20 attributes
10 attributes5 attributes
5 attributes + 5 general
60,00%
65,00%
70,00%
75,00%
80,00%
85,00%
Decision Tree (J48)K-Nearest Neighbour (IB1)Support Vector Machine (SMO)
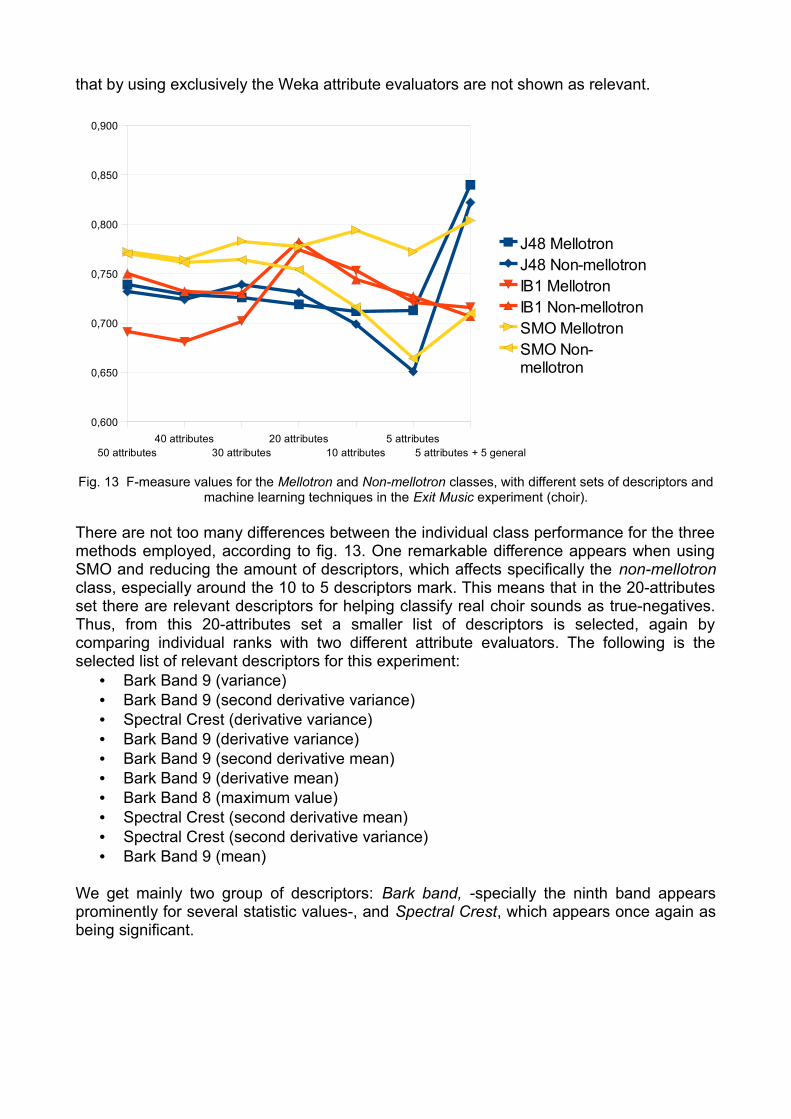
that by using exclusively the Weka attribute evaluators are not shown as relevant.
Fig. 13 F-measure values for the Mellotron and Non-mellotron classes, with different sets of descriptors and machine learning techniques in the Exit Music experiment (choir).
There are not too many differences between the individual class performance for the three methods employed, according to fig. 13. One remarkable difference appears when using SMO and reducing the amount of descriptors, which affects specifically the non-mellotron class, especially around the 10 to 5 descriptors mark. This means that in the 20-attributes set there are relevant descriptors for helping classify real choir sounds as true-negatives. Thus, from this 20-attributes set a smaller list of descriptors is selected, again by comparing individual ranks with two different attribute evaluators. The following is the selected list of relevant descriptors for this experiment:
• Bark Band 9 (variance)• Bark Band 9 (second derivative variance)• Spectral Crest (derivative variance)• Bark Band 9 (derivative variance)• Bark Band 9 (second derivative mean)• Bark Band 9 (derivative mean)• Bark Band 8 (maximum value)• Spectral Crest (second derivative mean)• Spectral Crest (second derivative variance)• Bark Band 9 (mean)
We get mainly two group of descriptors: Bark band, -specially the ninth band appears prominently for several statistic values-, and Spectral Crest, which appears once again as being significant.
50 attributes40 attributes
30 attributes20 attributes
10 attributes5 attributes
5 attributes + 5 general
0,600
0,650
0,700
0,750
0,800
0,850
0,900
J48 MellotronJ48 Non-mellotronIB1 MellotronIB1 Non-mellotronSMO MellotronSMO Non-mellotron

4.2.6 Results and discussion
We have found a list of descriptors for every experiment that could be the most relevant in trying to discriminate between the real instrument and the mellotron-sampled sound.
Mean D-Mean Var D-Var 2D-Var Min MaxDissonance X X X X
Bark bands Spread X
Bark bands 8 X
Bark bands 9 X X X X X
Bark bands 23, 24, 25 X
Spectral Crest X X X X
Spectral Contrast 1, 7, 8 X
Spectral Kurtosis X
Spectral Roll-off X
Spectral Skewness X
Pitch Instantaneous Confidence X
Spectral EnergyBand Middle-High X
Pitch X X
Spectral Flux X
MFCC 4 XTable 3 Selected group of descriptors from the the first four experiments according to their statistical values.
From Table 3 several groups of descriptors can be analyzed, where D means derivative, Var means variance, 2D means second derivative, Min means minimum value and Max means maximum value. There are several descriptors with more than one relevant statistical measure, such as Dissonance, Bark bands 9, Spectral Crest. The statistical measure that appears the most is the maximum value, specially for attributes related to the description of several high frequency bands as in Bark bands 23, 24, 25 or Spectral Energy computed for the Middle-High Band. Timbral descriptors related to genre (MFCC 4, Spectral Contrast 1, 7, 8) are present as well. However, it is important to ask again how many of these descriptors might be helping to discriminate specific genre features, instead of the individual mellotron characteristics. In the next section, experiments employing different databases, including a rock/pop and electronic collection, intend to find more information on this specific question.
4.3 Final Experiments: combining databases Now, we intend to test the performance and reliability of the findings from previous experiments by taking the specific set of descriptors from the previous experiments (Table 3) to check whether if combining them would lead to a general characterization of the mellotron sound, no matter the kind of instrument sampled. Thus, the first experiment will mix all databases with sounds coming from the mellotron, with However, we also must find out whether this set of descriptors are discriminating the presence of the mellotron or if they are a set of features that focus more on general genre-differences. For that, a general rock/pop and electronic collection will be used in another experiment.

• Comparing two different set of descriptors, in the following way:
◦ One set (from now on it will be referred to as Set 1) will use Weka features evaluators (InfoGain and GainRatio) by using the Attribute Selected Classifier. With the Ranker Search method, selecting groups of 30, 20, 10 and 5 descriptors out of the general 838 attributes.
◦ The other set will exclusively use the group of 30 descriptors obtained in the previous experiments (see Table 3), selecting groups of 30, 20, 10 and 5 highest-ranked for this task (from now on this set will be referred to as Set 2).
• Testing the classifiers (J48, IB1, SMO) employing 10-Fold Cross-Validation.
• Utilizing different random seeds for creating several data partitions and averaging the evaluation results.
• The evaluation will comprise: percentage of correctly classified instances and individual class f-measures.
Some questions that we are pursuing with these final experiments:
• Is it possible to detect and classify mellotron sounds that sample different musical instruments, in this case, strings, flute and choir?
• Are there any features in the mechanism of the instrument that make it possible to find a group of low-level descriptors that help discriminate the mellotron from the instruments it samples or from any other instrumental mixture?
4.3.1 Kashmir15: combining strings, flute and choir samples.
Experiments detailsInstances: 374Total number of attributes: 838As we are combining the datasets from the three previous experiments, the task in this experiment increases: trying to distinguish all grouped mellotron sounds (flute, strings, choir) from the combination of real instruments. However, it is the intention of this experiment to include information related to the previous experiments, in the form of the selected descriptors for each case and compare it with the newly evaluated list of attributes.
15 Led Zeppelin's Kashmir (1975) combines both a real strings section with mellotron strings accompaniment for creating a background contrast between different passages of the song.

Fig. 14 Classifiers performance for two different set of descriptors and different amount of selected descriptors in the Kashmir experiment.
Fig. 14 shows the performance for the three classifiers with Set 1 of descriptors (which can be identified in the graph with the blue tones) and Set 2 of descriptors (which can be identified in the graph with the orange/red tones). We see that despite the fact that the Set 2 of descriptors (obtained from previous experiments) outperforms generally the Set 1 of descriptors (selected automatically by Weka), the best results still require the whole amount of descriptors. However, results for Set 2 show how the previous experiments hinted correctly at describing the main features of the mellotron. For higher performances several descriptors are needed though. The less descriptors are used, the worse the performance is. It can be concluded that as three different main timbral groups are used here (strings, choir, flute for both real instruments and mellotron-sampled) the classifier requires more descriptors that could describe the several amount of timbres found.
30 descriptors 20 descriptors 10 descriptors 5 descriptorsSet 1 Set 2 Set 1 Set 2 Set 1 Set 2 Set 1 Set 2
J48Mellotron 0,656 0,685 0,690 0,656 0,596 0,726 0,558 0,721Non-mellotron 0,654 0,698 0,560 0,693 0,582 0,596 0,552 0,506
IB1Mellotron 0,690 0,739 0,667 0,716 0,594 0,687 0,598 0,627Non-mellotron 0,686 0,753 0,675 0,728 0,600 0,682 0,579 0,624
SMOMellotron 0,717 0,789 0,719 0,722 0,680 0,706 0,650 0,715Non-mellotron 0,674 0,774 0,636 0,688 0,556 0,627 0,515 0,637
Table 4 f-measure for 2 different classes, two different sets of descriptors, three classification techniques, and different amount of descriptors in the Kashmir experiment.
The highest-scoring f-measures for the same amount of descriptors are shown in bold in Table 4. Looking at the individual classes performance is also helpful for analyzing what at
30 attributes 20 attributes 10 attributes 5 attributes50,00%
55,00%
60,00%
65,00%
70,00%
75,00%
80,00%
J48 Descriptors Set 1 (Weka)IB1 Descriptors Set 1 (Weka)SMO Descriptors Set 1 (Weka)J48 Descriptors Set 2 IB1 Descriptors Set 2SMO Descriptors Set 2

first glance seems to be 'good' resulsts. For instance, we see in table 4 how when using 5 descriptors and the J48 classifier, the mellotron class presents an f-measure of 0,721 (the highest of all classifiers for that amount of descriptors), but the non-mellotron class in the same category has an f-measure of 0,506, which corresponds basically to chance values. As the decision is binary, what this classifier is doing is assigning most of the instances to the mellotron class, which increases the amount of false-negatives in the non-mellotron class. Thus, it is not a reliable result.
4.3.2 Space Oddity16: comparing mellotron sounds with rock/pop and electronic music samples.
Experiment detailsInstances: 600Total number of attributes: 838
The general rock/pop and electronic music collection is used, 300 samples with music from different decades and several sub-genres, against 300 samples containing mellotron sounds for all three instruments. As a new and non-used before dataset is used, there will be a new list of weka-selected descriptors for this task. But as with the previous experiment Kashmir, the former set of selected descriptors will be included as well, in order to compare the performances, and check if they are relevant for the classification tasks.
Fig. 15 Classifiers performance for two different set of descriptors and different amount of selected descriptors in the Space Oddity experiment.
In this task, performance for different sets of descriptors, methods and amount of attributes is always higher than 70%. However, the performance of the Set 2 of descriptors (in orange/red tones in Fig. 15) remains almost always below the performance for Set 1 (in
16 Space Oddity (1969) by David Bowie evokes the interstellar trip of the astronaut Major Tom with the 'ethereal' sounds of a mellotron.
30 attributes 20 attributes 10 attributes 5 attributes70,00%
72,00%
74,00%
76,00%
78,00%
80,00%
82,00%
84,00%
86,00%
J48 Descriptors Set 1 (Weka)IB1 Descriptors Set 1 (Weka)SMO Descriptors Set 1 (Weka)J48 Descriptors Set 2 IB1 Descriptors Set 2SMO Descriptors Set 2

blue tones in Fig. 15). In this case, the weka-selected group of descriptors proves to be better than the automatically selected descriptors by Weka. The SMO classifier has the best classification performance results. Reducing the amount of descriptors generally affects negatively the classifiers performance, but the reduction is not drastic.
30 descriptors 20 descriptors 10 descriptors 5 descriptorsSet 1 Set 2 Set 1 Set 2 Set 1 Set 2 Set 1 Set 2
J48Mellotron 0,793 0,745 0,806 0,752 0,810 0,728 0,779 0,728Non-mellotron 0,799 0,744 0,793 0,752 0,793 0,765 0,770 0,772
IB1Mellotron 0,795 0,747 0,780 0,767 0,776 0,717 0,756 0,711Non-mellotron 0,792 0,738 0,774 0,759 0,765 0,722 0,750 0,711
SMOMellotron 0,839 0,801 0,841 0,798 0,840 0,773 0,826 0,773Non-mellotron 0,837 0,814 0,837 0,814 0,833 0,796 0,812 0,792
Table 5 f-measure for 2 different classes, two different sets of descriptors, three classification techniques, and different amount of descriptors in the Space Oddity experiment.
The difference between classes as seen in Table 4, is not important, both remain statistically closed for every single category, with the best performance belonging to the SMO classifier for both sets of descriptors.
4.3.3 Epitaph17: comparing mellotron samples with specific instruments and generic rock/pop and electronic music samples
Experiment detailsInstances: 600Total number of attributes: 838
For this final experiment, the same mellotron class from the previous experimente will be used (300 instances featuring strings, flute and choir mellotron). Databases from the previous two experiments will be combined for the non-mellotron class in the following way:
• 50% (150 instances out of 300) correspond to samples randomly taken from the strings, flute and choir instrument collections.
• 50% (150 instances out of 300) correspond to samples randomly taken from the generic rock/pop and electronic music collections.
In that way, we are creating a 'hybrid' from the two previous experiments, increasing the complexity of the training task.
17 King Crimson's Epitaph (1969) is also one of the most representative mellotron pieces in the progressive rock canon, employing sustained strings chords in this slow-building piece.

Fig. 16 Classifiers performance for two different set of descriptors and different amount of selected descriptors in the Epitaph experiment.
When combining this databases half and half, the general classifying performance of the models tested decreases. It can be seen in fig. 16, how the best performance belongs to the Weka selected classifiers. Set 2 of descriptors does not prove to be very practical at this task, especially when reducing the amount of attributes.
30 descriptors 20 descriptors 10 descriptors 5 descriptorsSet 1 Set 2 Set 1 Set 2 Set 1 Set 2 Set 1 Set 2
J48Mellotron 0,712 0,651 0,728 0,643 0,737 0,684 0,730 0,624Non-mellotron 0,691 0,662 0,693 0,625 0,683 0,585 0,652 0,556
IB1Mellotron 0,684 0,687 0,665 0,667 0,681 0,642 0,640 0,563Non-mellotron 0,672 0,690 0,652 0,668 0,675 0,634 0,645 0,571
SMOMellotron 0,747 0,681 0,753 0,677 0,754 0,664 0,743 0,662Non-mellotron 0,704 0,628 0,703 0,638 0,696 0,622 0,668 0,549
Table 6 f-measure for 2 different classes, two different sets of descriptors, three classification techniques, and different amount of descriptors in the Epitaph experiment.
Again, SMO proves to be the best classifier for Set 1. For set 2 however, other techniques outperform it depending on the number of descriptors employed. But the less descriptors used, the less accurate the model is. Table 6 shows for example how for some f-measure values, performance when reducing the number of attributes in Set 2 is not far from chance.
4.3.4 DiscussionThe results in this last series of experiments show the difficulty in modeling the sound of a specific instrument in a polyphonic mixture. On one hand, it requires a large number of descriptors for relatively high performances. On the other hand, performance decreases when changing some characteristics of the databases. Not all the questions asked were answered. It remains hard to tell whether high performance results are due to accurate
30 attributes 20 attributes 10 attributes 5 attributes55,00%
57,00%
59,00%
61,00%
63,00%
65,00%
67,00%
69,00%
71,00%
73,00%
75,00%
J48 Descriptors Set 1 (Weka)IB1 Descriptors Set 1 (Weka)SMO Descriptors Set 1 (Weka)J48 Descriptors Set 2 IB1 Descriptors Set 2SMO Descriptors Set 2

descriptions on the actual instrument or to generic differences between styles of music. It can be stated however, that there is evidence supporting the idea of the mellotron adding specific features in the sound -disregarding the instrument being sampled- that can be found and described in its spectrum.
5 Conclusions5.1 On the projectThis is to the best of our knowledge, the only research of its kind conducted on the mellotron, an instrument that although not so common in the Western popular music canon, presents interesting technical and perceptual qualities, which make it ideal for the study of timbre descriptors in the context of automatic classification in polyphonic audio.
Despite the difficulty involved when trying to extract features belonging to a single instrument from polyphonic audio -and in this particular case, one instrument featuring 'several instruments'- there is some evidence that the methodology used proves to be effective for solving the task. However, due to the huge variety of spectral and temporal features that can be found in a polyphonic mixture (belonging to any kind of instrument from any style or genre), probably this methodology by itself won't be sufficient for achieving higher classification performances or for attempting to employ it in more complex tasks such as genre or geographical classification.
Even though the models did not achieve a very high classification performance, the results obtained were relevant for the tasks proposed, with values far above chance in most cases, which indicates some statistical significance for assuring that the models tested are indeed recognizing the presence of the mellotron in a polyphonic context, and discriminating it from the instruments it samples or other timbral mixtures. Although it was attempted trying to obtain a reduced set of descriptors that could be used for discriminate the sound of the mellotron, the complexity of the task showed the necessity of having larger sets in several experiments.
It is important to note how some mellotron features, such as the slight variations in frequency due to irregular tape motion, could be indeed distinctive of this instrument, but they are not always present in the recordings. This means that depending on variables such as recording and production characteristics, model of mellotron or even date of the recording, some sound characteristics of the instrument could notably change, or even could not be featured in the audio samples. The descriptors obtained by the different models that could help differentiate and classify the mellotron, are somehow coherent with the physical properties of the instrument. Indeed one could hypothesize that features such as irregularities in the tape motion mechanism could be related to the dissonance descriptor, or the tape hiss could be reflected on attributes such as the spectral crest.
5.2 On the methodology
The methodology used has a series of advantages worth mentioning. First, it is applied to music in real scenarios, that is, polyphonic signals which take into account a diversity of sound sources creating a multi-timbral mixture, instead of the monophonic approach where instruments are specifically isolated. It can be extrapolated to several categories, including solo instruments or several combination of instruments, that could help to classify the data according to predefined taxonomies. Some of the approaches used previously to approach this problem, imply building a model that sometimes fits only one specific instrument. As we are dealing with polyphonic music, this approach can be extended and be applied to any kind of instruments coming from any musical culture in the world, thus

being pertinent for current multicultural approaches in MIR. No previous processing is needed, which drastically reduces the computational time when comparing it to the time needed in other different methods. Many of other techniques which deal with this task, such as source separation, are still in an incipient stage (Fuhrmann, Haro and Herrera, 2009), so it constitutes a rather simple and cost/benefit appropriated methodology. It can be robust against unknown categorizations, i.e. instruments or sounds that have not been identified previously. Once a model for a specific instrument is established, it does not require any information beforehand from the audio file, i.e. the computation can be applied to raw data without any kind of high-level tags associated to it. It is pertinent also to remark the importance of the groundtruth collections: basically, the success of the implemented models depends not only in the quantity, but in the quality of the samples used to train the classifiers. This goes to show the importance of treating music as a physical and perceptual phenomenon and not only as data. The project also shows the importance of not using software tools (such as the Weka machine learning classifiers) merely as black boxes, where the main goal is defined by obtaining an 'output' just for the sake of it, without knowing the inner underlying processes in the different stages of the methodology.
5.3 Future work
There are several possibilities for achieving a more refined methodology in order to get more detailed descriptors that could lead to higher classifiers performance. Some of the collections were not as large as for becoming totally representative of the mellotron detection and classification task. Getting access to the recordings is not simple, it requires time and careful listening process due to the specific characteristics of the mellotron that make it hard to be perceived. Maybe with further exhaustive search the collections could be increased, and the models found in this project tested again.
The descriptors found to be relevant when describing the sound of the mellotron could eventually be attributed or caused by the magnetic tape mechanism. In order to find out about this, further research must be carried out. For instance, creating a collection with samples of music directly transferred from magnetic tapes, and testing to see if a similar group of descriptors is obtained.
One further step would be also to implement a mellotron detector in a genre-classifier. This could be tested, with and without the mellotron detector in order to determine if the genre/sub-genre performance actually increases when including timbre information corresponding to the specific instrument.
It is possible to apply this methodology for the detection and classification of any musical instrument in polyphonic music. Considering the current interest in multicultural approaches18it would be of great interest to apply this methodology for musical instruments coming from any geographic region and any musical cultural in the world.
18 See for instance the CompMusic project http://compmusic.upf.edu Music Technology Group - Universitat Pompeu Fabra.

ReferencesAkkermans, V., Serrà, J. and Herrera, P. Shape-based spectral contrast descriptor. Proceedings of the SMC 2009 - 6th Sound and Music Computing Conference. Porto, Portugal, 2009.
Alpaydin, E. Introduction to machine learning. Cambridge: MIT Press, 2004.
Aucouturier, J.J. and Pachet, F. Music similarity measures: What's the use?, in Proc Intl Conf on Music Information Retrieval (ISMIR), Paris, France, 2002.
Aucouturier, J.J., Pachet, F. and Sandler, M.. “The Way It Sounds”: Timbre Models for Analysis and Retrieval of Music Signals. IEEE Transactions on Multimedia, 7(6):1028–1035, December 2005.
Bartók, B. Escritos sobre música popular. México D.F.: Siglo XXI Editores, 1979.
Eck, D., Lamere, P., Bertin-Mahieux, T. and Green, S. “Automatic generation of social tags for music recommendation,” Advances in neural Information Processing Systems, vol. 20, 2007.
Eggink, J. and Brown, G.J. Instrument recognition in accompanied sonatas and concertos. Proceedings of the IEEE International Conference on Acoustics, Speech and Signal Processing, 2004.
Essentia User and Developer Manual, Music Technology Group, Universitat Pompeu Fabra, Barcelona, España, 2010.
Essid, S., Richard, G., and David, B. “Instrument recognition in polyphonic music based on automatic taxonomies”, IEEE Transactions on Audio, Speech and Language Processing, vol. 14, no. 1, pp. 68-80, 2006.
Every, M. “Discriminating between pitched sources in music audio”, IEEE Transactions on Audio, Speech and Language Processing, vol. 16, no. 2, pp. 267-277, 2008.
Ferrer, R. Embodied cognition applied to timbre and musical appreciation: Theoretical foundation. British Postgraduate Musicology, 10, 2009.
Fuhrmann, F. and Herrera, P. Polyphonic instrument recognition for exploring semantic similarities in music. Proc. of DAFx-10, 2010.
Gillet O. and Richard, G. “Transcription and separation of drum signals from polyphonic music”, IEEE Trans. On Audio, Speech and Language Processing, vol. 16, no. 3, pp. 529-540, 2008.
Gómez, E. and Herrera, P. The song remains the same: identifying versions of the same song using tonal descriptors. Int. Conf. on Music Information Retrieval, 2006.
Gómez, E., Haro, M. and Herrera, P.. Music and geography: Content description of musical audio from different parts of the world. In Proc. of ISMIR, Kobe, Japan, 2009.

Heittola, T., Klapuri, A. and Virtanen, T. “Musical instrument recognition in polyphonic audio using source-filter model for sound separation”, Proc. of ISMIR, 2009.
Herrera-Boyer, P., Klapuri, A., Davy, M., “Automatic Classification of Pitched Musical Instrument Sounds,” In Klapuri, A., Davy, M. (Eds.) Signal Processing Methods for Music Transcription, Springer, New York, 2006.
Herrera, P., Yeterian, A. & Gouyon, F. “Automatic classification of drum sounds: a comparison of feature selection methods and classification techniques”. Lecture Notes in Computer Science, Volume 2445/2002, pp. 69-80, 2002.
Hoffman, M., Blei, D.and Cook, P. “Easy as CBA: A simple probabilistic model for tagging music,” Proc. of ISMIR, pp. 369–374, 2009.
Kartomi, M. On Concepts and Classifications of Musical Instruments. Chicago: University of Chicago Press, 1990.
Kitahara, T., Goto, M., Komatani, K., Ogata T., and Okuno, H. “Instrument Identification in polyphonic music: Feature weighting to minimize influence of sound overlaps”. EURASIP Journal on Advances in Signal Processing, vol. 2007, pp. 1-16, 2007.
Kranenburg P., Garbers, J., Volk, A., Wiering, F., Grijp L., & Veltkamp, R. "Collaboration Perspectives for Folk Song Research and Music Information Retrieval: The Indispensable Role of Computational Musicology" In: Journal of Interdisciplinary Music Studies, spring, volume 4, issue 1, pp. 17-43, 2010.
Leman, M. Embodied Music Cognition and Mediation Technology. Cambridge: MIT Press, 2008.
Leman, M., Schneider, A.. “Origin and Nature of Cognitive and Systematic Musicology: An Introduction”. In Marc Leman, (ed.) Music, Gestalt and Computing. New York : Springer, 1997.
Little, D. and Pardo, B. Learning musical instruments from mixtures of audio with weak labels, in Proc. of ISMIR, 2008.
Louhivuori, J.. “Systematic, Cognitive and Historical Approaches in Musicology”. In Marc Leman, (ed.) Music, Gestalt and Computing. New York : Springer, 1997.
O’Callaghan, C. Sounds. New York: Oxford University Press, 2007.
Paulus J. and Klapuri, A. “Combining temporal and spectral features in hmm-based drum transcription”, in Proc. of ISMIR, 2007.
Peeters, G. “A large set of audio features for sound description (similarity and classification) in the CUIDADO prject”, CUIDADO I.S.T. Project Report, 2004.
Pei, S. and Hsu, N. “Instrumentation analysis and identification of polyphonic music using beat-synchronous feature integration and fuzzy clustering”, IEEE International Conference on Acoustics, Speech and Signal Processing, 2009.

Polotti, P. and Rocchesso, D. Sound to sense - sense to sound: a state of the art in sound and music computing. Berlin, Germany: Logos, 2008.
Serrà, J. Music similarity based on sequences of descriptors: tonal features applied to audio cover song identification. Master thesis in Tecnologies de la Informació, la Comunicació i els Mitjans Audiovisuals. Universitat Pompeu Fabra, Barcelona, 2007.
Sethares, W. A. Tuning, Timbre, Spectrum, Scale. New York : Springer, 1997.
Turnbull, D., Barrington, L., Torres, D. and Lanckriet, G. “Semantic annotation and retrieval of music and sound effects,” IEEE Transactions on Audio Speech and Language Processing, vol. 16, no. 2, pp. 467–476, 2008.
Vail, M. Vintage Synthesizers. San Francisco: Miller Freeman, 2000.
Weka Manual for Version 3.7.3. University of Waikato, Hamilton, New Zealand, 2010.
Zwicker, E. and Fastl, H. Psychoacoustics: Facts and Models. Berlin: Springer Verlag, 1990.