Embed Size (px)
Citation preview
RESEARCH ARTICLE
Detection of genetic integrity of conserved maize (Zea mays L.)germplasm in genebanks using SNP markers
Weiwei Wen • Suketoshi Taba • Trushar Shah •
Victor H. Chavez Tovar • Jianbing Yan
Received: 10 December 2009 / Accepted: 12 April 2010 / Published online: 7 May 2010
� Springer Science+Business Media B.V. 2010
Abstract Twenty maize landrace accessions
regenerated and conserved in five maize genebanks
were investigated for genetic integrity using 1,150
Single Nucleotide Polymorphisms (SNPs) and 235
SNP haplotypes. The genetic diversity of three
accessions changed significantly in terms of the
average number of alleles per locus. Ten out of
twenty accessions had significantly different SNP
allelic frequencies, either after regeneration or in the
same accession held in different genebanks. The
proportion of loci with significant changes in SNP
allelic frequency was very low (37/1,150). Changes in
the major allelic frequency (MAF) for the majority of
SNP loci (60.2–75.2%) were less than 0.05. For SNP
haplotypes, the genetic diversity of four accessions
changed significantly in terms of average number of
haplotype alleles and polymorphic information con-
tent (PIC) per locus. The proportion of SNP haplotype
alleles lost in the later generations ranged between 0
and 22.6%, and at the same time 0–19.9% of the SNP
haplotype alleles appeared in later generations, how-
ever, these were absent in the earlier generations.
Dynamic changes in genetic integrity, in terms of
presence and absence of genes (alleles), by both SNP
and SNP haplotype analysis were detected during
regeneration. A suboptimum number of ears harvested
in one generation can be combined with those from
another, repeated regeneration to capture the diversity
of the previous generation. Use of molecular markers
during regeneration of accessions can help in under-
standing the extent of genetic integrity of the maize
accessions in ex situ genebanks and in recommending
the best practice for maintaining the original genetic
diversity of the genebank accessions.
Keywords Conservation � Genebank �Genetic integrity � Maize � Regeneration �SNP � Zea mays
Introduction
Maize, which originated in southern Mexico, is one of
the most important crops in the world. Seed multipli-
cation and regeneration of the original landrace
accessions has been performed in ex situ genebanks
to fulfill seed requests for further characterization and
for use in breeding and research. In the course of seed
preservation for the active collection, if seed viability
Electronic supplementary material The online version ofthis article (doi:10.1007/s10722-010-9562-8) containssupplementary material, which is available to authorized users.
W. Wen � S. Taba � V. H. Chavez Tovar � J. Yan (&)
International Maize and Wheat Improvement Center
(CIMMYT), Apdo. Postal 6-641, 06600 Mexico,
DF, Mexico
e-mail: [email protected]
T. Shah
International Crops Research Institute for the Semi-Arid
Tropics (ICRISAT), Patancheru Hyderabad, Andhra
Pradesh 502324, India
123
Genet Resour Crop Evol (2011) 58:189–207
DOI 10.1007/s10722-010-9562-8
of the accessions drops below 85% germination or the
number of seeds falls below 1,500, the accession is
regenerated (Taba et al. 2004). The diverse pheno-
types and widely differing adaptations of the races of
maize and local cultivars are often constraints to
regeneration (Taba and Twumasi-Afriyie 2008).
Reducing and managing the loss of genetic integrity
of the conserved germplasm during regeneration is an
important objective of maize genetic resource conser-
vation programs. The management of seed accessions
in different maize genebanks can lead to differential
loss of genetic integrity. Identification and rationali-
zation of duplicate accessions in genebanks requires
information on the genetic integrity of the accessions.
To recommend better practices for maintaining pan-
mictic populations of maize accessions, several stud-
ies on genetic integrity during seed multiplication and
regeneration using molecular makers from other seed
or clonally propagated crops can be useful to compare
with those of maize genebank accessions.
The total number of maize and wild species
accessions currently held in trust at the International
Maize and Wheat Improvement Center (CIMMYT)
genebank is 27,441 and this is increased each year with
new introductions. Most accessions are maize land-
races (24,191); however, breeding lines, gene pools,
populations and cultivars, and teosinte are also
preserved in this ex situ collection. In CIMMYT,
collection of germplasm accessions and gene pool
enhancement are carried out to promote use of maize
genetic resources, towards the ultimate goal of devel-
oping improved cultivars. The original maize collec-
tions date back to the 1940s, when some 2,000 Mexican
accessions were collected and the races of maize in
Mexico were studied. Accessions collected from the
US National Research Council (NRC) were regener-
ated several times and the original seed stocks are no
longer available. The current seed sources have
undergone several generations of seed multiplication.
At present, a few seed stocks of only two or three
generations are available for comparing genetic integ-
rity. Efforts to regenerate endangered, national seed
collections of maize in Latin America started in 1993
and have continued to present (Taba et al. 2005).
CIMMYT introduced new accessions and curated
some for which seed was in short supply. Seed lots
were introduced and regenerated at CIMMYT or at
other genebanks. In some instances, the same acces-
sion went through several regeneration attempts with
limited success. Different seed sources of the same
accessions can be compared if they are genetically
different. In this project, the cooperative banks of
CIMMYT were the banks of the International Institute
of Tropical Agriculture (IITA, Nigeria), the Autono-
mous National Institute for Agricultural Research
(INIAP, Ecuador), the Brazilian Agricultural Research
Corporation (EMBRAPA, Brazil), and the National
Institute for Investigation in Forestry, Agriculture and
Fishery (INIFAP, Mexico).
Previous studies using molecular tools have been
performed on the genetic integrity of genebank acces-
sions of some crop species during regeneration. Borner
et al. (2000) studied the genetic integrity of eight wheat
(Triticum aestivum L.) accessions conserved in the
Gatersleben genebank and regenerated up to 24 times
using 9 wheat microsatellite markers; they concluded
that microsatellites can be used as a simple and reliable
marker system to verify the integrity and genetic
stability of genebank accessions. The genetic integrity
of 6 accessions, represented by 14 sub-populations of
the open-pollinating species of rye (Secale cereale L.),
was investigated using 10 rye microsatellites
(Chebotar et al. 2003) and found that 4 accessions
had significantly different allele frequencies and nearly
50% of alleles identified in the original samples were
lost in the regenerated samples. However, some alleles
detected in the most recently propagated sub-popula-
tions were not observed in the investigated plants of the
original seed stocks (Chebotar et al. 2003). Work by
van Hintum et al. (2007) used Amplified Fragment
Length Polymorphisms (AFLPs) to show that the
distribution of genetic diversity in a Brassica oleracea
collection was related to the effects of regeneration,
and argued that accessions with similar levels of
differentiation over generations may be combined
safely. Also, in a Brassica oleracea collection, Soen-
gas et al. (2009) investigated the effect of regeneration
on the genetic integrity of 3 accessions based on 25
simple sequence repeats (SSRs) and found that there
were significant changes in the population structure
and the allelic frequency at individual loci due to the
action of genetic drift, directional selection, and
possibly assortative mating.
Molecular characterization of germplasm acces-
sions is a useful tool for better management and to
study genetic diversity and integrity of conserved
germplasm. The new molecular marker system,
known as single nucleotide polymorphism (SNP), is
190 Genet Resour Crop Evol (2011) 58:189–207
123
widely used in different crops (Rostoks et al. 2006;
Hyten et al. 2008; Muchero et al. 2009), including
maize (Buckler et al. 2009; Lu et al. 2009; Yan et al.
2009, 2010). It is highly polymorphic, evenly distrib-
uted, co-dominant, accurate, reproducible, high-
throughput and cost-effective. SNPs are regarded as
the ideal marker system for research which includes
genetic diversity analysis, linkage map construction,
QTL mapping, and marker-assisted selection (MAS;
Yan et al. 2010). In previous studies, a limited number
of molecular markers and accessions were employed
to analyze the genetic integrity of the crop species
mentioned above. Thus, these studies may not reflect
the whole picture of genetic changes at a genome-wide
level. Few studies of genetic integrity in maize
genebank accessions have been reported. In the
present study, we genotyped 2–3 comparable gener-
ations of twenty maize accessions conserved in five
genebanks with a custom GoldenGate assay contain-
ing 1,536 SNPs well distributed across the maize
genome. The objectives were to detect genetic differ-
ences between the comparable generations of the
genebank accessions and to investigate the effect of
regeneration in different environments and by differ-
ent genebanks on the genetic integrity of maize
accessions.
Materials and methods
Plant material and DNA isolation
Seed stocks for the accessions in this study were
collected from the CIMMYT maize genebank. The
original reference seed sources were the introductions
from the cooperative genebanks to the CIMMYT
maize genebank. The subsequent generations were
the seed accessions regenerated either at CIMMYT or
received from the Latin American cooperative gene-
banks, where regeneration of the same accessions
was carried out during the cooperative maize germ-
plasm regeneration project during 1993–2005 (Taba
et al. 2005). The same maize accessions which were
regenerated in different times and locations in Latin
American maize genebanks were compared for their
genetic integrity. The earlier generations (cycles)
were recorded as generation 1 and the later genera-
tions (cycles) were recorded as generations 2 and 3
(Table 1). Among the accessions included in the
present study, with respect to the genebank acces-
sions (Table 1), were four accessions of the NRC
collection from Ecuador in 1954 deposited at the
CIMMYT genebank in 1974 after having been
regenerated at Carhuas, Peru. They were then sent
to the Santa Catalina station of INIAP, Ecuador, for
regeneration. CIMMYT received the regenerated
seeds sent by the INIAP maize genebank for long
term conservation. Both the CIMMYT and EMBRA-
PA genebanks have preserved the same seed acces-
sions with different seed origins. The EMBRAPA
genebank sent them to CIMMYT as the duplicate
accessions in 1995. Accessions from the INIFAP
genebank were regenerated at Celaya, Mexico, in
2003. The CIMMYT genebank regenerated the same
accessions before 2003 from its own seed sources.
For the accessions included from the CIMMYT
genebank, the seed sources of the earlier generations
differ in regeneration sites and years, and the later
generations differ in years and different crop seasons
at the Tlaltizapan experiment station, in the state of
Morelos, Mexico. Regarding materials from the IITA
genebank, the CIMMYT genebank received the
accessions in 2005 and regenerated them in 2007
and 2009 from the same seed lots, growing them in 8
five-meter rows at Tlaltizapan. Effects on the genetic
integrity of the repeated samplings and regenerations
were monitored for the seed accessions obtained from
different genebanks. Following the recommended
procedures for regeneration, 256 plants per plot
(60 m2) were grown in 16 rows 5 m long, with a
spacing of 75 cm between rows. Artificial pollination
was carried out by chain crossing, using each plant as
a male and female. At least 100 ears were represented
in the next generation. The number of seeds of each
ear is balanced in making the seed bulk for genebank
storage. Seed accessions with records of the number
of ears in regeneration were included in this study as
much as possible for investigating the effects of
sampling size on the genetic integrity of the acces-
sions. The detailed history and passport information
of the accessions can be found in Table S1.
In the screenhouse at El Batan, CIMMYT, 200
seeds of each generation were sown during April–
May 2009. Depending on seed germination of the
accessions, 120–135 seedlings (5–6 leaf stage) per
generation were used for DNA extraction. DNA was
extracted using a CTAB procedure (CIMMYT
Applied Molecular Genetics Laboratory 2003). Each
Genet Resour Crop Evol (2011) 58:189–207 191
123
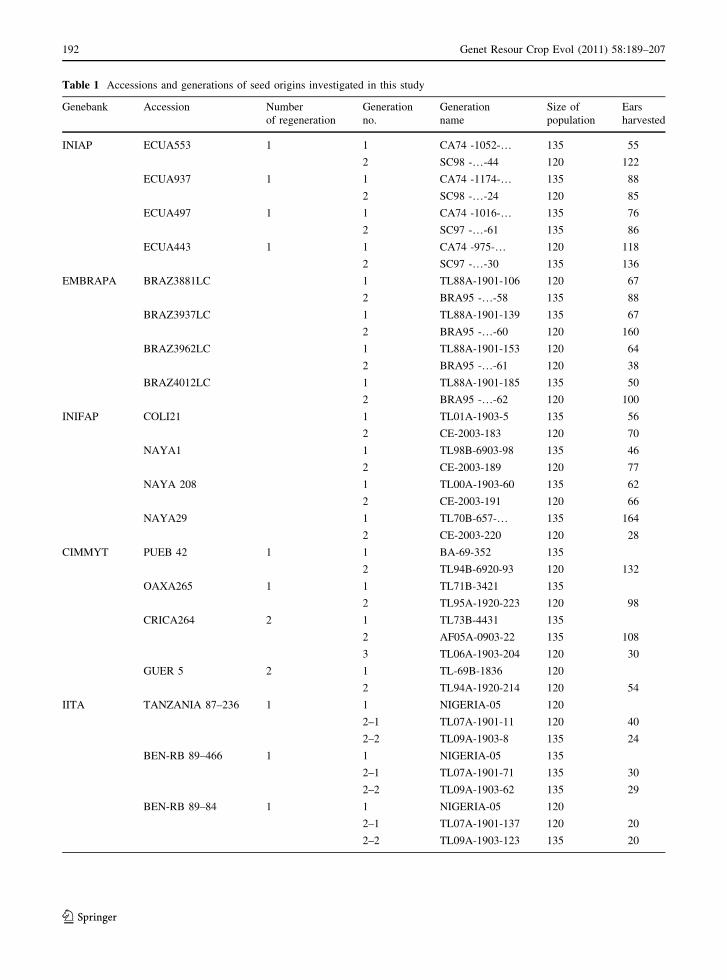
Table 1 Accessions and generations of seed origins investigated in this study
Genebank Accession Number
of regeneration
Generation
no.
Generation
name
Size of
population
Ears
harvested
INIAP ECUA553 1 1 CA74 -1052-… 135 55
2 SC98 -…-44 120 122
ECUA937 1 1 CA74 -1174-… 135 88
2 SC98 -…-24 120 85
ECUA497 1 1 CA74 -1016-… 135 76
2 SC97 -…-61 135 86
ECUA443 1 1 CA74 -975-… 120 118
2 SC97 -…-30 135 136
EMBRAPA BRAZ3881LC 1 TL88A-1901-106 120 67
2 BRA95 -…-58 135 88
BRAZ3937LC 1 TL88A-1901-139 135 67
2 BRA95 -…-60 120 160
BRAZ3962LC 1 TL88A-1901-153 120 64
2 BRA95 -…-61 120 38
BRAZ4012LC 1 TL88A-1901-185 135 50
2 BRA95 -…-62 120 100
INIFAP COLI21 1 TL01A-1903-5 135 56
2 CE-2003-183 120 70
NAYA1 1 TL98B-6903-98 135 46
2 CE-2003-189 120 77
NAYA 208 1 TL00A-1903-60 135 62
2 CE-2003-191 120 66
NAYA29 1 TL70B-657-… 135 164
2 CE-2003-220 120 28
CIMMYT PUEB 42 1 1 BA-69-352 135
2 TL94B-6920-93 120 132
OAXA265 1 1 TL71B-3421 135
2 TL95A-1920-223 120 98
CRICA264 2 1 TL73B-4431 135
2 AF05A-0903-22 135 108
3 TL06A-1903-204 120 30
GUER 5 2 1 TL-69B-1836 120
2 TL94A-1920-214 120 54
IITA TANZANIA 87–236 1 1 NIGERIA-05 120
2–1 TL07A-1901-11 120 40
2–2 TL09A-1903-8 135 24
BEN-RB 89–466 1 1 NIGERIA-05 135
2–1 TL07A-1901-71 135 30
2–2 TL09A-1903-62 135 29
BEN-RB 89–84 1 1 NIGERIA-05 120
2–1 TL07A-1901-137 120 20
2–2 TL09A-1903-123 135 20
192 Genet Resour Crop Evol (2011) 58:189–207
123
DNA sample was obtained from the bulked leaves of
15 individuals with equal quantity from each indi-
vidual. Eight or nine replicated sets of the DNA
samples were used for genotyping each generation of
accessions. In total, 382 DNA samples were geno-
typed, including 173 samples from the earlier gener-
ations and 209 samples from the comparable
generation of later seed origins. One accession from
CIMMYT and 4 accessions from IITA had 3
generations of seed origins.
SNP genotyping
A custom oligo pool assay (OPA) containing 1,536
SNPs has been developed by Yan et al. (2009) where a
total of 943 SNPs with high quality and minor allelic
frequency greater than 0.05 were obtained. To develop
the OPA used in this study, the 943 high quality SNPs
were combined with 593 SNPs selected from the
Panzea database (www.panzea.org) on the basis of a
designability score higher than 0.5. Designability
scores were provided by the Illumina Company, and a
score greater than 0.5 indicates that a SNP has a rela-
tively higher probability of success when used in a
GoldenGate assay. A total of 382 bulked samples were
genotyped using this OPA. SNP genotyping was per-
formed using the Illumina BeadStation 500 G
(Illumina, Inc., San Diego, CA, USA) at the Cornell
University Life Sciences Core Laboratories Center
using the protocol described by Fan et al. (2006). After
SNP genotyping, allele calling and further analyses
were carried out as described in Yan et al. (2010).
Haplotype analysis
The 1,536 SNP reference sequences were used to
carry out a BlastN search against the maize acces-
sioned golden path (AGP) version 1 for B73 (http://
www2.genome.arizona.edu/genomes/maize; Schnable
et al. 2009). The top blast-hit was considered with an
e-value threshold of e-18. A total of 1,420 unique SNPs
out of 1,536 have been mapped in silico onto the maize
genome, excluding the ones with unknown locations and
multiple hits to the genome.
Only 1,150 polymorphic SNPs with good quality
and less than 20% missing data were used for final
data analysis. A total of 1,116 from 1,150 SNPs were
mapped in silico onto the maize genome. The relative
distance for each SNP was summed and SNPs
developed from the same genes were assigned to a
uni-locus. A total of 701 uni-loci were identified and
466 SNPs were found unlinked to other SNPs.
Remaining SNPs formed the linked groups of two
or more SNPs from contiguous DNA sequences,
which constituted 235 loci. SNPs from the same locus
were grouped into haplotypes that were recorded as
alleles; in this way, each locus could have multiple
alleles, increasing the information content of the
markers. If the genotype of any SNP at a locus was
missing in a sample, the locus was regarded as
missing an allele in that sample (Yan et al. 2009).
Data analysis
Summary statistics for genetic diversity were calcu-
lated for each generation of the accessions using the
software PowerMarker V3.25 (Liu and Muse 2005).
The parameters included average number of alleles
per locus, observed heterozygosity, gene diversity
(expected heterozygosity), number of heterozygous
loci, polymorphic information content (PIC) and pair-
wise F-statistics. Gene diversity was calculated at each
locus as 2n (1 -P
pu2)/(2n - 1 - f), where n is the
sample size, pu is the frequency of the uth allele, and f is
the inbreeding coefficient estimated from genotype
frequencies (Weir 1996). PIC was used to refer to the
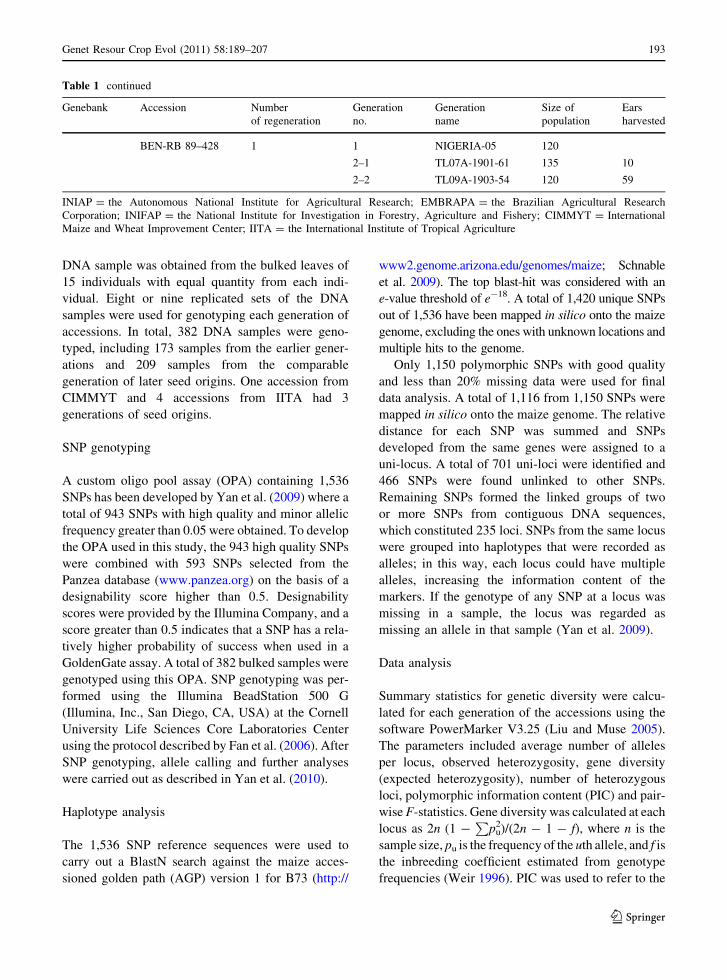
Table 1 continued
Genebank Accession Number
of regeneration
Generation
no.
Generation
name
Size of
population
Ears
harvested
BEN-RB 89–428 1 1 NIGERIA-05 120
2–1 TL07A-1901-61 135 10
2–2 TL09A-1903-54 120 59
INIAP = the Autonomous National Institute for Agricultural Research; EMBRAPA = the Brazilian Agricultural Research
Corporation; INIFAP = the National Institute for Investigation in Forestry, Agriculture and Fishery; CIMMYT = International
Maize and Wheat Improvement Center; IITA = the International Institute of Tropical Agriculture
Genet Resour Crop Evol (2011) 58:189–207 193
123
relative value of each marker with respect to the
amount of polymorphism exhibited, as described by
Botstein et al. (1980). F-statistics developed by Wright
(1965) are a very useful measure of population
subdivision, of which Fst describes the amount of
inbreeding-like effects within subpopulations.
Allelic frequencies at each SNP locus were calcu-
lated and compared between the comparable genera-
tions of the seed origins by year in the same accession.
The probability of allelic frequency change of indi-
vidual loci after regeneration was detected using
Fisher’s exact test (Mehta et al. 1984). The null
hypothesis was rejected at P B 0.05.
Genetic distances, based on allelic frequencies (Nei
1973), were calculated for pair-wise comparisons
between generations using PowerMarker V3.25 to
detect how far they had diverged from each other. We
constructed the dendrogram using the unweighted pair-
group method with arithmetic averages (UPGMA)
(Sneath and Sokal 1973).
Results
Performance and characterization of SNPs
In our OPA, 1,303 SNPs were successfully called in
382 samples with reliable scores and less than 20%
missing data, including 153 monomorphic SNPs across
all seed accessions. A total of 1,150 polymorphic SNPs
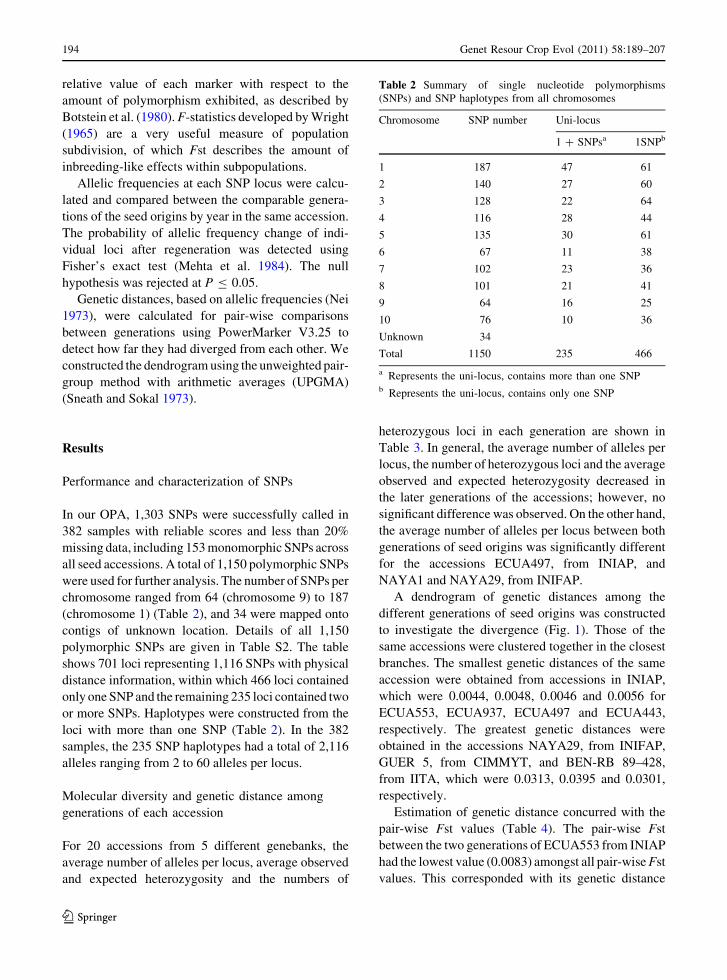
were used for further analysis. The number of SNPs per
chromosome ranged from 64 (chromosome 9) to 187
(chromosome 1) (Table 2), and 34 were mapped onto
contigs of unknown location. Details of all 1,150
polymorphic SNPs are given in Table S2. The table
shows 701 loci representing 1,116 SNPs with physical
distance information, within which 466 loci contained
only one SNP and the remaining 235 loci contained two
or more SNPs. Haplotypes were constructed from the
loci with more than one SNP (Table 2). In the 382
samples, the 235 SNP haplotypes had a total of 2,116
alleles ranging from 2 to 60 alleles per locus.
Molecular diversity and genetic distance among
generations of each accession
For 20 accessions from 5 different genebanks, the
average number of alleles per locus, average observed
and expected heterozygosity and the numbers of
heterozygous loci in each generation are shown in
Table 3. In general, the average number of alleles per
locus, the number of heterozygous loci and the average
observed and expected heterozygosity decreased in
the later generations of the accessions; however, no
significant difference was observed. On the other hand,
the average number of alleles per locus between both
generations of seed origins was significantly different
for the accessions ECUA497, from INIAP, and
NAYA1 and NAYA29, from INIFAP.
A dendrogram of genetic distances among the
different generations of seed origins was constructed
to investigate the divergence (Fig. 1). Those of the
same accessions were clustered together in the closest
branches. The smallest genetic distances of the same
accession were obtained from accessions in INIAP,
which were 0.0044, 0.0048, 0.0046 and 0.0056 for
ECUA553, ECUA937, ECUA497 and ECUA443,
respectively. The greatest genetic distances were
obtained in the accessions NAYA29, from INIFAP,
GUER 5, from CIMMYT, and BEN-RB 89–428,
from IITA, which were 0.0313, 0.0395 and 0.0301,
respectively.
Estimation of genetic distance concurred with the
pair-wise Fst values (Table 4). The pair-wise Fst
between the two generations of ECUA553 from INIAP
had the lowest value (0.0083) amongst all pair-wise Fst
values. This corresponded with its genetic distance
Table 2 Summary of single nucleotide polymorphisms
(SNPs) and SNP haplotypes from all chromosomes
Chromosome SNP number Uni-locus
1 ? SNPsa 1SNPb
1 187 47 61
2 140 27 60
3 128 22 64
4 116 28 44
5 135 30 61
6 67 11 38
7 102 23 36
8 101 21 41
9 64 16 25
10 76 10 36
Unknown 34
Total 1150 235 466
a Represents the uni-locus, contains more than one SNPb Represents the uni-locus, contains only one SNP
194 Genet Resour Crop Evol (2011) 58:189–207
123
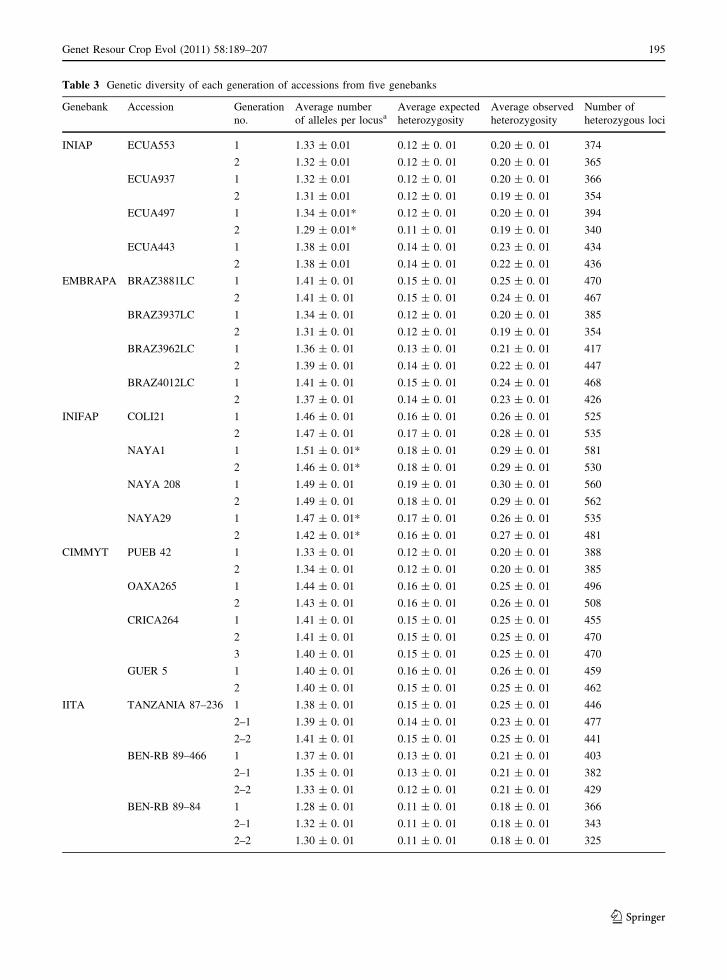
Table 3 Genetic diversity of each generation of accessions from five genebanks
Genebank Accession Generation
no.
Average number
of alleles per locusaAverage expected
heterozygosity
Average observed
heterozygosity
Number of
heterozygous loci
INIAP ECUA553 1 1.33 ± 0.01 0.12 ± 0. 01 0.20 ± 0. 01 374
2 1.32 ± 0.01 0.12 ± 0. 01 0.20 ± 0. 01 365
ECUA937 1 1.32 ± 0.01 0.12 ± 0. 01 0.20 ± 0. 01 366
2 1.31 ± 0.01 0.12 ± 0. 01 0.19 ± 0. 01 354
ECUA497 1 1.34 ± 0.01* 0.12 ± 0. 01 0.20 ± 0. 01 394
2 1.29 ± 0.01* 0.11 ± 0. 01 0.19 ± 0. 01 340
ECUA443 1 1.38 ± 0.01 0.14 ± 0. 01 0.23 ± 0. 01 434
2 1.38 ± 0.01 0.14 ± 0. 01 0.22 ± 0. 01 436
EMBRAPA BRAZ3881LC 1 1.41 ± 0. 01 0.15 ± 0. 01 0.25 ± 0. 01 470
2 1.41 ± 0. 01 0.15 ± 0. 01 0.24 ± 0. 01 467
BRAZ3937LC 1 1.34 ± 0. 01 0.12 ± 0. 01 0.20 ± 0. 01 385
2 1.31 ± 0. 01 0.12 ± 0. 01 0.19 ± 0. 01 354
BRAZ3962LC 1 1.36 ± 0. 01 0.13 ± 0. 01 0.21 ± 0. 01 417
2 1.39 ± 0. 01 0.14 ± 0. 01 0.22 ± 0. 01 447
BRAZ4012LC 1 1.41 ± 0. 01 0.15 ± 0. 01 0.24 ± 0. 01 468
2 1.37 ± 0. 01 0.14 ± 0. 01 0.23 ± 0. 01 426
INIFAP COLI21 1 1.46 ± 0. 01 0.16 ± 0. 01 0.26 ± 0. 01 525
2 1.47 ± 0. 01 0.17 ± 0. 01 0.28 ± 0. 01 535
NAYA1 1 1.51 ± 0. 01* 0.18 ± 0. 01 0.29 ± 0. 01 581
2 1.46 ± 0. 01* 0.18 ± 0. 01 0.29 ± 0. 01 530
NAYA 208 1 1.49 ± 0. 01 0.19 ± 0. 01 0.30 ± 0. 01 560
2 1.49 ± 0. 01 0.18 ± 0. 01 0.29 ± 0. 01 562
NAYA29 1 1.47 ± 0. 01* 0.17 ± 0. 01 0.26 ± 0. 01 535
2 1.42 ± 0. 01* 0.16 ± 0. 01 0.27 ± 0. 01 481
CIMMYT PUEB 42 1 1.33 ± 0. 01 0.12 ± 0. 01 0.20 ± 0. 01 388
2 1.34 ± 0. 01 0.12 ± 0. 01 0.20 ± 0. 01 385
OAXA265 1 1.44 ± 0. 01 0.16 ± 0. 01 0.25 ± 0. 01 496
2 1.43 ± 0. 01 0.16 ± 0. 01 0.26 ± 0. 01 508
CRICA264 1 1.41 ± 0. 01 0.15 ± 0. 01 0.25 ± 0. 01 455
2 1.41 ± 0. 01 0.15 ± 0. 01 0.25 ± 0. 01 470
3 1.40 ± 0. 01 0.15 ± 0. 01 0.25 ± 0. 01 470
GUER 5 1 1.40 ± 0. 01 0.16 ± 0. 01 0.26 ± 0. 01 459
2 1.40 ± 0. 01 0.15 ± 0. 01 0.25 ± 0. 01 462
IITA TANZANIA 87–236 1 1.38 ± 0. 01 0.15 ± 0. 01 0.25 ± 0. 01 446
2–1 1.39 ± 0. 01 0.14 ± 0. 01 0.23 ± 0. 01 477
2–2 1.41 ± 0. 01 0.15 ± 0. 01 0.25 ± 0. 01 441
BEN-RB 89–466 1 1.37 ± 0. 01 0.13 ± 0. 01 0.21 ± 0. 01 403
2–1 1.35 ± 0. 01 0.13 ± 0. 01 0.21 ± 0. 01 382
2–2 1.33 ± 0. 01 0.12 ± 0. 01 0.21 ± 0. 01 429
BEN-RB 89–84 1 1.28 ± 0. 01 0.11 ± 0. 01 0.18 ± 0. 01 366
2–1 1.32 ± 0. 01 0.11 ± 0. 01 0.18 ± 0. 01 343
2–2 1.30 ± 0. 01 0.11 ± 0. 01 0.18 ± 0. 01 325
Genet Resour Crop Evol (2011) 58:189–207 195
123
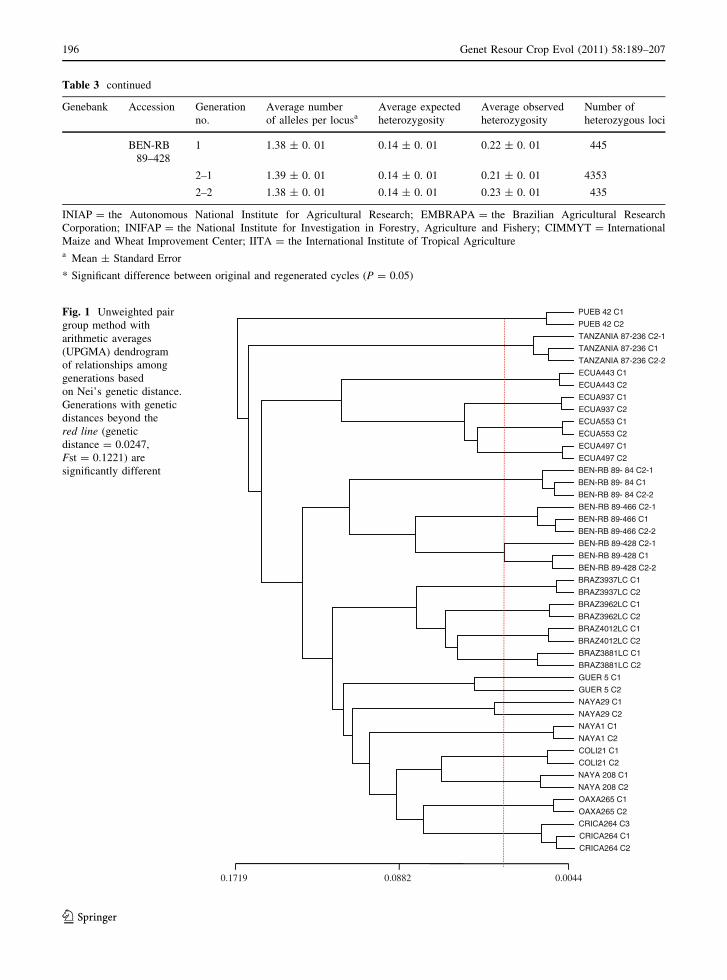
Table 3 continued
Genebank Accession Generation
no.
Average number
of alleles per locusaAverage expected
heterozygosity
Average observed
heterozygosity
Number of
heterozygous loci
BEN-RB
89–428
1 1.38 ± 0. 01 0.14 ± 0. 01 0.22 ± 0. 01 445
2–1 1.39 ± 0. 01 0.14 ± 0. 01 0.21 ± 0. 01 4353
2–2 1.38 ± 0. 01 0.14 ± 0. 01 0.23 ± 0. 01 435
INIAP = the Autonomous National Institute for Agricultural Research; EMBRAPA = the Brazilian Agricultural Research
Corporation; INIFAP = the National Institute for Investigation in Forestry, Agriculture and Fishery; CIMMYT = International
Maize and Wheat Improvement Center; IITA = the International Institute of Tropical Agriculturea Mean ± Standard Error
* Significant difference between original and regenerated cycles (P = 0.05)
PUEB 42 C1
PUEB 42 C2
TANZANIA 87-236 C2-1
TANZANIA 87-236 C1
TANZANIA 87-236 C2-2
ECUA443 C1
ECUA443 C2
ECUA937 C1
ECUA937 C2
ECUA553 C1
ECUA553 C2
ECUA497 C1
ECUA497 C2
BEN-RB 89- 84 C2-1
BEN-RB 89- 84 C1
BEN-RB 89- 84 C2-2
BEN-RB 89-466 C2-1
BEN-RB 89-466 C1
BEN-RB 89-466 C2-2
BEN-RB 89-428 C2-1
BEN-RB 89-428 C1
BEN-RB 89-428 C2-2
BRAZ3937LC C1
BRAZ3937LC C2
BRAZ3962LC C1
BRAZ3962LC C2
BRAZ4012LC C1
BRAZ4012LC C2
BRAZ3881LC C1
BRAZ3881LC C2
GUER 5 C1
GUER 5 C2
NAYA29 C1
NAYA29 C2
NAYA1 C1
NAYA1 C2
COLI21 C1
COLI21 C2
NAYA 208 C1
NAYA 208 C2
OAXA265 C1
OAXA265 C2
CRICA264 C3
CRICA264 C1
CRICA264 C2
0.1719 0.0882 0.0044
Fig. 1 Unweighted pair
group method with
arithmetic averages
(UPGMA) dendrogram
of relationships among
generations based
on Nei’s genetic distance.
Generations with genetic
distances beyond the
red line (genetic
distance = 0.0247,
Fst = 0.1221) are
significantly different
196 Genet Resour Crop Evol (2011) 58:189–207
123
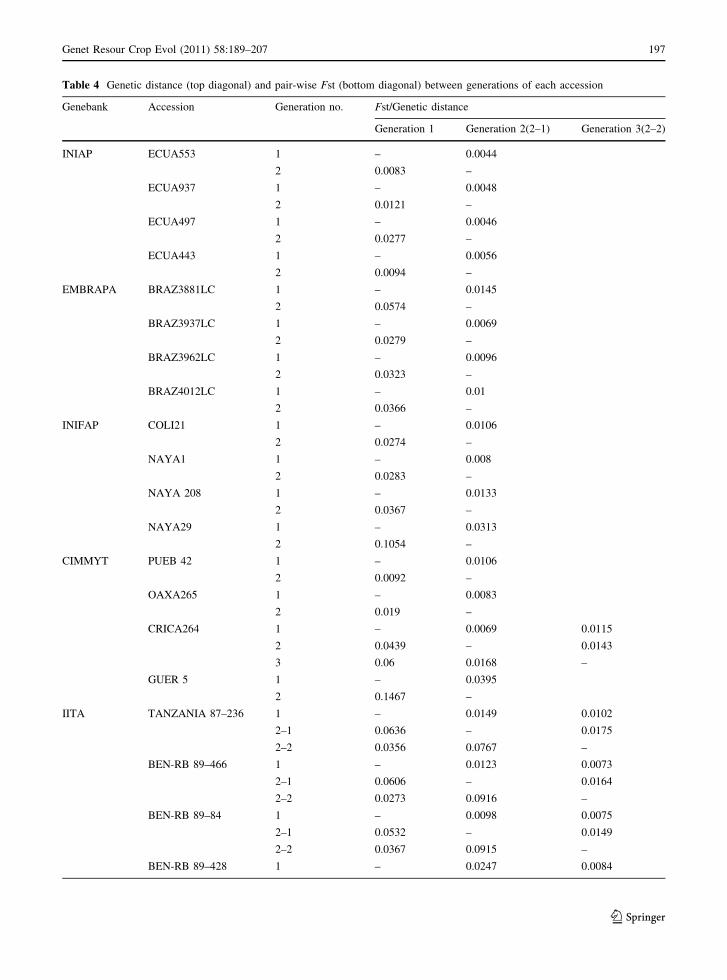
Table 4 Genetic distance (top diagonal) and pair-wise Fst (bottom diagonal) between generations of each accession
Genebank Accession Generation no. Fst/Genetic distance
Generation 1 Generation 2(2–1) Generation 3(2–2)
INIAP ECUA553 1 – 0.0044
2 0.0083 –
ECUA937 1 – 0.0048
2 0.0121 –
ECUA497 1 – 0.0046
2 0.0277 –
ECUA443 1 – 0.0056
2 0.0094 –
EMBRAPA BRAZ3881LC 1 – 0.0145
2 0.0574 –
BRAZ3937LC 1 – 0.0069
2 0.0279 –
BRAZ3962LC 1 – 0.0096
2 0.0323 –
BRAZ4012LC 1 – 0.01
2 0.0366 –
INIFAP COLI21 1 – 0.0106
2 0.0274 –
NAYA1 1 – 0.008
2 0.0283 –
NAYA 208 1 – 0.0133
2 0.0367 –
NAYA29 1 – 0.0313
2 0.1054 –
CIMMYT PUEB 42 1 – 0.0106
2 0.0092 –
OAXA265 1 – 0.0083
2 0.019 –
CRICA264 1 – 0.0069 0.0115
2 0.0439 – 0.0143
3 0.06 0.0168 –
GUER 5 1 – 0.0395
2 0.1467 –
IITA TANZANIA 87–236 1 – 0.0149 0.0102
2–1 0.0636 – 0.0175
2–2 0.0356 0.0767 –
BEN-RB 89–466 1 – 0.0123 0.0073
2–1 0.0606 – 0.0164
2–2 0.0273 0.0916 –
BEN-RB 89–84 1 – 0.0098 0.0075
2–1 0.0532 – 0.0149
2–2 0.0367 0.0915 –
BEN-RB 89–428 1 – 0.0247 0.0084
Genet Resour Crop Evol (2011) 58:189–207 197
123
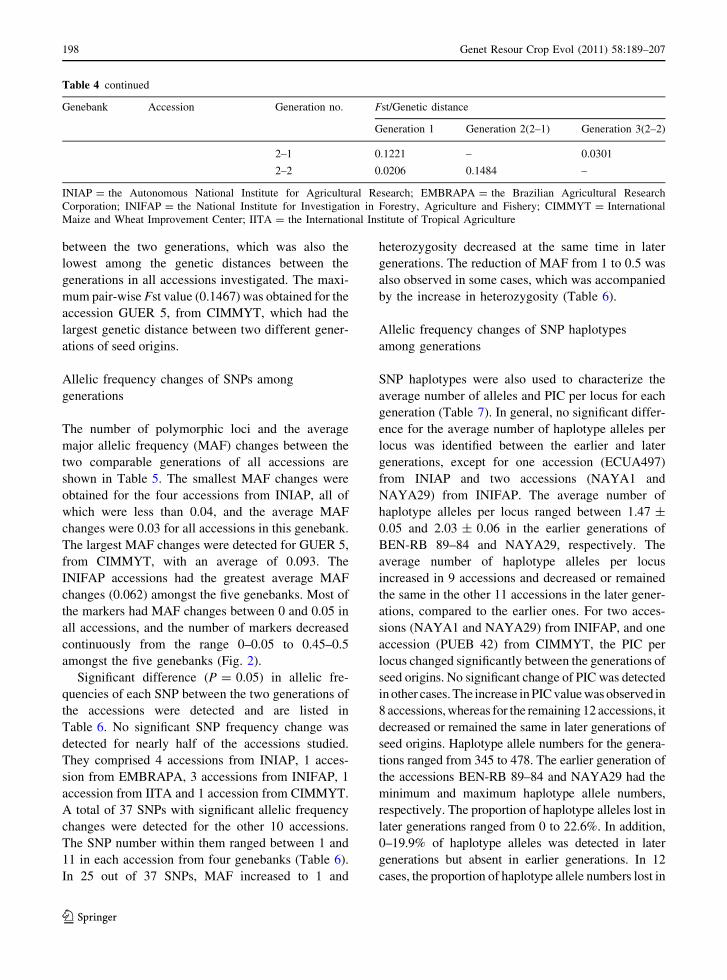
between the two generations, which was also the
lowest among the genetic distances between the
generations in all accessions investigated. The maxi-
mum pair-wise Fst value (0.1467) was obtained for the
accession GUER 5, from CIMMYT, which had the
largest genetic distance between two different gener-
ations of seed origins.
Allelic frequency changes of SNPs among
generations
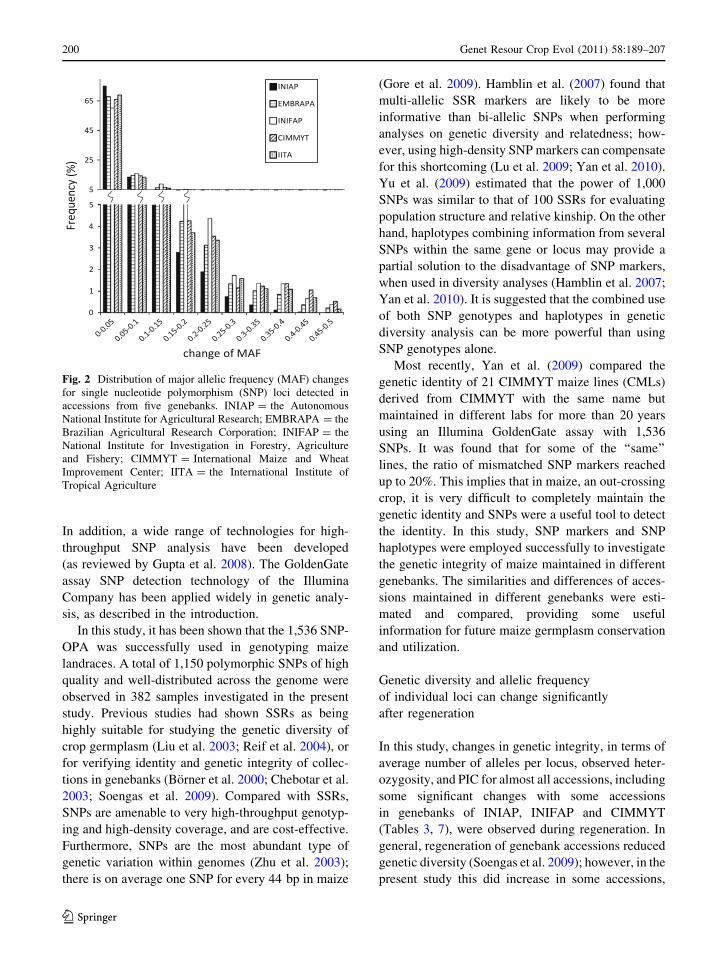
The number of polymorphic loci and the average
major allelic frequency (MAF) changes between the
two comparable generations of all accessions are
shown in Table 5. The smallest MAF changes were
obtained for the four accessions from INIAP, all of
which were less than 0.04, and the average MAF
changes were 0.03 for all accessions in this genebank.
The largest MAF changes were detected for GUER 5,
from CIMMYT, with an average of 0.093. The
INIFAP accessions had the greatest average MAF
changes (0.062) amongst the five genebanks. Most of
the markers had MAF changes between 0 and 0.05 in
all accessions, and the number of markers decreased
continuously from the range 0–0.05 to 0.45–0.5
amongst the five genebanks (Fig. 2).
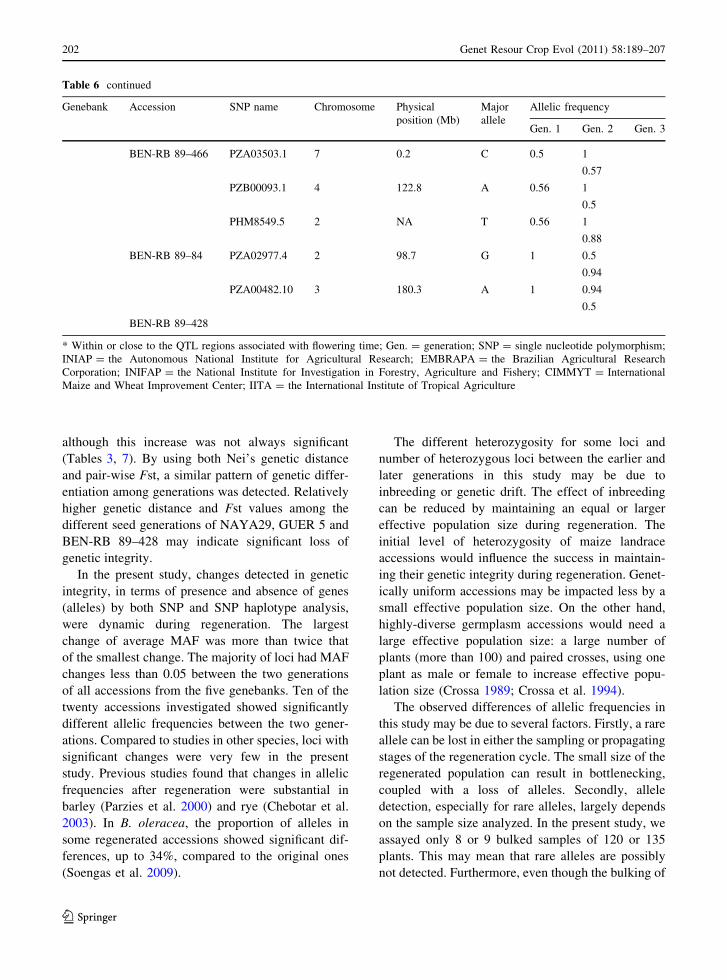
Significant difference (P = 0.05) in allelic fre-
quencies of each SNP between the two generations of
the accessions were detected and are listed in
Table 6. No significant SNP frequency change was
detected for nearly half of the accessions studied.
They comprised 4 accessions from INIAP, 1 acces-
sion from EMBRAPA, 3 accessions from INIFAP, 1
accession from IITA and 1 accession from CIMMYT.
A total of 37 SNPs with significant allelic frequency
changes were detected for the other 10 accessions.
The SNP number within them ranged between 1 and
11 in each accession from four genebanks (Table 6).
In 25 out of 37 SNPs, MAF increased to 1 and
heterozygosity decreased at the same time in later
generations. The reduction of MAF from 1 to 0.5 was
also observed in some cases, which was accompanied
by the increase in heterozygosity (Table 6).
Allelic frequency changes of SNP haplotypes
among generations
SNP haplotypes were also used to characterize the
average number of alleles and PIC per locus for each
generation (Table 7). In general, no significant differ-
ence for the average number of haplotype alleles per
locus was identified between the earlier and later
generations, except for one accession (ECUA497)
from INIAP and two accessions (NAYA1 and
NAYA29) from INIFAP. The average number of
haplotype alleles per locus ranged between 1.47 ±
0.05 and 2.03 ± 0.06 in the earlier generations of
BEN-RB 89–84 and NAYA29, respectively. The
average number of haplotype alleles per locus
increased in 9 accessions and decreased or remained
the same in the other 11 accessions in the later gener-
ations, compared to the earlier ones. For two acces-
sions (NAYA1 and NAYA29) from INIFAP, and one
accession (PUEB 42) from CIMMYT, the PIC per
locus changed significantly between the generations of
seed origins. No significant change of PIC was detected
in other cases. The increase in PIC value was observed in
8 accessions, whereas for the remaining 12 accessions, it
decreased or remained the same in later generations of
seed origins. Haplotype allele numbers for the genera-
tions ranged from 345 to 478. The earlier generation of
the accessions BEN-RB 89–84 and NAYA29 had the
minimum and maximum haplotype allele numbers,
respectively. The proportion of haplotype alleles lost in
later generations ranged from 0 to 22.6%. In addition,
0–19.9% of haplotype alleles was detected in later
generations but absent in earlier generations. In 12
cases, the proportion of haplotype allele numbers lost in
Table 4 continued
Genebank Accession Generation no. Fst/Genetic distance
Generation 1 Generation 2(2–1) Generation 3(2–2)
2–1 0.1221 – 0.0301
2–2 0.0206 0.1484 –
INIAP = the Autonomous National Institute for Agricultural Research; EMBRAPA = the Brazilian Agricultural Research
Corporation; INIFAP = the National Institute for Investigation in Forestry, Agriculture and Fishery; CIMMYT = International
Maize and Wheat Improvement Center; IITA = the International Institute of Tropical Agriculture
198 Genet Resour Crop Evol (2011) 58:189–207
123
later generations was more than those that increased. On
the contrary, it was observed that in 11 cases haplotype
allele numbers increased in later generations which was
more than those that lost haplotype allele numbers. The
only accession that did not change its haplotype allele
number of each locus was ECUA443 from INIAP
(Table 7).
Discussion
SNP markers can be used to detect the genetic
integrity of maize accessions
A large number of SNP markers are available for
many plant species for genome-wide fingerprinting.
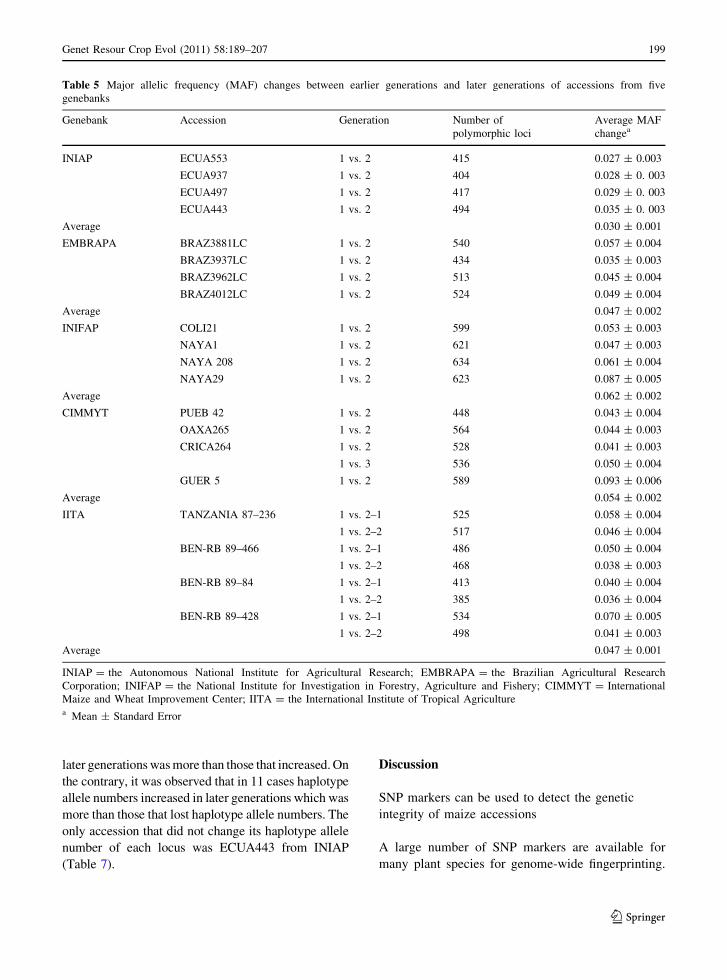
Table 5 Major allelic frequency (MAF) changes between earlier generations and later generations of accessions from five
genebanks
Genebank Accession Generation Number of
polymorphic loci
Average MAF
changea
INIAP ECUA553 1 vs. 2 415 0.027 ± 0.003
ECUA937 1 vs. 2 404 0.028 ± 0. 003
ECUA497 1 vs. 2 417 0.029 ± 0. 003
ECUA443 1 vs. 2 494 0.035 ± 0. 003
Average 0.030 ± 0.001
EMBRAPA BRAZ3881LC 1 vs. 2 540 0.057 ± 0.004
BRAZ3937LC 1 vs. 2 434 0.035 ± 0.003
BRAZ3962LC 1 vs. 2 513 0.045 ± 0.004
BRAZ4012LC 1 vs. 2 524 0.049 ± 0.004
Average 0.047 ± 0.002
INIFAP COLI21 1 vs. 2 599 0.053 ± 0.003
NAYA1 1 vs. 2 621 0.047 ± 0.003
NAYA 208 1 vs. 2 634 0.061 ± 0.004
NAYA29 1 vs. 2 623 0.087 ± 0.005
Average 0.062 ± 0.002
CIMMYT PUEB 42 1 vs. 2 448 0.043 ± 0.004
OAXA265 1 vs. 2 564 0.044 ± 0.003
CRICA264 1 vs. 2 528 0.041 ± 0.003
1 vs. 3 536 0.050 ± 0.004
GUER 5 1 vs. 2 589 0.093 ± 0.006
Average 0.054 ± 0.002
IITA TANZANIA 87–236 1 vs. 2–1 525 0.058 ± 0.004
1 vs. 2–2 517 0.046 ± 0.004
BEN-RB 89–466 1 vs. 2–1 486 0.050 ± 0.004
1 vs. 2–2 468 0.038 ± 0.003
BEN-RB 89–84 1 vs. 2–1 413 0.040 ± 0.004
1 vs. 2–2 385 0.036 ± 0.004
BEN-RB 89–428 1 vs. 2–1 534 0.070 ± 0.005
1 vs. 2–2 498 0.041 ± 0.003
Average 0.047 ± 0.001
INIAP = the Autonomous National Institute for Agricultural Research; EMBRAPA = the Brazilian Agricultural Research
Corporation; INIFAP = the National Institute for Investigation in Forestry, Agriculture and Fishery; CIMMYT = International
Maize and Wheat Improvement Center; IITA = the International Institute of Tropical Agriculturea Mean ± Standard Error
Genet Resour Crop Evol (2011) 58:189–207 199
123
In addition, a wide range of technologies for high-
throughput SNP analysis have been developed
(as reviewed by Gupta et al. 2008). The GoldenGate
assay SNP detection technology of the Illumina
Company has been applied widely in genetic analy-
sis, as described in the introduction.
In this study, it has been shown that the 1,536 SNP-
OPA was successfully used in genotyping maize
landraces. A total of 1,150 polymorphic SNPs of high
quality and well-distributed across the genome were
observed in 382 samples investigated in the present
study. Previous studies had shown SSRs as being
highly suitable for studying the genetic diversity of
crop germplasm (Liu et al. 2003; Reif et al. 2004), or
for verifying identity and genetic integrity of collec-
tions in genebanks (Borner et al. 2000; Chebotar et al.
2003; Soengas et al. 2009). Compared with SSRs,
SNPs are amenable to very high-throughput genotyp-
ing and high-density coverage, and are cost-effective.
Furthermore, SNPs are the most abundant type of
genetic variation within genomes (Zhu et al. 2003);
there is on average one SNP for every 44 bp in maize
(Gore et al. 2009). Hamblin et al. (2007) found that
multi-allelic SSR markers are likely to be more
informative than bi-allelic SNPs when performing
analyses on genetic diversity and relatedness; how-
ever, using high-density SNP markers can compensate
for this shortcoming (Lu et al. 2009; Yan et al. 2010).
Yu et al. (2009) estimated that the power of 1,000
SNPs was similar to that of 100 SSRs for evaluating
population structure and relative kinship. On the other
hand, haplotypes combining information from several
SNPs within the same gene or locus may provide a
partial solution to the disadvantage of SNP markers,
when used in diversity analyses (Hamblin et al. 2007;
Yan et al. 2010). It is suggested that the combined use
of both SNP genotypes and haplotypes in genetic
diversity analysis can be more powerful than using
SNP genotypes alone.
Most recently, Yan et al. (2009) compared the
genetic identity of 21 CIMMYT maize lines (CMLs)
derived from CIMMYT with the same name but
maintained in different labs for more than 20 years
using an Illumina GoldenGate assay with 1,536
SNPs. It was found that for some of the ‘‘same’’
lines, the ratio of mismatched SNP markers reached
up to 20%. This implies that in maize, an out-crossing
crop, it is very difficult to completely maintain the
genetic identity and SNPs were a useful tool to detect
the identity. In this study, SNP markers and SNP
haplotypes were employed successfully to investigate
the genetic integrity of maize maintained in different
genebanks. The similarities and differences of acces-
sions maintained in different genebanks were esti-
mated and compared, providing some useful
information for future maize germplasm conservation
and utilization.
Genetic diversity and allelic frequency
of individual loci can change significantly
after regeneration
In this study, changes in genetic integrity, in terms of
average number of alleles per locus, observed heter-
ozygosity, and PIC for almost all accessions, including
some significant changes with some accessions
in genebanks of INIAP, INIFAP and CIMMYT
(Tables 3, 7), were observed during regeneration. In
general, regeneration of genebank accessions reduced
genetic diversity (Soengas et al. 2009); however, in the
present study this did increase in some accessions,
Fig. 2 Distribution of major allelic frequency (MAF) changes
for single nucleotide polymorphism (SNP) loci detected in
accessions from five genebanks. INIAP = the Autonomous
National Institute for Agricultural Research; EMBRAPA = the
Brazilian Agricultural Research Corporation; INIFAP = the
National Institute for Investigation in Forestry, Agriculture
and Fishery; CIMMYT = International Maize and Wheat
Improvement Center; IITA = the International Institute of
Tropical Agriculture
200 Genet Resour Crop Evol (2011) 58:189–207
123
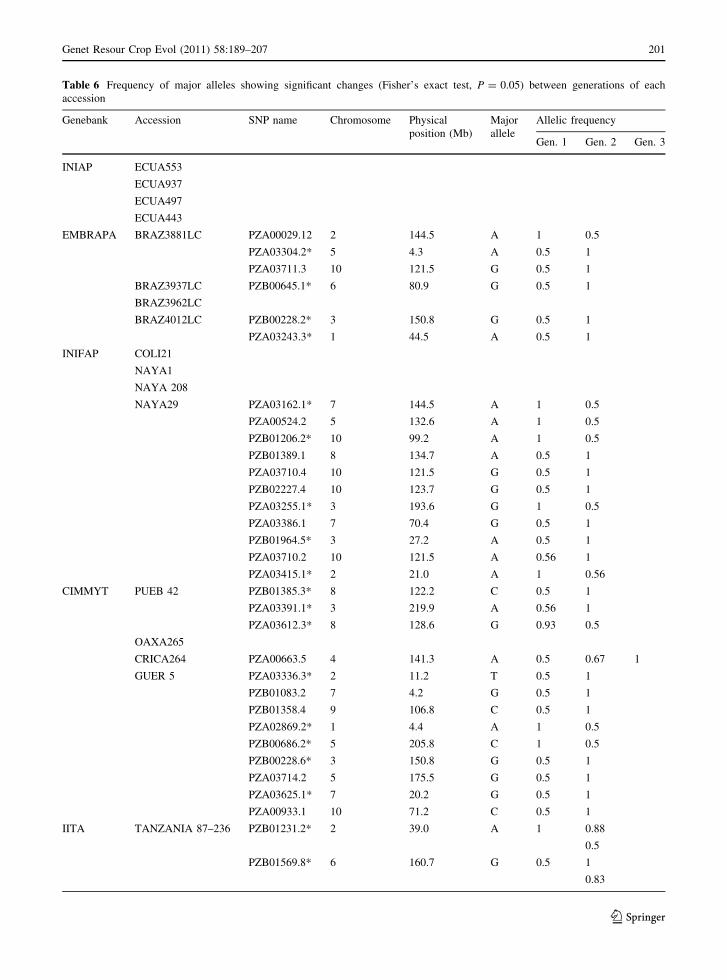
Table 6 Frequency of major alleles showing significant changes (Fisher’s exact test, P = 0.05) between generations of each
accession
Genebank Accession SNP name Chromosome Physical
position (Mb)
Major
allele
Allelic frequency
Gen. 1 Gen. 2 Gen. 3
INIAP ECUA553
ECUA937
ECUA497
ECUA443
EMBRAPA BRAZ3881LC PZA00029.12 2 144.5 A 1 0.5
PZA03304.2* 5 4.3 A 0.5 1
PZA03711.3 10 121.5 G 0.5 1
BRAZ3937LC PZB00645.1* 6 80.9 G 0.5 1
BRAZ3962LC
BRAZ4012LC PZB00228.2* 3 150.8 G 0.5 1
PZA03243.3* 1 44.5 A 0.5 1
INIFAP COLI21
NAYA1
NAYA 208
NAYA29 PZA03162.1* 7 144.5 A 1 0.5
PZA00524.2 5 132.6 A 1 0.5
PZB01206.2* 10 99.2 A 1 0.5
PZB01389.1 8 134.7 A 0.5 1
PZA03710.4 10 121.5 G 0.5 1
PZB02227.4 10 123.7 G 0.5 1
PZA03255.1* 3 193.6 G 1 0.5
PZA03386.1 7 70.4 G 0.5 1
PZB01964.5* 3 27.2 A 0.5 1
PZA03710.2 10 121.5 A 0.56 1
PZA03415.1* 2 21.0 A 1 0.56
CIMMYT PUEB 42 PZB01385.3* 8 122.2 C 0.5 1
PZA03391.1* 3 219.9 A 0.56 1
PZA03612.3* 8 128.6 G 0.93 0.5
OAXA265
CRICA264 PZA00663.5 4 141.3 A 0.5 0.67 1
GUER 5 PZA03336.3* 2 11.2 T 0.5 1
PZB01083.2 7 4.2 G 0.5 1
PZB01358.4 9 106.8 C 0.5 1
PZA02869.2* 1 4.4 A 1 0.5
PZB00686.2* 5 205.8 C 1 0.5
PZB00228.6* 3 150.8 G 0.5 1
PZA03714.2 5 175.5 G 0.5 1
PZA03625.1* 7 20.2 G 0.5 1
PZA00933.1 10 71.2 C 0.5 1
IITA TANZANIA 87–236 PZB01231.2* 2 39.0 A 1 0.88
0.5
PZB01569.8* 6 160.7 G 0.5 1
0.83
Genet Resour Crop Evol (2011) 58:189–207 201
123
although this increase was not always significant
(Tables 3, 7). By using both Nei’s genetic distance
and pair-wise Fst, a similar pattern of genetic differ-
entiation among generations was detected. Relatively
higher genetic distance and Fst values among the
different seed generations of NAYA29, GUER 5 and
BEN-RB 89–428 may indicate significant loss of
genetic integrity.
In the present study, changes detected in genetic
integrity, in terms of presence and absence of genes
(alleles) by both SNP and SNP haplotype analysis,
were dynamic during regeneration. The largest
change of average MAF was more than twice that
of the smallest change. The majority of loci had MAF
changes less than 0.05 between the two generations
of all accessions from the five genebanks. Ten of the
twenty accessions investigated showed significantly
different allelic frequencies between the two gener-
ations. Compared to studies in other species, loci with
significant changes were very few in the present
study. Previous studies found that changes in allelic
frequencies after regeneration were substantial in
barley (Parzies et al. 2000) and rye (Chebotar et al.
2003). In B. oleracea, the proportion of alleles in
some regenerated accessions showed significant dif-
ferences, up to 34%, compared to the original ones
(Soengas et al. 2009).
The different heterozygosity for some loci and
number of heterozygous loci between the earlier and
later generations in this study may be due to
inbreeding or genetic drift. The effect of inbreeding
can be reduced by maintaining an equal or larger
effective population size during regeneration. The
initial level of heterozygosity of maize landrace
accessions would influence the success in maintain-
ing their genetic integrity during regeneration. Genet-
ically uniform accessions may be impacted less by a
small effective population size. On the other hand,
highly-diverse germplasm accessions would need a
large effective population size: a large number of
plants (more than 100) and paired crosses, using one
plant as male or female to increase effective popu-
lation size (Crossa 1989; Crossa et al. 1994).
The observed differences of allelic frequencies in
this study may be due to several factors. Firstly, a rare
allele can be lost in either the sampling or propagating
stages of the regeneration cycle. The small size of the
regenerated population can result in bottlenecking,
coupled with a loss of alleles. Secondly, allele
detection, especially for rare alleles, largely depends
on the sample size analyzed. In the present study, we
assayed only 8 or 9 bulked samples of 120 or 135
plants. This may mean that rare alleles are possibly
not detected. Furthermore, even though the bulking of
Table 6 continued
Genebank Accession SNP name Chromosome Physical
position (Mb)
Major
allele
Allelic frequency
Gen. 1 Gen. 2 Gen. 3
BEN-RB 89–466 PZA03503.1 7 0.2 C 0.5 1
0.57
PZB00093.1 4 122.8 A 0.56 1
0.5
PHM8549.5 2 NA T 0.56 1
0.88
BEN-RB 89–84 PZA02977.4 2 98.7 G 1 0.5
0.94
PZA00482.10 3 180.3 A 1 0.94
0.5
BEN-RB 89–428
* Within or close to the QTL regions associated with flowering time; Gen. = generation; SNP = single nucleotide polymorphism;
INIAP = the Autonomous National Institute for Agricultural Research; EMBRAPA = the Brazilian Agricultural Research
Corporation; INIFAP = the National Institute for Investigation in Forestry, Agriculture and Fishery; CIMMYT = International
Maize and Wheat Improvement Center; IITA = the International Institute of Tropical Agriculture
202 Genet Resour Crop Evol (2011) 58:189–207
123
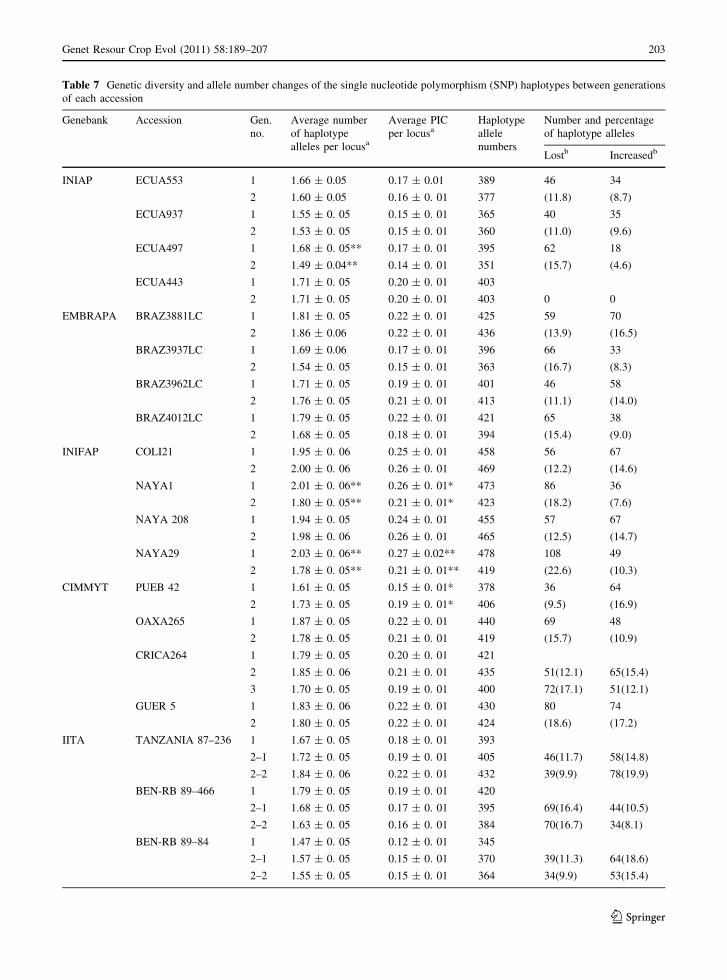
Table 7 Genetic diversity and allele number changes of the single nucleotide polymorphism (SNP) haplotypes between generations
of each accession
Genebank Accession Gen.
no.
Average number
of haplotype
alleles per locusa
Average PIC
per locusaHaplotype
allele
numbers
Number and percentage
of haplotype alleles
Lostb Increasedb
INIAP ECUA553 1 1.66 ± 0.05 0.17 ± 0.01 389 46 34
2 1.60 ± 0.05 0.16 ± 0. 01 377 (11.8) (8.7)
ECUA937 1 1.55 ± 0. 05 0.15 ± 0. 01 365 40 35
2 1.53 ± 0. 05 0.15 ± 0. 01 360 (11.0) (9.6)
ECUA497 1 1.68 ± 0. 05** 0.17 ± 0. 01 395 62 18
2 1.49 ± 0.04** 0.14 ± 0. 01 351 (15.7) (4.6)
ECUA443 1 1.71 ± 0. 05 0.20 ± 0. 01 403
2 1.71 ± 0. 05 0.20 ± 0. 01 403 0 0
EMBRAPA BRAZ3881LC 1 1.81 ± 0. 05 0.22 ± 0. 01 425 59 70
2 1.86 ± 0.06 0.22 ± 0. 01 436 (13.9) (16.5)
BRAZ3937LC 1 1.69 ± 0.06 0.17 ± 0. 01 396 66 33
2 1.54 ± 0. 05 0.15 ± 0. 01 363 (16.7) (8.3)
BRAZ3962LC 1 1.71 ± 0. 05 0.19 ± 0. 01 401 46 58
2 1.76 ± 0. 05 0.21 ± 0. 01 413 (11.1) (14.0)
BRAZ4012LC 1 1.79 ± 0. 05 0.22 ± 0. 01 421 65 38
2 1.68 ± 0. 05 0.18 ± 0. 01 394 (15.4) (9.0)
INIFAP COLI21 1 1.95 ± 0. 06 0.25 ± 0. 01 458 56 67
2 2.00 ± 0. 06 0.26 ± 0. 01 469 (12.2) (14.6)
NAYA1 1 2.01 ± 0. 06** 0.26 ± 0. 01* 473 86 36
2 1.80 ± 0. 05** 0.21 ± 0. 01* 423 (18.2) (7.6)
NAYA 208 1 1.94 ± 0. 05 0.24 ± 0. 01 455 57 67
2 1.98 ± 0. 06 0.26 ± 0. 01 465 (12.5) (14.7)
NAYA29 1 2.03 ± 0. 06** 0.27 ± 0.02** 478 108 49
2 1.78 ± 0. 05** 0.21 ± 0. 01** 419 (22.6) (10.3)
CIMMYT PUEB 42 1 1.61 ± 0. 05 0.15 ± 0. 01* 378 36 64
2 1.73 ± 0. 05 0.19 ± 0. 01* 406 (9.5) (16.9)
OAXA265 1 1.87 ± 0. 05 0.22 ± 0. 01 440 69 48
2 1.78 ± 0. 05 0.21 ± 0. 01 419 (15.7) (10.9)
CRICA264 1 1.79 ± 0. 05 0.20 ± 0. 01 421
2 1.85 ± 0. 06 0.21 ± 0. 01 435 51(12.1) 65(15.4)
3 1.70 ± 0. 05 0.19 ± 0. 01 400 72(17.1) 51(12.1)
GUER 5 1 1.83 ± 0. 06 0.22 ± 0. 01 430 80 74
2 1.80 ± 0. 05 0.22 ± 0. 01 424 (18.6) (17.2)
IITA TANZANIA 87–236 1 1.67 ± 0. 05 0.18 ± 0. 01 393
2–1 1.72 ± 0. 05 0.19 ± 0. 01 405 46(11.7) 58(14.8)
2–2 1.84 ± 0. 06 0.22 ± 0. 01 432 39(9.9) 78(19.9)
BEN-RB 89–466 1 1.79 ± 0. 05 0.19 ± 0. 01 420
2–1 1.68 ± 0. 05 0.17 ± 0. 01 395 69(16.4) 44(10.5)
2–2 1.63 ± 0. 05 0.16 ± 0. 01 384 70(16.7) 34(8.1)
BEN-RB 89–84 1 1.47 ± 0. 05 0.12 ± 0. 01 345
2–1 1.57 ± 0. 05 0.15 ± 0. 01 370 39(11.3) 64(18.6)
2–2 1.55 ± 0. 05 0.15 ± 0. 01 364 34(9.9) 53(15.4)
Genet Resour Crop Evol (2011) 58:189–207 203
123
DNA from 15 plants to make up one SNP determi-
nation is labor- and cost-effective, it requires only 1 of
the 15 plants to be heterozygous for the result to
indicate that all 15 plants are heterozygous. If all 15
plants have two types of SNP alleles, the result will be
the same as one heterozygous plant in the bulked
sample, thereby inducing deviations in the detection
of allele frequency in the population under study.
In addition, significant changes in allelic frequency
of individual loci can be caused by genetic drift, as
explained by van Hintum et al. (2007) and Soengas
et al. (2009). We found cases where frequencies of
major alleles increased to 1 and lost heterozygosity at
the same time. This indicated possible genetic drift or
directional selection on these loci at pollination that
could have been performed among the plants flow-
ering at the same time. To investigate the effect of
pollination during regeneration, we checked the loci
for significant allelic frequency changes to confirm
their relationship with functional genes or QTLs
associated with flowering time. Buckler et al. (2009)
used joint linkage analysis of a maize NAM (Nested
Association Mapping) population, which is based on
about 5,000 recombinant inbred lines (RILs) from 25
diverse inbred lines crossed with B73. Thirty-six and
39 QTLs (occupying 47 genome-wide QTL regions
using a window of 10 Mb) were identified that
explained 89% of the total variation for male
flowering and female flowering, respectively. A total
of 19 SNP loci (occupying 16 QTL regions) with
significant allelic frequency changes in our study
were found in or close to (\10 Mb, *10 cM) the 47
QTL regions associated with flowering time reported
in Buckler et al. (2009) (Table 6). More than 57%
(16/28) of the SNP loci with significant allelic
frequency changes detected in the present study were
within the flowering time QTL regions, which is
significantly greater than the ratio of random QTL
distribution in chromosomes (20%; 47/230). Further
studies are needed to identify the potential genes
causing the changes; however, present results provide
some evidence that the mating system in regeneration
may affect the maintenance of genetic integrity. The
reduction of MAF from 1 to 0.5 was also observed in
our results. This may be due to contamination with
foreign pollen and/or seed or handling errors.
Strategies for genetic resources conservation
and regeneration
The frequency of regeneration should be minimized,
as it can cause the loss of genetic integrity of an
accession. Several theoretical studies have been
carried out to provide simple, efficient sampling
schemes and optimal sample size for regeneration
and maintenance of crop species based on the
statistical model and population genetics theory
(Crossa 1989; Crossa et al. 1994; Wang et al.
2004). Regeneration proceeded well at CIMMYT.
The accessions which were poorly adapted to the
experimental facilities will require appropriate regen-
eration sites at cooperative genebanks. Artificial
pollination is the most common method for accession
regeneration and multiplication in maize genebanks.
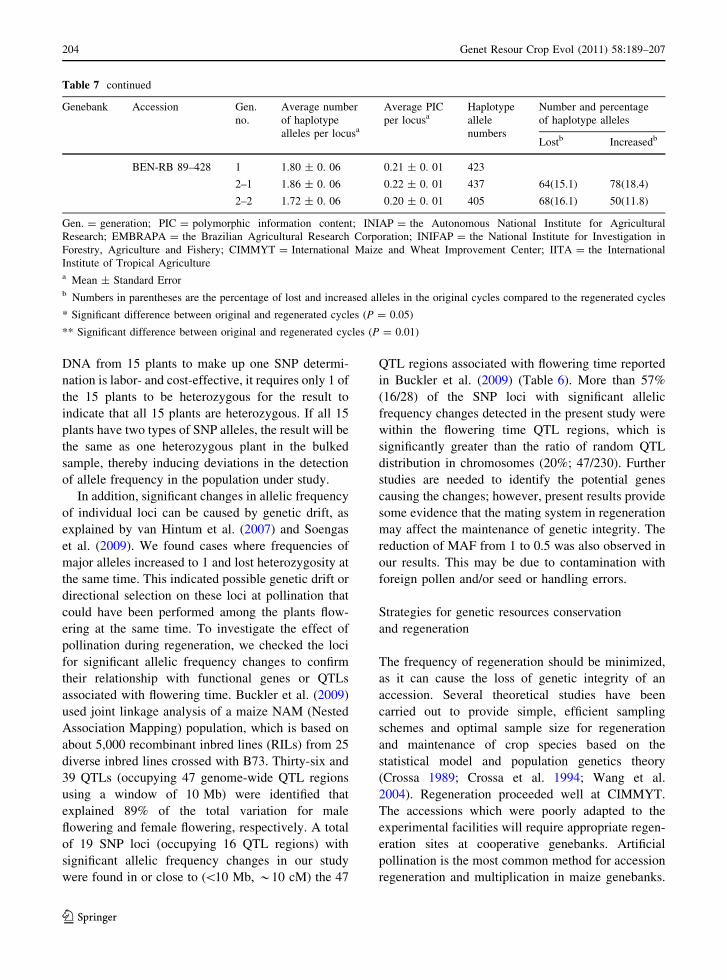
Table 7 continued
Genebank Accession Gen.
no.
Average number
of haplotype
alleles per locusa
Average PIC
per locusaHaplotype
allele
numbers
Number and percentage
of haplotype alleles
Lostb Increasedb
BEN-RB 89–428 1 1.80 ± 0. 06 0.21 ± 0. 01 423
2–1 1.86 ± 0. 06 0.22 ± 0. 01 437 64(15.1) 78(18.4)
2–2 1.72 ± 0. 06 0.20 ± 0. 01 405 68(16.1) 50(11.8)
Gen. = generation; PIC = polymorphic information content; INIAP = the Autonomous National Institute for Agricultural
Research; EMBRAPA = the Brazilian Agricultural Research Corporation; INIFAP = the National Institute for Investigation in
Forestry, Agriculture and Fishery; CIMMYT = International Maize and Wheat Improvement Center; IITA = the International
Institute of Tropical Agriculturea Mean ± Standard Errorb Numbers in parentheses are the percentage of lost and increased alleles in the original cycles compared to the regenerated cycles
* Significant difference between original and regenerated cycles (P = 0.05)
** Significant difference between original and regenerated cycles (P = 0.01)
204 Genet Resour Crop Evol (2011) 58:189–207
123
Chain crosses use a plant as female and male while
paired crosses use a plant only once as female or
male. When a large number of accessions are
regenerated, chain crosses are usually used as they
are cost effective. However, it should be noted that
the effective population size is near half that of a
paired cross (Crossa et al. 1994). To avoid genetic
drift and inbreeding, an equal and large effective
population size (at least 100 ears at harvest) through-
out generations is recommended. In recent years,
all landrace regeneration has been conducted at
CIMMYT with a goal of 100 ears by chain crosses
(half sibs). If a generation of the accession represents
fewer than 100 ears at harvest, a repeated regener-
ation is attempted for the same accession in the
following season to reach the required number. IITA
accessions were regenerated at CIMMYT repeatedly
from the same seed origins (Table 1). A suboptimum
number of ears harvested in one generation can be
combined with another repeated generation to capture
the diversity of the previous generation.
We observed significant losses of genetic diversity
in some accessions (i.e. ECUA 497, NAYA 1 and
NAYA 29) after regeneration. For these accessions,
the number of ears harvested in some generations was
less than 100, sometimes even less than 50. This may
be one of the reasons for significant changes in
genetic diversity. The population genetics theory of
sampling a practical number of ears at regeneration
(Crossa 1989; Crossa et al. 1994) ensures that the
genetic integrity of the accessions in genebanks will
be maintained. The SNP loci, with significant
changes between generations in relation to flowering
time, could indicate that there may have been
assortative mating (e.g. early flowering plants mate
with early flowering plants; late flowering plants mate
with late flowering plants) which can cause a loss of
genetic integrity. Further molecular studies are sug-
gested to inspect the on-going practice of regenera-
tion of maize genebank accessions. Regeneration of a
landrace accession or other heterogeneous popula-
tions in different maize genebanks over many gen-
erations can lead to genetically different accessions
of the same name due to the change in genetic
integrity in time and location. It is recommended to
keep a record of duplicate accessions among the
genebanks and it is suggested that perhaps the genetic
diversity of the original collection cannot be main-
tained by only one genebank, but rather should be
conserved by collaborative genebanks. During the ex
situ maintenance of an open pollinating species like
maize, the division of the genebank collection into base
and active storage can reduce the risk of genetic
changes. Core subsets are formed to maximize the
efficiency of germplasm evaluation as well as genetic
diversity in a collection. A target of good regeneration
practice should be to not lose useful alleles during
regeneration. When considering the size of the maize
genome, the number of loci investigated in the present
study is quite limited. With next-generation DNA
sequencing technology (Shendure and Ji 2008), it will
be feasible to sequence any maize genotype of interest
and the sequence of the whole genebank collection
may be accessible. Enhanced sequencing throughput
available in the near future may uncover the huge
diversity present in the genebank accessions. At that
time, the real ‘‘gene’’ or allele bank will be constructed.
Fingerprinting of genebank accessions can help man-
age genetic integrity of the germplasm accessions as
well as the molecular diversity of maize cultivars.
Acknowledgments The authors would like to thank Ramu
Punna, contract editor Debra Eaton Mullan, and CIMMYT editor
Mike Listman for their help in improving the manuscript. We
acknowledge the full financial support received from The
International Rice Research Institute, Philippines (IRRI) in
conjunction with The Consultative Group on International
Agricultural Research (CGIAR) genebank rehabilitation pro-
jects of The World Bank, coordinated by System-wide Genetic
Resources Programme (SGRP). We also would like to express
our sincere thanks to the cooperators of Latin American maize
regeneration projects and International Institute of Tropical
Agriculture, Nigeria (IITA) for germplasm introductions at
CIMMYT maize genebank.
References
Borner A, Chebotar S, Korzun V (2000) Molecular character-
ization of the genetic integrity of wheat (Triticum aes-tivum L.) germplasm after long-term maintenance. Theor
Appl Genet 100:494–497
Botstein DR, White RL, Skolnick M, Davis RW (1980) Con-
struction of a genetic linkage map in man using restriction
fragment length polymorphisms. Am J Hum Genet 32:
314–331
Buckler ES, Holland JB, Bradbury PJ, Acharya CB, Brown PJ,
Browne C, Ersoz E, Flint-Garcia S, Garcia A, Glaubitz JC,
Goodman MM, Harjes C, Guill K, Kroon DE, Larsson S,
Lepak NK, Li H, Mitchell SE, Pressoir G, Peiffer JA,
Rosas MO, Rocheford TR, Cinta Romay M, Romero S,
Salvo S, Villeda HS, da Silva HS, Sun Q, Tian F,
Genet Resour Crop Evol (2011) 58:189–207 205
123
Upadyayula N, Ware N, Yates H, Yu J, Zhang Z, Kreso-
vich S, McMullen MD (2009) The genetic architecture of
maize flowering time. Science 325:714–718
Chebotar S, Roder MS, Korzun V, Saal B, Weber WE, Borner
A (2003) Molecular studies on genetic integrity of open-
pollinating species rye (Secale cereale L.) after long-term
genebank maintenance. Theor Appl Genet 107:1469–1476
CIMMYT Applied Molecular Genetics Laboratory (2003)
Laboratory protocols. 3rd edn. Mexico, pp 7–11
Crossa J (1989) Methodologies for estimating the sample size
required for genetic conservation of outbreeding crops.
Theor Appl Genet 77:153–161
Crossa J, Taba S, Eberhart SA, Bretting P, Vencovsky R (1994)
Practical considerations for maintaining germplasm in
maize. Theor Appl Genet 89:89–95
Fan JB, Gunderson KL, Bibikova M, Yeakley JM, Chen J,
Wickham Garcia E, Lebruska LL, Laurent M, Shen R,
Barker D (2006) Illumina universal bead arrays. Methods
Enzymol 410:57–73
Gore MA, Chia JM, Elshire RJ, Sun Q, Ersoz ES, Hurwitz BL,
Peiffer JA, McMullen MD, Grills GS, Ross-Ibarra J, Ware
DH, Buckler ES (2009) A first-generation haplotype map
of maize. Science 326:1115–1117
Gupta PK, Rustgi S, Mir RR (2008) Array-based high-
throughput DNA markers for crop improvement. Heredity
101:5–18
Hamblin MT, Warburton ML, Buckler ES (2007) Empirical
comparison of simple sequence repeats and single nucle-
otide polymorphisms in assessment of maize diversity and
relatedness. PLoS ONE 12:e1367
Hyten DL, Song Q, Choi IY, Yoon MS, Specht JE, Matu-
kumalli LK, Nelson RL, Shoemaker RC, Young ND,
Cregan PB (2008) High-throughput genotyping with the
GoldenGate assay in the complex genome of soybean.
Theor Appl Genet 116:945–952
Liu KJ, Muse SV (2005) PowerMarker: an integrated analysis
environment for genetic marker analysis. Bioinformatics
21:2128–2129
Liu K, Goodman M, Muse S, Smith JS, Buckler E, Doebley J
(2003) Genetic structure and diversity among maize
inbred lines as inferred from DNA microsatellites.
Genetics 165:2117–2128
Lu Y, Yan J, Guimara CT, Taba S, Hao Z, Gao S, Chen S, Li J,
Zhang S, Vivek BS, Magorokosho C, Mugo S, Makumbi
D, Parentoni SN, Shah T, Rong T, Crouch JH, Xu Y
(2009) Molecular characterization of global maize
breeding germplasm based on genome-wide single
nucleotide polymorphisms. Theor Appl Genet. doi:
10.1007/s00122-009-1162-7
Mehta CR, Patel NR, Tsiatis AA (1984) Exact significance
testing to establish treatment equivalence with ordered
categorical data. Biometrics 40:819–825
Muchero W, Diop NN, Bhat PR, Fenton RD, Wanamaker S,
Pottorff M, Hearne S, Cisse N, Fatokun C, Ehlers JD,
Roberts PA, Close TJ (2009) A consensus genetic map of
cowpea [Vigna unguiculata (L.) Walp.] and synteny based
on EST-derived SNPs. Proc Natl Acad Sci USA. doi:
10.1073/pnas.0905886106
Nei M (1973) Analysis of gene diversity in subdivided popu-
lations. Proc Natl Acad Sci USA 70:3321–3323
Parzies HK, Spoor W, Ennos RA (2000) Genetic diversity of
barley landrace accessions (Hordeum vulgare ssp. vulgare)
conserved for different lengths of time in ex situ gene banks.
Heredity 84:476–486
Reif JC, Xia XC, Melchinger AE, Warburton ML, Hoisington
DA, Beck D, Bohn M, Frisch M (2004) Genetic diversity
determined within and among CIMMYT maize popula-
tions of tropical, subtropical, and temperate germplasm by
SSR markers. Crop Sci 44:326–334
Rostoks N, Ramsay L, MacKenzie K, Cardle L, Bhat PR,
Roose ML, Svensson JT, Stein N, Varshney PK, Marshall
DF, Graner A, Close TJ, Waugh R (2006) Recent history
of artificial outcrossing facilitates whole-genome associ-
ation mapping in elite inbred crop varieties. Proc Natl
Acad Sci USA 103:18656–18661
Schnable PS, Ware D, Fulton RS, Stein JC, Wei F, Pasternak S,
Liang C, Zhang J, Fulton L, Graves TA et al (2009) The
B73 maize genome: complexity, diversity, and dynamics.
Science 326:1112–1115
Shendure J, Ji H (2008) Next-generation DNA sequencing. Nat
Biotechnol 26:1135–1145
Sneath PHA, Sokal RR (1973) Numerical taxonomy. Freeman,
San Francisco
Soengas P, Cartea E, Lema M, Velasco P (2009) Effect of
regeneration procedures on the genetic integrity of Bras-sica oleracea accessions. Mol Breeding 23:389–395
Taba S, Twumasi-Afriyie S (2008) Regeneration guidelines:
maize. In: Dullo ME, Thormann I, Jorge MA, Hanson J
(eds) Crop specific regeneration guidelines [CD-ROM].
CGIAR System-wide Genetic Resource Programme,
Rome, p 10
Taba S, van Ginkel M, Hoisington D, Poland D (2004) Well-
hausen-Anderson plant genetic resources center: opera-
tions manual, 2004. CIMMYT, Mexico
Taba S, Shands HL, Eberhart SA (2005) The growth of CI-
MMYT’s maize collection with the introduction of Latin
American maize landrace accessions through the cooper-
ative regeneration project, p 1–8. In: S. Taba (ed) Latin
American maize germplasm conservation: regeneration,
in situ conservation, core subsets and prebreeding. Pro-
ceedings of a workshop held at CIMMYT 7–10 April
2003. CIMMYT, Mexico
van Hintum TJL, van Wiel CCM, Visser DS, van Treuren R,
Vosman B (2007) The distribution of genetic diversity in
a Brassica oleracea gene bank collection related to the
effects on diversity of regeneration as measured with
AFLPs. Theor Appl Genet 114:777–786
Wang J, Crossa J, Ginkel M, Taba S (2004) Statistical genetics
and simulation models in genetic resource conservation
and regeneration. Crop Sci 44:2246–2253
Weir BS (1996) Genetic data analysis II. Sinauer Associates,
Sunderland
Wright S (1965) The interpretation of population structure by
F-statistics with special regard to systems of mating.
Evolution 19:395–420
Yan J, Shah T, Warburton M, Buckler ES, McMullen MD,
Crouch JH (2009) Genetic characterization and linkage
disequilibrium estimation of a global maize collection
using SNP markers. PLoS ONE 4(12):e8451. doi:
10.1371/journal.pone.0008451
206 Genet Resour Crop Evol (2011) 58:189–207
123
Yan J, Yang X, Shah T, Hector Sanchez H, Li J, Warburton M,
Zhou Y, Crouch JH, Xu Y (2010) High-throughput SNP
genotyping with the GoldenGate assay in maize. Mol
Breeding 25:441–451
Yu JM, Zhang ZW, Zhu CS, Tabanao DA, Pressoir G, Tuinstra
MR, Kresovich S, Todhunter RJ, Buckler ES (2009)
Simulation appraisal of the adequacy of number of
background markers for relationship estimation in asso-
ciation mapping. The Plant Genome 2:63–77
Zhu YL, Song QJ, Hyten DL, van Tassell CP, Matukumalli
LK, Grimm DR, Hyatt SM, Fickus EW, Young ND,
Cregan PB (2003) Single-nucleotide polymorphisms in
soybean. Genetics 163:1123–1134
Genet Resour Crop Evol (2011) 58:189–207 207
123