Embed Size (px)
Citation preview
Detection of Faulty Measurements in WBANs using Gaussian Mixture Model
and Ant Colony
Osman Salem*,1, Yaning Liu2, and Ahmed Mehaoua1
1LIPADE Laboratory, University of Paris Descartes, Paris, France {osman.salem, ahmed.mehaoua}@parisdescartes.fr
2JCP-Connect, Rennes, France [email protected]
Abstract
Wireless sensor networks are subject to different types of faults and interferences after their
deployment. Abnormal values reported by sensors should be separated from faulty or
injected measurements to ensure reliable monitoring operation. The aim of this paper is to
propose a lightweight approach for the detection and suppression of faulty measurements in
medical wireless sensor networks. The proposed approach is based on the combination of
statistical model and machine learning algorithm. We begin by collecting physiological data
and then we cluster the data collected during the first few minutes using the Gaussian
mixture decomposition. We use the resulted labeled data as the input for the Ant Colony
algorithm to derive classification rules in the central base station. Afterward, the derived
rules are transmitted and installed in each associated sensor to detect abnormal values in
distributed manner, and notify anomalies to the base station. Finally, we exploit the spatial
and temporal correlations between monitored attributes to differentiate between faulty
sensor readings and clinical emergency. We evaluate our approach with real and synthetic
patient datasets. Our experimental results demonstrate that our proposed approach achieves
a high rate of detection accuracy for clinical emergency with reduced false alarm rate when
compared to robust Mahalanobis distance.
Keywords
Anomaly Detection, Wireless Sensors Networks, Ant Colony (AC), Gaussian Mixture Model
(GMM), Healthcare monitoring
1. Introduction
The Medical Wireless Sensor Networks (WSNs) or Wireless Body Area Networks (WBANs)
are a set of wearable or implantable biomedical sensors with wireless transmission
capabilities, used to collect vital signs (pulse, heart rate, blood pressure, oxygen saturation,
body temperature, glucose level, galvanic skin ratio, electrocardiogram, electromyogram,
etc.) from the monitored patients (Crosby, Ghosh, Murimi, & Chin, 2012), and to transmit
collected data toward a central device (smartphone or tablet) (Movassaghi, Abolhasan,
Lipman, Smith, & Jamalipour, 2014).
These sensors measure and transmit physiological data in real time, and allow remote and
continuous health monitoring (in-home or in-work) over an extended period of time (Otto,
Milenkovi, Sanders, & Jovanov, 2005). These sensors minimize the need of caregivers and
allow monitored patient to continue living independent life. Their usage leads to the
modernization of the way in which healthcare services are deployed and delivered. WSNs
may also resolve the shortage of nursing for assisting elderly people in-home. Several clinical
situations could be prevented or better monitored using WBANs, where the collected data in
real-time can be used to follow the evolving state of remotely monitored patient, to early
detect clinical emergency situation and to quickly react by taking the appropriate actions to
save the life of the monitored patient (Ko, et al., 2010).
WBANs provide a mobile healthcare system used for remote and in-home monitoring,
where the physiological data collected by sensors are transmitted to Local Processing Unit
(LPU), which has more processing power, battery and transmission capabilities than sensors.
The LPU must process collected measurements in real time, and raise an alarm for healthcare
center (or family, neighbor, etc.) when it detects clinical emergency, in order to let them react
by taking the necessary actions.
Therefore, pervasive healthcare services require the development of real-time applications
for the detection of emergency situations, such as the detection of myocardial ischemia
which precedes the heart attack (or infarction). The early detection prevents serious
complications and damage of the heart by therapies using anticoagulants or Percutaneous
Coronary Intervention (PCI) that reestablish the normal flow of blood in the obstructed
coronary artery.
WBANs reduce healthcare cost and improve the usage of occupied beds in hospital by
enabling the monitoring of chronicle and long term diseases outside institutions. They also
enhance the life of monitored patients by allowing them to move freely and to achieve their
daily life activities while being monitored. However, the use of WBANs is susceptible to
several problems which range from reliability to security threats after deployment.
Sensors are subject to hardware and software faults, which are due to various reasons such
as damaged device, calibration, battery exhaustion, or dislocation. Furthermore, with the
small size of sensors and their underlying constrained resources, such as limited processing
power, small memory and restricted transmission range, their transmitted data are extremely
vulnerable to radio interference, environmental noise, function fault, breakdown, faulty
measurements from badly attached sensor and malicious behavior. Consequently, the
collected measurements are affected by noise and errors and have low quality and reliability.
The transmission of faulty measurements consumes energy of constrained sensors, and they
might trigger a false alarm. Faulty measurements reduce the reliability and the accuracy of
diagnosis results, and they affect the credibility of such monitoring system and prevent its
deployment, where reliability is extremely important to ensure accuracy in the medical
domain (Sahoo, 2012).
The use of WSNs in medical field has stringent requirements in terms of reliability and
security. Security issues in WSNs should consider not only technical issues, but also social
issues which might break the privacy of patient life. For example, the collected
measurements might be accessed by an attacker which may (i) modify data, (ii) inject false
data or (iii) replay previously registered data to threat patient's life. As the LPU must process
the measurements in real-time to detect clinical deterioration, faulty measurements or
maliciously injected data must be detected and isolated to increase the reliability of such
monitoring system and to reduce false alarms.
Intrusion Detection Systems (IDS) are classified into two categories: misuse and anomaly
detection. Misuse detection techniques are signature-based for detecting malicious traffic,
and these signatures are not currently available for medical WSNs. In fact, most of malicious
activities are the results of some assumptions and unknown signature attacks would be
serious problem for WSNs. Anomaly Detection (AD) techniques measure the deviations
between actual and pre-established normal model. Afterward, AD flags measurements that
deviate from normal profile as anomalies. Although various IDS for wired and ad hoc
networks are mature enough today, they cannot be applied directly in WSNs because of the
vast difference in sensor’s resources, such as limited memory, small processing power, low
transmission range, etc.
Several anomaly detection approaches have been proposed as solutions for these challenging
problems which could severely affect the diagnosis results and pose a life-threating risk.
Despite the increasing interest in health monitoring, existing approaches for the detection of
clinical deterioration using WBANs still suffer from the high number of false alarms. It is
important to design a reliable detection algorithm that is able to differentiate between two
types of changes in sensors' readings: (i) an emergency situation which causes changes in
many physiological measurements, and (ii) faulty or injected measurements by malicious
users. Abnormal data from these two types will deviate from the normal data profile and
will trigger false alarms for healthcare professional. To reduce the high rate of false alarms
caused by faulty measurements, it is important to provide a mechanism able to detect any
abnormal deviations, and to distinguish between an emergency situation and sensor fault.
In this paper, we propose a solution to detect and insolate faulty measurements, and to
enhance the reliability of healthcare monitoring using WBANs. Our proposed approach is
based on machine learning algorithm and statistical model to detect abnormal data. First, we
use Gaussian Mixture Model (GMM) decomposition to learn the statistical regularities of
collected measurements. Then based on obtained labeled data, the Ant Colony (AC) is used
to discover the set of classification rules for normal class. The derived rules by AC are the
normal range for each monitored physiological attribute, and will be used to detect all
abnormal measurements that deviate from the regular data.
To minimize the communication overhead by the transmission of abnormal data, the LPU
transmits the derived rules to sensors. Each sensor applies the associated rule and transmits
alarms to LPU only when data lie outside the range defined by the AC rule. Therefore, there
is a reduction in data transmission and energy consumption in the network compared to
centralised approach, where the whole collected measurements must be transmitted to the
LPU, and anomaly detection is impractical with the overwhelming amount of collected data.
In our distributed case, the LPU still has a global overview of abnormal data through
received alarms and can exploit correlation between monitored attributes to take a detection
decision and to reduce the number of false alarms.
The remaining of this paper is organized as follows. Section 2 reviews related work for fault
detection and isolation in WSNs. Section 3 reviews Gaussian Mixture Model and Ant Colony
classification algorithms used in our proposed approach. Section 4 presents our proposed
approach. In section 5, we present our results from experimental evaluation over real and
synthetic physiological datasets. Finally, section 6 concludes this paper with a discussion of
the results and plans for future work.
2. RELATED WORK
The remote healthcare monitoring using WBANs has recently gained momentum as
powerful architecture for improving the quality of life for patients and for reducing the
healthcare costs.
One of the proposed monitoring systems is CodeBlue (Malan, Fulford-jones, Welsh, &
Moulton, 2004; Havard Sensor Networks Lab, 2013), which is able to monitor the Heart Rate
(HR), Pulse, SpO2 and ElectroCardioGram (ECG). It transmits the collected data to the
healthcare professionals for further analysis, through the use of base station (LPU). Other
medical monitoring systems are: MEDiSN (Ko, et al., 2010), LifeGuard (Montgomery, et al.,
2004), AlarmNet (Wood, et al., 2006), Medical MoteCare (Navarro, Lawrence, & Lim, 2009),
Vital Jacket (Cunha, et al., 2010). Some comprehensive survey studies of medical applications
using WSNs are available in (Alemdar & Ersoy, 2010; Grgic, Žagar, & Križanovic, 2012).
Various other monitoring systems using WBANs have been proposed for the detection of
specific event, such as: epileptic seizure detection (Cuppens, Lagae, Ceulemans, Huffel, &
Vanrumste, 2010), fall detection (Lee, Kim, Son, & Lee, 2007), myocardial ischemia (Romero,
Ringborn, Laguna, Pahlm, & Pueyo, 2011), myocardial infarction (Bradley, et al., 2012; Sun,
Lu, Yang, & Li, 2012), kinematics (Toffola, Patel, Ozsecen, Ramachandran, & Bonato, 2012),
Sleep Apnea (Bsoul, Minn, & Tamil, 2011), etc.
However, the measured and collected data by sensors are often unreliable and inaccurate
(Zhang, Meratnia, & Havinga, 2010; Wang, Fang, Xing, & Chen, 2011; Zhang, et al., 2012).
They are affected by interference, error, noise, missing values, inconsistent readings,
maliciously injected, etc. Several approaches for the detection of faulty measurements have
been proposed in the literature. Authors in (Zhang, Meratnia, & Havinga, 2010; Xie, Han,
Tian, & Parvin, 2011) provide surveys for outlier detection techniques in WSNs, and compare
existing techniques.
Authors in (Jurdak, Wang, Obst, & Valencia, 2011) define the common types of anomalies in
WSNs, and classify them into three types: network anomalies, sensor anomalies and data
anomalies. Their detection can be achieved by building a model to represent normal data,
and any heavy deviation from the established normal profile will be considered as anomaly.
Usually, normal measurements follow the same distribution and abnormal values (outliers)
are generated by other distribution or require changes in statistical parameters.
Authors in (Abduvaliyev, Pathan, Zhou, Roman, & Wong, 2013) survey recently proposed
approaches on IDS in WSNs, and include the significant advancements in this area. They
present a classification of IDS into 3 categories based on their detection techniques: misuse
detection, anomaly detection and specification-based detection. They also present a
comparison between existing approaches in terms of energy efficiency, accuracy and
memory requirements. They note the importance of the tradeoff between resources
consumption (energy and memory) and detection accuracy, where the required
computational power by some approaches to achieve good detection accuracy, are not
available in the sensors.
Authors in (Curiac & Volosencu, 2012) propose an algorithm to detect faulty measurements
on the LPU of WSNs. They use five different classifiers, each of which classifies the sensed
data as normal or abnormal. All individual decisions will be aggregated using a weighted
majority algorithm to obtain the final decision.
Authors in (Siripanadorn, Hattagam, & Teaumroong, 2010) use an unsupervised approach
(data mining or clustering) for anomaly detection in WSNs. Their proposed approach is
based on Self-Organizing Map (SOM) and Discrete Wavelet Transform (DWT). The DWT is
used to reduce the size of input data for SOM clustering. Experimental results over synthetic
traces show that this method is able to detect anomalies accurately, but the required
processing and storage cost caused by SOM and Wavelet may prevent its usage for real time
detection with the constrained resources in WSNs.
Author in (Zhu, 2011) uses machine learning approach (or supervised classification) to
automatically detect anomalies in the Blood Glucose Level (BGL) of monitored patients. The
normal daily measurements of the patient are used to train the Hidden Markov Model
(HMM) by estimating the transition and output probabilities. In test phase, if the likelihood
of measured value is lower than output in HMM, it is considered as an anomaly. However,
experimental results are conducted by simulations, and the author doesn't evaluate the
complexity and the feasibility of parameter estimations in a real world scenario.
Authors in (Chuah & Fu, 2007) proposed an Adaptive Window-based Discord Discovery
(AWDD) scheme, which is based on time series analysis to detect abnormal heartbeat. Their
algorithm is accomplished in two passes with adaptive window size. They compared two
subsequences of different lengths, and they use Euclidean Distance to measure the
divergence between one of the subsequences and its nearest non-self-match. They consider
as anomalies the subsequence with the largest distance.
Authors in (Chang, Terzis, & Bonnet, 2009) also use machine learning model (Neural
Networks) for anomaly detection in WSNs. They build a distributed algorithm for fault and
event detection. Their proposed approach is based on two stages: (i) training phase where
nodes are trained by Echo State Networks (ESN) to build a model for normal data, (ii)
detection phase where measurements that significantly deviate from their predicted values
by ESN are considered as anomalies.
Authors in (Zhang, Ren, Gao, Yan, & Li, 2009) propose a distributed fault detection scheme
for WSNs. They identify faulty sensor based on the similarity test of neighboring nodes and
dissemination of the decision made at each node. Each sensor has NT table which contains
certain information about its neighbors, such as node ID, similarity coefficient and current
state. The sensor will be considered as faulty when its current state in NT table is faulty, or if
the similarity coefficient is less than threshold.
Author in (Jiang, 2009) proposes another distributed scheme to divide sensors into 2 types:
normal and faulty. However, distributed detection schemes assume that neighbor nodes are
measuring the same attributes. Each sensor monitors its one hop neighbors and uses local
comparisons between measured and received data, and some thresholds are used to detect
faulty measurements and to prevent their transmission. However, it is impractical to use
redundant sensors in healthcare monitoring. Furthermore, distributed detection techniques
require resources that are not available in medical sensors, and their accuracy is lower than
centralized approaches, which have a global view on collected data from multiple sensors.
Authors in (Jurdak, Wang, Obst, & Valencia, 2011) classify the anomaly detection approaches
in WSNs into 3 categories: centralized, distributed and hybrid. They found that a hybrid
approach that locally detects problems and then triggers more involved analysis in the
centralized collection point is most suitable for anomaly detection. In this paper, we will use
a hybrid approach to reduce the energy consumption and to enhance the detection accuracy
of monitoring results. For further information of existing technologies, several
comprehensive surveys on anomaly detection in WSNs are available in (Chandola, Banerjee,
& Kumar, 2009; Xie, Han, Tian, & Parvin, 2011; Abduvaliyev, Pathan, Zhou, Roman, &
Wong, 2013).
A common problem in majority of existing anomaly detection approaches is the ignorance of
both spatial and temporal correlation between monitored physiological attributes. Mostly
they focus on temporal correlation without considering spatial relationship among attributes.
In this paper, we provide a distributed approach for reliable vital sign collection in medical
WSNs. The aim is to reduce false alarms triggered by faulty or maliciously injected
measurements. We use GMM decomposition to cluster the collected data in the first few
minutes, and the resulted labeled data are used by the AC to derive classification rules. The
LPU transmits the rules to sensors, which apply associated rule on each sensed data to
classify measurements into 2 classes: normal or abnormal. Sensors communicate only
abnormal data to LPU in order to reduce energy consumption by communication overhead.
As the LPU has a global view on abnormal data, it exploits the correlation between
monitored attributes to make a detection decision, and to reduce false alarms triggered by
faulty measurements.
3. Background
In this section, we briefly survey the Gaussian Mixture Models (GMM) and Ant Colony
Optimization (ACO) classifier used in our proposed approach. For detailed information
about these algorithms, reader may refer to the papers (Martens, et al., 2007; Theodoridis,
Pikrakis, Koutroumbas, & Cavouras, 2010).
A. Gaussian Mixture Model (GMM)
Gaussian Mixture Model (GMM) is used to model unknown probability density function by
a weighted sum of 𝐽 Gaussian distributions in the form:
1 1 1
( ) . ( / i) . ( , ) where 1|m m m
J J J
t i t i t i i i
i i i
p Y P p Y P p Y m P
(1)
Where 𝑝(𝑌𝑡𝑚/𝑖) models the 𝑖𝑡ℎ cluster specified by its mean mi and its covariance matrix 𝑖,
Pi is the probability that data vector 𝑌tm is generated by the component 𝑖. To cluster the data
into 2 (𝐽 = 2 ) classes (normal & abnormal), we use the iterative generalized mixture
decomposition algorithm (Theodoridis, Pikrakis, Koutroumbas, & Cavouras, 2010) which
adjusts the parameters mi, 𝑖 and Pi with respect to an initial estimate, and terminates when
no significant change in these values between two successive iterations. It returns the
posteriori probability that the vector 𝑌tm stems from the distribution associated with the 𝑖𝑡ℎ
cluster (cpk) . To obtain a hard clustering, we use the maximum value of the cluster
probability Class = max(cpk).
B. Ant Colony Classifier
Ant Colony Optimisation (ACO) is a meta-heuristic algorithm inspired from the behaviour
of ants to find the shortest path toward the food. ACO has been applied to build a
classification rules in machine learning domain, where it uses a set of labeled training data to
infer the classification rules.
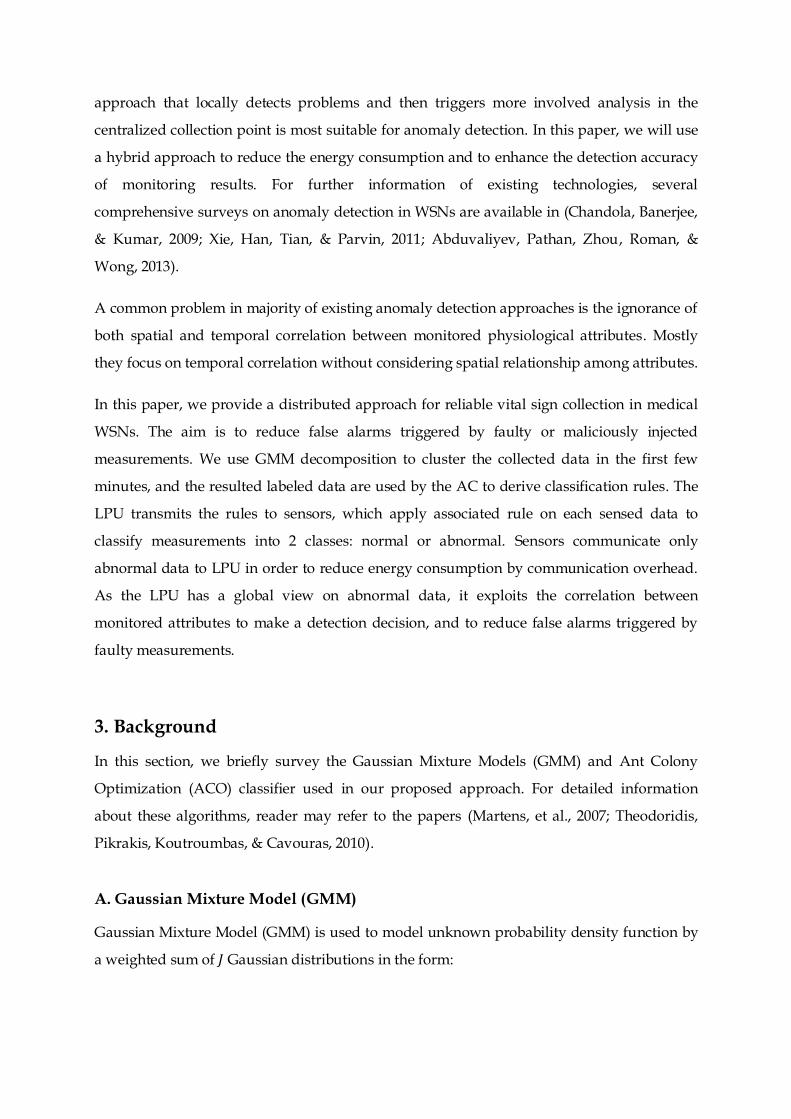
Ant Colony (AC) classifier is inspired from the collective behavior of the real ants which
communicate together in an indirect manner by depositing a substance called pheromone
(Martens, et al., 2007). In fact, Ants go out from their colony looking for food (as shown in
Figure 1), with their colony as start point and their destination (the food) as their stop point.
Start (Nest)
Destination
(Food)
Ant 1Ant 2
Path1 Path2
Destination
(Food)
Destination
(Food)
Start (Nest) Start (Nest)
Obstacle Obstacle Obstacle
Figure 1. Ants behaviour

Initially, the ants start searching for the food in a random manner, and they might face some
obstacles and barriers which make them take a decision to search for alternative paths.
Furthermore there will be a disparity between the lengths of paths. So the goal of ants is not
limited to reach the destination (food), but to reach the destination using the shortest path. In
Figure 1, Ant 1 and Ant 2 start from the nest and depose pheromone on the paths while
searching the food. Ant 1 reaches destination (food) earlier than Ant 2 and thus it goes back
to start point. This causes reinforcement of the amount of pheromone in path 1 (shortest
path), which attracts other ants to pass through this path. The path will be used by other ants
which in turn drop some amount of pheromone. After some amount of time, all ants
converge to path 1 as the shortest path between Nest and Food.
In machine learning, AC is applied over labeled training to discover the classification rules,
such that each path discovered by the artificial ants represents one candidate classification
rule. These rules are of the form: if ″rule antecedent″ then ″rule consequent″. The condition ″rule
antecedent″ stands for a conjunction of terms (𝑌1 & 𝑌2 … 𝑌𝑛), where each term is a condition (𝑌𝑖,
operator, value). For clarification, an example of a term when monitoring the HR of a patient,
the term is: (𝐻𝑅 < 60). The ″rule consequent″ is the discovered class where their attributes
satisfy all the terms in the "antecedent rule". An example of the rule:
( 60) ( 100)if HR and HR
then
class normal
else
class abnormal
In AC, artificial ants are used to explore the environment, which is represented by a directed
acyclic graph 𝐺 with a vertex group for each attribute. To build the graph 𝐺, we apply the
following procedure over 3 physiological data (HR, Pulse and SpO2):
1. All ants begin in the start vertex and walk through their environment to the stop
vertex.
2. A vertex group (Class in Figure 2) contains only one vertex (i.e., normal class in our
study) that is used to extract a rule for normal data. The abnormal class will be the
result of negating the final established rule for the normal class (the else clause).
3. Vertex groups (𝑉1 , 𝑉2, … , 𝑉𝑛) represent 𝑛 attributes (e.g., HR, Pulse and SpO2), where
𝑉𝑖 contains the data measurements in normal class from the 𝑖𝑡ℎ attribute.
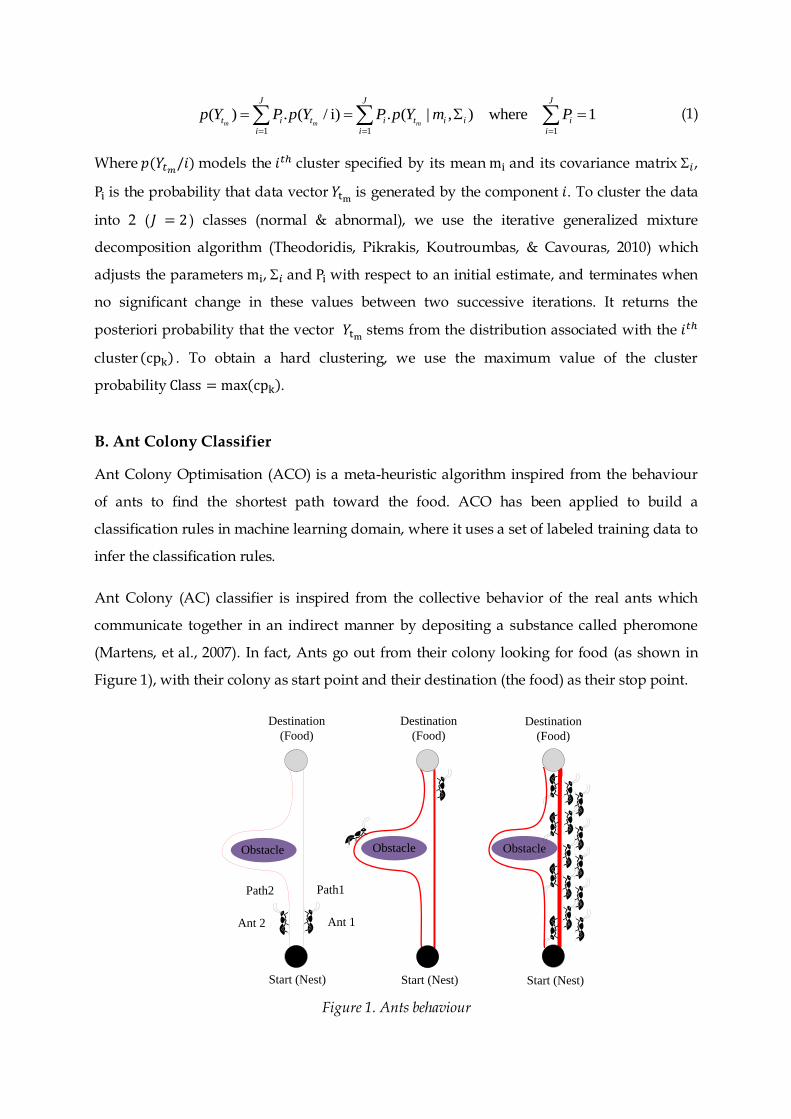
4. To derive an interval for normal data, such as the case for normal 𝐻𝑅 ∈ [60 − 100],
the vertex groups (HR, Pulse and SpO2) are duplicated in (HR', Pulse' and SpO2').
The first vertex group is used to derive the lower bound, and the duplicated vertex
group is used to derive the upper bound for each attribute.
5. To avoid conflict in rule construction (e.g. 𝐻𝑅 ≥ 90 and 𝐻𝑅 ≤ 80), the edge between
two vertices in the same attribute must be removed if the first vertex has a higher
value than the second one.
N
O
R
M
A
L
80
81
119
120
80
81
119
120
80
81
119
120
80
81
119
120
Start
HR HR’ Pulse Pulse’ SpO2 SpO2'
Stop
90
91
99
100
90
91
99
100
Class
Figure 2. Rule construction using Ant Colony
After building the graph using only the records in normal class as training data, the
classification is done by two nested loop as given in algorithm 1. AC starts by the outer loop
where a classification rule will be discovered in each iteration. The pheromone level in all
paths will be initialized to 𝑀𝐴𝑋 in order to assign equal probabilities for an ant to choose
between edges. This loop will be repeated until satisfying the early stopping condition, that
is to say, that loop will be repeated until the number of uncovered cases is smaller than the
threshold predefined by a user.
In the interior loop, an ant begins from the start vertex with an empty rule and walks
through the environment to the stop vertex. Incrementally, it constructs the candidate rule
by adding one term at a time. The probability of path selection among vertices is based on
the pheromone and heuristic values. The pheromone level is an indication of the number of
ants passing through this path, and the heuristic level gives each vertex an importance in the
problem domain, the higher the heuristic value the higher probability for the edge to be
chosen. For more information about AC classifier, reader may refer to (Martens, et al., 2007).
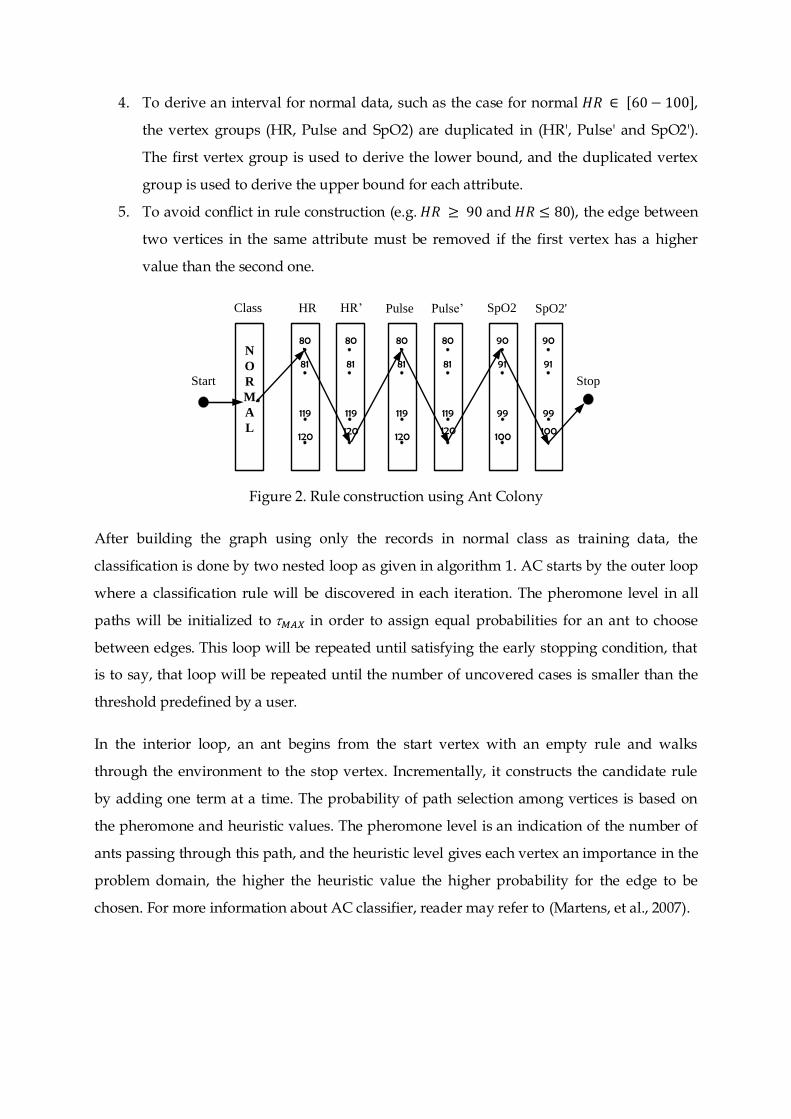
4. Proposed approach
We consider a real deployment scenario where many sensors are attached to the body of the
monitored patient as shown in Figure 3. These sensors collect several physiological
parameters (HR, Pulse, Blood Pressure, Respiration rate, SpO2, etc.) and transmit the
collected data to the LPU (smart phone) for real time processing. The LPU may send the
collected data to remote monitoring center for storage, and it processes data in real-time, in
order to detect heavy deviations in monitored parameters, and to raise medical alarm for
healthcare professionals upon detecting an emergency situation.
SpO2
ECG
BP
EEG
EMG
DB
Healthcare
professionals
Hospital
AP: WIFI or 4G
Wireless Sensors
Figure 3. WSN in medical deployment scenario
Algorithm 1. Ant Colony algorithm
1: TrainingSet = {all training cases}
2: DiscoveredRulesList=[];
3: while (Not early Stopping) do
4: Initialize all path to pheromone level 𝑀𝐴𝑋
5: while (Not converged) do
6: Let ants run from start to end;
7: Update the pheromone of all trails;
8: An ant incrementally constructs a classification rule;
9: Prune the just-constructed rule;
10: end while
11: Choose the best rule out of all constructed rules;
12: Add the chosen rule to DiscoveredRuleList;
13: TrainingSet = TrainingSet - {cases correctly covered by the chosen rule};
14: end while
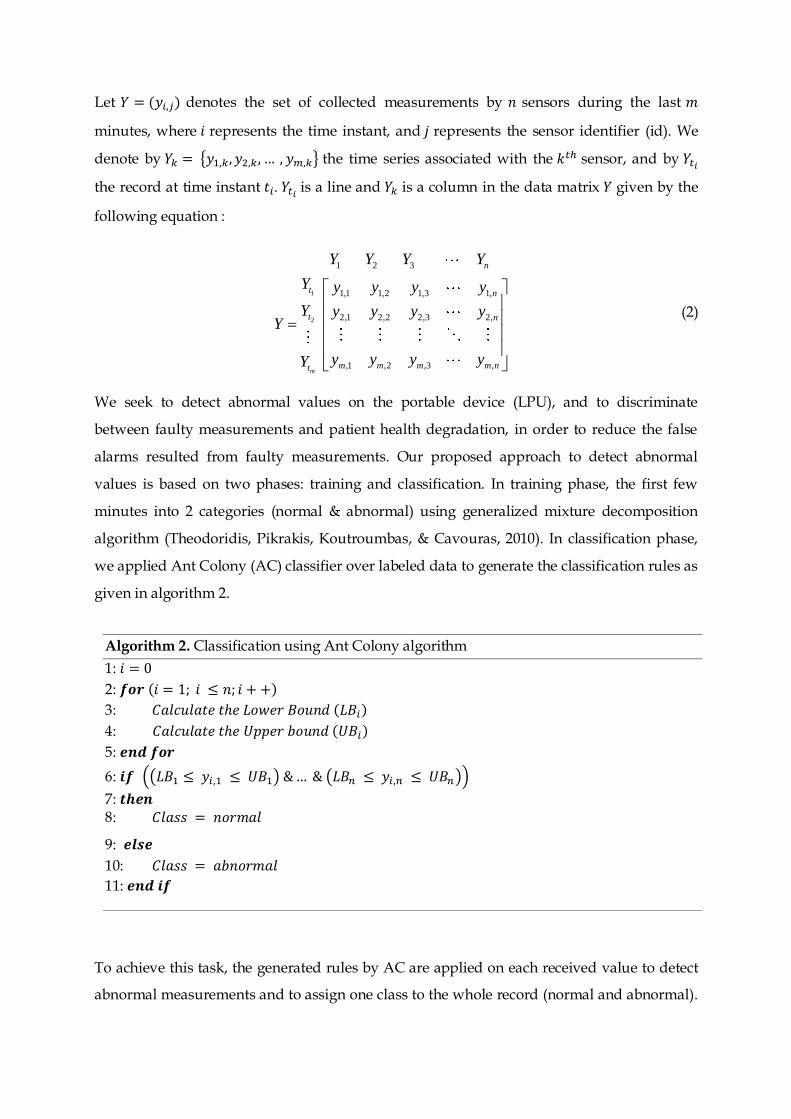
Let 𝑌 = (𝑦𝑖,𝑗) denotes the set of collected measurements by 𝑛 sensors during the last 𝑚
minutes, where 𝑖 represents the time instant, and 𝑗 represents the sensor identifier (id). We
denote by 𝑌𝑘 = {𝑦1,𝑘, 𝑦2,𝑘, … , 𝑦𝑚,𝑘} the time series associated with the 𝑘𝑡ℎ sensor, and by 𝑌𝑡𝑖
the record at time instant 𝑡𝑖. 𝑌𝑡𝑖 is a line and 𝑌𝑘 is a column in the data matrix 𝑌 given by the
following equation :
1
2
1 2 3
1,1 1,2 1,3 1,
2,1 2,2 2,3 2,
,1 ,2 ,3 ,m
n
t n
t n
m m m m nt
Y Y Y Y
Y y y y y
Y y y y yY
y y y yY
(2)
We seek to detect abnormal values on the portable device (LPU), and to discriminate
between faulty measurements and patient health degradation, in order to reduce the false
alarms resulted from faulty measurements. Our proposed approach to detect abnormal
values is based on two phases: training and classification. In training phase, the first few
minutes into 2 categories (normal & abnormal) using generalized mixture decomposition
algorithm (Theodoridis, Pikrakis, Koutroumbas, & Cavouras, 2010). In classification phase,
we applied Ant Colony (AC) classifier over labeled data to generate the classification rules as
given in algorithm 2.
To achieve this task, the generated rules by AC are applied on each received value to detect
abnormal measurements and to assign one class to the whole record (normal and abnormal).
Algorithm 2. Classification using Ant Colony algorithm
1: 𝑖 = 0
2: 𝒇𝒐𝒓 (𝑖 = 1; 𝑖 ≤ 𝑛; 𝑖 + +)
3: 𝐶𝑎𝑙𝑐𝑢𝑙𝑎𝑡𝑒 𝑡ℎ𝑒 𝐿𝑜𝑤𝑒𝑟 𝐵𝑜𝑢𝑛𝑑 (𝐿𝐵𝑖)
4: 𝐶𝑎𝑙𝑐𝑢𝑙𝑎𝑡𝑒 𝑡ℎ𝑒 𝑈𝑝𝑝𝑒𝑟 𝑏𝑜𝑢𝑛𝑑 (𝑈𝐵𝑖)
5: 𝒆𝒏𝒅 𝒇𝒐𝒓
6: 𝒊𝒇 ((𝐿𝐵1 ≤ 𝑦𝑖,1 ≤ 𝑈𝐵1) & … & (𝐿𝐵𝑛 ≤ 𝑦𝑖,𝑛 ≤ 𝑈𝐵𝑛))
7: 𝒕𝒉𝒆𝒏 8: 𝐶𝑙𝑎𝑠𝑠 = 𝑛𝑜𝑟𝑚𝑎𝑙
9: 𝒆𝒍𝒔𝒆
10: 𝐶𝑙𝑎𝑠𝑠 = 𝑎𝑏𝑛𝑜𝑟𝑚𝑎𝑙
11: 𝒆𝒏𝒅 𝒊𝒇
The rule is a logical conjunction of many conditions, and abnormal class is assigned if at least
one attribute is outside the derived range. As this approach is centralized, all the sensor
measurements must be communicated to LPU in order to apply the anomaly detection
algorithm.
To reduce energy consumption by the transmission of normal measurements and extend the
lifetime of the wireless sensors, it will be more efficient to perform in-network detection of
abnormal measurements and to transmit only alarms associated with abnormal
measurements to the LPU for further processing and correlation analysis. However, the
GMM and rules extraction using ACO require resources not available in the sensors. These
algorithms run on the LPU, which transmits the discovered rules for sensors in order to
achieved distributed anomaly detection. As a rule takes the form of ″𝑖𝑓 (𝐿𝐵𝑛 ≤ 𝑦𝑖,𝑛 ≤
𝑈𝐵𝑛) 𝑡ℎ𝑒𝑛 𝐶𝑙𝑎𝑠𝑠 = 𝑛𝑜𝑟𝑚𝑎𝑙″, it can easily be installed and applied in the sensor.
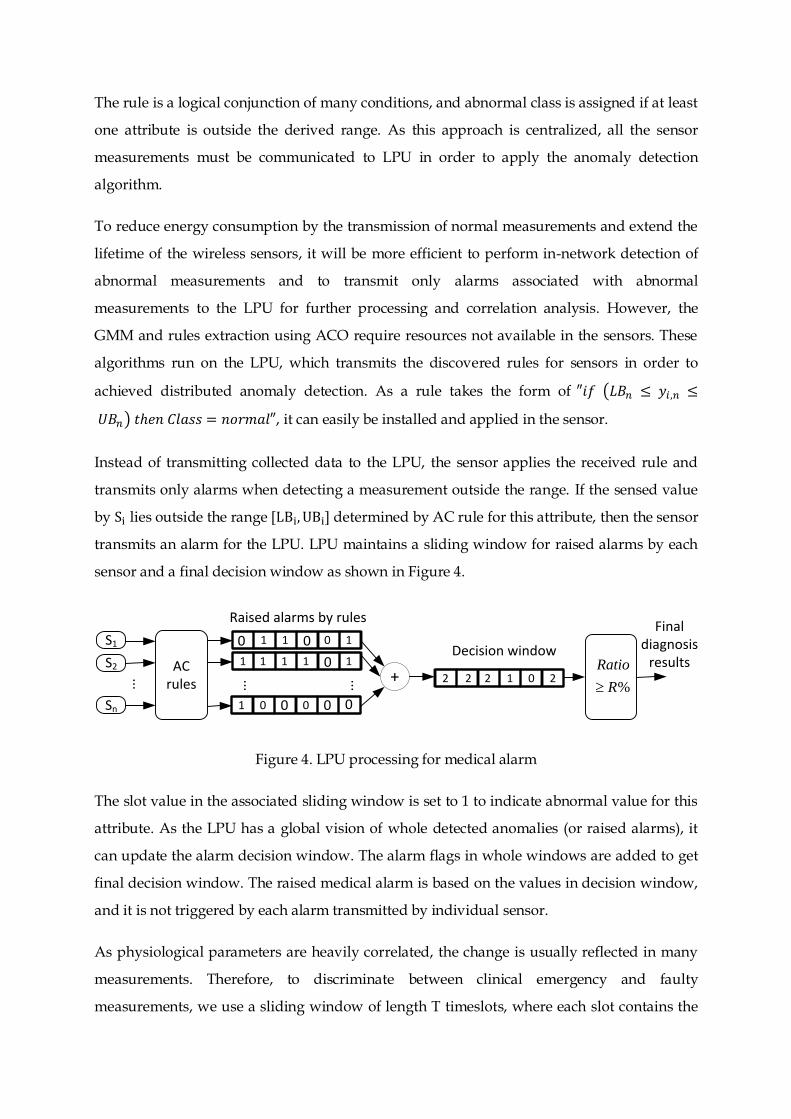
Instead of transmitting collected data to the LPU, the sensor applies the received rule and
transmits only alarms when detecting a measurement outside the range. If the sensed value
by Si lies outside the range [LBi, UBi] determined by AC rule for this attribute, then the sensor
transmits an alarm for the LPU. LPU maintains a sliding window for raised alarms by each
sensor and a final decision window as shown in Figure 4.
S1
Sn
ACrules
S2
1
0
1111
1
0
0
0 01
1
0
0001
... ... ...
Raised alarms by rulesFinal
diagnosis results
+ 2 2 2 1 0 2%
Ratio
R
Decision window
Figure 4. LPU processing for medical alarm
The slot value in the associated sliding window is set to 1 to indicate abnormal value for this
attribute. As the LPU has a global vision of whole detected anomalies (or raised alarms), it
can update the alarm decision window. The alarm flags in whole windows are added to get
final decision window. The raised medical alarm is based on the values in decision window,
and it is not triggered by each alarm transmitted by individual sensor.
As physiological parameters are heavily correlated, the change is usually reflected in many
measurements. Therefore, to discriminate between clinical emergency and faulty
measurements, we use a sliding window of length T timeslots, where each slot contains the
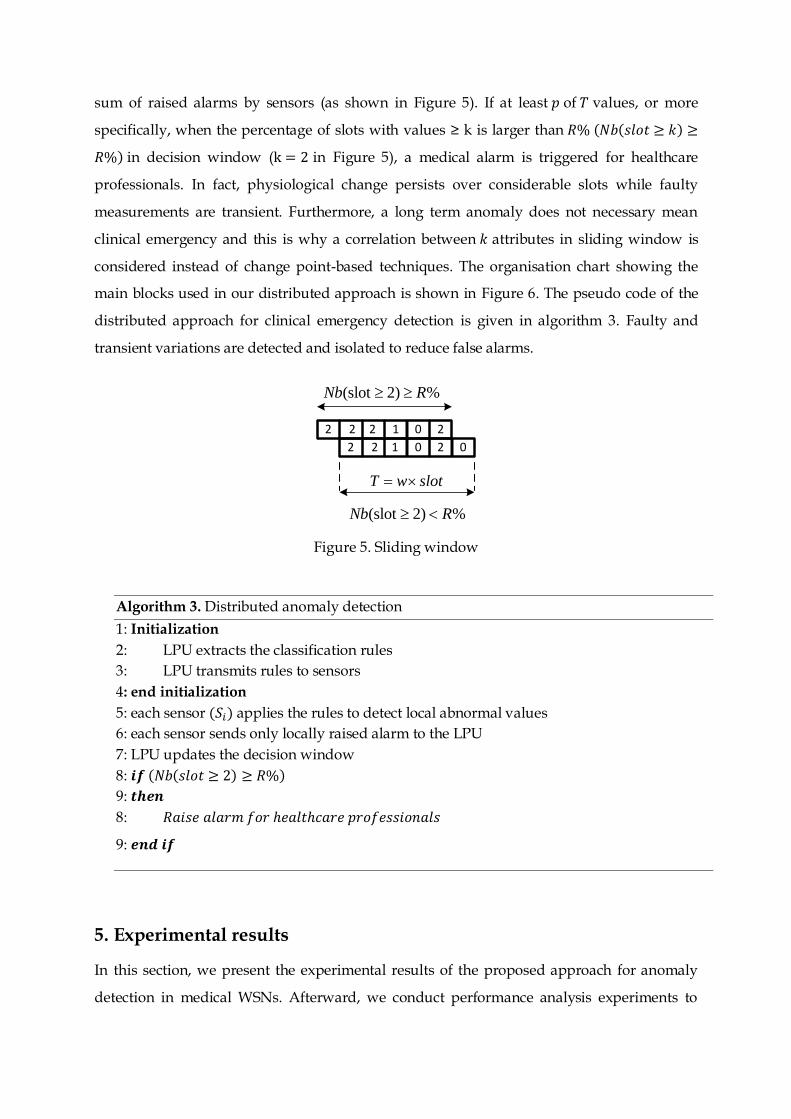
sum of raised alarms by sensors (as shown in Figure 5). If at least 𝑝 of 𝑇 values, or more
specifically, when the percentage of slots with values ≥ k is larger than 𝑅% (𝑁𝑏(𝑠𝑙𝑜𝑡 ≥ 𝑘) ≥
𝑅%) in decision window (k = 2 in Figure 5), a medical alarm is triggered for healthcare
professionals. In fact, physiological change persists over considerable slots while faulty
measurements are transient. Furthermore, a long term anomaly does not necessary mean
clinical emergency and this is why a correlation between 𝑘 attributes in sliding window is
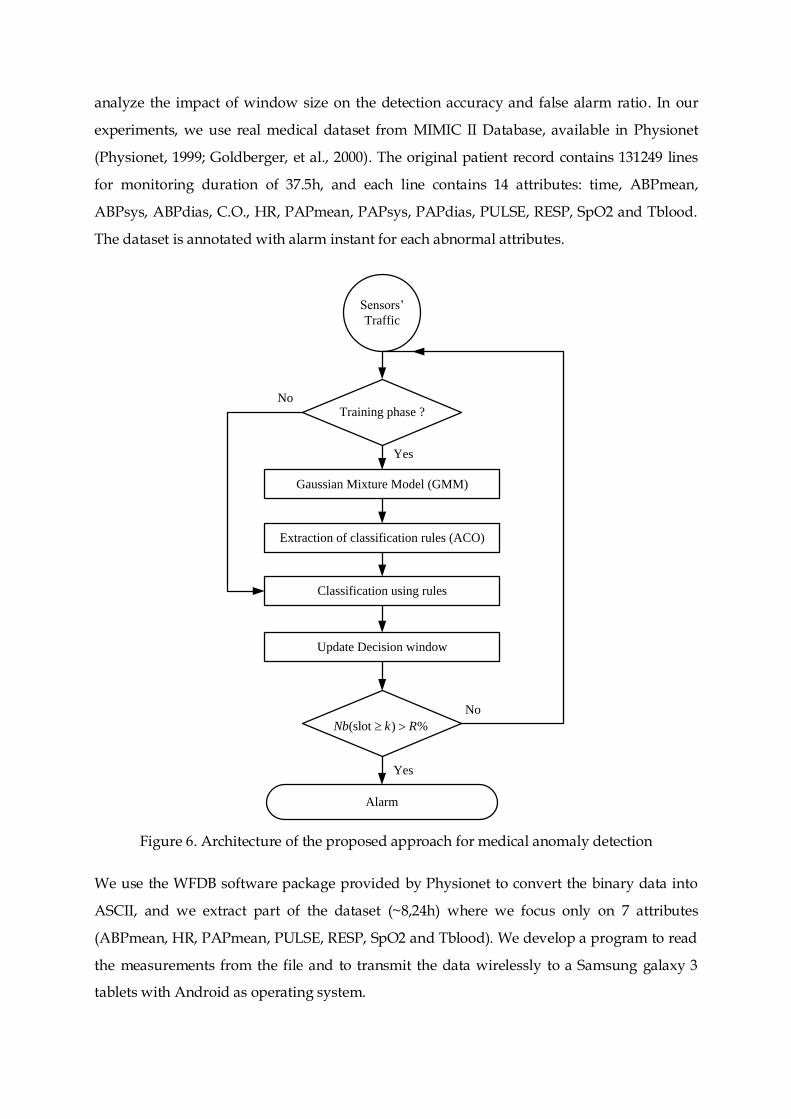
considered instead of change point-based techniques. The organisation chart showing the
main blocks used in our distributed approach is shown in Figure 6. The pseudo code of the
distributed approach for clinical emergency detection is given in algorithm 3. Faulty and
transient variations are detected and isolated to reduce false alarms.
T w slot
(slot 2) %Nb R
2 2 2 1 0 2
2 2 1 0 2 0
(slot 2) %Nb R
Figure 5. Sliding window
5. Experimental results
In this section, we present the experimental results of the proposed approach for anomaly
detection in medical WSNs. Afterward, we conduct performance analysis experiments to
Algorithm 3. Distributed anomaly detection
1: Initialization
2: LPU extracts the classification rules
3: LPU transmits rules to sensors
4: end initialization
5: each sensor (𝑆𝑖) applies the rules to detect local abnormal values
6: each sensor sends only locally raised alarm to the LPU
7: LPU updates the decision window
8: 𝒊𝒇 (𝑁𝑏(𝑠𝑙𝑜𝑡 ≥ 2) ≥ 𝑅%)
9: 𝒕𝒉𝒆𝒏
8: 𝑅𝑎𝑖𝑠𝑒 𝑎𝑙𝑎𝑟𝑚 𝑓𝑜𝑟 ℎ𝑒𝑎𝑙𝑡ℎ𝑐𝑎𝑟𝑒 𝑝𝑟𝑜𝑓𝑒𝑠𝑠𝑖𝑜𝑛𝑎𝑙𝑠
9: 𝒆𝒏𝒅 𝒊𝒇
analyze the impact of window size on the detection accuracy and false alarm ratio. In our
experiments, we use real medical dataset from MIMIC II Database, available in Physionet
(Physionet, 1999; Goldberger, et al., 2000). The original patient record contains 131249 lines
for monitoring duration of 37.5h, and each line contains 14 attributes: time, ABPmean,
ABPsys, ABPdias, C.O., HR, PAPmean, PAPsys, PAPdias, PULSE, RESP, SpO2 and Tblood.
The dataset is annotated with alarm instant for each abnormal attributes.
Training phase ?
Gaussian Mixture Model (GMM)
Sensors’
Traffic
Alarm
Extraction of classification rules (ACO)
Update Decision window
(slot ) %Nb k R
Classification using rules
No
Yes
Yes
No
Figure 6. Architecture of the proposed approach for medical anomaly detection
We use the WFDB software package provided by Physionet to convert the binary data into
ASCII, and we extract part of the dataset (~8,24h) where we focus only on 7 attributes
(ABPmean, HR, PAPmean, PULSE, RESP, SpO2 and Tblood). We develop a program to read
the measurements from the file and to transmit the data wirelessly to a Samsung galaxy 3
tablets with Android as operating system.
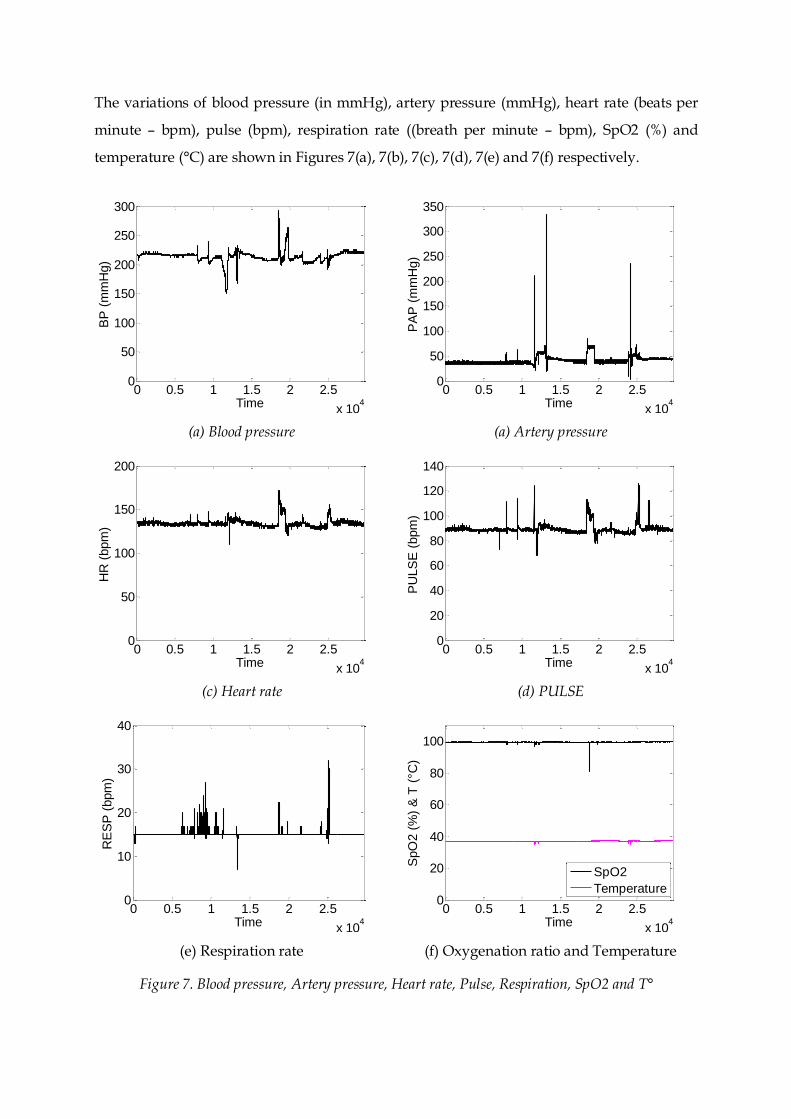
The variations of blood pressure (in mmHg), artery pressure (mmHg), heart rate (beats per
minute – bpm), pulse (bpm), respiration rate ((breath per minute – bpm), SpO2 (%) and
temperature (°C) are shown in Figures 7(a), 7(b), 7(c), 7(d), 7(e) and 7(f) respectively.
(a) Blood pressure (a) Artery pressure
(c) Heart rate (d) PULSE
(e) Respiration rate (f) Oxygenation ratio and Temperature
Figure 7. Blood pressure, Artery pressure, Heart rate, Pulse, Respiration, SpO2 and T°
0 0.5 1 1.5 2 2.5
x 104
0
50
100
150
200
250
300
Time
BP
(m
mH
g)
0 0.5 1 1.5 2 2.5
x 104
0
50
100
150
200
250
300
350
TimeP
AP
(m
mH
g)
0 0.5 1 1.5 2 2.5
x 104
0
50
100
150
200
Time
HR
(bpm
)
0 0.5 1 1.5 2 2.5
x 104
0
20
40
60
80
100
120
140
Time
PU
LS
E (
bpm
)
0 0.5 1 1.5 2 2.5
x 104
0
10
20
30
40
Time
RE
SP
(bpm
)
0 0.5 1 1.5 2 2.5
x 104
0
20
40
60
80
100
Time
SpO
2 (
%)
& T
(°C
)
SpO2
Temperature
HR and Pulse measure the same physiological parameter using two different devices, and
usually they must present the same variations. However, when comparing Figures 7(c) and
7(d), they exhibit some differences (some spikes) at different time instants. The difference
results from abnormal values measured by the sensors.
As physiological parameters are not the same for whole people and are dependent on many
parameters (sex, age, weight, activity, etc.), we started by clustering the collected data in the
first few minutes using generalized mixture model, in order to derive dynamic interval for
normal values of the monitored attributes. To enhance the accuracy of the clustering
algorithm, we inject faulty record in the training data using values from outside the known
normal interval of monitored attributes.
After data clustering, the data in normal cluster will be used by the AC to derive rules, which
define the interval containing the normal values of each physiological attribute of the
monitored patient. These rules will be applied in real time on each measured value by sensor
for binary classification (normal & abnormal).
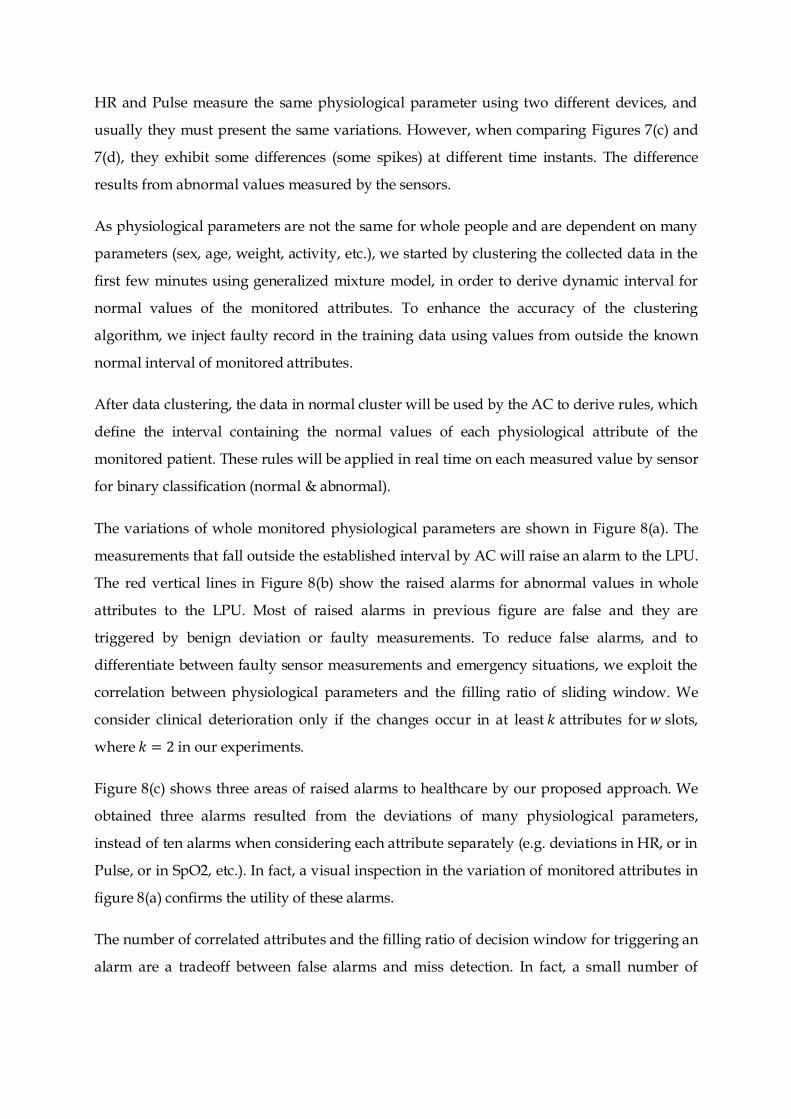
The variations of whole monitored physiological parameters are shown in Figure 8(a). The
measurements that fall outside the established interval by AC will raise an alarm to the LPU.
The red vertical lines in Figure 8(b) show the raised alarms for abnormal values in whole
attributes to the LPU. Most of raised alarms in previous figure are false and they are
triggered by benign deviation or faulty measurements. To reduce false alarms, and to
differentiate between faulty sensor measurements and emergency situations, we exploit the
correlation between physiological parameters and the filling ratio of sliding window. We
consider clinical deterioration only if the changes occur in at least 𝑘 attributes for 𝑤 slots,
where 𝑘 = 2 in our experiments.
Figure 8(c) shows three areas of raised alarms to healthcare by our proposed approach. We
obtained three alarms resulted from the deviations of many physiological parameters,
instead of ten alarms when considering each attribute separately (e.g. deviations in HR, or in
Pulse, or in SpO2, etc.). In fact, a visual inspection in the variation of monitored attributes in
figure 8(a) confirms the utility of these alarms.
The number of correlated attributes and the filling ratio of decision window for triggering an
alarm are a tradeoff between false alarms and miss detection. In fact, a small number of
attributes leads to a large number of false alarms, and a large number may lead to miss
detection and thus may threat the life of monitored patient.
Figure 8(d) shows the raised medical alarm when increasing the size of decision window
(𝑇 = 𝑤 × 𝑠𝑙𝑜𝑡) from 2 minutes to 5 minutes (with 𝑘 = 2). In fact, increasing value of 𝑤
reduces the false alarms and decreases the detection accuracy of clinical emergency. A
window size 𝑤 equal to two minutes provides better detection, and it was chosen as a
tradeoff between false alarms and detection accuracy.
We compare our proposed scheme with the one proposed in (Liu, Cheng, & Chen, 2007),
where Mahalanobis Distance (MD) is used to detect anomaly in gathered data by wireless
sensors. The reason of using this approach in our comparison is that MD also calculates the
distance between measurements by taking into account the correlation between monitored
attributes:
(a) Variation of 7 physiological parameters (b) Raised alarms by sensors
(c) Raised alarms with k=2 & w =60 (d) Raised alarms with k=2 & w =300
Figure 8. Physiological parameters and raised alarms
0 0.5 1 1.5 2 2.5
x 104Time
BP
HR
PAP
PULSE
RESP
SPO2
T
0 0.5 1 1.5 2 2.5
x 104Time
0 0.5 1 1.5 2 2.5
x 104Time
0 0.5 1 1.5 2 2.5
x 104Time
1T
t t tMD X X (3)
Where µ is the mean vector (1 × 𝑛) and is the covariance matrix (𝑛 × 𝑛) of monitored 𝑛
attributes. is calculated by a robust estimation method (Orthogonalized Gnanadesikan-
Kettenring -- OGK) which removes outliers during the estimation of covariance matrix by
looking for a subset of training data without anomalies (µ̂, ̂). Many robust estimation
methods for covariance matrix of multivariate data have been proposed and used to remove
outliers, e.g., Minimum Volume Ellipsoid (MVE), Minimum Covariance Matrix (MCD), Fast-
MCD and deterministic MCD.
However, these robust estimation methods and the MD require additional memory and
computation complexity (the inversion of covariance matrix ) when comparing to ACO
rules. Furthermore, the robust estimations for µ̂ and ̂ require resources not available on the
LPU, nor in the sensor.
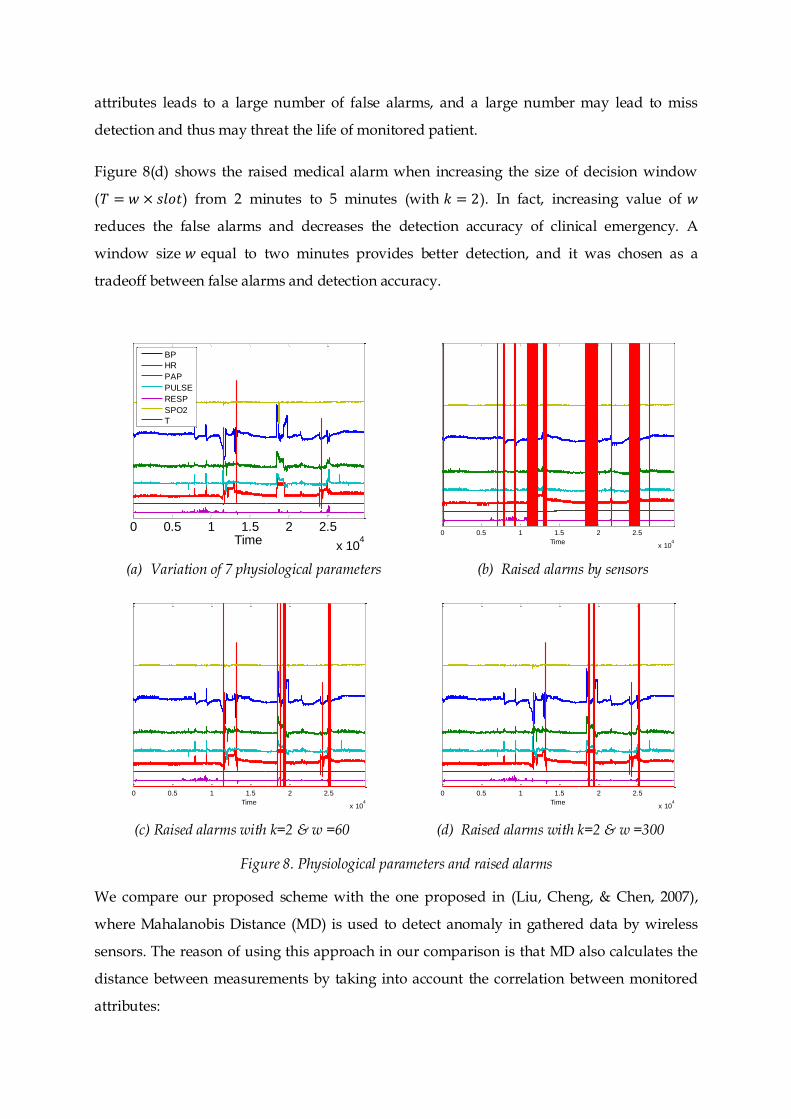
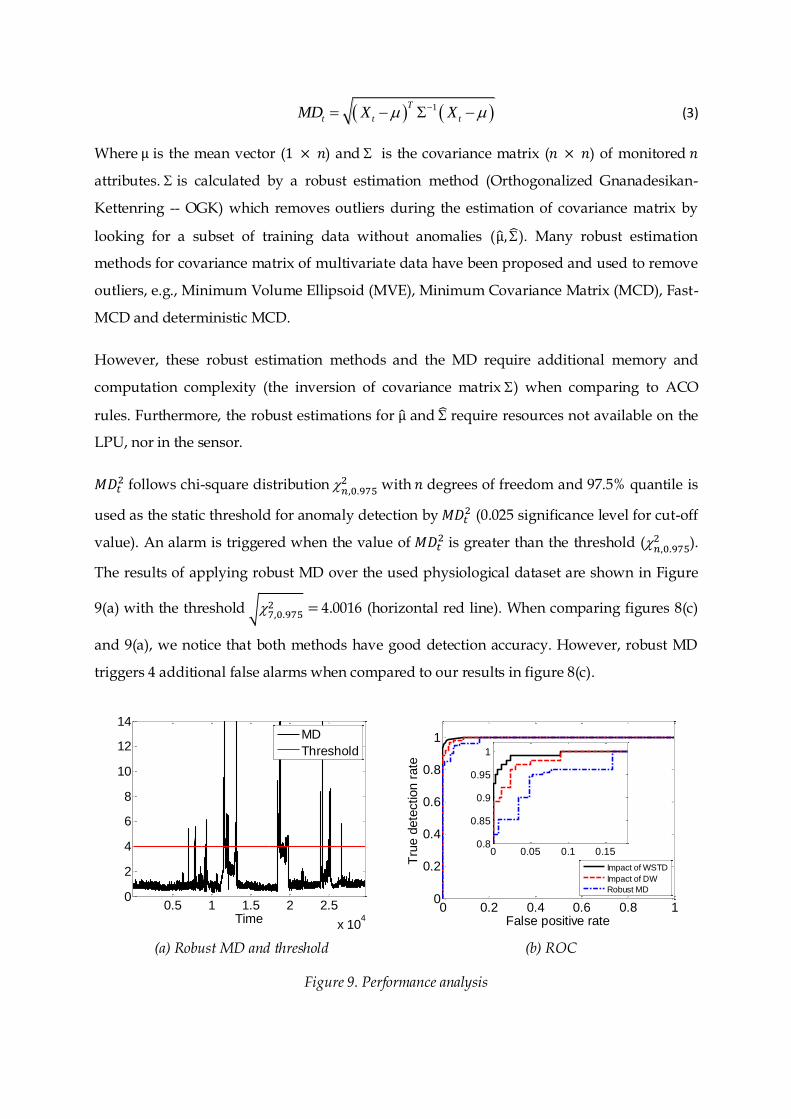
𝑀𝐷𝑡2 follows chi-square distribution 𝑛,0.975
2 with 𝑛 degrees of freedom and 97.5% quantile is
used as the static threshold for anomaly detection by 𝑀𝐷𝑡2 (0.025 significance level for cut-off
value). An alarm is triggered when the value of 𝑀𝐷𝑡2 is greater than the threshold (𝑛,0.975
2 ).
The results of applying robust MD over the used physiological dataset are shown in Figure
9(a) with the threshold √7,0.9752 = 4.0016 (horizontal red line). When comparing figures 8(c)
and 9(a), we notice that both methods have good detection accuracy. However, robust MD
triggers 4 additional false alarms when compared to our results in figure 8(c).
(a) Robust MD and threshold (b) ROC
Figure 9. Performance analysis
0.5 1 1.5 2 2.5
x 104
0
2
4
6
8
10
12
14
Time
MD
Threshold
0 0.2 0.4 0.6 0.8 10
0.2
0.4
0.6
0.8
1
False positive rate
Tru
e d
ete
ction r
ate
Impact of WSTD
Impact of DW
Robust MD
0 0.05 0.1 0.150.8
0.85
0.9
0.95
1
To evaluate the performance of our proposed approach, we inject abnormal values at
different time instants on different number of attributes, and we use the Receiver Operating
Characteristic (ROC) curve to analyze the impact of the Window Size for Training Data
(WSTD), as well as the impact of Decision Window (DW) size on the true detection and false
alarm ratio. The ROC curve presented in Figure 9(b) shows the relationship between the
detection rate (equation 4) and the false positive rate (equation 5) for both cases. The
Detection Ratio (DR) is computed as the percentage ratio between the true positives and
anomalous measurements.
TP
DRTP FN
(4)
Where TP is the number of True Positives, FN is the number of False Negatives, FP is the
number of False Positives and TN is the number of true Negatives. The False Alarm Rate
(FAR) is defined as the percentage ratio between the false positives and the actual normal
measurements:
FP
FARFP TN
(5)
A good detection mechanism must achieve a high detection ratio with the lowest false alarm
rate. Figure 9(b) shows that our proposed approach can achieve a DR=100% with a FAR=9%.
The performance of robust MD (Liu, Cheng, & Chen, 2007) was analysed over the same
medical dataset and the result is presented in figure 9(b), where MD achieves a DR = 100%
with a FAR = 16%. The performance of our proposed approach outperforms the robust MD
and provides better result. Hence, our proposed approach is efficient in achieving low false
alarm rate and high detection accuracy.
6. Conclusion and Perspectives
In this paper, we proposed a new distributed approach for reliable vital sign collection in
medical WSNs with low communication overhead and energy consumption cost. The
proposed approach aims to detect abnormal changes in monitored physiological parameters
and to reduce false alarms triggered by faulty measurements. It is based on Gaussian
Mixture decomposition and Ant Colony Classifier. The Gaussian decomposition is used to
cluster the data. Based on the labeled data, the Ant Colony Classifier derives the
classification rules for normal data in the LPU, and deduces the rules for abnormal values.
Derived rules are transmitted to sensors, which install the associated rule and transmit only
alarms associated with abnormal measurements to reduce communication cost on the sensor
and computational complexity on the LPU.
As abnormal records may result from clinical emergency or faulty measurements, we exploit
the temporal and spatial correlation between the monitored physiological attributes to
distinguish between faulty measurements and clinical emergency, in order to reduce the
underlying false alarms. We applied our proposed approach and we evaluate the
performance on real medical dataset with annotations. Our experimental results proved the
effectiveness of our approach which can achieve a detection ratio of 100% with 9% of false
alarms.
In the future work we intend to periodically adjust the parameters of the proposed model
(𝑘 𝑎𝑛𝑑 𝑤) based on knowledge from previous time windows. Another direction is to enhance
the model by focusing on the detection of specific diseases.
References
Abduvaliyev, A., Pathan, A.-S. K., Zhou, J., Roman, R., & Wong, W.-C. (2013). On the Vital
Areas of Intrusion Detection Systems in Wireless Sensor Networks. IEEE Communications
Surveys and Tutorials, 15(3), 1223--1237.
Alemdar, H., & Ersoy, C. (2010). Wireless sensor networks for healthcare: A survey.
Computer Networks, 54(15), 2688--2710.
Bradley, P. R., Durej, M. T., Gessner, A. E., Gould, A. J., Khan, I. A., Martin, B. N., et al. (2012).
Smartphone application for transmission of ECG images in pre-hospital STEMI treatment.
IEEE Systems and Information Design Symposium (SIEDS'12), (pp. 118-123).
Bsoul, M., Minn, H., & Tamil, L. (2011). Apnea MedAssist: Real-time Sleep Apnea Monitor
Using Single-Lead ECG. IEEE Transactions on Information Technology in Biomedicine, 15(3),
416-427.
Chandola, V., Banerjee, A., & Kumar, V. (2009). Anomaly Detection: A Survey. ACM
Computing Surveys, 41(3), 1--58.
Chang, M., Terzis, A., & Bonnet, P. (2009). Mote-Based Online Anomaly Detection Using
Echo State Networks. Proceedings of the 5th IEEE International Conference on Distributed
Computing in Sensor Systems, (pp. 72-86).
Chuah, M. C., & Fu, F. (2007). ECG Anomaly Detection via Time Series Analysis. Proceedings
of the 2007 international conference on Frontiers of High Performance Computing and
Networking (ISPA'07), (pp. 123-135).
Crosby, G. V., Ghosh, T., Murimi, R., & Chin, C. A. (2012). Wireless Body Area Networks for
Healthcare: A Surve. International Journal of Ad Hoc, Sensor & Ubiquitous Computing, 13(3),
1-25.
Cunha, J. P., Cunha, B., Pereira, A. S., Xavier, W., Ferreira, N., & Meireles, L. (2010). Vital-
Jacket®: A wearable wireless vital signs monitor for patients' mobility in cardiology and
sport. International Conference on Pervasive Computing Technologies for Healthcare,
PervasiveHealth.
Cuppens, K., Lagae, L., Ceulemans, B., Huffel, S. V., & Vanrumste, B. (2010). Automatic
video detection of body movement during sleep based on optical flow in pediatric patients
with epilepsy. Med. Biol. Engineering and Computing, 48(9), 923-931.
Curiac, D.-I., & Volosencu, C. (2012). Ensemble based sensing anomaly detection in wireless
sensor networks. Expert Systems with Applications, 39(10), 9087-9096.
Goldberger, A. L., Amaral, L. A., Glass, L., Hausdorff, J. M., Ivanov, P. C., Mark, R. G., et al.
(2000). PhysioBank, PhysioToolkit, and PhysioNet: Components of a New Research Resource
for Complex Physiologic Signals. Circulation, 101(23), 215-220.
Grgic, K., Žagar, D., & Križanovic, V. (2012). Medical applications of wireless sensor
networks — current status and future directions. Medicinski Glasnik, 9(1), 23-31.
Havard Sensor Networks Lab. (2013). CodeBlue: Wireless Sensors for Medical Care.
Récupéré sur http://fiji.eecs.harvard.edu/CodeBlue
Jiang, P. (2009). A New Method for Node Fault Detection in Wireless Sensor Networks.
Sensors, 9(2), 1282-1294.
Jurdak, R., Wang, X. R., Obst, O., & Valencia, P. (2011). Chapter 12 : Wireless Sensor Network
Anomalies: Diagnosis and Detection Strategies. Dans A. Tolk, & L. C. Jain (Éds.),
Intelligence-Based Systems Engineering (pp. 309-325). Springer.
Ko, J., Lim, J., Chen, Y., Musvaloiu-E, R., Terzis, A., Masson, G., et al. (2010). MEDiSN:
Medical Emergency Detection in Sensor Networks. ACM Transactions on Embedded
Computing Systems (TECS), 10(1), 1-29.
Lee, Y., Kim, J., Son, M., & Lee, J.-H. (2007). Implementation of Accelerometer Sensor Module
and Fall Detection Monitoring System based on Wireless Sensor Network. 29th Annual
International Conference of the IEEE Engineering in Medicine and Biology Society (EMBS'07),
(pp. 2315-2318).
Liu, F., Cheng, X., & Chen, D. (2007). Insider Attacker Detection in Wireless Sensor Networks.
INFOCOM'07, (pp. 1937-1945).
Malan, D., Fulford-jones, T., Welsh, M., & Moulton, S. (2004). CodeBlue: An Ad Hoc Sensor
Network Infrastructure for Emergency Medical Care. Proceedings of International Workshop
on Wearable and Implantable Body Sensor Networks.
Martens, D., Backer, M. D., Haesen, R., Vanthienen, J., Snoeck, M., & Baesens, B. (2007).
Classification With Ant Colony Optimization. IEEE Transactions on Evolutionary
Computation, 11(5), 651-665.
Montgomery, K., Mundt, C., Thonier, G., Thonier, A., Udoh, U., Barker, V., et al. (2004).
Lifeguard – A personal physiological monitor for extreme environments. Proceedings of the
IEEE 26th Annual International Conference on Engineering in Medicine and Biology Society,
(pp. 2192-2195).
Movassaghi, S., Abolhasan, M., Lipman, J., Smith, D., & Jamalipour, A. (2014). Wireless Body
Area Networks: A Survey. IEEE Communications Surveys and Tutorials, PP (99), 1-29.
Navarro, K. F., Lawrence, E., & Lim, B. (2009). Medical MoteCare: A Distributed Personal
Healthcare Monitoring System. International Conference on eHealth, Telemedicine, and
Social Medicine (eTELEMED'09), (pp. 25-30).
Otto, C., Milenkovi, A., Sanders, C., & Jovanov, E. (2005). System architecture of a wireless
body area sensor network for ubiquitous health monitoring. Journal of Mobile Multimedia,
1(4), 307-326.
Physionet. (1999). Physionet. Récupéré sur mimicdb: http://www.physionet.org/physio
bank/database/mimicdb
Romero, D., Ringborn, M., Laguna, P., Pahlm, O., & Pueyo, E. (2011). Depolarization
Changes During Acute Myocardial Ischemia by Evaluation of QRS Slopes: Standard Lead
and Vectorial Approach. IEEE Transactions on Biomedical Engineering, 58(1), 110-120.
Sahoo, P. K. (2012). Efficient Security Mechanisms for mHealth Applications Using Wireless
Body Sensor Networks. Sensors, 12(9), 12606-12633.
Siripanadorn, S., Hattagam, W., & Teaumroong, N. (2010). Anomaly Detection in Wireless
Sensor Networks using Self-Organizing Map and Wavelets. International Journal of
Communications, 4(3), 74-83.
Sun, L., Lu, Y., Yang, K., & Li, S. (2012). ECG Analysis Using Multiple Instance Learning for
Myocardial Infarction Detection. IEEE Transactions on Biomedical Engineering, 59(12), 3348-
3356.
Theodoridis, S., Pikrakis, A., Koutroumbas, K., & Cavouras, D. (2010). Introduction to
Pattern Recognition: A Matlab Approach. Academic Press.
Toffola, L. D., Patel, S., Ozsecen, M. Y., Ramachandran, R., & Bonato, P. (2012). A wearable
system for long-term monitoring of knee kinematics. IEEE-EMBS International Conference
on Biomedical and Health Informatics (BHI'12), (pp. 188-191).
Wang, H., Fang, H., Xing, L., & Chen, M. (2011). An Integrated Biometric-based Security
Framework Using Wavelet-Domain HMM in Wireless Body Area Networks (WBAN). IEEE
International Conference on Communications (ICC'11), (pp. 1-5).
Wood, A., Virone, G., Doan, T., Cao, Q., Selavo, L., Wu, Y., et al. (2006). ALARM-NET:
Wireless sensor networks for assisted-living and residential monitoring. University of
Virginia.
Xie, M., Han, S., Tian, B., & Parvin, S. (2011). Anomaly Detection in Wireless Sensor
Networks: A Survey. J. Netw. Comput. Appl., 34(4), 1302-1325.
Zhang, C., Ren, J., Gao, C., Yan, Z., & Li, L. (2009). Sensor Fault Detection in Wireless Sensor
Networks. IET International Communication Conference on Wireless Mobile and Computing
(CCWMC'09), (pp. 66-69).
Zhang, Y., Hamm, N., Meratnia, N., Stein, A., Van de Voort, M., & Havinga, P. (2012).
Statistics-based outlier detection for wireless sensor networks. 26(8), 1373-1392.
Zhang, Y., Meratnia, N., & Havinga, P. J. (2010). Outlier Detection Techniques for Wireless
Sensor Networks: A Survey. IEEE Communications Surveys and Tutorials, 12(2), 159-170.
Zhu, Y. (2011). Automatic Detection of Anomalies in Blood Glucose Using a Machine
Learning Approach. Journal of Communications and Networks, 13(2), 125-131.