Embed Size (px)
Citation preview
Detection of falsification of securitydocuments using white light interferometer
著者 Sugawara Shigeru, Nakanishi Shoichi, ItohMasahide, Yatagai Toyohiko
journal orpublication title
Optics and lasers in engineering
volume 48number 4page range 448-452year 2010-04権利 (C) 2009ElsevierLtdURL http://hdl.handle.net/2241/105071
doi: 10.1016/j.optlaseng.2009.09.002
full title, Detection of falsification of security documents using white light interferometer all authors and their affiliations, ①Shigeru Sugawara1),2) ②Shoichi Nakanishi3) ③Masahide Itoh1) ④Toyohiko Yatagai1),4) [email protected] [email protected]
[email protected] 1)Institute of Applied Physics, University of Tsukuba,
Tsukuba,Ibaraki,305-8573,Japan 2)National Research Institute of Police Science, National Police Agency
Kashiwa, Chiba 277-0882, Japan 3)Tokyo Metropolitan Industrial Technology Research Institute,
Kita-ku, Tokyo 115-8586, Japan 4)Center for Optical Research and Education, Utsunomiya University,
Utsunomiya, Tochigi 321-8585,Japan complete contact information for the corresponding author, Abstract, In order to verify the authenticity of security documents, we propose the measurement of the surface distortion of the cover film of security documents. Surface shapes of films of 31 genuine documents and 29 counterfeit documents were measured by using a white light interferometer. Differences between the surface features of a genuine security document and those of a counterfeit one were studied. Roughness and peak-valley density were the two features used to characterize the measured surface shape. Only 2 out of 29 counterfeit documents could not be distinguished from the genuine ones by film distortion analysis. The likelihood ratio of this method in the authentication of genuine documents was 14.5. This implies that the proposed method is useful for authentication of genuine documents. Keywords. Security documents Authentication White light interferometer
1 Introduction Document verification is important for preventing crime. Traditional [1–3] as well as
recently developed [4,5] techniques are used for document examination. However, documents can be counterfeited in several ways, and therefore, it is desirable to examine them on the basis of various characteristics. The development of new techniques for document examination will increase the probability of detecting a counterfeit document. Therefore, a novel document examination method is strongly desired.
In our preliminary study, we have proved that there is a minute distortion on the film of laminated security documents. This distortion is a few micrometers in height and a few millimeters in size. The distortion appears to be different for genuine and counterfeit documents. However, the effectiveness of this method cannot be established by measuring a small number of samples. Therefore, in order to distinguish a document on the basis of the distortion on the cover film, we measured surface shapes of the films of several genuine and counterfeit documents. Feature measures of the distortion are defined by the surface shapes. The feature measures of genuine documents differ significantly from those of counterfeit ones.
Among the various surface measurement techniques that are currently available, we employ white light interferometry [6–10] to measure the surface shapes of the cover films of documents because it provides a high vertical resolution and low spatial resolution. This technique is suitable for the measurement of non-specular and nondiffuse surfaces.
2 Material and Methods 60 laminated security documents, including 31 genuine and 29 counterfeit ones, were
examined in this study. All the counterfeit samples were obtained from actual crime scenes and were verified as being counterfeit through microscopic inspection; however, it was not clear as to which documents were forged using the same tools and techniques. Further, only counterfeit documents with a PET (Polyethylene Terephthalate) cover film were collected and studied, because cover films of genuine documents are also made from PET.
2.1 Features of measured samples The surface shape of the film was measured using a white light interferometer
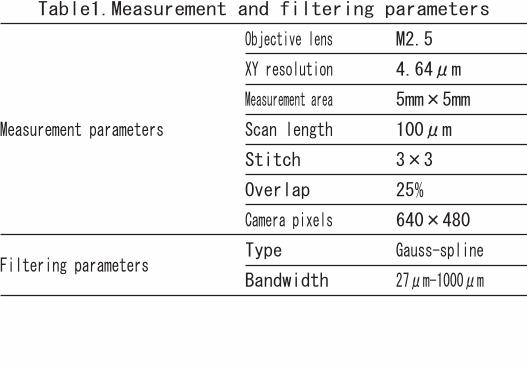
(NewView6000; Zygo Co.). The measurement parameters are shown in Table1. In order to perform measurements over a wide surface area, an object lens with the lowest
magnification was used in the interferometer. Furthermore, 3×3 images were combined by using the image stitching function of the apparatus, which yielded 5 mm × 5 mm surface profiles of the samples. To suppress the warp of the sample, vacuum stage was used. The horizontal resolution was 4.64 μm. Each sample was measured four times from four different positions. In order to suppress the influence of the transformation of a sample and spike noise, a spline-type band pass filter was applied to the measured surface profiles. The pass band of the filter ranged from 27 μm to 1000 μm.
The software “MetroPro”, was used in combination with the NewView interferometer for analyzing the measured surface profiles. The two features that were used to characterize the measured surface profiles were roughness and peak-valley density. Roughness is defined by the root-mean-square deviation of all points from a plane fit to the test surface. Roughness has a positive correlation with the distortion amplitude.
( )∫∫ −=S
dxdyzzrmsRoughness mean2)(
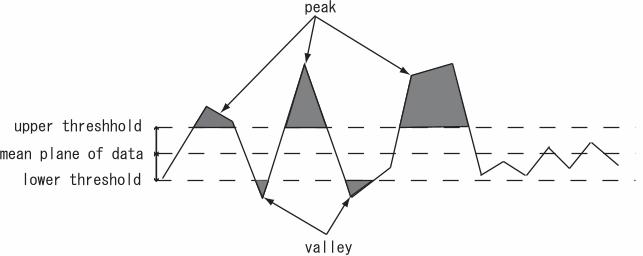
The peak-valley density was calculated as follows (Fig.1). First, the average height of the region was decided from the measured surface profile. Next, regions with heights greater than “the average height plus the roughness” were labeled “peak regions”. In contrast, regions with heights less than “the average height minus the roughness” were labeled “valley regions”. Then, the numbers of peak regions and valley regions were counted. Regions with areas of less than 10,000 μm2 were considered as noise and were not taken into account. Finally, the peak-valley density was calculated by determining the average of the number of peaks and valleys and dividing the average by the measurement area (4.5 mm × 4.5 mm). The peak-valley density has a positive correlation with the distortion wavenumber.
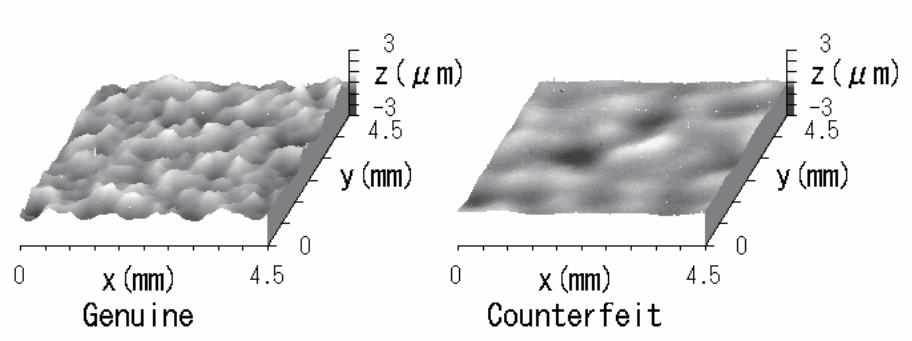
3 Results Figure2 shows examples of the measured surface profiles of a genuine document and a
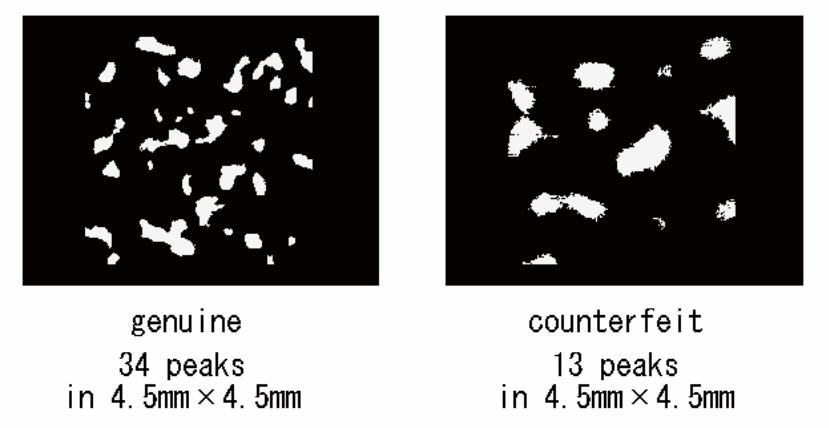
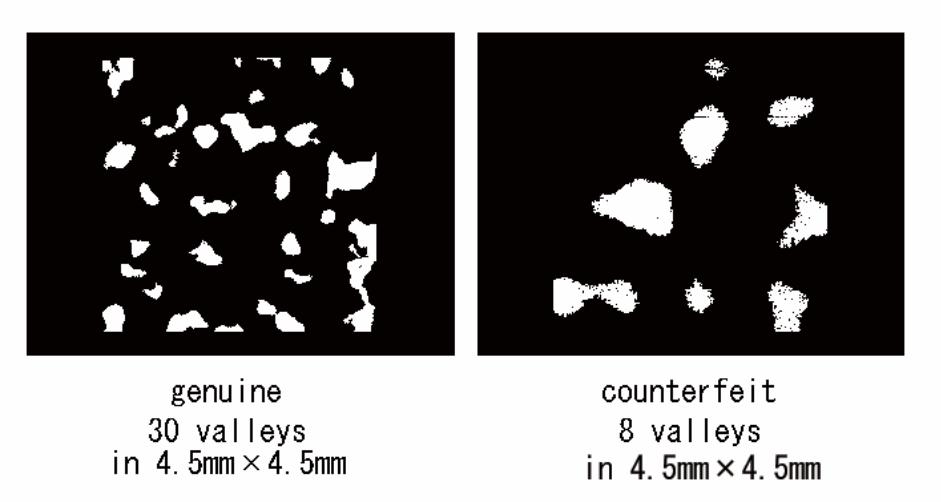
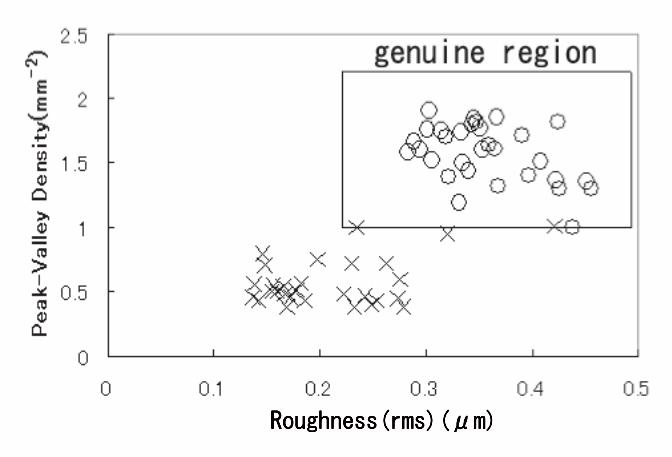
counterfeit one. Film distortion was observed not only in the case of counterfeit documents but also in the case of genuine ones. The distortion was a few micrometers in height and a few millimeters in size. The genuine documents had greater roughness than most of the counterfeit documents. Figures 3 and Figure4 show peak and valley regions of the samples shown in Figure2, respectively. The number of peaks and valleys on the cover films of genuine documents was found to be considerably greater than that on the cover films of counterfeit documents. Figure5 shows the roughnesses and peak-valley densities of all the samples. The roughnesses of the genuine documents were greater than those of most counterfeit documents. The same trend was observed
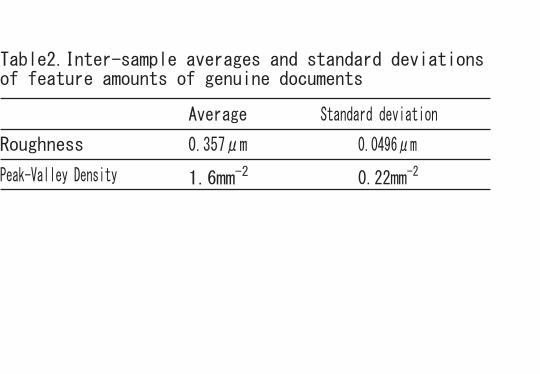
for the peak-valley densities. Table2 shows intersample averages and standard deviations of feature amounts of the genuine documents.
4 Discussion Table2 shows inter-sample averages and standard deviations of feature amounts for
the genuine documents. Under the assumption that the population of the genuine documents is a normal distribution, the guess value of the average of roughness of the population is 0.357μm. The guess value of the standard deviation of the roughness of the population is 0.0496μm. Because the number of genuine samples used in this study is 31, the degree of freedom of the t-distribution is 30. Therefore, the value of t with a probability of 99% is 2.75. The 99% confidence interval of the roughness is
0.357 μm ± 2.75 × 0.0496 μm
We defined this confidence interval as the genuine range for the roughness. Similarly, for the peak-valley density, the genuine range was defined as
1.6 mm–2 ± 2.75 × 0.22 mm–2
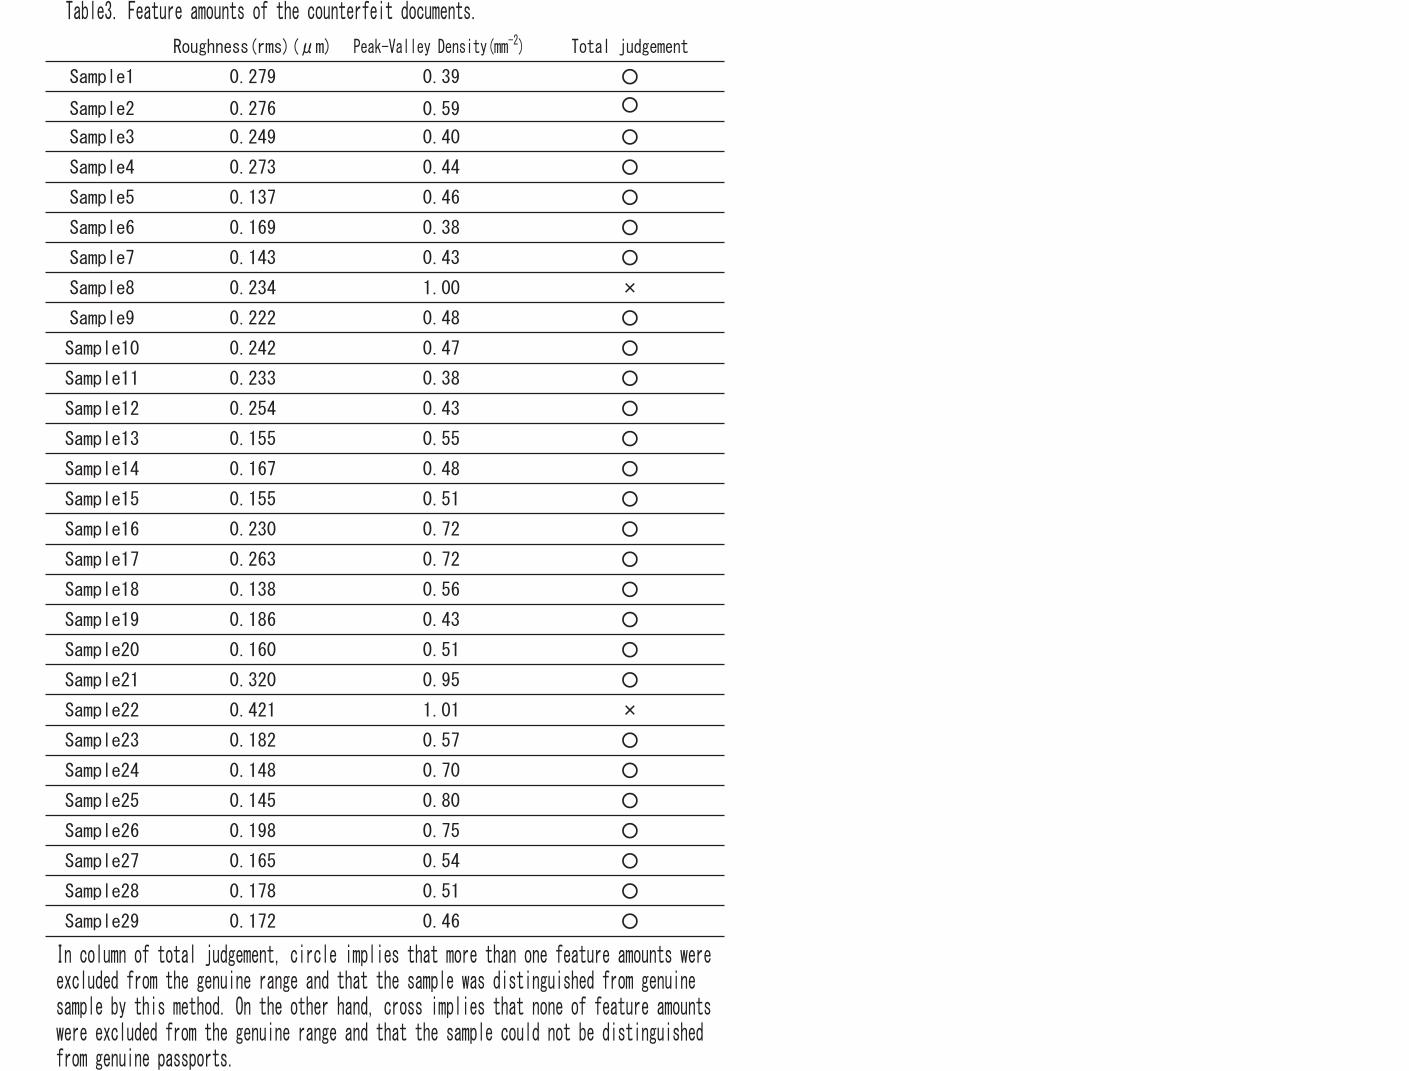
All the feature amounts of the genuine documents exist within the genuine range. It is preferable that all the feature amounts of the counterfeit documents lie outside the genuine range. However, some feature amounts are found to lie within the genuine range, as shown in Table3. 27 of 29 counterfeit samples have more than one feature amount that is excluded from the genuine range. Only two counterfeit samples do not have any feature amounts that are excluded from the genuine range. Therefore, only 2 counterfeit documents could not be distinguished from the genuine documents by film distortion analysis.
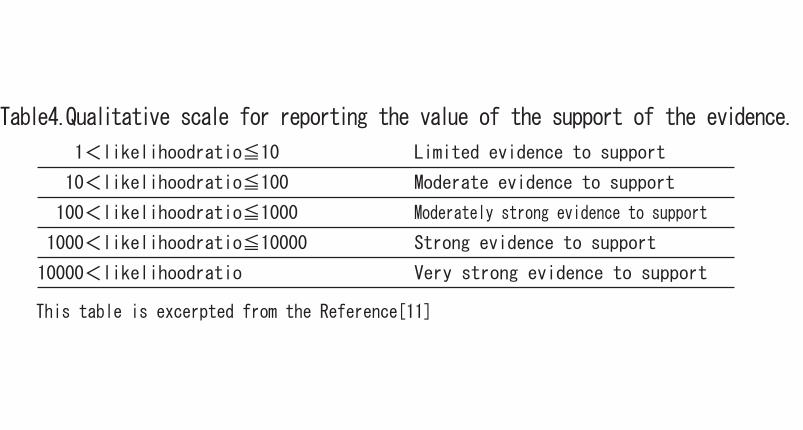
The likelihood ratio was calculated in order to evaluate the evidential value of our method used for verifying the authenticity of documents [11]. All of the 31 genuine documents were judged as genuine. Therefore, the probability of correct judgment of a genuine document was 31/31. 2 of the 29 counterfeit documents were misjudged as genuine. Therefore, the probability of misjudgment of a counterfeit document was 2/29. Thus, the likelihood ratio of the two probabilities was 14.5. It can be concluded that a document was 14.5 times likely to be judged as genuine if it was genuine than if it was counterfeit. According to the Jeffreys-Evett scale [12,13], a value of 14 = 101.15 is said to increase the support for genuine against counterfeit (Table4). Therefore, this method is effective in the authentication of documents.
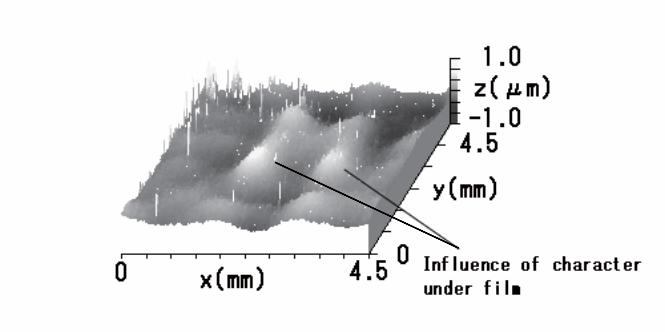
The influence of characters that are printed under the film of the document on the measurement result is also discussed. In the case of genuine documents, the printed characters did not influence the measurement result. This is because characters on the
genuine documents are printed using planographic printing. In planographic printing, the ink is soaked by the paper and therefore, there are no particles between the paper and the film. On the other hand, in the case of counterfeit documents, the printed characters occasionally influenced the measurement result as shown in Figure6. This is because toner equipments are used to print characters on forged documents. The toner does not get soaked by the paper, due to which toner particles remain between the paper and the film. As a result, the film distortion was influenced by the toner. In that case, measurement is performed at that position where a character is not printed, a correct result is obtained.
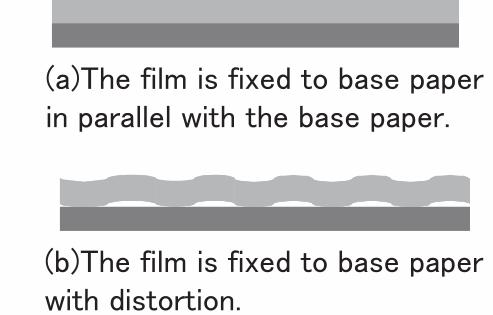
The genuine and counterfeit documents that were used in this study were in actual use before we carried out the film distortion analysis. As a result, several other contaminants may have been added to the samples. However, there was still a significant difference between the measurement results of the genuine documents and those of counterfeit documents. This difference indicates that the distortion measured by this technique is not easily influenced by the prior use of the document. This is because we are not measuring the transformation of the sample but the film distortion caused by the lamination of the film on the base paper. The film is fixed to base paper with some distortion and is not perfectly parallel to the base paper. However, the distortion of the film is permanent (Figure7). Therefore, even when the sample is placed horizontally on a sample stand, the same measurement result is always obtained even with a warped sample.
5 Conclusions
The authors proposed a method for document examination by using white light interferometric measurement of the distortion of films pasted on the base paper. Two feature indices, namely, roughness and peak-valley density were used to characterize the measured surface profile. Only 2 of 29 counterfeit documents could not be distinguished from the genuine ones by film distortion analysis. The likelihood ratio of this method in the authentication of genuine documents was 14.5. In conclusion, this interferometric method is effective for the practical authentication of laminated security documents.
Acknowledgements
We express our sincere gratitude to the researchers at Canon Marketing Japan Inc. for providing valuable advice.
References
[1] Levinson J. Passport examination. Journal of Forensic Sciences 1984; 29(2): 628-632. [2] International Civil Aviation Organization. Security standards for machine readable
travel documents: Excerpts from ICAO Doc9303 Part1 Fifth Edition; 2003.
[3] Hayosh T. D. Self-authentication of value documents. SPIE 1998; 3314: 140-149. [4] Sugawara S. Passport Examination by Polarized Infrared Spectra. Journal of
Forensic Sciences 2007; 52 (4): 974 - 977. [5] Jess E. Dines. Document Examiner Textbook, Pantex Intl Ltd; 1998. [6] Yatagai T. Recent Progresses in White Light Interferometry. Proc. SPIE 1994;
2340:338-345. [7] Youngquist R. C, Carr S, Davis D. E. N. Optical Coherence-domain reflectometry: a
new optical evaluation technique. Opt. Lett. 1987; 12: 158-160. [8] Kino G. S, Chim S. S. C. Mirau correlation microscope. Appl. Opt. 1990;
29:3775-3783. [9] Itoh M, Tian R, Yatagai T. Absolute measurement of 3-D shape using white-light
interferometer. Proc. SPIE 1992; 1775: 24-28. [10] Dresel T, Hausler G, Venske H. Three-demensional sensing of rough surface by
coherence radar. Appl. Opt. 1992; 31: 919-925. [11] Aitken C. G. G. Statistics and the evaluation of evidence for forensic scientists,
John Wiley and Sons Inc; 2004. [12] Jeffreys H. Theory of Probability, 3rd edition, Claredon Press, Oxford; 1983.
[13] Evett I. W. Bayesian inference and forensic science: problems and perspectives. The Statistician 1987; 36: 99-105.
Fig.1 Schematic diagram of peak valley analysis. Fig.2 Examples of measured surface profiles of a genuine document and a counterfeit document. Fig.3 Peak areas of a sample in Figure2.White areas are peak areas. Fig.4 Valley areas of a sample in Figure2.White areas are valley areas. Fig.5 The roughness (rms) and the peak-valley density. White circle implies genuine documents and black cross implies counterfeit documents. Fig.6 Influence of character under film. Fig.7 Pattern diagrams of film fixation to base paper.