Embed Size (px)
Citation preview

279
17.1 INTRODUCTION
According to a WHO report, in 2002, the estimated num-ber of people with blindness worldwide was about 37 mil-lion (Resnikoff et al. 2004). Since adults 50 years of age and older account for more than 82% of all blind people, the current prevalence is expected to increase with the aging of the population. The leading cause of blindness is cataracts, which account for approximately 50% of cases. Other main causes include glaucoma, age-related macu-lar degeneration (AMD), corneal opacities, and diabetic retinopathy (DR). In developed countries, glaucoma is the second leading cause of vision loss after AMD. While blindness is unavoidable with AMD, for other diseases, known effective strategies for elimination, screening, and early treatment are critical for the prevention of total blindness.
In a clinical visit, ophthalmologists generally examine the condition of a patient’s eye through an ophthalmoscope. While ophthalmoscopy is simple, low cost, and versatile, it is a real-time examination, and the images cannot be stored. Therefore, for screening, diagnostic records, and longitudi-nal comparisons, retinal fundus photography is frequently and widely used. In reading retinal fundus images, physi-cians must look for various signs of abnormalities. However, both the number of qualified professionals and their time are limited. To reduce physicians’ workload and improve diagnostic efficiency, computer-aided diagnosis of retinal fundus images can be helpful, especially in screening exams in which a large number of normal images are obtained (Fujita et al. 2008). Computerized analysis can also be useful for quantitative measurements of various diagnostic param-eters for consistent assessment and follow-up examinations.
Chapter 17
Detection of Eye Diseases
Chisako Muramatsu and Hiroshi Fujita
CONTENTS
17.1 Introduction 27917.2 Detection of Normal Structures in Retinal Fundus Images 280
17.2.1 Public Databases for Retinal Image Analysis 28017.2.2 Detection and Segmentation of Optic Nerve Head 281
17.2.2.1 ONH Localization 28117.2.2.2 ONH Segmentation 282
17.2.3 Segmentation of Retinal Blood Vessels 28317.3 Computerized Diagnosis of Glaucoma in Retinal Fundus Images 284
17.3.1 Detection of Retinal Nerve Fiber Layer Defect 28417.3.2 Analysis of Optic Nerve Head 285
17.3.2.1 Determination of CDR on Plain Photograph 28617.3.2.2 Determination of CDR on Stereo Photographs 286
17.4 Computerized Diagnosis of Diabetic Retinopathy 28817.5 Computerized Diagnosis of Hypertensive Retinopathy and Arteriosclerosis 289
17.5.1 Measurement of Arteriolar-to-Venular Diameter Ratio 28917.5.2 Detection of Arteriovenous Crossing Phenomenon 290
17.6 Emerging Topic: Computer Analysis of Optical Coherence Tomography 29117.7 Conclusion 291Appendix 17.A: Public Databases for Retinal Image Analysis 291References 293

Detection of Eye Diseases280
17.2 DETECTION OF NORMAL STRUCTURES IN RETINAL FUNDUS IMAGES
The retinal fundus is the only part of the body where blood vessels can be directly observed. A retinal fundus photo-graph is obtained using a specialized camera system that illuminates the retinal fundus through the pupil and uses a flash of light reflected from the fundus to obtain an image. Figure 17.1a shows a rough sketch of an eye cross section. Retinal blood vessels enter the eyeball through the optic nerve head (ONH) and run inside the retinal nerve layer. Usually, there are four pairs of large arteries and veins extending from the ONH to the upper and lower nasal sides and the upper and lower temporal (ear) sides. The ONH is shaped like a pit as a result of the entering nerve fibers. The state of this dent, called a cup, and the rim constituted by the nerve fibers are important for the diagnosis of glau-coma. The main structures observed in a retinal fundus image include the retinal blood vessels; the ONH, also called the optic disk; and the fovea (Figure 17.1b).
The major purposes for screening by retinal fundus examinations include, but are not limited to, the assessment of hypertensive changes, the diagnosis of DR, and the diag-nosis of glaucoma. To detect these diseases, it is important to first identify or segment normal structures, such as blood vessels, the ONH, and fovea, because they can serve as land-marks for image processing and are occasionally sources of false positives in the detection of pathologic lesions. In fact, most of the previously reported CAD schemes include algo-rithms for detecting these normal structures.
17.2.1 Public Databases for Retinal Image Analysis
There have been numerous studies on the detection and segmentation of the ONH and retinal blood vessels. Many of these studies utilize public databases, such as the Structured Analysis of the Retina (STARE) and the Digital Retinal Images for Vessel Extraction (DRIVE) databases. The STARE database, which is the oldest, is often used for the evaluation of ONH localization and vessel segmentation algorithms. Some of the images contain pathologic lesions, which make the tasks chal-lenging. The DRIVE database may be the most widely used and cited of all public retinal databases. The com-parison results from some algorithms published by dif-ferent groups are presented on the website (Niemeijer et al. 2004). The MESSIDOR database, which includes 1200 images, is the largest database. It provides retinopa-thy and macular edema grades for each image; however, their locations are not specified. The Retinopathy Online Challenge (ROC) project was organized for the automatic detection of microaneurysms. The database provides 50 training cases with a reference standard, and 50 test cases without. Using this database, an algorithm compe-tition was held at the CAD Conference of SPIE Medical Imaging 2009. There are several other databases avail-able for the development and comparison of computer algorithms, and they are listed in Appendix 17.A. The relatively early availability of these public retinal fundus image databases compared to other medical images may have promoted CAD research.
Temporalside
Fovea
ONH
Nasalside
(b)
Sclera
Choroid
Fovea
Retina
Zonules
Lens
ONH
(a)
Cornea
Iris
Figure 17.1 (a) A rough sketch of a cross section of an eye. (b) A retinal fundus photograph of a right eye.
Dow
nloa
ded
by [
Chi
sako
Mur
amat
su]
at 1
8:54
24
Mar
ch 2
015

17.2 Detection of Normal Structures in Retinal Fundus Images 281
17.2.2 Detection and Segmentation of Optic Nerve Head
A number of groups have been investigating automated methods for the detection and segmentation of ONHs. The ONH has an oval shape where large vessels converge, and it appears as a bright region on a retinal fundus image. On the basis of these characteristics, many detection algorithms utilize pixel thresholding techniques, and some algorithms use the information of vessel orientation. For segmentation, edge information is often used along with techniques such as Hough transformation and deformable models. While it is not difficult for a human to identify the ONH, automatic detec-tion can eliminate the need for manual intervention during preprocessing for other tasks. On the other hand, automatic segmentation results can be used for shape analyses, such as the automatic measurement of disk areas and diameters.
In general, relevant preprocessing is carried out before detecting and segmenting the ONH in most CAD schemes. Some common preprocessing tasks include smoothing opera-tion for noise reduction and/or the removal of small bright lesions, morphological closing operation for vessel removal, luminosity or contrast normalization (linear contrast enhance-ment), and illumination equalization (background correc-tion) to compensate for uneven brightness, which generally decreases toward the field of view (FOV) borders. To exclude the region outside the FOV from the analysis, a mask image can be created simply by applying the thresholding technique with supplemental morphological closing. Occasionally, mirroring or FOV extension is performed to eliminate the edge effect.
A retinal fundus image generally consists of three color components, red, green, and blue (RGB). Based on the bright characteristic of the ONH, green is a popular color plane used for ONH detection because the red component may sometimes saturate, and the blue component does not pro-vide much information other than noise. Another frequently used component is the luminance, or intensity, of the hue–saturation–luminance/intensity (HLS or HSI) representa-tion, which is convertible from the RGB space. Some studies have employed Lab space (Osareh et al. 2002; Kande et al. 2009). Three color (RGB) planes can be processed indepen-dently, and the results can be combined to obtain maximal information (Carmona et al. 2008).
17.2.2.1 ONH LocalizationAutomated detection of the ONH is relatively straightfor-ward for normal cases; however, it can be difficult in cases with pathologic lesions. In normal cases, one can look for the brightest circular region of a certain size. However, in abnormal cases, other bright lesions, such as exudates, may also be detected, the ONH may be occluded by pathologic lesions, or the ONH boundary may become unclear. To
overcome such difficulties, a variety of schemes have been proposed for ONH detection. Although the ONH region is generally bright in retinal fundus images, large vessels com-ing into the ONH appear dark.
On the basis of this observation, the region with the highest variation in brightness can be considered as the probable loca-tion of the ONH (Sinthanayothin et al. 1999). Another strategy is to search for a bright circular region. The edges are detected and used in template matching (Lalonde et al. 2001) or Hough transformation (Chrastek et al. 2004; Aquino et al. 2010; Zhu et al. 2010) in order to locate and/or segment circular objects. In addition, the blood vessel network is an important feature for locating the ONH. The convergence of vessels (Hoover and Goldbaum 2003) and their orientation (Foracchia et al. 2004; Youssif et al. 2008) can indicate the origin of major vessel arches (vertex of parabolas), where the ONH lies. For these approaches, retinal blood vessels must be detected and thinned. The positional relationship between normal structures may be nontrivial information in the search for their locations. The fovea is located on or near the axis of the vessel parabola with its vertex at the ONH at a distance of about twice the diameter of the ONH. Such information can be used to create a probabil-ity or reliability map (Perez-Rovira and Trucco 2008).
In many cases, several pieces of information regarding the brightness, blood vessels, and their positional relationship are combined to make the ultimate decision. These features can be used to create probability maps, which would be combined with the prior probability map based on the location of the ONH in training cases, and the posterior probability map suggests the likeliest position (Tobin et al. 2007). In another method, these data are entered into a statistical learning machine, namely, the k-nearest neighbor (kNN) regressor (Devroye et al. 1996), in order to estimate the distances of each pixel to the ONH and fovea (Niemeijer et al. 2009). The pixel with the short-est distance to the ONH is determined as the point of interest after smoothing. Some of these studies have been evaluated using common databases, thus facilitating comparison of their results (Perez-Rovira and Trucco 2008; Zhu et al. 2010).
Most, if not all, of the computer algorithms introduced earlier have achieved high sensitivity rates (above 90%) for ONH detection. Accurate segmentation of the ONH can be even difficult for humans in cases where the ONH is titled or peripapillary chorioretinal atrophy (PPA) is present. In fact, intra- and inter-reader variations are known to exist, although much smaller than those for cup segmentation (Tielsch et al. 1988; Verma et al. 1989). In our experience, the agreement of disk segmentation between readers in terms of the ratio of the region of intersection to the region of union ranged from 0.90 to 0.94 (Muramatsu et al. 2011b). This small but significant variation may make consistent evaluation of the segmentation results difficult, due to the absence of a concrete gold standard.
Dow
nloa
ded
by [
Chi
sako
Mur
amat
su]
at 1
8:54
24
Mar
ch 2
015

Detection of Eye Diseases282
17.2.2.2 ONH SegmentationSeveral research groups have proposed automated schemes for segmentation of the ONH. The common procedure is to first detect the approximate location of the ONH, followed by a precise segmentation. In one study, the bright region with a prespecified range of areas is roughly extracted, and then after suppressing major vessels with a closing operation, the ONH is segmented using the watershed method (Walter and Klein 2001). In another study, the optic nerve region is trans-formed to a polar coordinate system, and an optimal path corresponding to the ONH border is searched using a cost function based on edge strength, texture, and smoothness constraints (Merickel et al. 2006). A model-based approach can be used to extract normal structures (Li and Chutatape 2004). Landmarks are placed on the border of the ONH and on a large vessel inside the ONH, and the size and orienta-tion of the ONH are adjusted by matching these points to those of the model created with training cases.
A popular strategy is the use of deformable models such as Snakes (Osareh et al. 2002; Xu et al. 2008), circu-lar deformable model (Lowell et al. 2004), level set method (Wong et al. 2008), or another deformable model (Kande et al. 2009). In these methods, the plausible outline is deter-mined by energy optimization, which is generally based on edge strength and smoothness. When employing a deform-able model, the initialization may strongly influence the final results. One group proposed a method using genetic algorithm (GA; Carmona et al. 2008), in which probable edge points, called hypothesis points, where the brightness drops radically are first searched radially, and the GA determines the ellipse that includes the largest number of hypothesis points. A pixel classification method was investigated by the
same research group (Abramoff et al. 2007) that proposed the pixel regression method for ONH detection. In this method, the pixels around the ONH region are classified as rim, cup, and background by using the kNN classifier and Gaussian filter bank features.
Authors have compared three different methods: the Snakes active contour model and two pixel classification methods using fuzzy c-means (FCM) clustering and a neu-ral network (NN; Muramatsu et al. 2011b). In this study, the approximate location of the ONH is determined by selecting the center of a region with a maximum area that satisfies the circularity criterion after applying a percentile thresh-olding method. Edge detection is performed by applying the Canny edge detector on the blood-vessel-erased image, which will be described in the next section. For Snakes, the ONH contour is determined by energy minimization based on edge information and contour smoothness. For FCM and NN, images features, such as the original pixel values, the pixel values in surrounding pixels, the con-trast, and edge information, are used. These methods were evaluated using separate datasets obtained by two camera systems. In this study, the active contour model and the NN-based method achieved slightly better performance than the FCM-based method, although the difference was very small. The results from the three methods are shown in Figure 17.2.
The results of computer algorithms are often evaluated by comparison with manual contours. Current computer-ized segmentation schemes work fairly well for normal cases with decent image quality; however, it seems that accurate segmentation of low contrasted ONHs and ONHs with PPA still remains a subject for future investigation.
(a) (b) (c) (d) (e)
(f ) (g) (h) (i)
Figure 17.2 Results of ONH segmentation by the three methods. (a) Original image, (b) manual outline by an ophthalmologist, (c) red channel image of the blood-vessel-erased image, (d) edge image, (e) outline by the Snakes method, (f) pixel classification result by the FCM method, (g) outline by the FCM method, (h) pixel classification result by the NN method, and (i) outline by the NN method.
Dow
nloa
ded
by [
Chi
sako
Mur
amat
su]
at 1
8:54
24
Mar
ch 2
015

17.2 Detection of Normal Structures in Retinal Fundus Images 283
17.2.3 Segmentation of Retinal Blood Vessels
As mentioned earlier, the retinal blood vessels can be observed in retinal fundus images without the use of a con-trast agent. Although fluorescence images can be obtained with a contrast agent to better visualize capillaries and microaneurysms, they are not routinely utilized. In fundus photographs, blood vessels appear dark and decrease in cal-iber size from the ONH periphery toward the macula region and the edge of the FOV. Normally, arteries are slightly nar-rower and lighter red than the collateral veins. In principle, automated segmentation schemes for retinal vessels may be similar to the vessel segmentation methods in angiography and other segmentation algorithms for linear objects.
There have been numerous studies aimed at retinal ves-sel segmentation in fundus images, and it is still an active research topic. The fundamental procedures include pre-processing of images, vessel enhancement by various filters, and the final determination of vessel regions. Because the green component of RGB images gives the highest contrast for blood vessels, the majority of the computerized schemes utilize green-channel images. In rare cases, red-free images and other color representations are used. The preprocessing techniques include a smoothing operation for noise reduc-tion, contrast normalization, and illumination equaliza-tion, which are also employed in ONH segmentation. One preprocessing technique that may be distinctive for the vessel segmentation is a morphological opening operation to reduce the effect of the central light reflex (Marin et al. 2011). Although the profile of a vessel is generally Gaussian shaped, when a flash of light is reflected by the blood, the central part may appear brighter than the vessel walls. This effect, called the central light reflex, can potentially cause some parts of vessels to be misdetected. A morpho-logical opening with a small kernel size may remove these centerlines.
Many variations in filters, vessel models, and other oper-ators are applied for the enhancement or segmentation of blood vessels. Some of these can be grouped as top-hat filters (Condurache and Aach 2006; Mendonca and Campilho 2006; Marin et al. 2011), Gabor filters (Chen and Tian 2008), matched filters with Gaussian profiles (Sofka and Stewart 2006; Al-Rawi et al. 2007; Wu et al. 2007; Kande et al. 2010b; Villalobos-Castaldi et al. 2010), line operators (Mendonca and Campilho 2006; Perfetti et al. 2007; Farnell et al. 2008), and Hessian-based operators (Condurache and Aach 2006). A top-hat filter can enhance a signal that is smaller than the filter element. A popular filter shape is a circle with a diam-eter larger than that of the thickest vessel. However, this fil-ter would also enhance round objects. Other filters, such as Gabor filters, Gaussian filters, and line filters, are intended to selectively enhance tube-like objects. To enhance ves-sels of various sizes, filters with multiple sizes in different
orientations must be applied. In many studies, the filters are rotated in 12 different directions every 15°. In order to reduce computational costs, a specific direction can be selected in advance by calculating the derivative or the Hessian matrix (Wu et al. 2007; Chen and Tian 2008). Although vessels with different sizes can be enhanced simultaneously with the Hessian-based approach, the edges are also enhanced. In such cases, the presence of parallel edges in which the gradients are in opposite directions is used to distinguish between vessels and edges (Cai and Chung 2006; Sofka and Stewart 2006; Salem et al. 2007). Derivative-based methods are also used to detect ridges, and as a result, the center-line pixels of vessels are determined (Staal et al. 2004; Garg et al. 2007; Salem et al. 2007). Using the centerlines, vessel regions can be segmented by the region growing method, or features can be determined, which are then used in the classification step.
When vessel-like structures are enhanced by filtering, vessel segmentation can be achieved by simply applying a threshold (Al-Rawi et al. 2007; Perfetti et al. 2007; Anzalone et al. 2008; Farnell et al. 2008) or using clustering meth-ods, such as an FCM clustering (Kande et al. 2010). In other studies, features were determined based on the filter out-put and/or the original images, which were then employed for classifying vessel pixels and nonvessel pixels using vari-ous classifiers, such as kNN (Staal et al. 2004), SVM (Ricci and Perfetti 2007), NN (Marin et al. 2011), Bayesian classi-fier (Soares et al. 2006), and hysteresis classifier, which is a combination of two linear classifiers (Condurache and Aach 2006).
Using thresholding and pixel classification methods, part of a vessel may be missed. One simple way to fill these gaps is a morphological operation; however, when the gaps are large, they cannot be successfully filled. Instead, because all vessels must be connected to the large vessels near the ONH, various vessel-tracing schemes have been proposed. In some methods, several seed points are selected on pix-els with a high likelihood of a vessel, and then the vessels can be traced in the likely direction (Delibasis et al. 2010), or eight neighbor pixels may be tested for their vessel likeli-ness (Vlachos and Dermatas 2010). In another method, first, a strict threshold is applied, and then in the tracked local window, a less strict threshold is selected (Cai and Chung 2006). In this way, low-contrast vessels can be detected without a large increase in false-positive detection.
Authors of this chapter have also attempted to perform the segmentation of blood vessels as a part of various CAD schemes, which will be introduced in the later sections. The presence of blood vessels can be an obstacle for both the detection of pathologic lesions and segmentation of the ONH. In these cases, blood vessels are detected by the use of the top-hat filter, and pixels corresponding to the ves-sels are interpolated by the surrounding retinal pixels to
Dow
nloa
ded
by [
Chi
sako
Mur
amat
su]
at 1
8:54
24
Mar
ch 2
015

Detection of Eye Diseases284
create a blood-vessel-erased image (Nakagawa et al. 2008). In the method for vessel diameter measurement, a modi-fied method based on a combination of the top-hat filter and the double ring filter is used to improve the sensitivity and specificity when segmenting large vessels (Muramatsu et al. 2011a).
For the evaluation of computerized segmentation, receiver operating characteristic (ROC) analysis is often used. Because most of pixels in retinal fundus images con-stitute nonvessel pixels (generally more than 85%), the performance, in terms of area under the curve, appears to be relatively high (above 0.90). Other indices include mea-sures of overlap in vessel pixels, such as the fraction of pix-els correctly identified as vessel (sensitivity) or the ratio of the area of intersection to the area of union. In the evalua-tion, manual segmentation results are considered the gold standard. However, the manual segmentation process is a time-consuming and difficult task due to the low contrast of tiny vessels. In addition, vessel walls are often diffused making it difficult to determine the exact borderlines. Segmentation can vary depending on the reader, since one reader may trace further down to very thin peripheral vessels than others. As a result, inter-reader variation can be seen to some extent in manual segmentation results. In fact, the accuracy of segmentation, based on the pixel-wise sensitivity and specificity, by a second observer in the DRIVE database is 0.95, with a κ statistic value of 0.76. Many studies of retinal vessel segmentation schemes have utilized public databases for comparative evaluation and because of the availability of the gold standard. The results of some earlier studies can be visually compared and tabu-lated on the DRIVE website.
17.3 COMPUTERIZED DIAGNOSIS OF GLAUCOMA IN RETINAL FUNDUS IMAGES
Glaucoma is the second leading cause of vision loss in the world, and it is expected to affect about 80 million people in the year 2020 (Quigley and Broman 2006). Because of its slow progressive nature, many patients are unaware of this visual disturbance until the disease reaches an advanced stage. In a population-based prevalence survey of glaucoma in Tajimi, Japan, it was found that 93% of examinees who had primary open-angle glaucoma were previously undiag-nosed (Iwase et al. 2004). Early detection of glaucomatous changes is the key to minimizing the chance of significant visual disability. Glaucoma is generally diagnosed by a combination of several tests, which may include ophthal-moscopy, intraocular pressure measurement, visual field testing, retinal fundus photography, Heidelberg retinal tomography (HRT), scanning laser ophthalmoscopy, and
optical coherence tomography (OCT). A retinal fundus pho-tograph is often obtained as a diagnostic record not only for glaucoma but also for other eye diseases. In addition, it can sometimes be used in internal medicine. Because of its relatively simple procedure and low cost, it is well suited for screening examinations.
17.3.1 Detection of Retinal Nerve Fiber Layer Defect
One of the earliest signs of glaucoma are retinal nerve fiber layer defects (NFLDs), which can be observed as dark stria-tions extending from the ONH. There have been several studies about the analysis of NFL using different image modalities, such as fundus photography, scanning laser polarimetry, and OCT. However, to the authors’ knowledge, only a few studies have reported the computerized detec-tion and quantification of NFLDs in retinal fundus images. Because retinal fundus photography is widely used, com-puterized analysis of NFL on fundus photographs could be very informative.
In the earliest study, NFL striation measurement was attempted by comparing the variation in pixel values across the NFL to that along the NFL (Peli et al. 1989). Another group proposed quantification of NFL based on the inten-sity profile around the ONH. The thickness of the NFLD was measured by taking the first derivative of the intensity profile upon locating its borders (Lee et al. 2004). Texture analysis of NFL may be useful for the detection of cases with NFLD. Using the texture features from the gray level run length matrix, normal eyes and eyes with NFLD were classified by linear discriminant analysis (LDA; Yogesan et al. 1998). The use of other texture features based on the Markov random field was suggested, which was found to be potentially useful for classifying regions of NFLD in glau-coma patients and regions of NFL in normal patients; how-ever, the distinction between defected and nondefected regions in glaucoma patients was more difficult (Kolar and Vacha 2009).
A computerized detection method for NFLDs based on image transformation and Gabor filtering has been investi-gated (Muramatsu et al. 2010). To facilitate NFLD detection, the images are transformed such that the NFLDs, which are shaped like curved bands or fans in the original images, appear relatively straight. The approximate directions of the nerve fibers in a fovea-centered image are modeled by a set of elliptic lines with respect to the ONH center, and an image transformation is performed that is similar to a polar transformation. After brightness correction, the verti-cally oriented Gabor filters are applied to enhance NFLDs, and the NN is employed for the classification of candidate regions based on some simple image features. This series of procedures is illustrated in Figure 17.3.
Dow
nloa
ded
by [
Chi
sako
Mur
amat
su]
at 1
8:54
24
Mar
ch 2
015
17.3 Computerized Diagnosis of Glaucoma in Retinal Fundus Images 285
In earlier studies, small numbers of cases (less than 15 cases) were used in the evaluation (Peli et al. 1989; Yogesan et al. 1998; Lee et al. 2004). In one study, glaucoma cases with NFLD and normal cases were classified with 80%–90% accuracy (Yogesan et al. 1998). Sampled regions of interest were analyzed in two studies; the determined feature was moderately correlated (approximately 0.6) with the disease grading by two observers in one study (Peli et al. 1989), whereas defected regions and normal regions sampled from 30 cases were distinguished with 96% accuracy in another (Kolar and Vacha 2009). In our study, a sensitivity of 90% with 1.0 false positive per image was achieved in 81 cases with NFLDs and 81 cases without NFLDs (Muramatsu et al. 2010). Further investigations are expected for the analysis of retinal nerve fibers.
17.3.2 Analysis of Optic Nerve Head
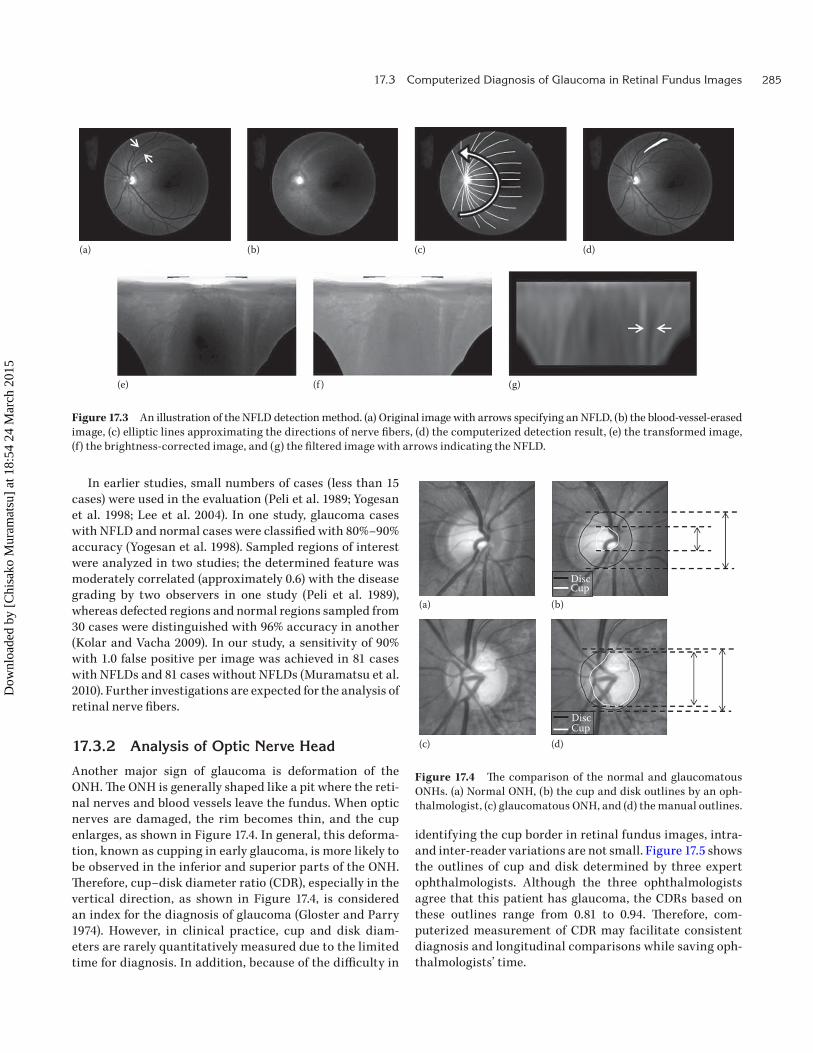
Another major sign of glaucoma is deformation of the ONH. The ONH is generally shaped like a pit where the reti-nal nerves and blood vessels leave the fundus. When optic nerves are damaged, the rim becomes thin, and the cup enlarges, as shown in Figure 17.4. In general, this deforma-tion, known as cupping in early glaucoma, is more likely to be observed in the inferior and superior parts of the ONH. Therefore, cup–disk diameter ratio (CDR), especially in the vertical direction, as shown in Figure 17.4, is considered an index for the diagnosis of glaucoma (Gloster and Parry 1974). However, in clinical practice, cup and disk diam-eters are rarely quantitatively measured due to the limited time for diagnosis. In addition, because of the difficulty in
identifying the cup border in retinal fundus images, intra- and inter-reader variations are not small. Figure 17.5 shows the outlines of cup and disk determined by three expert ophthalmologists. Although the three ophthalmologists agree that this patient has glaucoma, the CDRs based on these outlines range from 0.81 to 0.94. Therefore, com-puterized measurement of CDR may facilitate consistent diagnosis and longitudinal comparisons while saving oph-thalmologists’ time.
(e) (f ) (g)
(a) (b) (c) (d)
Figure 17.3 An illustration of the NFLD detection method. (a) Original image with arrows specifying an NFLD, (b) the blood- vessel-erased image, (c) elliptic lines approximating the directions of nerve fibers, (d) the computerized detection result, (e) the transformed image, (f) the brightness-corrected image, and (g) the filtered image with arrows indicating the NFLD.
(a)
(c) (d)
DiscCup
(b)
DiscCup
Figure 17.4 The comparison of the normal and glaucomatous ONHs. (a) Normal ONH, (b) the cup and disk outlines by an oph-thalmologist, (c) glaucomatous ONH, and (d) the manual outlines.
Dow
nloa
ded
by [
Chi
sako
Mur
amat
su]
at 1
8:54
24
Mar
ch 2
015

Detection of Eye Diseases286
17.3.2.1 Determination of CDR on Plain Photograph
Despite the difficulty in determining cup boundaries on ret-inal fundus images, a few research groups have investigated computerized methods for measuring CDRs. Using red and green color planes for disk and cup, respectively, closing and opening operations were applied for smoothing edges and removing some white lesions, and the CDR was deter-mined by measuring the remaining areas using a simple thresholding technique (Nayak et al. 2009). In another study, the level set method was applied to the green plane, and the cup region was determined by fitting an ellipse to the con-vex points on the output (Zhang et al. 2009). These methods utilize the fact that the cup regions appear brighter than the rim regions. When ophthalmologists read images, they also take into account the vessel directions and their bending points. By detecting the retinal vessels and identifying their kinks inside the optic disk, the cup contour may be deter-mined (Wong et al. 2010).
Because the determination of cup borders is difficult, especially on the temporal side, due to the absence of clear edges and the sparseness of reference vessels, a method for estimating the CDR using the pixel value profiles in the vertical direction was proposed (Hatanaka et al. 2010). After automated determination of the disk outline, several vertical profiles near the center of the disk were obtained from the blood-vessel-erased images. These pro-files were averaged and smoothed to reduce the effect of noise, and the cup border points were determined on the basis of the second derivative of the profile. The vertical profiles for normal and glaucomatous cases are shown in Figure 17.6.
17.3.2.2 Determination of CDR on Stereo Photographs
As mentioned earlier, determination of the cup bound-ary in a plain photograph is difficult even for well-trained ophthalmologists. Therefore, to capture the 3D structure of the ONH, stereo imaging was suggested. Stereo retinal fundus cameras have been marketed by several companies.
Using these devices, a pair of images focused on the ONH, generally with a narrow optic angle, is obtained simultane-ously or with an instant delay. Some computerized meth-ods have been proposed for determining CDR in stereo images. In one study, stereo disparities were determined by calculating the cross-correlation in edge-enhanced images. The cup and disk contours were determined semi-automatically based on iso-disparity contours (Corona et al. 2002). Another group investigated two matching methods, including cross-correlation and minimum fea-ture difference, for disparity determination (Xu et al. 2008). In their method, the disk contour was determined using a deformable model, and then the cup margin was located at a prespecified depth from the disk margin. As introduced earlier, the regions of the cup, rim, and background (ret-ina) were determined by the pixel classification method on stereo images by another group (Abramoff et al. 2007). In addition to the color-based features, stereo disparity fea-tures were included for the classification, and the CDR was determined by counting the numbers of pixels in the cup and rim groups.
The cross-correlation for the disparity measurement was also utilized by another group (Nakagawa et al. 2008). The disk region was determined using one image of the pair that was imaged first, and then the corresponding region in the other image was extracted by global matching based on the cross-correlation. An apparent disparity due to the patient’s motion can be disregarded by this procedure, so that the real disparity due to depth remains. The depths were deter-mined at every four pixels by locating the corresponding points with local cross-correlation. Figure 17.7 shows a depth map reconstructed using this method and the corre-sponding HRT image. The cup outline was determined by searching for the maximum gradient points in radial direc-tions in the depth map.
Same as the evaluation of disk segmentation, cup segmentation results and CDR measurement are often evaluated in comparison with the manual contours and measurements provided by ophthalmologists. The reported correlation coefficient for the performance of
Figure 17.5 Manual outlines of cup and disk by three ophthalmologists.
Dow
nloa
ded
by [
Chi
sako
Mur
amat
su]
at 1
8:54
24
Mar
ch 2
015

17.3 Computerized Diagnosis of Glaucoma in Retinal Fundus Images 287
the computerized measurement of the CDRs in compari-son to the manual measurements ranged from 0.67 to 0.93. In contrast, the performance for the classification of glau-comatous and nonglaucomatous eyes based on CDRs in terms of AUC was approximately 0.8–0.9. However, these results were evaluated by the use of proprietary data-bases with different numbers of cases, different fractions of glaucoma cases, and a variety of image characteristics, which makes the comparison difficult. In our experience, it is more difficult to determine cup outlines in non-glaucomatous eyes than in glaucomatous eyes, even for ophthalmologists, because nonglaucomatous eyes tend to have sloping cups, while glaucomatous eyes have cups that are likely to have sharp edges. The establishment of a gold standard may be a common problem in CAD research. For depth measurement, data from another modality, such as HRT, may be used as a reference. For glaucoma diagnosis, the results of visual field testing would be considered the gold standard; however, some glaucoma cases may not exhibit cupping. Other image findings and risk factors for glaucoma include disk hemorrhage, shifting of blood vessels, and the presence of PPA, and some of these have been incorporated into the computerized analysis. As more glaucoma diagnosis studies are reported, common databases for the evaluation of computerized schemes are expected to be established.
Vertical position(b)0
50
100
Pixe
l val
ue 150
200
250
(e) Vertical position50
100Pixe
l val
ue 150
200
(d) (f ) Vertical position–0.02
–0.01
0
0.01
0.02
2nd
deriv
ativ
e
(a) Vertical position(c)–0.04
–0.02
0
0.02
0.04
2nd
deriv
ativ
eFigure 17.6 The vertical pixel value profiles of the ONHs. Cases with (a) normal and (d) glaucomatous ONHs, (b, e) the smoothed profiles of (a) and (d), and (c, f) the second derivatives of (b) and (e) in effective regions (shaded regions) with the selected cup margin locations indicated by arrows.
(a)
(b) (c)
Figure 17.7 Depth reconstruction using a stereo image pair. (a) A stereo image pair, (b) the depth map reconstructed by the cross-correlation-based method, and (c) the HRT image.
Dow
nloa
ded
by [
Chi
sako
Mur
amat
su]
at 1
8:54
24
Mar
ch 2
015
Detection of Eye Diseases288
17.4 COMPUTERIZED DIAGNOSIS OF DIABETIC RETINOPATHY
Patients with diabetes are at considerable risk of developing DR, which is a leading cause of blindness in adults in the United States. Although the prevalence is decreasing as a result of efforts to reduce the risks, the number of patients with severe eye impairment could be further reduced by early detection and treatment. DR can be largely classified into two stages: nonproliferative retinopathy, which can be characterized by the presence of microaneurysms, hemor-rhages, and hard exudates, and proliferative retinopathy, in which the microvascular abnormality progresses and the growth of new vessels occurs. Similar to glaucoma, in the early stage, patients often have no symptoms. Although the early signs, such as the presence of microaneurysms and hemorrhages, can be detected more easily with fluo-rescein angiograms, the use of fluorescein images is lim-ited because they require an injection of a contrast media. Therefore, annual screening with retinal fundus imaging can be effective for the early detection of DR.
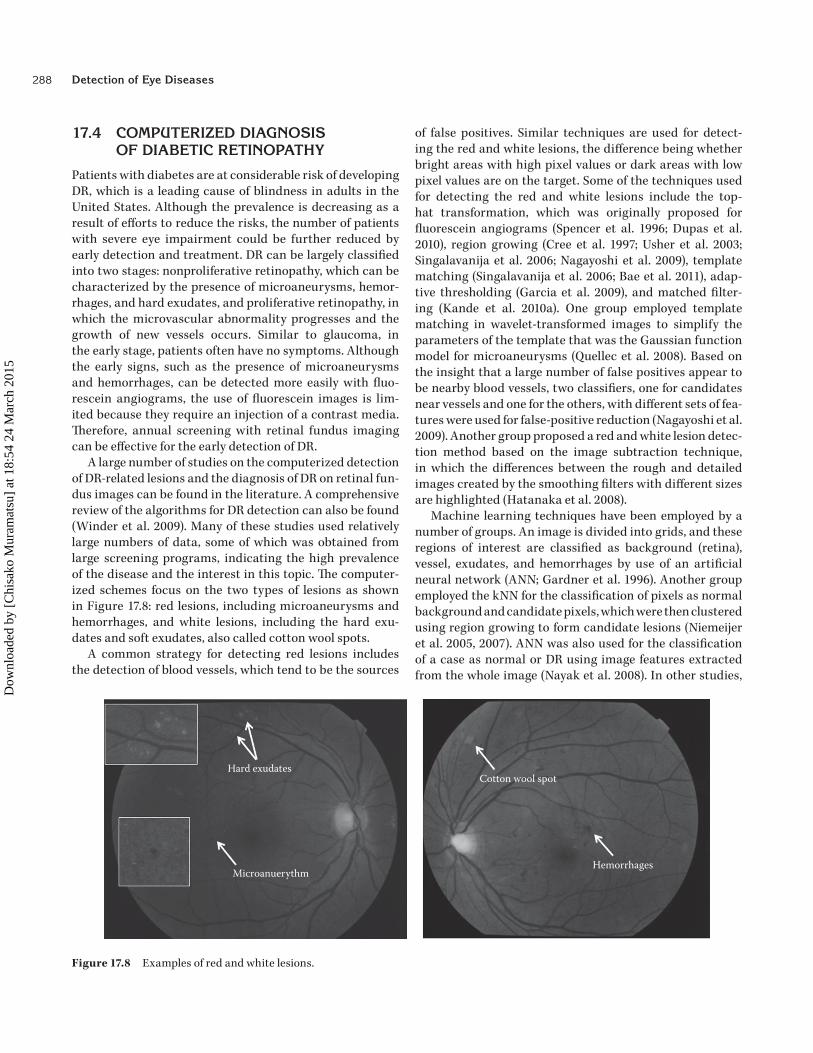
A large number of studies on the computerized detection of DR-related lesions and the diagnosis of DR on retinal fun-dus images can be found in the literature. A comprehensive review of the algorithms for DR detection can also be found (Winder et al. 2009). Many of these studies used relatively large numbers of data, some of which was obtained from large screening programs, indicating the high prevalence of the disease and the interest in this topic. The computer-ized schemes focus on the two types of lesions as shown in Figure 17.8: red lesions, including microaneurysms and hemorrhages, and white lesions, including the hard exu-dates and soft exudates, also called cotton wool spots.
A common strategy for detecting red lesions includes the detection of blood vessels, which tend to be the sources
of false positives. Similar techniques are used for detect-ing the red and white lesions, the difference being whether bright areas with high pixel values or dark areas with low pixel values are on the target. Some of the techniques used for detecting the red and white lesions include the top-hat transformation, which was originally proposed for fluorescein angiograms (Spencer et al. 1996; Dupas et al. 2010), region growing (Cree et al. 1997; Usher et al. 2003; Singalavanija et al. 2006; Nagayoshi et al. 2009), template matching (Singalavanija et al. 2006; Bae et al. 2011), adap-tive thresholding (Garcia et al. 2009), and matched filter-ing (Kande et al. 2010a). One group employed template matching in wavelet-transformed images to simplify the parameters of the template that was the Gaussian function model for microaneurysms (Quellec et al. 2008). Based on the insight that a large number of false positives appear to be nearby blood vessels, two classifiers, one for candidates near vessels and one for the others, with different sets of fea-tures were used for false-positive reduction (Nagayoshi et al. 2009). Another group proposed a red and white lesion detec-tion method based on the image subtraction technique, in which the differences between the rough and detailed images created by the smoothing filters with different sizes are highlighted (Hatanaka et al. 2008).
Machine learning techniques have been employed by a number of groups. An image is divided into grids, and these regions of interest are classified as background ( retina), vessel, exudates, and hemorrhages by use of an artificial neural network (ANN; Gardner et al. 1996). Another group employed the kNN for the classification of pixels as normal background and candidate pixels, which were then clustered using region growing to form candidate lesions (Niemeijer et al. 2005, 2007). ANN was also used for the classification of a case as normal or DR using image features extracted from the whole image (Nayak et al. 2008). In other studies,
Hard exudates
Microanuerythm
Cotton wool spot
Hemorrhages
Figure 17.8 Examples of red and white lesions.
Dow
nloa
ded
by [
Chi
sako
Mur
amat
su]
at 1
8:54
24
Mar
ch 2
015
17.5 Computerized Diagnosis of Hypertensive Retinopathy and Arteriosclerosis 289
a radial basis function NN and support vector machines (SVMs) were used to classify the true lesions and false posi-tives (Usher et al. 2003; Acharya et al. 2009; Garcia et al. 2009; Kande et al. 2010).
In majority of the algorithms, the green plane of the color images was used because of its high contrast in DR-related lesions. In one study, intensity and hue in the HSI space were employed as features for coarse segmentation by FCM clus-tering, which was then followed by fine segmentation using morphological operations (Sopharak et al. 2009).
In one of the earlier studies, measurement of the exudates was attempted (Phillips et al. 1993). A multithresholding technique was applied to identify large bright exudates and small lower-intensity exudates, and then the results were compared with the manually extracted regions in terms of their overlap, rather than just detection. Generally, in the field of CAD, when the centers of a detected area and the reference lesion are close or when their overlap is large, it is considered a true detection. Conversely, other detected regions are counted as false positives. Because of their shape and appearance, it may be difficult to evaluate the detection performance for hard exudates compared to other types of lesions that can be counted and the center of which can be more easily determined. It is unclear how the sensitivity of hard exudates should be determined. In some studies, the case sensitivity in terms of the detection of at least one lesion criterion is employed. This criterion is also applied to determining DR cases and normal cases, such that a case with at least one red or white lesion detected is considered a DR case.
Another issue in the evaluation of the algorithms is that the identification of red lesions, especially the microan-eurysms, may be difficult and susceptible to inter-reader variability. Manual identification by multiple readers is desirable to increase the reliability of the gold standard. In some studies, the computer performance is evaluated in terms of lesion-based sensitivity, whereas in others, the case-based sensitivity for distinguishing between DR and non-DR cases is employed. In some studies, the cases are classified into normal and different stages of DR based on the number of lesions detected.
For the detection of DR, the reported lesion-based sen-sitivities range from about 75% to 95%, whereas the case-based sensitivities can be as high as 100%, with specificities ranging from 46% to 87%. However, these results were eval-uated on different databases and, therefore, cannot be com-pared. To facilitate their comparison, the ROC database was provided, and an algorithm contest for the detection of microaneurysms was held at the 2009 CAD Conference of SPIE Medical Imaging. Brief descriptions of the algorithms developed by the participating groups and their results can be found in the literature (Niemeijer et al. 2010b). The results in terms of the FROC curve are not very high, indicating the
difficulty of the cases included. The evaluation of the meth-ods on a common database is desirable and could promote the research. However, the development of a high-quality open database is not easy and would require a great deal of effort.
17.5 COMPUTERIZED DIAGNOSIS OF HYPERTENSIVE RETINOPATHY AND ARTERIOSCLEROSIS
As discussed earlier, the noninvasive visualization of vas-culatures is possible through retinal fundus examination, which allows for the detection of arteriolar narrowing and vessel occlusions. Studies have reported the association of retinal microvascular abnormalities with stroke and coronary heart disease, which are major clinical prob-lems (Wong et al. 2001; McClintic et al. 2010). When the retina is damaged as a result of hypertension, hyperten-sive retinopathy is diagnosed, which may cause visual dis-turbance and vision loss. One early sign of hypertensive changes is arteriolar narrowing, and as the disease pro-gresses, hemorrhages and hard and soft exudates can also be observed. Arteriosclerosis is considered a main cause of the vessel occlusions. Arteriosclerotic retinopathy may not damage vision, but it is a hazardous sign of arterio-sclerosis in the entire body. In retinal fundus images, an early sclerotic change can be seen as arteriovenous crossing phenomena, followed by silver- and copper-wire arteries (Scheie 1953).
17.5.1 Measurement of Arteriolar-to-Venular Diameter Ratio
Arteriolar narrowing in retinal fundus images is generally assessed by the arteriolar-to-venular diameter ratio (AVR). For the evaluation of arteriolar narrowing, the idea of equivalent central retinal artery width, the formula of which is based on the widths of vessel branches and their parent trunk, is first proposed (Parr and Spears 1974). Simplified versions of this formula for arteries and veins, namely, the central retinal artery equivalent (CRAE) and the central ret-inal vein equivalent (CRVE), are later introduced (Hubbard et al. 1999), which are further revised using each of the six largest arteries and veins (Knudtson et al. 2003). The ratio of CRAE and CRVE is often employed for the measurement of AVR on ONH-centered images, as shown in Figure 17.9a. Conversely, in regular macula-centered fundus images, the ratio of the diameters of a major artery and vein pair running side by side each on the upper and lower tempo-ral sides has been recommended in the guideline in Japan (Figure 17.9b). In either case, the measurement is made around the ONH, from a ¼- or ½- to a 1-disk diameter from
Dow
nloa
ded
by [
Chi
sako
Mur
amat
su]
at 1
8:54
24
Mar
ch 2
015

Detection of Eye Diseases290
the ONH margin. Recently, a study reported a comparable association for this measurement with cardiovascular risk factors using an extended zone up to a two-disk diameter (Cheung et al. 2010).
Several semi-automated methods for the measurement of AVR have been proposed in which operators manually identified the vessels of interest. Subsequently, the diam-eters were calculated on the basis of the standard deviation, σ, of fitted Gaussian curves (Gao et al. 2000), the full-width at half maximum of the profile (Pederson et al. 2000), or the edges of vessel walls detected by the Sobel operator (Pakter et al. 2005). Other studies also proposed the use of Gaussian models. An amplitude-modified second-order Gaussian fil-ter is used for the detection and measurement of retinal ves-sels (Gang et al. 2002). A difference-of-Gaussians model, in which a smaller Gaussian curve is subtracted from a larger one, is used for vessels with light reflex (Lowell et al. 2004). In these studies, vessel widths were determined as a func-tion of σ, or by the second derivative of the model; however, the AVR was not measured.
For the fully automated measurement of AVR, the determination of vessel walls as well as the detection and selection of retinal vessels is required. In addition, the iden-tification of the ONH and the determination of its diameter are often necessary for the selection of the measurement zone. As described in the earlier sections, numerous stud-ies on the automated segmentation of retinal vessels and the ONH have been proposed. Some of these groups have investigated the automated measurement of AVR. After the retinal vessels and the ONH are extracted, the ves-sels were classified into arteries and veins using a feature characterizing the central reflex, and those with diameters greater than 45 µm were selected for the estimation of AVR (Tramontan et al. 2008). Another group investigated several
classifiers for the classification of arteries and veins, namely, kNN, SVM, LDA, and quadratic discriminant analysis, and the six widest arteries and veins were selected for AVR mea-surement (Niemeijer et al. 2010a). Another method that does not require vessel detection is proposed (Nam et al. 2009). Using a circular intensity profile at a distance from the ONH, the valleys, which correspond to dark pixels, are clas-sified into arteries and veins according to their shapes, and the vessels larger than a prespecified value are used for AVR calculation.
A method for determining the AVR on macula-centered images was proposed (Muramatsu et al. 2011a). The ONH is segmented and fitted by an ellipse to select the measure-ment zone. After detecting the vessels, they are partitioned to segments at the bifurcations and intersections, and these segments are classified into arteries and veins using a linear classifier with the color and contrast features. Two pairs of arteries and veins in the upper and lower temporal regions are selected by a set of rules based on vessel orientation and thickness.
The performance of the automated AVR measurement is compared to those manually or semi-manually determined measurements using open software (IVAN; the University of Wisconsin in Madison, United States), and the high corre-lations (about 0.9) among the computer estimates and the references were reported. For the accurate measurement of the AVR, acquisition of high-resolution images of reason-able quality is essential.
17.5.2 Detection of Arteriovenous Crossing Phenomenon
The arteriovenous crossing phenomenon (AVCP), also called arteriovenous nicking, is the state in which a vein
Artery
Vein
Measurementzone
(b)
Artery
Vein
Measurementzone
(a)
Figure 17.9 Selection of arteries and veins for the measurement of AVR in (a) an ONH-centered image and (b) a macula-centered image.
Dow
nloa
ded
by [
Chi
sako
Mur
amat
su]
at 1
8:54
24
Mar
ch 2
015
291Appendix 17.A: Public Databases for Retinal Image Analysis
that is constricted by a stiffened artery appears narrower at an artery–vein (AV) crossing. Although there are many studies on automated retinal vessel segmentation and analysis, to our knowledge, in the literature, there is no study focused on the detection of AVCP. Authors have been investigating an automated method for the detection of the AVCP in retinal fundus images (Hatanaka et al. 2009). Our approach consists of the detection of retinal vessels, the detection of AV crossings, and the measurement of venous diameters at two points, one in the vicinity of the crossing and another at a distance from the crossing. After the reti-nal vessels are segmented by using a double ring filter or the other techniques, a ring filter with radius r is scanned to search for points where more than four vessels cross the perimeter of the ring. If more than four vessels are pres-ent, the vessels are paired by checking locations across the perimeter. The two pairs of vessels are classified as an artery pair and a vein pair on the basis of the pixel values in the red and green components. Finally, two diameters of the veins are measured, one of which is represented by the minimum diameter between the crossing point and 1/2r, and the other is represented by the average diameter between 1/2r and the perimeter of the ring. In our study, the presence of AVCP is suspected if the ratio of the diam-eters is less than 0.8. The performance of the computerized scheme in terms of crossing detection and AVCP detection is currently not very high, due in part to the lack of a high-quality database; therefore, improvement is expected in the future.
17.6 EMERGING TOPIC: COMPUTER ANALYSIS OF OPTICAL COHERENCE TOMOGRAPHY
In recent years, OCT has been used frequently in oph-thalmology examinations. As a result, it has gained much interest in the research community. With OCT, a cross-sectional view of the retina can be obtained, allowing for the quantitative measurement of retinal nerves and the detection of macular holes and the other macular patholo-gies. There are only a few studies related to CAD on OCT at present; however, the number is expected to increase in the future.
An automated layer segmentation technique was pro-posed and tested on a small number of OCT cases (Lu et al. 2010). By detecting retinal blood vessels using an iterative polynomial smoothing technique, the retinal lay-ers are divided into vessel and nonvessel sections. On the basis of variation across the boundaries, the borders of the nonvessel sections are detected, and the layers are classified into five retinal layers. Another group investigated an image
registration method using probabilistic modeling using an expectation–maximization algorithm for the alignment of successive OCT scans, which potentially reduces measure-ment variability and facilitates longitudinal assessment (Zhu et al. 2011).
Using spectral domain OCT, which provides a high-quality 3D image as a result of its faster acquisition and high resolution, investigators proposed an automated scheme for the segmentation of the optic cup and neural canal opening (NCO), which may correspond to the disk margin in fundus photographs (Hu et al. 2010). In this method, layer surfaces are first segmented on the original image, and a projection image, similar to a fundus pho-tograph, is created by taking some thin layers. By trans-forming the image into polar coordinates and using it as the cost function, the NCO and cup boundaries are seg-mented. They reported a relatively high correlation of 0.85 for the CDR when comparing the algorithm to the refer-ence standard.
17.7 CONCLUSION
Retinal examination using retinal fundus images can be effective for the early diagnosis of glaucoma, DR, and hypertensive retinopathy, and it has the potential to reduce the number of patients who suffer vision loss. Fundus photographs are frequently obtained at oph-thalmology visits and in certain screening programs. Computer analysis of the retinal images may assist oph-thalmologists and other physicians in fast, consistent, and accurate reading of the images. Many studies have been reported on automated segmentation of the ONH and retinal blood vessels. Using these basic algorithms, investigators have proposed the integrated schemes for the diagnosis of the eye diseases. Although the perfor-mances reported for ONH and vessel detections are rela-tively high, some improvements are expected for disease detection and quantification schemes. Investigations of new algorithms for OCT and multimodality approaches may be interesting future topics.
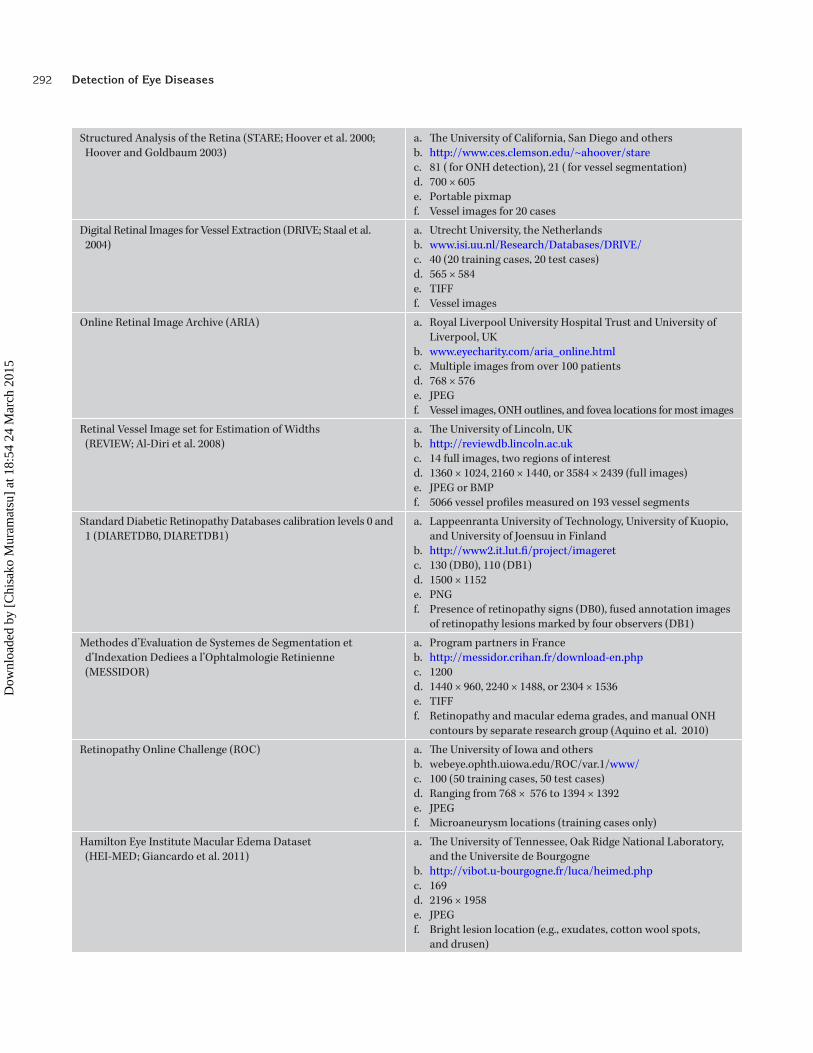
APPENDIX 17.A: PUBLIC DATABASES FOR RETINAL IMAGE ANALYSIS
In this table, concise information about the public data-bases (some require a registration before downloading) is provided: (a) research groups; (b) website; (c) the number of images; (d) image resolution; (e) image format; and (f) sup-plemental files, that is, the gold standard.
Dow
nloa
ded
by [
Chi
sako
Mur
amat
su]
at 1
8:54
24
Mar
ch 2
015
Detection of Eye Diseases292
Structured Analysis of the Retina (STARE; Hoover et al. 2000; Hoover and Goldbaum 2003)
a. The University of California, San Diego and othersb. http://www.ces.clemson.edu/~ahoover/starec. 81 ( for ONH detection), 21 ( for vessel segmentation)d. 700 × 605e. Portable pixmapf. Vessel images for 20 cases
Digital Retinal Images for Vessel Extraction (DRIVE; Staal et al. 2004)
a. Utrecht University, the Netherlandsb. www.isi.uu.nl/Research/Databases/DRIVE/c. 40 (20 training cases, 20 test cases)d. 565 × 584e. TIFFf. Vessel images
Online Retinal Image Archive (ARIA) a. Royal Liverpool University Hospital Trust and University of Liverpool, UK
b. www.eyecharity.com/aria_online.htmlc. Multiple images from over 100 patientsd. 768 × 576e. JPEGf. Vessel images, ONH outlines, and fovea locations for most images
Retinal Vessel Image set for Estimation of Widths (REVIEW; Al-Diri et al. 2008)
a. The University of Lincoln, UKb. http://reviewdb.lincoln.ac.ukc. 14 full images, two regions of interestd. 1360 × 1024, 2160 × 1440, or 3584 × 2439 (full images)e. JPEG or BMPf. 5066 vessel profiles measured on 193 vessel segments
Standard Diabetic Retinopathy Databases calibration levels 0 and 1 (DIARETDB0, DIARETDB1)
a. Lappeenranta University of Technology, University of Kuopio, and University of Joensuu in Finland
b. http://www2.it.lut.fi/project/imageretc. 130 (DB0), 110 (DB1)d. 1500 × 1152e. PNGf. Presence of retinopathy signs (DB0), fused annotation images
of retinopathy lesions marked by four observers (DB1)
Methodes d’Evaluation de Systemes de Segmentation et d’Indexation Dediees a l’Ophtalmologie Retinienne (MESSIDOR)
a. Program partners in Franceb. http://messidor.crihan.fr/download-en.phpc. 1200d. 1440 × 960, 2240 × 1488, or 2304 × 1536e. TIFFf. Retinopathy and macular edema grades, and manual ONH
contours by separate research group (Aquino et al. 2010)
Retinopathy Online Challenge (ROC) a. The University of Iowa and othersb. webeye.ophth.uiowa.edu/ROC/var.1/www/c. 100 (50 training cases, 50 test cases)d. Ranging from 768 × 576 to 1394 × 1392e. JPEGf. Microaneurysm locations (training cases only)
Hamilton Eye Institute Macular Edema Dataset (HEI-MED; Giancardo et al. 2011)
a. The University of Tennessee, Oak Ridge National Laboratory, and the Universite de Bourgogne
b. http://vibot.u-bourgogne.fr/luca/heimed.phpc. 169d. 2196 × 1958e. JPEGf. Bright lesion location (e.g., exudates, cotton wool spots,
and drusen)
Dow
nloa
ded
by [
Chi
sako
Mur
amat
su]
at 1
8:54
24
Mar
ch 2
015

293References
REFERENCESAbramoff, M.D., W.L.M. Alward, E.C. Greenlee et al. 2007. Automated
segmentation of the optic disc from stereo color photographs using physiologically plausible features. Invest. Ophthalmol. Vis. Sci. 48:1665–1673.
Acharya, U.R., C.M. Lim, E.Y.K. Ng, C. Chee, and T. Tamura. 2009. Computer-based detection of diabetes retinopathy stages using digital fundus images. Proc. Inst. Mech. Eng. 223:545–553.
Al-Diri, B., A. Hunter, D. Steel, M. Habib, T. Hudaib, and S. Berry. 2008. REVIEW—A reference data set for retinal vessel profiles. In: Conference Proceedings of the IEEE Engineering in Medicine and Biology Society, Vancouver, British Columbia, Canada, pp. 20–24.
Al-Rawi, M., M. Qutaishat, and M. Arrar. 2007. An improved matched filter for blood vessel detection of digital retinal images. Comput. Biol. Med. 37:262–267.
Anzalone, A., F. Bizzarri, M. Parodi, and M. Storace. 2008. A modular supervised algorithm for vessel segmentation in red-free reti-nal images. Comput. Biol. Med. 38:913–922.
Aquino, A., M.E. Gegundez-Arias, and D. Marin. 2010. Detecting the optic disc boundary in digital fundus images using morpho-logical, edge detection, and feature extraction techniques. IEEE Trans. Med. Imaging 29:1860–1869.
Bae, J.P., K.G. Kim, H.C. Kang, C.B. Jeong, K.H. Park, and J.M. Hwang. 2011. A study on hemorrhage detection using hybrid method in fundus images. J. Digit. Imaging 24:394–404.
Cai, W. and A.C.S. Chung. 2006. Multi-resolution vessel segmenta-tion using normalized cuts in retinal images. In: MICCAI 2006, LNCS, Copenhagen, Denmark, Vol. 4191, pp. 928–936.
Carmona, E.J., M. Rincon, J. Garcia-Feijoo, and J.M. Martinex-de-la-Casa. 2008. Identification of the optic nerve head with genetic algorithms. Artif. Intell. Med. 43:243–259.
Chen, J. and J. Tian. 2008. Retinal vessel enhancement based on direc-tional field. Proc. SPIE Med. Imaging 6914:191422-1–191422-8.
Cheung, C.Y.L., W. Hsu, M.L. Lee et al. 2010. A new method to mea-sure peripheral retinal vascular caliber over an extended area. Microcirculation 17:495–503.
Chrastek, R., M. Skokan, L. Kubecka et al. 2004. Multimodal reti-nal image registration for optic disk segmentation. Methods Inform. Med. 43:336–342.
Condurache, A.P. and T. Aach. 2006. Vessel segmentation in 2D-projection images using a supervised linear hysteresis classifier. In: International Conference on Pattern Recognition Hong Kong, China, pp. 343–346.
Corona, E., S. Mitra, M. Wilson et al. 2002. Digital stereo image analyzer for generating automated 3-D measures of optic disc deformation in glaucoma. IEEE Trans. Med. Imaging 21:1244–1253.
Cree, M.J., J.A. Olson, K.C. McHardy, P.F. Sharp, and J.V. Forrester. 1997. A fully automated comparative microaneurysm digital detection system. Eye 11:622–628.
Delibasis, K.K., A.I. Kechriniotis, C. Tsonos, and N. Assimakis. 2010. Automatic model-based tracing algorithm for vessel seg-mentation and diameter estimation. Comput. Methods Prog. Biomed. 100:108–122.
Devroye, L., L. Gyorfi, and G. Lugosi. 1996. A Probabilistic Theory of Pattern Recognition. New York: Springer-Verlag.
Dupas, B., T. Walter, A. Erginay et al. 2010. Evaluation of automated fundus photograph analysis algorithms for detecting micro-aneurysms, haemorrhages and exudates, and of a computer-assisted diagnostic system for grading diabetic retinopathy. Diab. Metab. 36:213–220.
Farnell, D.J.J., F.N. Hatfield, P. Knox et al. 2008. Enhancement of blood vessels in digital fundus photographs via the applica-tion of multiscale line operators. J. Franklin Inst. 345:748–765.
Foracchia, M., E. Grisan, and A. Ruggeri. 2004. Detection of optic disc in retinal images by means of a geometrical model of ves-sel structure. IEEE Trans. Med. Imaging 23:1189–1195.
Fujita, H., Y. Uchiyama, T. Nakagawa et al. 2008. Computer-aided diagnosis: The emerging of three CAD systems induced by Japanese health care needs. Comput. Methods Prog. Biomed. 92:238–248.
Gang, L., O. Chutatape, and S.M. Krishnan. 2002. Detection and measurement of retinal vessels in fundus images using ampli-tude modified second-order Gaussian filter. IEEE Trans. Biomed. Eng. 49:168–172.
Gao, X.W., A. Bharath, A. Stanton, A. Hughes, N. Chapman, and S. Thom. 2000. Quantification and characterization of arteries in retinal images. Comput. Methods Prog. Biomed. 63:133–146.
Garcia, M., C.I. Sanchez, J. Poza, M.I. Lopez, and R. Hornero. 2009. Detection of hard exudates in retinal images using a radial basis function classifier. Annals Biomed. Eng. 37:1448–1463.
Gardner, G.G., D. Keating, T.H. Williamson, and A.T. Elliott. 1996. Automatic detection of diabetic retinopathy using an arti-ficial neural network: A screening tool. Br. J. Ophthalmol. 80:940–944.
Garg, S., J. Sivaswamy, and S. Chandra. 2007. Unsupervised cur-vature-based retinal vessel segmentation. In: International Symposium on Biomedical Imaging, Arlington, VA, pp. 344–347.
Giancardo, L., T.P. Kamowski, Y. Li, K.W. Tobin, and E. Chaum. 2011. Automatic retinal exudates segmentation without a manu-ally labeled training set. In: IEEE International Symposium on Biomedical Imaging Chicago, IL, pp. 1396–1400.
Gloster, J. and D.G. Parry. 1974. Use of photographs for measuring cupping in the optic disc. Br. J. Ophthalmol. 58:850–863.
Friedrich-Alexander University of Erlangen-Nuremberg a. Friedrich-Alexander Universityb. www5.cs.fau.de/en/research/data/fundus-imagesc. 45d. 3504 × 2336e. JPEGf. Vessel images
Dow
nloa
ded
by [
Chi
sako
Mur
amat
su]
at 1
8:54
24
Mar
ch 2
015

Detection of Eye Diseases294
Hatanaka, Y., T. Nakagawa, Y. Hayashi, T. Hara, and H. Fujita. 2008. Improvement of automated detection method of hemor-rhages in fundus images. In: Conference Proceedings of the IEEE Engineering in Medicine and Biology Society, Vancouver, British Columbia, Canada, pp. 5429–5432.
Hatanaka, Y., A. Noudo, C. Muramatsu et al. 2010. Vertical cup-to-disc ratio measurement for diagnosis of glaucoma on fundus images. Proc. SPIE Med. Imaging 7624:76243C-1–76243C-8.
Hatanaka, Y., C. Muramatsu, T. Hara, and H. Fujita. 2009. Automatic arteriovenous crossing phenomenon detection on retinal fun-dus images. Proc. SPIE Med. Imaging. 7963:79633V-1–79633V-8.
Hoover, A. and M. Goldbaum. 2003. Locating the optic nerve in a retinal image using the fuzzy convergence of the blood ves-sels. IEEE Trans. Med. Imaging 22:951–958.
Hoover, A., V. Kouznetxova, and M. Goldbaum. 2000. Locating blood vessels in retinal images by piecewise threshold probing of a matched filter response. IEEE Trans. Med. Imaging 19:203–210.
Hu, Z., M.D. Abramoff, Y.H. Kwon, K. Lee, and M.K. Garvin. 2010. Automated segmentation of neural canal opening and optic cup in 3D spectral optical coherence tomography volumes of the optic nerve head. Invest. Ophthalmol. Vis. Sci. 51:5708–5717.
Hubbard, L.D., R.J. Brothers, W.N. King et al. 1999. Methods for evaluation of retinal microvascular abnormalities associated with hypertension/sclerosis in the atherosclerosis risk in communities study. Ophthalmology 106:2269–2280.
Iwase, A., Y. Suzuki, M. Araie, et al. 2004. The prevalence of pri-mary open-angle glaucoma in Japanese The Tajimi Study. Ophthalmol. 111:1641–1648.
Kande, G.B., T.S. Savithri, and P.V. Subbaiah. 2010a. Automatic detection of microaneurysms and hemorrhages in digital fundus images. J. Digit. Imaging 23:430–437.
Kande, G.B., P.V. Subbaiah, and T.S. Savithri. 2009. Feature extrac-tion in digital fundus images. J. Med. Biol. Eng. 29:122–130.
Kande, G.B., P.V. Subbaiah, and T.S. Savithri. 2010b. Unsupervised fuzzy based vessel segmentation in pathological digital fun-dus images. J. Med. Syst. 34:849–858.
Knudtson, M.D., K.E. Lee, L.D. Hubbard et al. 2003. Revised formulas for summarizing retinal vessel diameters. Curr. Eye Res. 27:143–149.
Kolar, R. and P. Vacha. 2009. Texture analysis of the retinal nerve fiber layer in fundus images via Markov Random Fields. In: IFMBE Proceedings, Munich, Germany, Vol. 25/XI, pp. 247–250.
Lalonde, M., M. Beaulier, and L. Gagnon. 2001. Fast and robust optic disk detection using pyramidal decomposition and Hausdorff-based template matching. IEEE Trans. Med. Imaging 20:1193–1200.
Lee, S.Y., K.K. Kim, J.M. Seo et al. 2004. Automated quantification of retinal nerve fiber layer atrophy in fundus photograph. In: Conference Proceedings of the IEEE Engineering in Medicine and Biology Society, San Francisco, CA, pp. 1241–1243.
Li, H. and O. Chutatape. 2004. Automated feature extraction in color retinal images by a model based approach. IEEE Trans. Biomed. Eng. 51:246–254.
Lowell, J., A. Hunter, D. Steel, A. Basu, R. Ryder, and R.L. Kennedy. 2004. Measurement of retinal vessel widths from fundus images based on 2-D modeling. IEEE Trans. Med. Imaging 23:1196–1204.
Lu, S., C.Y. Cheung, J. Liu, J.H. Lim, C.K. Leung, and T.Y. Wong. 2010. Automated layer segmentation of optical coherence tomog-raphy images. IEEE Trans. Biomed. Eng. 57:2605–2608.
Marin, D., A. Aquino, M.E. Gegundez-Arias, and M. Bravo. 2011. A new supervised method for blood vessel segmentation in reti-nal images by using gray-level and moment invariants-based features. IEEE Trans. Med. Imaging 30:146–158.
McClintic, B.R., J.I. McClintic, J.D. Bisognano, and R.C. Block. 2010. The relationship between retinal microvascular abnor-malities and coronary heart disease: A review. Am. J. Med. 123:374e1–374e7.
Mendonca, A.M. and A. Campilho. 2006. Segmentation of retinal blood vessels by combining the detection of centerlines and morphological reconstruction. IEEE Trans. Med. Imaging 25:1200–1213.
Merickel, M.B., X. Wu, M. Sonka, and M. Abramoff. 2006. Optimal segmentation of the optic nerve head from stereo retinal images. Proc. SPIE Med. Imaging 6243:61433B-1–61433B-2.
Muramatsu, C., Y. Hatanaka, T. Iwase, T. Hara, and H. Fujita. 2011a. Automated selection of major arteries and veins for measure-ment of arteriolar-to-venular diameter ratio on retinal fun-dus images. Comput. Med. Imaging Graph. 35:472–480.
Muramatsu, C., Y. Hayashi, A. Sawada et al. 2010. Detection of retinal nerve fiber layer defects on retinal fundus images for early diagnosis of glaucoma. J. Biomed. Opt. 15:016021-1–016021-7.
Muramatsu, C., T. Nakagawa, A. Sawada et al. 2011b. Automated segmentation of optic disc region on retinal fundus photo-graphs: Comparison of contour modeling and pixel classifica-tion methods. Comput. Methods Prog. Biomed. 101:23–32.
Nagayoshi, H., Y. Hiramatsu, H. Sako, M. Himaga, and S. Kato. 2009. Detection of fundus lesions using classifier selection. IEICE Trans. Inform. Syst. E92D:1168–1176.
Nakagawa, T., T. Suzuki, Y. Hayashi et al. 2008. Quantitative depth analysis of optic nerve head using stereo retinal fundus image pair. J. Biomed. Opt. 13:064026-1–064026-10.
Nam, H.S., J.M. Hwang, H. Chung, and J.M. Seo. 2009. Automated measurement of retinal vessel diameters on digital fundus photographs. In: IFMBE Proceedings, Munich, Germany, Vol. 25/XI, pp. 277–280.
Nayak, J., R. Acharya, P.S. Bhat, N. Shetty, and T.C. Lim. 2009. Automated diagnosis of glaucoma using digital fundus images. J. Med. Syst. 33:337–346.
Nayak, J., P.S. Bhat, R. Acharya, C.M. Lim, and M. Kagathi. 2008. Automated identification of diabetic retinopathy stages using digital fundus images. J. Med. Syst. 32:107–115.
Niemeijer, M., M.D. Abramoff, and B. van Ginneken. 2009. Fast detection of the optic disc and fovea in color fundus photo-graphs. Med. Image Anal. 13:859–870.
Niemeijer, M., J.J. Staal, B. van Ginneken, M. Loog, and M.D. Abramoff. 2004. Comparable study of retinal vessel segmen-tation methods on a new publicly available database. Proc. SPIE Med. Imaging 5370:648–656.
Niemeijer, M., B. van Ginneken, and M.D. Abramoff. 2010a. Automatic determination of the artery-vein ratio in retinal images. Proc. SPIE Med. Imaging 7624:76240I-1–76240I-10.
Niemeijer, M., B. van Ginneken, M.J. Cree et al. 2010b. Retinopathy online challenge: Automatic detection of microaneurysms in digital color fundus photographs. IEEE Trans. Med. Imaging 29:185–195.
Dow
nloa
ded
by [
Chi
sako
Mur
amat
su]
at 1
8:54
24
Mar
ch 2
015
295References
Niemeijer, M., B. van Ginneken, S.R. Russell, M.S.A. Suttorp-Schulten, and M.D. Abramoff. 2007. Automated detection and differentiation of drusen, exudates, and cotton-wool spots in digital color fundus photographs for diabetic retinopathy diagnosis. Invest. Ophthalmol. Vis. Sci. 48:2260–2267.
Niemeijer, M., B. van Ginneken, J. Stall, M.S.A. Suttorp-Schulten, and M.D. Abramoff. 2005. Automatic detection of red lesions in digital color fundus photographs. IEEE Trans. Med. Imaging 24:584–592.
Osareh, A., M. Mirmehdi, B. Thomas, and R. Markham. 2002. Comparison of colour spaces for optic disc localization in retinal images. In: Proceedings of the International Conference on Pattern Recognition, Quebec City, Canada, pp. 743–746.
Pakter, H.M., E. Ferlin, S.C. Fuchs et al. 2005. Measuring arterio-lar-to-venous ratio in retinal photography of patients with hypertension: Development and application of a new semi-automated method. Am. J. Hypertens. 18:417–421.
Parr, J.C. and G.F.S. Spears. 1974. General caliber of the retinal arter-ies expressed as the equivalent width of the central retinal artery. Am. J. Ophthalmol. 77:472–477.
Pederson, L., M. Grunkin, B. Ersball et al. 2000. Quantitative mea-surement of changes in retinal vessel diameter in ocular fun-dus images. Pattern Recogn. Lett. 21:1215–1223.
Peli, E., T.R. Hedges III, and B. Schwartz. 1989. Computer mea-surement of retinal nerve fiber layer striations. Appl. Opt. 28:1128–1134.
Perez-Rovira, A. and E. Trucco. 2008. Robust optic disc loca-tion via combination of weak detectors. In: Conference Proceedings of the IEEE Engineering in Medicine and Biology Society, Vancouver, British Columbia, Canada, pp. 3542–3545.
Perfetti, R., E. Ricci, D. Casali, and G. Costantini. 2007. Cellular neu-ral networks with virtual template expansion for retinal ves-sel segmentation. IEEE Trans. Circuits Syst. II 54:141–145.
Phillips, R., J. Forrester, and P. Sharp. 1993. Automated detection and quantification of retinal exudates. Graefe’s Arch. Clin. Exp. Ophthalmol. 231:90–94.
Quellec, G., M. Lamard, P.M. Josselin, G. Cazuguel, B. Cochener, and C. Roux. 2008. Optimal wavelet transform for the detection of microaneurysms in retinal photographs. IEEE Trans. Med. Imaging 27:1230–1241.
Quigley, H.A. and A.T. Broman. 2006. The number of people with glaucoma worldwide in 2010 and 2010. Br. J. Ophthalmol. 90:262–267.
Resnikoff, S., D. Pscolini, D. Etya’ale et al. 2004. Global data on visual impairment in the year 2002. Bull. World Health Organ. 82:844–851.
Ricci, E. and R. Perfetti. 2007. Retinal blood vessel segmentation using line operators and support vector classification. IEEE Trans. Med. Imaging 26:1357–1365.
Salem, A.S., N.M. Salem, and A.K. Nandi. 2007. Segmentation of reti-nal blood vessels using a novel clustering algorithm (RACAL) with a partial supervision strategy. Med. Biol. Eng. Comput. 45:261–273.
Scheie, H.G. 1953. Evaluation of ophthalmoscopic changes of hypertension and arteriolar sclerosis. AMA Arch. Ophthalmol. 49:117–138.
Singalavanija, A., J. Supokavej, P. Bamroongsuk et al. 2006. Feasibility study on computer-aided screening for diabetic retinopathy. Jpn. J. Ophthalmol. 50:361–366.
Sinthanayothin, C., J.F. Boyce, H.L. Cook, and T.H. Williamson. 1999. Automated localization of the optic disc, fovea, and retinal blood vessels from digital colour fundus images. Br. J. Ophthalmol. 83:902–910.
Soares, J.V.B., J.J.G. Leandro, R.M. Cesar, H.F. Jelinek, and M.J. Cree. 2006. Retinal vessel segmentation using the 2-D Gabor wave-let and supervised classification. IEEE Trans. Med. Imaging 25:1214–1222.
Sofka, M. and C.V. Stewart. 2006. Retinal vessel centerline extrac-tion using multiscale matched filters, confidence and edge measures. IEEE Trans. Med. Imaging 25:1531–1546.
Sopharak, A., B. Uyyanonvara, and S. Barman. 2009. Automatic exudate detection from non-dilated diabetic retinopa-thy retinal images using fuzzy c-means clustering. Sensors 9:2148–2161.
Spencer, T., J.A. Olson, D.C. McHardy, P.F. Sharp, and J.V. Forrester. 1996. An image-processing strategy for the segmenta-tion and quantification of microaneurysms in fluorescein angiograms of the ocular fundus. Comput. Biomed. Res. 29:284–302.
Staal, J.J., M.D. Abramoff, M. Niemeijer, M.A. Viergever, and B. van Ginneken. 2004. Ridge based vessel segmentation in color images of the retina. IEEE Trans. Med. Imaging 23:501–509.
Tielsch, J.M., J. Katz, H.A. Quigley, N.R. Miller, and A. Sommer. 1988. Intraobserver and interobserver agreement in mea-surement of optic disc characteristics. Ophthalmology 95:350–356.
Tobin, K.W., E. Chaum, V.P. Govindassamy, and T.P. Karnowski. 2007. Detection of anatomic structures in human retinal imagery. IEEE Trans. Med. Imaging 26:1729–1739.
Tramontan, L., E. Grisan, and A. Ruggeri. 2008. An improved sys-tem for the automatic estimation of the arteriolar-to-venular diameter ratio (AVR) in retinal images. In: Conference Proceedings of the IEEE Engineering in Medicine and Biology Society, Vancouver, British Columbia, Canada, pp. 20–24.
Usher, D., M. Dumskyj, M. Himaga, T.H. Williamson, S. Nussey, and J. Boyce. 2003. Automated detection of diabetic retinopathy in digital retinal images: A tool for diabetic retinopathy screen-ing. Diab. Med. 21:84–90.
Verma, R., G.L. Spaeth, W.C. Steinmann, and L.J. Katz. 1989. Agreement between clinicians and an image analyzer in estimating cup-to-disc ratios. Arch. Ophthalmol. 107:526–529.
Villalobos-Castaldi, F.M., E.M. Felipe-Riveron, and L.P. Sanchez-Fernandez. 2010. A fast, efficient and automated method to extract vessels from fundus images. J. Vis. 13:263–270.
Vlachos, M. and E. Dermatas. 2010. Multi-scale retinal vessel seg-mentation using line tracking. Comput. Med. Imaging Graph. 34:213–227.
Walter, T. and J.C. Klein. 2001. Segmentation of color fundus images of the human retina: Detection of the optic disc and the vas-cular tree using morphological technique. Int. Symp. Med. Data Anal. 2199:282–287.
Dow
nloa
ded
by [
Chi
sako
Mur
amat
su]
at 1
8:54
24
Mar
ch 2
015

Detection of Eye Diseases296
Winder, R.J., P.J. Morrow, I.N. McRitchie, J.R. Bailie, and P.M. Hart. 2009. Algorithms for digital image processing in diabetic reti-nopathy. Comput. Med. Imaging Graph. 33:608–622.
Wong, D.W.K., J. Liu, J.H. Lim et al. 2008. Level-set based automatic cup-to-disc ratio determination using retinal fundus images in ARGALI. In: Conference Proceedings of the IEEE Engineering in Medicine and Biology Society, Vancouver, British Columbia, Canada, pp. 2266–2269.
Wong, D.W.K., J. Liu, N.M. Tan et al. 2010. Enhancement of optic cup detection through an improved vessel kink detection frame-work. Proc. SPIE Med. Imaging 7624:762439-1–762439-8.
Wong, T.Y., R. Klein, D.J. Couper et al. 2001. Retinal microvascular abnormalities and incident stroke: The atherosclerosis risk in communities study. Lancet 358:1134–1140.
Wu, C., G. Agam, and P. Stanchev. 2007. A hybrid filtering approach to retinal vessel segmentation. In: IEEE International Symposium on Biomedical Imaging, Washington, DC, Arlington, VA, pp. 604–607.
Xu, J., H. Ishikawa, G. Wollstein et al. 2008. Automated assessment of the optic nerve head on stereo disc photographs. Invest. Ophthalmol. Vis. Sci. 49:2512–2517.
Yogesan, K., R.H. Eikelboom, and C.J. Barry. 1998. Texture analysis of retinal images to determine nerve fibre loss. In: International Conference on Pattern Recognition, Brisbane, Queensland, Australia, pp. 1665–1667.
Youssif, A.R., A.Z. Ghalwash, and A.R. Ghoneim. 2008. Optic disc detection from normalized digital fundus images by means of a vessels’ direction matched filter. IEEE Trans. Med. Imaging 27:11–18.
Zhang, Z., J. Liu, N.S. Cherian et al. 2009. Convex hull based neuro-retinal optic cup ellipse optimization in glau-coma diagnosis. In: Conference Proceedings of the IEEE Engineering in Medicine and Biology Society, Minneapolis, MN, pp. 1441–1444.
Zhu, H., D.P. Crabb, P.G. Schlottmann, G. Wollstein, and D. Garway-Heath. 2011. Aligning scan acquisition circles in optical coherence tomography images of the retinal nerve fibre layer. IEEE Trans. Med. Imaging 30:1228–1238.
Zhu, X., R.M. Rangayyan, and A.L. Ells. 2010. Detection of the optic nerve head in fundus images of the retina using the Hough transform for circles. J. Digit. Imaging 23:332–341.
Dow
nloa
ded
by [
Chi
sako
Mur
amat
su]
at 1
8:54
24
Mar
ch 2
015