Embed Size (px)
Citation preview
Research ArticleDetection of Cyanuric Acid and Melamine in Infant FormulaPowders by Mid-FTIR Spectroscopy and Multivariate Analysis
Edwin García-Miguel,1 Ofelia Gabriela Meza-Márquez,2 Guillermo Osorio-Revilla,2
Darío Iker Téllez-Medina,2 Cristian Jiménez-Martínez,2 Maribel Cornejo-Mazón,1
Diana Maylet Hernández-Martínez,1 and Tzayhrí Gallardo-Velazquez 1
1Departamento de Biofısica, Instituto Politecnico Nacional, Escuela Nacional de Ciencias Biologicas,Prolongacion de Carpio y Plan de Ayala S/N, Col. Santo Tomas, 11340 Ciudad de Mexico, Mexico2Departamento de Ingenierıa Bioquımica, Instituto Politecnico Nacional, Escuela Nacional de Ciencias Biologicas,Av. Wilfrido Massieu S/N, Col. Unidad Profesional Adolfo Lopez Mateos, Zacatenco, 07738 Ciudad de Mexico, Mexico
Correspondence should be addressed to Tzayhrı Gallardo-Velazquez; [email protected]
Received 29 June 2017; Revised 9 January 2018; Accepted 19 February 2018; Published 22 March 2018
Academic Editor: Marina Carcea
Copyright © 2018 Edwin Garcıa-Miguel et al. This is an open access article distributed under the Creative Commons AttributionLicense, which permits unrestricted use, distribution, and reproduction in any medium, provided the original work is properlycited.
Chemometric methods using mid-FTIR spectroscopy were developed in order to reduce the time of study of melamine andcyanuric acid in infant formulas. Chemometric models were constructed using the algorithms Partial Least Squares (PLS1, PLS2)and Principal Component Regression (PCR) in order to correlate the IR signal with the levels of melamine or cyanuric acid inthe infant formula samples. Results showed that the best correlations were obtained using PLS1 (R2: 0.9998, SEC: 0.0793, andSEP: 0.5545 for melamine and R2: 0.9997, SEC: 0.1074, and SEP: 0.5021 for cyanuric acid). Also, the SIMCA model was studiedto distinguish between adulterated formulas and nonadulterated samples, giving optimum discrimination and good interclassdistances between samples. Results showed that chemometric models demonstrated a good predictive ability of melamine andcyanuric acid concentrations in infant formulas, showing that this is a rapid and accurate technique to be used in the identificationand quantification of these adulterants in infant formulas.
1. Introduction
Many foods have the potential for being adulterated naturallyor deliberately. Food safety concerns have become a majorconcern due to a string of incidents involving food poisoning[1].
Melamine (2,4,6-triamino-1,3,5-triazine) is used for theproduction of multipurpose melamine-formaldehyde resinsand has high nitrogen content (≈66% by mass). Conse-quently, melamine has been dishonestly added to dairyproducts (such asmilk (liquid or powder) and infant formula)by dishonest milk producers to gain an incorrectly higherreadout of apparent protein content than that determinedby the conventional standard Kjeldahl test [2]. This actionhas been a cause of severe illnesses and numerous infantshave been intoxicated because the addition of melamine
into food products can cause death [3]. Besides melamine,its structural analogue, cyanuric acid (2,4,6-trihydroxy-1,3,5-triazine), was also found to increase apparent protein contentinmilk products and it has been added purposely to give highprotein content [4, 5].
The problems related to melamine and cyanuric acidcontamination have pointed out the need for rapid andreliable techniques capable of detecting these analytes. Toanalyze the banned use of melamine and cyanuric acid, vari-ous analytical methods have been developed. The techniquesare liquid chromatography [6–8], liquid chromatography-mass spectroscopy (LC-MS-MS) [9], gas chromatography(GC) with mass spectroscopy (MS), photodiode detector(DAD), ultraviolet (UV), enzyme-linked immunosorbentassay (ELISA) [10], and capillary zone electrophoresis [11].These methods are costly and demanding.
HindawiJournal of Food QualityVolume 2018, Article ID 7926768, 7 pageshttps://doi.org/10.1155/2018/7926768
2 Journal of Food Quality
Midinfrared spectroscopy (mid-FTIR) is a rapid, reliable,and user-friendly technique, which requires insignificant orno sample preparation and reduces the use of expensivereagents. Coupled with multivariate analysis, mid-FTIR hasbeen useful for adulterant detection in various food products.Midinfrared (mid-FTIR) [12, 13] and near-infrared (NIR-FTIR) spectroscopy have been used to quantify melaminein milk and infant formula powders [13–15]; however, mid-FTIR coupled with multivariate analysis has not been used toquantify cyanuric acid in infant formula powders.
The objective of this work is to evaluate the ability of mid-FTIR combined with chemometrics to detect and quantifymelamine and cyanuric acid in infant formula powders.Notably, the Soft Independent Modeling of Class Analogy(SIMCA) has never been used to discriminate melamine andcyanuric acid in infant formula powders from vibrationalspectral data.
2. Materials and Methods
2.1. Reagents. Melamine (99%) and cyanuric acid (98%) werepurchased from Sigma-Aldrich (St. Louis, Missouri, USA).All chemicals and reagents used were of analytical grade.
2.2. Samples. Infant formula powder samples were acquiredfrom marketplaces in Mexico City. The quality grade ofall the samples was guaranteed by the sellers. However, toidentify melamine in the samples, they were analyzed byimmunosorbent assay (ELISA).
2.3. Immunosorbent Assay (ELISA). The melamine test kit(Microtiter Plate Abraxis�, Abraxis, Warminster, Pennsylva-nia, USA) was used. The test is based on the recognitionof melamine by antibodies. The calibrators, sample extracts,and melamine conjugate are pipetted into test wells coatedwith melamine antibody to initiate the reaction. During the30-minute incubation period, melamine from the sampleand melamine conjugate compete for binding to melamineantibody. Following this 30-minute incubation period, thecontents of the well are removed and the wells are washedto remove any unbound melamine and melamine conjugate.Afterwashingwith the dilutedwash solution, a clear substrateis then added to the wells and any bound enzyme conjugatecauses the conversion to a blue color. Following 20-minuteincubation, the reaction is stopped and the amount of colorin each well is read using an ELISA reader. The color of theunknown samples is compared to the color of the calibratorsand the melamine concentration of the samples is derived.The concentrations of the samples are determined by inter-polation using the standard curve constructed with each run.
2.4. Adulterated Samples. Infant formula powder was spikedwith solutions containing different concentrations of thecorresponding adulterant (melamine or cyanuric acid). Fortysamples of infant formula powder withmelamine or cyanuricacid in concentrations ranging from 0.5𝜇g/L to 20 𝜇g/L withincrements of 0.5𝜇g/L were prepared. Thirty-five of thesesamples were selected for the calibration set and five sampleswere chosen for the validation set.
2.5. Mid-FTIR Spectra Acquisition. The mid-FTIR spectrawere obtained with a PerkinElmer SpectrumGX spectropho-tometer (Norfolk, CT, USA) equipped with a deuteratedtriglycine sulphate detector. The spectra were obtained usingan ATR accessory (Pike Technologies, Madison, WI, USA)with a crystal ZnSe.The spectra were scanned in a wavenum-ber interval of 4000–650 cm−1, 64 scans, and a resolution of4 cm−1. Spectra were managed with the Spectrum softwareversion 3.01.00 (PerkinElmer, Inc.) and acquired in triplicate.
2.6. Multivariate Analysis
2.6.1. Quantitative Multivariate Analysis. The algorithmsPrincipal Component Regression (PCR) and Partial LeastSquares (PLS, two versions: PLS1 and PLS2) were used. Thesoftware Spectrum Quant+ version 4.51.02 (PerkinElmer,Inc.) was used.
Various pretreatments were performed on the spectraldata.The pretreatments were Savitzky-Golay filter (9 points),first derivative (Savitzky-Golay method), and Standard Nor-mal Variate (SNV).
The spectral area designated for building the modelscovered 3600 to 2800 and 1750 to 650 cm−1 because this rangeshowed the highest association between the spectral dataand sample concentrations. 𝑅2 and SEC (Standard Error ofCalibration) were used to select the best model.
Five samples were used for the validation model. Thebest model was selected according to the higher 𝑅2 and SEP(Standard Error of Prediction).
2.6.2. Identification by SIMCA. The model SIMCA wasdeveloped with the software AssureID version 4.0.2.0175(PerkinElmer, Inc.). The classes were infant formula powder,infant formula with melamine, and infant formula withcyanuric acid. The SIMCA model was modeled with 35spectra of each class (infant formula, infant formulawithmel-amine, and infant formula with cyanuric acid). 105mid-FTIRspectra were used. Five samples of each class were used forthe validation model. The best model was selected accordingto the interclass distance (≥3) and the scores plot of principalcomponents.
Various pretreatments were performed on the spectraldata: ambient filters, Savitzky-Golay filter (13 points), deriva-tive, Standard Normal Variate (SNV), and Detrending (DT).
3. Results and Discussion
3.1. Quantification of Melamine by ELISA. 𝑅2 = 0.9958 wasobtained on the calibration curve for the ELISA determina-tions. In the infant formula samples, no melamine residueswere quantified, so these samples were used to construct theprediction models.
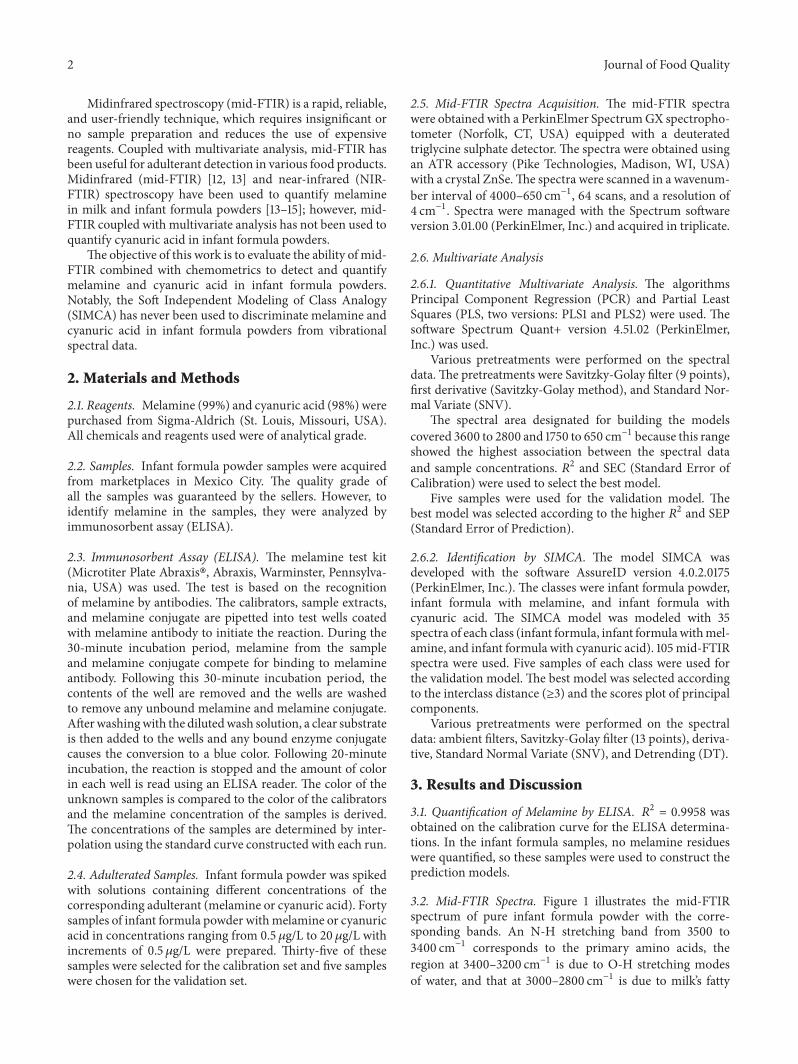
3.2. Mid-FTIR Spectra. Figure 1 illustrates the mid-FTIRspectrum of pure infant formula powder with the corre-sponding bands. An N-H stretching band from 3500 to3400 cm−1 corresponds to the primary amino acids, theregion at 3400–3200 cm−1 is due to O-H stretching modesof water, and that at 3000–2800 cm−1 is due to milk’s fatty
Journal of Food Quality 3
1.6
1.4
1.2
1.0
0.8
0.6
0.4
0.2
(A)
4000 3200 2400 1800 1400 1000 800
(cG−1)
3500–3400N-H
3400–3200O-H 3000–2800
C-H
1800–1600C=O
1650–1540N-H/C=O
1460–1235C-N
1250–800C-O/C-C/C-O-C
875–750Lactose
Figure 1: Mid-FTIR spectrum of infant formula powder.
acid CH2 stretching. The peak at 1800–1600 cm−1 is due totriglyceride functional groups (C=O stretching). The peak at1650 cm−1 is due to amide I and C=O stretching; the band at1540 cm−1 corresponds to N-H bending with C-N stretching.At 1460–1235 cm−1, it corresponds to C-N stretch vibrations(amides I, II). The mono- and polysaccharides dominate theregion at 1250–800 cm−1 (C-O-C stretch related to sugar aslactose) [16, 17].
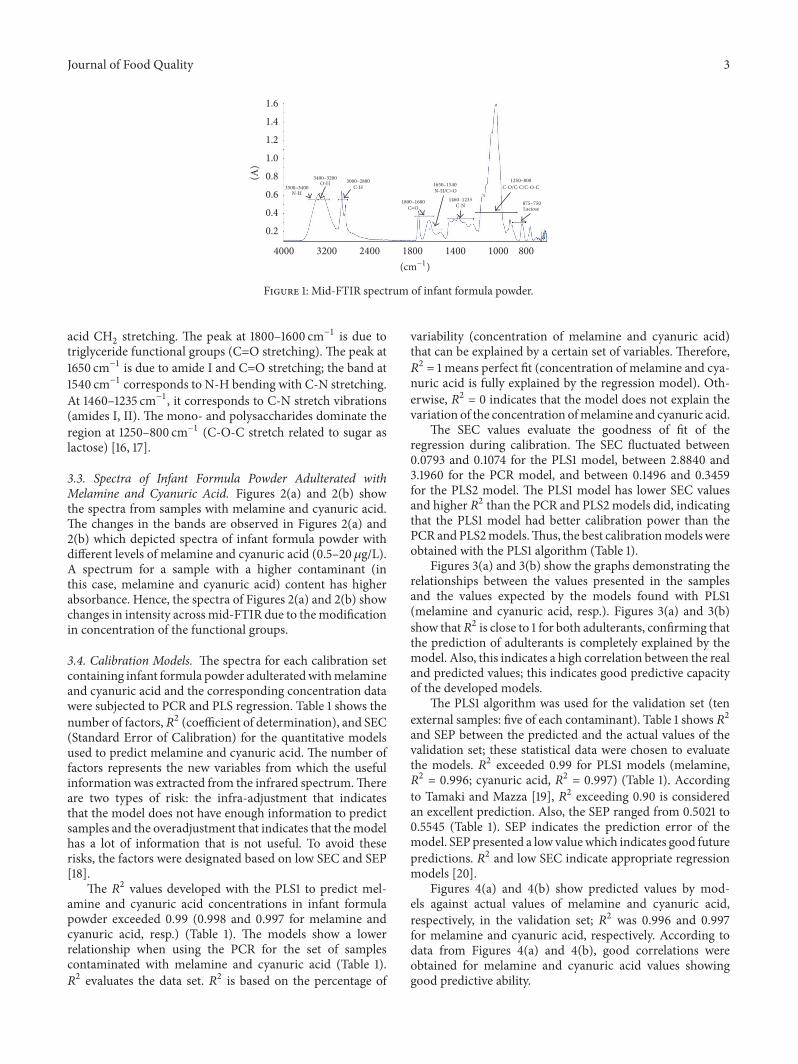
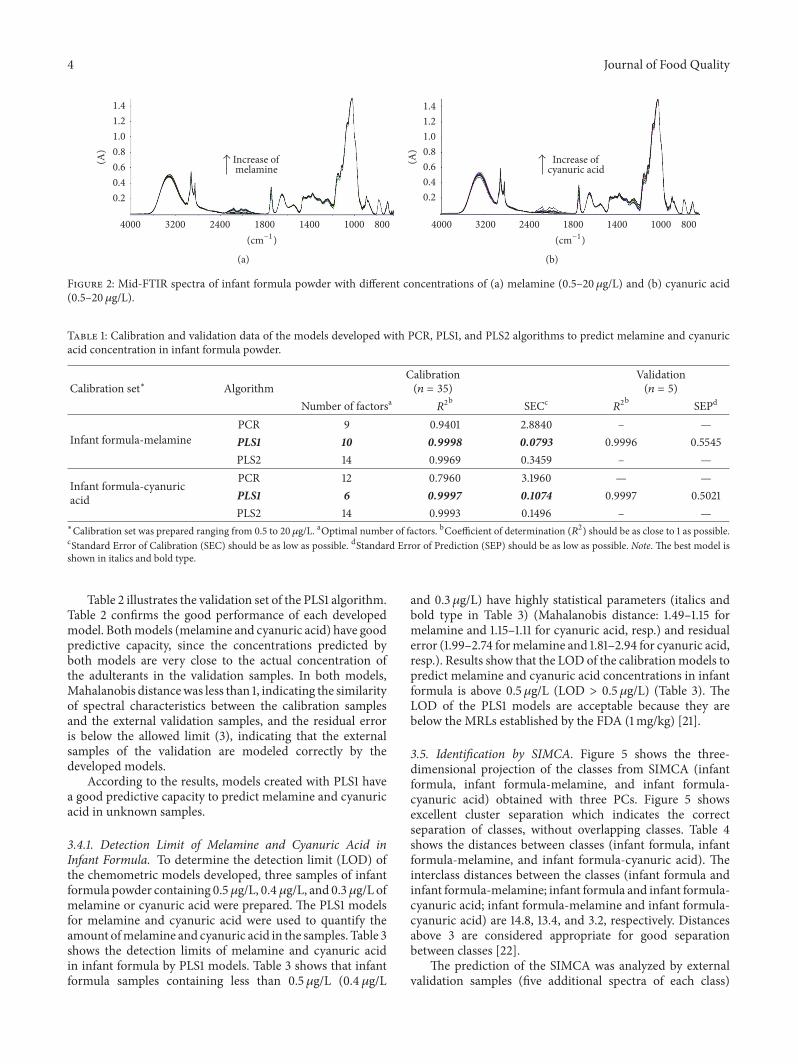
3.3. Spectra of Infant Formula Powder Adulterated withMelamine and Cyanuric Acid. Figures 2(a) and 2(b) showthe spectra from samples with melamine and cyanuric acid.The changes in the bands are observed in Figures 2(a) and2(b) which depicted spectra of infant formula powder withdifferent levels of melamine and cyanuric acid (0.5–20 𝜇g/L).A spectrum for a sample with a higher contaminant (inthis case, melamine and cyanuric acid) content has higherabsorbance. Hence, the spectra of Figures 2(a) and 2(b) showchanges in intensity across mid-FTIR due to themodificationin concentration of the functional groups.
3.4. Calibration Models. The spectra for each calibration setcontaining infant formula powder adulteratedwithmelamineand cyanuric acid and the corresponding concentration datawere subjected to PCR and PLS regression. Table 1 shows thenumber of factors,𝑅2 (coefficient of determination), and SEC(Standard Error of Calibration) for the quantitative modelsused to predict melamine and cyanuric acid. The number offactors represents the new variables from which the usefulinformation was extracted from the infrared spectrum.Thereare two types of risk: the infra-adjustment that indicatesthat the model does not have enough information to predictsamples and the overadjustment that indicates that themodelhas a lot of information that is not useful. To avoid theserisks, the factors were designated based on low SEC and SEP[18].
The 𝑅2 values developed with the PLS1 to predict mel-amine and cyanuric acid concentrations in infant formulapowder exceeded 0.99 (0.998 and 0.997 for melamine andcyanuric acid, resp.) (Table 1). The models show a lowerrelationship when using the PCR for the set of samplescontaminated with melamine and cyanuric acid (Table 1).𝑅2 evaluates the data set. 𝑅2 is based on the percentage of
variability (concentration of melamine and cyanuric acid)that can be explained by a certain set of variables. Therefore,𝑅2 = 1 means perfect fit (concentration of melamine and cya-nuric acid is fully explained by the regression model). Oth-erwise, 𝑅2 = 0 indicates that the model does not explain thevariation of the concentration ofmelamine and cyanuric acid.
The SEC values evaluate the goodness of fit of theregression during calibration. The SEC fluctuated between0.0793 and 0.1074 for the PLS1 model, between 2.8840 and3.1960 for the PCR model, and between 0.1496 and 0.3459for the PLS2 model. The PLS1 model has lower SEC valuesand higher 𝑅2 than the PCR and PLS2 models did, indicatingthat the PLS1 model had better calibration power than thePCR andPLS2models.Thus, the best calibrationmodels wereobtained with the PLS1 algorithm (Table 1).
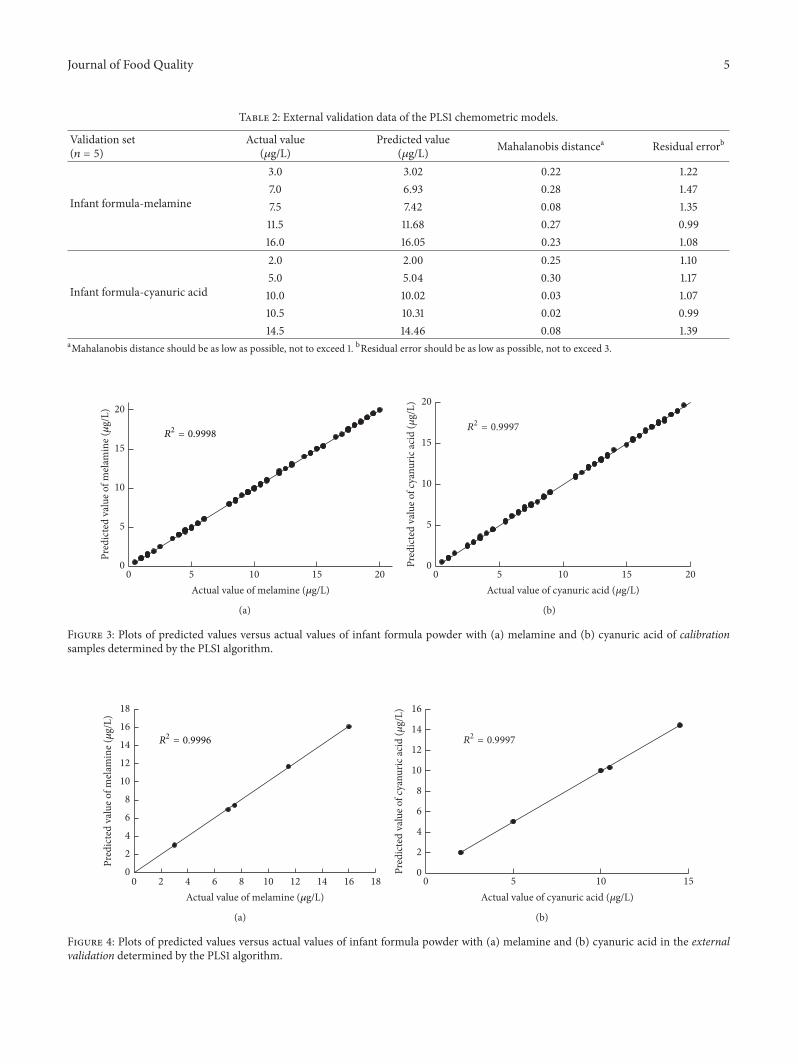
Figures 3(a) and 3(b) show the graphs demonstrating therelationships between the values presented in the samplesand the values expected by the models found with PLS1(melamine and cyanuric acid, resp.). Figures 3(a) and 3(b)show that𝑅2 is close to 1 for both adulterants, confirming thatthe prediction of adulterants is completely explained by themodel. Also, this indicates a high correlation between the realand predicted values; this indicates good predictive capacityof the developed models.
The PLS1 algorithm was used for the validation set (tenexternal samples: five of each contaminant). Table 1 shows 𝑅2and SEP between the predicted and the actual values of thevalidation set; these statistical data were chosen to evaluatethe models. 𝑅2 exceeded 0.99 for PLS1 models (melamine,𝑅2 = 0.996; cyanuric acid, 𝑅2 = 0.997) (Table 1). Accordingto Tamaki and Mazza [19], 𝑅2 exceeding 0.90 is consideredan excellent prediction. Also, the SEP ranged from 0.5021 to0.5545 (Table 1). SEP indicates the prediction error of themodel. SEP presented a low valuewhich indicates good futurepredictions. 𝑅2 and low SEC indicate appropriate regressionmodels [20].
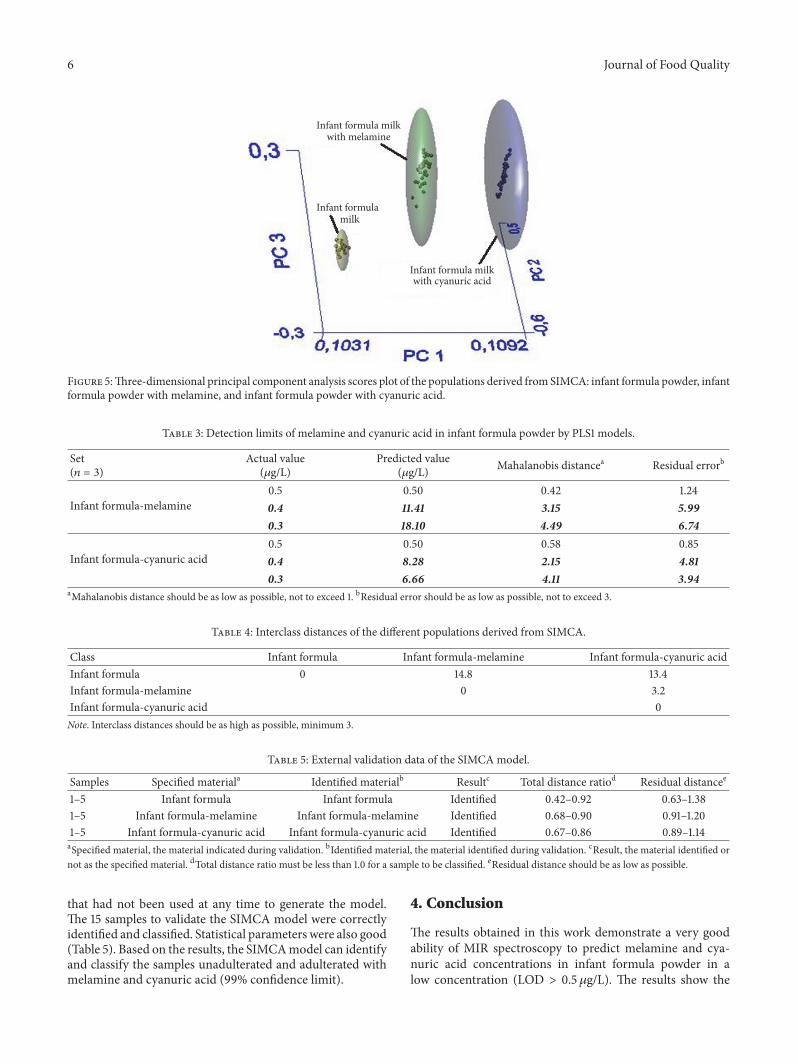
Figures 4(a) and 4(b) show predicted values by mod-els against actual values of melamine and cyanuric acid,respectively, in the validation set; 𝑅2 was 0.996 and 0.997for melamine and cyanuric acid, respectively. According todata from Figures 4(a) and 4(b), good correlations wereobtained for melamine and cyanuric acid values showinggood predictive ability.
4 Journal of Food Quality
1.4
1.2
1.0
0.8
0.6
0.4
0.2
(A)
4000 3200 2400 1800 1400 1000 800
(cG−1)
Increase ofmelamine
(a)
1.4
1.2
1.0
0.8
0.6
0.4
0.2
(A)
Increase ofcyanuric acid
4000 3200 2400 1800 1400 1000 800
(cG−1)
(b)
Figure 2: Mid-FTIR spectra of infant formula powder with different concentrations of (a) melamine (0.5–20 𝜇g/L) and (b) cyanuric acid(0.5–20 𝜇g/L).
Table 1: Calibration and validation data of the models developed with PCR, PLS1, and PLS2 algorithms to predict melamine and cyanuricacid concentration in infant formula powder.
Calibration set∗ AlgorithmCalibration(𝑛 = 35)
Validation(𝑛 = 5)
Number of factorsa 𝑅2b SECc 𝑅2
b SEPd
Infant formula-melaminePCR 9 0.9401 2.8840 – —PLS1 10 0.9998 0.0793 0.9996 0.5545PLS2 14 0.9969 0.3459 – —
Infant formula-cyanuricacid
PCR 12 0.7960 3.1960 — —PLS1 6 0.9997 0.1074 0.9997 0.5021PLS2 14 0.9993 0.1496 – —
∗Calibration set was prepared ranging from 0.5 to 20 𝜇g/L. aOptimal number of factors. bCoefficient of determination (𝑅2) should be as close to 1 as possible.cStandard Error of Calibration (SEC) should be as low as possible. dStandard Error of Prediction (SEP) should be as low as possible. Note. The best model isshown in italics and bold type.
Table 2 illustrates the validation set of the PLS1 algorithm.Table 2 confirms the good performance of each developedmodel. Bothmodels (melamine and cyanuric acid) have goodpredictive capacity, since the concentrations predicted byboth models are very close to the actual concentration ofthe adulterants in the validation samples. In both models,Mahalanobis distancewas less than 1, indicating the similarityof spectral characteristics between the calibration samplesand the external validation samples, and the residual erroris below the allowed limit (3), indicating that the externalsamples of the validation are modeled correctly by thedeveloped models.
According to the results, models created with PLS1 havea good predictive capacity to predict melamine and cyanuricacid in unknown samples.
3.4.1. Detection Limit of Melamine and Cyanuric Acid inInfant Formula. To determine the detection limit (LOD) ofthe chemometric models developed, three samples of infantformula powder containing 0.5𝜇g/L, 0.4 𝜇g/L, and 0.3 𝜇g/L ofmelamine or cyanuric acid were prepared. The PLS1 modelsfor melamine and cyanuric acid were used to quantify theamount ofmelamine and cyanuric acid in the samples. Table 3shows the detection limits of melamine and cyanuric acidin infant formula by PLS1 models. Table 3 shows that infantformula samples containing less than 0.5𝜇g/L (0.4𝜇g/L
and 0.3 𝜇g/L) have highly statistical parameters (italics andbold type in Table 3) (Mahalanobis distance: 1.49–1.15 formelamine and 1.15–1.11 for cyanuric acid, resp.) and residualerror (1.99–2.74 formelamine and 1.81–2.94 for cyanuric acid,resp.). Results show that the LOD of the calibrationmodels topredict melamine and cyanuric acid concentrations in infantformula is above 0.5𝜇g/L (LOD > 0.5𝜇g/L) (Table 3). TheLOD of the PLS1 models are acceptable because they arebelow the MRLs established by the FDA (1mg/kg) [21].
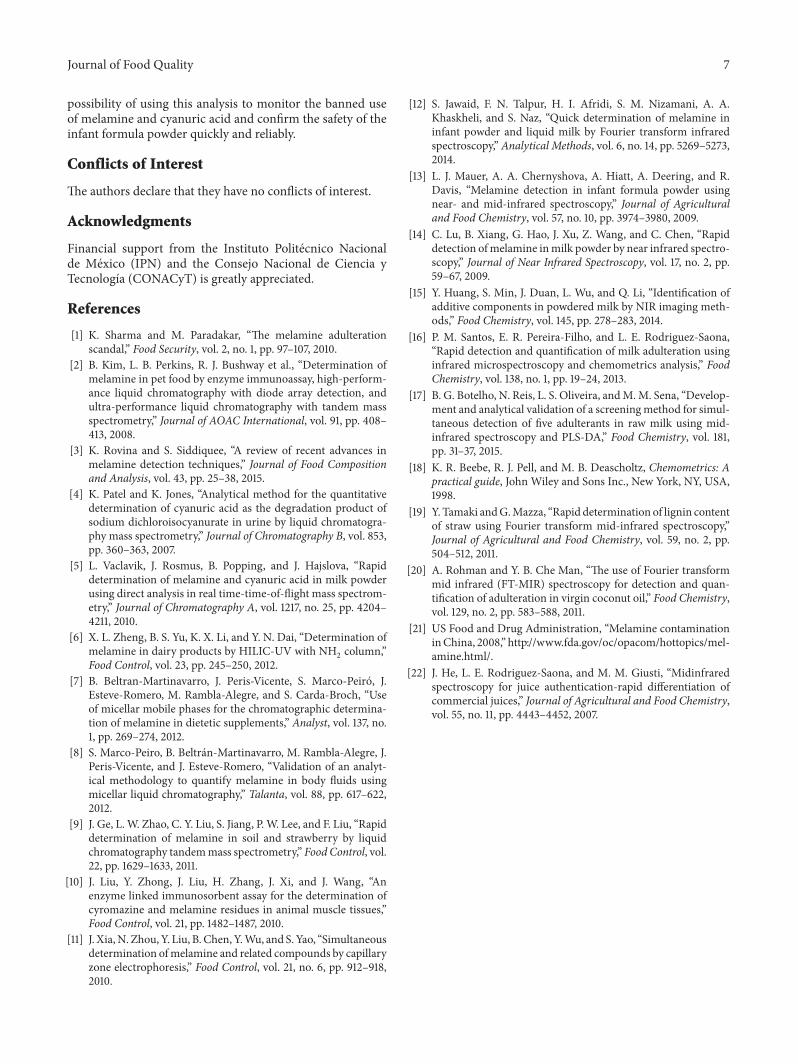
3.5. Identification by SIMCA. Figure 5 shows the three-dimensional projection of the classes from SIMCA (infantformula, infant formula-melamine, and infant formula-cyanuric acid) obtained with three PCs. Figure 5 showsexcellent cluster separation which indicates the correctseparation of classes, without overlapping classes. Table 4shows the distances between classes (infant formula, infantformula-melamine, and infant formula-cyanuric acid). Theinterclass distances between the classes (infant formula andinfant formula-melamine; infant formula and infant formula-cyanuric acid; infant formula-melamine and infant formula-cyanuric acid) are 14.8, 13.4, and 3.2, respectively. Distancesabove 3 are considered appropriate for good separationbetween classes [22].
The prediction of the SIMCA was analyzed by externalvalidation samples (five additional spectra of each class)
Journal of Food Quality 5
Table 2: External validation data of the PLS1 chemometric models.
Validation set(𝑛 = 5)
Actual value(𝜇g/L)
Predicted value(𝜇g/L) Mahalanobis distancea Residual errorb
Infant formula-melamine
3.0 3.02 0.22 1.227.0 6.93 0.28 1.477.5 7.42 0.08 1.3511.5 11.68 0.27 0.9916.0 16.05 0.23 1.08
Infant formula-cyanuric acid
2.0 2.00 0.25 1.105.0 5.04 0.30 1.1710.0 10.02 0.03 1.0710.5 10.31 0.02 0.9914.5 14.46 0.08 1.39
aMahalanobis distance should be as low as possible, not to exceed 1. bResidual error should be as low as possible, not to exceed 3.
0
5
10
15
20
0 5 10 15 20
Pred
icte
d va
lue o
f mel
amin
e (
g/L)
Actual value of melamine (g/L)
R2 = 0.9998
(a)
0
5
10
15
20
0 5 10 15 20
Pred
icte
d va
lue o
f cya
nuric
acid
(g/
L)
Actual value of cyanuric acid (g/L)
R2 = 0.9997
(b)
Figure 3: Plots of predicted values versus actual values of infant formula powder with (a) melamine and (b) cyanuric acid of calibrationsamples determined by the PLS1 algorithm.
0
2
4
6
8
10
12
14
16
18
0 2 4 6 8 10 12 14 16 18
Pred
icte
d va
lue o
f mel
amin
e (
g/L)
Actual value of melamine (g/L)
R2 = 0.9996
(a)
0
2
4
6
8
10
12
14
16
0 5 10 15
Pred
icte
d va
lue o
f cya
nuric
acid
(g/
L)
Actual value of cyanuric acid (g/L)
R2 = 0.9997
(b)
Figure 4: Plots of predicted values versus actual values of infant formula powder with (a) melamine and (b) cyanuric acid in the externalvalidation determined by the PLS1 algorithm.
6 Journal of Food Quality
Infant formula milkwith melamine
Infant formulamilk
Infant formula milkwith cyanuric acid
Figure 5:Three-dimensional principal component analysis scores plot of the populations derived from SIMCA: infant formula powder, infantformula powder with melamine, and infant formula powder with cyanuric acid.
Table 3: Detection limits of melamine and cyanuric acid in infant formula powder by PLS1 models.
Set(𝑛 = 3)
Actual value(𝜇g/L)
Predicted value(𝜇g/L) Mahalanobis distancea Residual errorb
Infant formula-melamine0.5 0.50 0.42 1.240.4 11.41 3.15 5.990.3 18.10 4.49 6.74
Infant formula-cyanuric acid0.5 0.50 0.58 0.850.4 8.28 2.15 4.810.3 6.66 4.11 3.94
aMahalanobis distance should be as low as possible, not to exceed 1. bResidual error should be as low as possible, not to exceed 3.
Table 4: Interclass distances of the different populations derived from SIMCA.
Class Infant formula Infant formula-melamine Infant formula-cyanuric acidInfant formula 0 14.8 13.4Infant formula-melamine 0 3.2Infant formula-cyanuric acid 0Note. Interclass distances should be as high as possible, minimum 3.
Table 5: External validation data of the SIMCA model.
Samples Specified materiala Identified materialb Resultc Total distance ratiod Residual distancee
1–5 Infant formula Infant formula Identified 0.42–0.92 0.63–1.381–5 Infant formula-melamine Infant formula-melamine Identified 0.68–0.90 0.91–1.201–5 Infant formula-cyanuric acid Infant formula-cyanuric acid Identified 0.67–0.86 0.89–1.14aSpecifiedmaterial, the material indicated during validation. bIdentifiedmaterial, the material identified during validation. cResult, the material identified ornot as the specified material. dTotal distance ratio must be less than 1.0 for a sample to be classified. eResidual distance should be as low as possible.
that had not been used at any time to generate the model.The 15 samples to validate the SIMCA model were correctlyidentified and classified. Statistical parameters were also good(Table 5). Based on the results, the SIMCAmodel can identifyand classify the samples unadulterated and adulterated withmelamine and cyanuric acid (99% confidence limit).
4. Conclusion
The results obtained in this work demonstrate a very goodability of MIR spectroscopy to predict melamine and cya-nuric acid concentrations in infant formula powder in alow concentration (LOD > 0.5𝜇g/L). The results show the
Journal of Food Quality 7
possibility of using this analysis to monitor the banned useof melamine and cyanuric acid and confirm the safety of theinfant formula powder quickly and reliably.
Conflicts of Interest
The authors declare that they have no conflicts of interest.
Acknowledgments
Financial support from the Instituto Politecnico Nacionalde Mexico (IPN) and the Consejo Nacional de Ciencia yTecnologıa (CONACyT) is greatly appreciated.
References
[1] K. Sharma and M. Paradakar, “The melamine adulterationscandal,” Food Security, vol. 2, no. 1, pp. 97–107, 2010.
[2] B. Kim, L. B. Perkins, R. J. Bushway et al., “Determination ofmelamine in pet food by enzyme immunoassay, high-perform-ance liquid chromatography with diode array detection, andultra-performance liquid chromatography with tandem massspectrometry,” Journal of AOAC International, vol. 91, pp. 408–413, 2008.
[3] K. Rovina and S. Siddiquee, “A review of recent advances inmelamine detection techniques,” Journal of Food Compositionand Analysis, vol. 43, pp. 25–38, 2015.
[4] K. Patel and K. Jones, “Analytical method for the quantitativedetermination of cyanuric acid as the degradation product ofsodium dichloroisocyanurate in urine by liquid chromatogra-phy mass spectrometry,” Journal of Chromatography B, vol. 853,pp. 360–363, 2007.
[5] L. Vaclavik, J. Rosmus, B. Popping, and J. Hajslova, “Rapiddetermination of melamine and cyanuric acid in milk powderusing direct analysis in real time-time-of-flight mass spectrom-etry,” Journal of Chromatography A, vol. 1217, no. 25, pp. 4204–4211, 2010.
[6] X. L. Zheng, B. S. Yu, K. X. Li, and Y. N. Dai, “Determination ofmelamine in dairy products by HILIC-UV with NH2 column,”Food Control, vol. 23, pp. 245–250, 2012.
[7] B. Beltran-Martinavarro, J. Peris-Vicente, S. Marco-Peiro, J.Esteve-Romero, M. Rambla-Alegre, and S. Carda-Broch, “Useof micellar mobile phases for the chromatographic determina-tion of melamine in dietetic supplements,” Analyst, vol. 137, no.1, pp. 269–274, 2012.
[8] S. Marco-Peiro, B. Beltran-Martinavarro, M. Rambla-Alegre, J.Peris-Vicente, and J. Esteve-Romero, “Validation of an analyt-ical methodology to quantify melamine in body fluids usingmicellar liquid chromatography,” Talanta, vol. 88, pp. 617–622,2012.
[9] J. Ge, L.W. Zhao, C. Y. Liu, S. Jiang, P.W. Lee, and F. Liu, “Rapiddetermination of melamine in soil and strawberry by liquidchromatography tandemmass spectrometry,” Food Control, vol.22, pp. 1629–1633, 2011.
[10] J. Liu, Y. Zhong, J. Liu, H. Zhang, J. Xi, and J. Wang, “Anenzyme linked immunosorbent assay for the determination ofcyromazine and melamine residues in animal muscle tissues,”Food Control, vol. 21, pp. 1482–1487, 2010.
[11] J. Xia,N. Zhou, Y. Liu, B. Chen, Y.Wu, and S. Yao, “Simultaneousdetermination ofmelamine and related compounds by capillaryzone electrophoresis,” Food Control, vol. 21, no. 6, pp. 912–918,2010.
[12] S. Jawaid, F. N. Talpur, H. I. Afridi, S. M. Nizamani, A. A.Khaskheli, and S. Naz, “Quick determination of melamine ininfant powder and liquid milk by Fourier transform infraredspectroscopy,” Analytical Methods, vol. 6, no. 14, pp. 5269–5273,2014.
[13] L. J. Mauer, A. A. Chernyshova, A. Hiatt, A. Deering, and R.Davis, “Melamine detection in infant formula powder usingnear- and mid-infrared spectroscopy,” Journal of Agriculturaland Food Chemistry, vol. 57, no. 10, pp. 3974–3980, 2009.
[14] C. Lu, B. Xiang, G. Hao, J. Xu, Z. Wang, and C. Chen, “Rapiddetection ofmelamine inmilk powder by near infrared spectro-scopy,” Journal of Near Infrared Spectroscopy, vol. 17, no. 2, pp.59–67, 2009.
[15] Y. Huang, S. Min, J. Duan, L. Wu, and Q. Li, “Identification ofadditive components in powdered milk by NIR imaging meth-ods,” Food Chemistry, vol. 145, pp. 278–283, 2014.
[16] P. M. Santos, E. R. Pereira-Filho, and L. E. Rodriguez-Saona,“Rapid detection and quantification of milk adulteration usinginfrared microspectroscopy and chemometrics analysis,” FoodChemistry, vol. 138, no. 1, pp. 19–24, 2013.
[17] B. G. Botelho, N. Reis, L. S. Oliveira, andM.M. Sena, “Develop-ment and analytical validation of a screeningmethod for simul-taneous detection of five adulterants in raw milk using mid-infrared spectroscopy and PLS-DA,” Food Chemistry, vol. 181,pp. 31–37, 2015.
[18] K. R. Beebe, R. J. Pell, and M. B. Deascholtz, Chemometrics: Apractical guide, John Wiley and Sons Inc., New York, NY, USA,1998.
[19] Y. Tamaki andG.Mazza, “Rapid determination of lignin contentof straw using Fourier transform mid-infrared spectroscopy,”Journal of Agricultural and Food Chemistry, vol. 59, no. 2, pp.504–512, 2011.
[20] A. Rohman and Y. B. Che Man, “The use of Fourier transformmid infrared (FT-MIR) spectroscopy for detection and quan-tification of adulteration in virgin coconut oil,” Food Chemistry,vol. 129, no. 2, pp. 583–588, 2011.
[21] US Food and Drug Administration, “Melamine contaminationinChina, 2008,” http://www.fda.gov/oc/opacom/hottopics/mel-amine.html/.
[22] J. He, L. E. Rodriguez-Saona, and M. M. Giusti, “Midinfraredspectroscopy for juice authentication-rapid differentiation ofcommercial juices,” Journal of Agricultural and Food Chemistry,vol. 55, no. 11, pp. 4443–4452, 2007.

Hindawiwww.hindawi.com
International Journal of
Volume 2018
Zoology
Hindawiwww.hindawi.com Volume 2018
Anatomy Research International
PeptidesInternational Journal of
Hindawiwww.hindawi.com Volume 2018
Hindawiwww.hindawi.com Volume 2018
Journal of Parasitology Research
GenomicsInternational Journal of
Hindawiwww.hindawi.com Volume 2018
Hindawi Publishing Corporation http://www.hindawi.com Volume 2013Hindawiwww.hindawi.com
The Scientific World Journal
Volume 2018
Hindawiwww.hindawi.com Volume 2018
BioinformaticsAdvances in
Marine BiologyJournal of
Hindawiwww.hindawi.com Volume 2018
Hindawiwww.hindawi.com Volume 2018
Neuroscience Journal
Hindawiwww.hindawi.com Volume 2018
BioMed Research International
Cell BiologyInternational Journal of
Hindawiwww.hindawi.com Volume 2018
Hindawiwww.hindawi.com Volume 2018
Biochemistry Research International
ArchaeaHindawiwww.hindawi.com Volume 2018
Hindawiwww.hindawi.com Volume 2018
Genetics Research International
Hindawiwww.hindawi.com Volume 2018
Advances in
Virolog y Stem Cells International
Hindawiwww.hindawi.com Volume 2018
Hindawiwww.hindawi.com Volume 2018
Enzyme Research
Hindawiwww.hindawi.com Volume 2018
International Journal of
MicrobiologyHindawiwww.hindawi.com
Nucleic AcidsJournal of
Volume 2018
Submit your manuscripts atwww.hindawi.com