Embed Size (px)
Citation preview

1208–1215 Nucleic Acids Research, 2001, Vol. 29, No. 5 © 2001 Oxford University Press
Detection of alkali metal ions in DNA crystals usingstate-of-the-art X-ray diffraction experimentsValentina Tereshko, Christopher J. Wilds, George Minasov1, Thaza P. Prakash5,Martin A. Maier5, Andrew Howard2,3, Zdzislaw Wawrzak4, Muthiah Manoharan5 and Martin Egli*
Department of Biological Sciences, Vanderbilt University, Nashville, TN 37235, USA, 1Department of MolecularPharmacology and Biological Chemistry, Northwestern University Medical School, Chicago, IL 60611, USA,2Department of Biological, Chemical and Physical Sciences, Illinois Institute of Technology, Chicago, IL 60616, USA,3IMCA-CAT, Sector 17 and 4DND-CAT Synchrotron Research Center, Sector 5, Advanced Photon Source, ArgonneNational Laboratory, Argonne, IL 60439, USA and 5Department of Medicinal Chemistry, Isis Pharmaceuticals Inc.,Carlsbad, CA 92008, USA
Received October 3, 2000; Revised and Accepted January 4, 2001
ABSTRACT
The observation of light metal ions in nucleic acidscrystals is generally a fortuitous event. Sodium ionsin particular are notoriously difficult to detectbecause their X-ray scattering contributions arevirtually identical to those of water and Na+…Odistances are only slightly shorter than stronghydrogen bonds between well-ordered water mole-cules. We demonstrate here that replacement of Na+
by K+, Rb+ or Cs+ and precise measurements ofanomalous differences in intensities provide aparticularly sensitive method for detecting alkalimetal ion-binding sites in nucleic acid crystals. Notonly can alkali metal ions be readily located in suchstructures, but the presence of Rb+ or Cs+ also allowsstructure determination by the single wavelengthanomalous diffraction technique. Besides allowingidentification of high occupancy binding sites, thecombination of high resolution and anomalousdiffraction data established here can also pinpointbinding sites that feature only partial occupancy.Conversely, high resolution of the data alone doesnot necessarily allow differentiation between waterand partially ordered metal ions, as demonstratedwith the crystal structure of a DNA duplex deter-mined to a resolution of 0.6 Å.
INTRODUCTION
Despite significant advances in the X-ray analysis of 3D structuresof DNA and RNA over the past two decades, reliable detectionof light metal ions surrounding nucleic acid molecules remainsa challenge. Owing to their regular coordination geometry,earth alkali metal ions such as Mg2+ and Ca2+ can often belocated in Fourier electron density maps. Examples includecrystal structures of small and medium size RNAs determinedat both relatively low (1–4) and high (5,6) resolutions. Crystal
structures of oligodeoxynucleotides at atomic resolutionrevealed the positions of Mg2+ and Ca2+ ions that account forthe neutralization of between 50 and 100% of the negativecharges of phosphate groups (7–12).
Conversely, there are less than a dozen structures currentlydeposited in the Nucleic Acid Database (13) that feature anordered Na+ ion and in most of these the ion displays octahedralcoordination geometry. For a list of these structures seeTable S1 (Supplementary Material available online). The limitednumber of examples attests to the difficulties of reliably detectingNa+ ions with less regular coordination geometry. Thus,whether a particular peak in Fourier electron density mapsends up as a water molecule or a Na+ ion is often a matter ofpersonal judgment and the decision to place an ion, although itmay be chemically reasonable, lacks solid experimentalevidence in many cases. The atomic resolution crystal structureof a parallel-stranded G-tetraplex constitutes an exception inthis respect (14). Since monovalent cations affect the stabilityof the G-tetrad in a crucial manner, the interpretation that elec-tron density peaks in and between the planes formed by fourguanines represent sodium ions is unchallenged.
Replacement of Na+ or K+ by heavier alkali ions in crystalli-zation of a nucleic acid fragment or soaking crystals insolutions of the heavier alkali ions may be helpful for locatingsites occupied by Na+ or K+. For example, crystals of a B-DNAdodecamer grown from solutions supplemented with eitherrubidium or cesium chloride in combination with differenceFourier synthesis revealed coordination of a single Rb+ in theminor groove (15). Keeping in mind the differences in ionicradius and relative binding affinities of alkali metal ions fordouble-stranded DNA (Cs+ > Rb+ > K+ > Na+; 16), we maytake this observation as an indication that Na+ can occupy amore or less identical site as Rb+. In a similar fashion, bindingof K+ below a so-called AA platform within a domain of groupI intron RNA was confirmed by soaking crystals in thalliumacetate or cesium hydroxide and examining the correspondingregion of difference electron density maps for changes inintensity (17).
*To whom correspondence should be addressed. Tel: +1 615 343 8070; Fax: +1 615 343 6707; Email: [email protected] may also be addressed to Muthiah Manoharan. Tel: +1 760 603 2381; Fax: +1 760 929 0036; Email: [email protected]
Nucleic Acids Research, 2001, Vol. 29, No. 5 1209
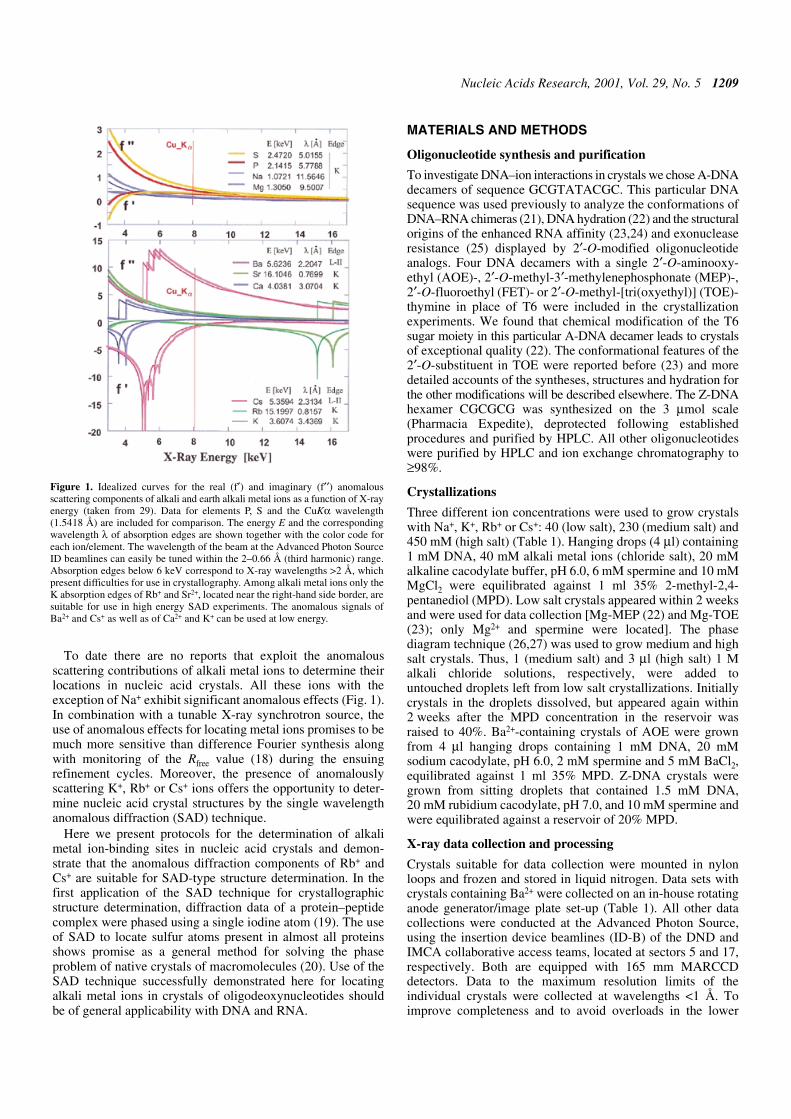
To date there are no reports that exploit the anomalousscattering contributions of alkali metal ions to determine theirlocations in nucleic acid crystals. All these ions with theexception of Na+ exhibit significant anomalous effects (Fig. 1).In combination with a tunable X-ray synchrotron source, theuse of anomalous effects for locating metal ions promises to bemuch more sensitive than difference Fourier synthesis alongwith monitoring of the Rfree value (18) during the ensuingrefinement cycles. Moreover, the presence of anomalouslyscattering K+, Rb+ or Cs+ ions offers the opportunity to deter-mine nucleic acid crystal structures by the single wavelengthanomalous diffraction (SAD) technique.
Here we present protocols for the determination of alkalimetal ion-binding sites in nucleic acid crystals and demon-strate that the anomalous diffraction components of Rb+ andCs+ are suitable for SAD-type structure determination. In thefirst application of the SAD technique for crystallographicstructure determination, diffraction data of a protein–peptidecomplex were phased using a single iodine atom (19). The useof SAD to locate sulfur atoms present in almost all proteinsshows promise as a general method for solving the phaseproblem of native crystals of macromolecules (20). Use of theSAD technique successfully demonstrated here for locatingalkali metal ions in crystals of oligodeoxynucleotides shouldbe of general applicability with DNA and RNA.
MATERIALS AND METHODS
Oligonucleotide synthesis and purification
To investigate DNA–ion interactions in crystals we chose A-DNAdecamers of sequence GCGTATACGC. This particular DNAsequence was used previously to analyze the conformations ofDNA–RNA chimeras (21), DNA hydration (22) and the structuralorigins of the enhanced RNA affinity (23,24) and exonucleaseresistance (25) displayed by 2′-O-modified oligonucleotideanalogs. Four DNA decamers with a single 2′-O-aminooxy-ethyl (AOE)-, 2′-O-methyl-3′-methylenephosphonate (MEP)-,2′-O-fluoroethyl (FET)- or 2′-O-methyl-[tri(oxyethyl)] (TOE)-thymine in place of T6 were included in the crystallizationexperiments. We found that chemical modification of the T6sugar moiety in this particular A-DNA decamer leads to crystalsof exceptional quality (22). The conformational features of the2′-O-substituent in TOE were reported before (23) and moredetailed accounts of the syntheses, structures and hydration forthe other modifications will be described elsewhere. The Z-DNAhexamer CGCGCG was synthesized on the 3 µmol scale(Pharmacia Expedite), deprotected following establishedprocedures and purified by HPLC. All other oligonucleotideswere purified by HPLC and ion exchange chromatography to≥98%.
Crystallizations
Three different ion concentrations were used to grow crystalswith Na+, K+, Rb+ or Cs+: 40 (low salt), 230 (medium salt) and450 mM (high salt) (Table 1). Hanging drops (4 µl) containing1 mM DNA, 40 mM alkali metal ions (chloride salt), 20 mMalkaline cacodylate buffer, pH 6.0, 6 mM spermine and 10 mMMgCl2 were equilibrated against 1 ml 35% 2-methyl-2,4-pentanediol (MPD). Low salt crystals appeared within 2 weeksand were used for data collection [Mg-MEP (22) and Mg-TOE(23); only Mg2+ and spermine were located]. The phasediagram technique (26,27) was used to grow medium and highsalt crystals. Thus, 1 (medium salt) and 3 µl (high salt) 1 Malkali chloride solutions, respectively, were added tountouched droplets left from low salt crystallizations. Initiallycrystals in the droplets dissolved, but appeared again within2 weeks after the MPD concentration in the reservoir wasraised to 40%. Ba2+-containing crystals of AOE were grownfrom 4 µl hanging drops containing 1 mM DNA, 20 mMsodium cacodylate, pH 6.0, 2 mM spermine and 5 mM BaCl2,equilibrated against 1 ml 35% MPD. Z-DNA crystals weregrown from sitting droplets that contained 1.5 mM DNA,20 mM rubidium cacodylate, pH 7.0, and 10 mM spermine andwere equilibrated against a reservoir of 20% MPD.
X-ray data collection and processing
Crystals suitable for data collection were mounted in nylonloops and frozen and stored in liquid nitrogen. Data sets withcrystals containing Ba2+ were collected on an in-house rotatinganode generator/image plate set-up (Table 1). All other datacollections were conducted at the Advanced Photon Source,using the insertion device beamlines (ID-B) of the DND andIMCA collaborative access teams, located at sectors 5 and 17,respectively. Both are equipped with 165 mm MARCCDdetectors. Data to the maximum resolution limits of theindividual crystals were collected at wavelengths <1 Å. Toimprove completeness and to avoid overloads in the lower
Figure 1. Idealized curves for the real (f′) and imaginary (f′′) anomalousscattering components of alkali and earth alkali metal ions as a function of X-rayenergy (taken from 29). Data for elements P, S and the CuKα wavelength(1.5418 Å) are included for comparison. The energy E and the correspondingwavelength λ of absorption edges are shown together with the color code foreach ion/element. The wavelength of the beam at the Advanced Photon SourceID beamlines can easily be tuned within the 2–0.66 Å (third harmonic) range.Absorption edges below 6 keV correspond to X-ray wavelengths >2 Å, whichpresent difficulties for use in crystallography. Among alkali metal ions only theK absorption edges of Rb+ and Sr2+, located near the right-hand side border, aresuitable for use in high energy SAD experiments. The anomalous signals ofBa2+ and Cs+ as well as of Ca2+ and K+ can be used at low energy.

1210 Nucleic Acids Research, 2001, Vol. 29, No. 5
resolution bins, separate data sets were measured for the lowand high resolution ranges in each case. Anomalous data werecollected at a wavelength of 0.8151 Å for Rb+-containingcrystals (third harmonic range) and in the low energy range(≥1.54 Å) for all other crystals (Fig. 1). All data were integratedand scaled either in the DENZO/SCALEPACK or HKL2000suites (28) and selected crystal data and data collection parametersare summarized in Table 1.
Structure determination, Patterson and electron densitymap calculation and refinement
Heavy atom searches, Patterson map as well as electrondensity map calculations and SAD phasing were performedwith the program CNS (29) and maps were displayed with theprogram TURBO FRODO (30). For all structures initial refine-ments were performed with CNS. To calculate the Rfree values(18) 10% of the data were set aside prior to the refinements. Allanisotropic refinements with high resolution data wereconducted with the program SHELX-97 (31). Selected refine-ment parameters for all structures based on high resolutiondata are listed in Table 1.
Coordinates
Final coordinates and structure factors for all structures weredeposited in the Protein Data Bank (PDB). PDB codes: 1I0F(Ba-AOE), 1I0J (Cs-MEP), 1I0K (Cs-TOE), 1I0M (Rb-FET),
1I0N (Rb-TOE), 1I0O (K-MEP), 1I0P (K-TOE), 1I0Q (Na-TOE), 1I0G (Na-FET) and 1I0T (Z-DNA).
RESULTS AND DISCUSSION
Overall strategy
In order to explore the feasibility of using the anomalousdiffraction of alkali metal ions to locate their binding sites innucleic acid crystals and to provide phase information via SAD,we conducted an extensive set of X-ray diffraction experiments atthe Advanced Photon Source. The study included a variety ofA-form DNA decamer crystals for which multiple data sets atdifferent wavelengths were collected so as to optimize both themagnitude of the anomalous signal and the resolution(Table 1). The structures of a Ba2+-form crystal (strong anomaloussignal) and of the Z-DNA duplex (resolution 0.6 Å) were usedas ‘anomalous diffraction’ and ‘high resolution’ references.
Anomalous data were collected in the low energy range forK+, Cs+ and Ba2+ or, in the case of Rb+, at the K absorption edge(Fig. 1). Preliminary diffraction experiments were also conductedwith decamer crystals containing Sr2+ and confirmed the useful-ness of this ion for SAD-based structure determination (datanot shown). While anomalous data were typically collected toresolutions of ∼2 Å, data to high resolution (up to 1.05 Å) werealso collected at a shorter wavelength for each crystal (Table1). The benefits of atomic resolution data for analyzing ion and
Table 1. Data collection and refinement statistics of A-DNA decamers GCGTATACGC in space group P212121
aRefinement with ion occupancy equal to 1.bR factor = Σhkl|F(hkl)o – F(hkl)c|/ΣhklF(hkl)o. Rmerge = ΣhklΣi|I(hkl)i – <I(hkl)>|/ΣhklΣi<I(hkl)i>. λ, D, the wavelength and resolution of the X-ray data; N ref, %, thenumber of unique reflections and completeness.cR factors based on 2.0 Å anomalous data.d∆F/F =Σhkl<|F(+)| – |F(–)|>/<1/2(|F(+)| + |F(–)|>. PP, FOM, phasing power and figure of merit.
CompoundSalt form
Ba-AOE Cs-MEPhigh
Cs-TOEmedium
Rb-FEThigh
Rb-TOEmedium
K-MEPhigh
K-TOEmedium
Na-TOEmedium
Na-FETmedium
Z-DNA
Unit cell a, Å 24.99 24.82 24.87 24.82 25.16 24.65 25.13 25.13 24.96 18.32
b, Å 44.57 44.33 44.68 45.26 44.83 44.61 44.53 44.53 43.57 30.68
c, Å 45.12 44.82 44.69 43.97 44.82 44.16 45.13 45.13 45.40 42.49
B factora (Å2) DNA 21 8 13 12 16 25 15 15 19 6
Site 1 – 10 15 15 25 30 33 – – –
Site 2 35 (Ba) 25 35 30 40 35 32 21 50 (Mg) –
Site 3 – 60 65 69 70 35 34 25 33 –
High resolution X-ray datab λ, Å 1.5418 0.8151 0.9500 0.9500 0.9500 0.8151 0.8151 0.8151 0.6630
D, Å 1.70 1.06 1.05 1.05 1.30 1.30 1.30 1.45 0.60
N ref 6913 22 132 19 840 22 802 12 230 12 024 12 024 8695 57 623
% 97.5 97.2 95.1 99.8 99.5 98.9 98.9 99.7 96.0
Rmerge 0.068 0.057 0.041 0.046 0.044 0.041 0.041 0.058 0.062
Rwork/free 19.0/21.2 15.0/16.9 16.1/17.8 15.4/17.0 16.5/19.0 20.2/24.6c 16.1/17.9 16.1/18.1 15.9/19 16.0/18.5
Anomalous X-ray datad λ, Å 1.5418 1.6531 1.7970 0.8151 0.8151 1.6513
D, Å 2.50 2.0 2.0 1.50 1.50 2.0
% 97.5 99.3 98.7 98.8 99.1 98.4
Rmerge 0.065 0.082 0.079 0.059 0.044 0.092
∆F/F 0.0469 0.0784 0.0384 0.0620 0.021 0.019
PP 1.20 1.68 1.35 2.66 – –
FOM 0.33 0.41 0.35 0.51 – –
Nucleic Acids Research, 2001, Vol. 29, No. 5 1211
solvent interactions in crystals are obvious and an approachthat combines the precision of high resolution with the sensi-tivity of anomalous diffraction can be expected to be superiorto all previous crystallographic methods to locate alkali metalions. In addition, to potentially gain an insight into both lowand high occupancy DNA binding sites for these metal ionstheir concentrations in the crystallization solutions were varied(see Materials and Methods).
SAD phasing
Data collection at the appropriate wavelengths with DNA crystalscontaining alkali or earth alkali metal ions demonstrates themerits of some of these ions for phasing (Table 1). The heavyatom search procedure in the program CNS was applied toanomalous difference Patterson maps calculated at 2.5, 2.0 and1.5 Å based on data sets for DNA crystals containing Ba2+, Cs+
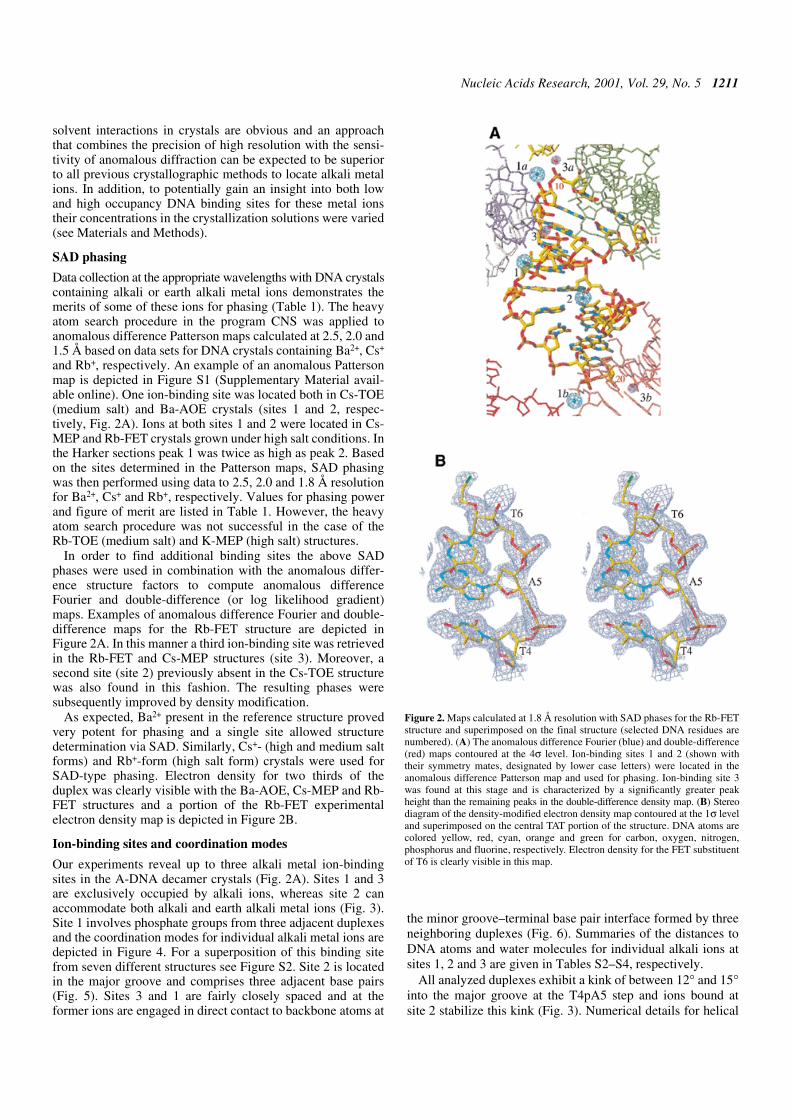
and Rb+, respectively. An example of an anomalous Pattersonmap is depicted in Figure S1 (Supplementary Material avail-able online). One ion-binding site was located both in Cs-TOE(medium salt) and Ba-AOE crystals (sites 1 and 2, respec-tively, Fig. 2A). Ions at both sites 1 and 2 were located in Cs-MEP and Rb-FET crystals grown under high salt conditions. Inthe Harker sections peak 1 was twice as high as peak 2. Basedon the sites determined in the Patterson maps, SAD phasingwas then performed using data to 2.5, 2.0 and 1.8 Å resolutionfor Ba2+, Cs+ and Rb+, respectively. Values for phasing powerand figure of merit are listed in Table 1. However, the heavyatom search procedure was not successful in the case of theRb-TOE (medium salt) and K-MEP (high salt) structures.
In order to find additional binding sites the above SADphases were used in combination with the anomalous differ-ence structure factors to compute anomalous differenceFourier and double-difference (or log likelihood gradient)maps. Examples of anomalous difference Fourier and double-difference maps for the Rb-FET structure are depicted inFigure 2A. In this manner a third ion-binding site was retrievedin the Rb-FET and Cs-MEP structures (site 3). Moreover, asecond site (site 2) previously absent in the Cs-TOE structurewas also found in this fashion. The resulting phases weresubsequently improved by density modification.
As expected, Ba2+ present in the reference structure provedvery potent for phasing and a single site allowed structuredetermination via SAD. Similarly, Cs+- (high and medium saltforms) and Rb+-form (high salt form) crystals were used forSAD-type phasing. Electron density for two thirds of theduplex was clearly visible with the Ba-AOE, Cs-MEP and Rb-FET structures and a portion of the Rb-FET experimentalelectron density map is depicted in Figure 2B.
Ion-binding sites and coordination modes
Our experiments reveal up to three alkali metal ion-bindingsites in the A-DNA decamer crystals (Fig. 2A). Sites 1 and 3are exclusively occupied by alkali ions, whereas site 2 canaccommodate both alkali and earth alkali metal ions (Fig. 3).Site 1 involves phosphate groups from three adjacent duplexesand the coordination modes for individual alkali metal ions aredepicted in Figure 4. For a superposition of this binding sitefrom seven different structures see Figure S2. Site 2 is locatedin the major groove and comprises three adjacent base pairs(Fig. 5). Sites 3 and 1 are fairly closely spaced and at theformer ions are engaged in direct contact to backbone atoms at
the minor groove–terminal base pair interface formed by threeneighboring duplexes (Fig. 6). Summaries of the distances toDNA atoms and water molecules for individual alkali ions atsites 1, 2 and 3 are given in Tables S2–S4, respectively.
All analyzed duplexes exhibit a kink of between 12° and 15°into the major groove at the T4pA5 step and ions bound atsite 2 stabilize this kink (Fig. 3). Numerical details for helical
Figure 2. Maps calculated at 1.8 Å resolution with SAD phases for the Rb-FETstructure and superimposed on the final structure (selected DNA residues arenumbered). (A) The anomalous difference Fourier (blue) and double-difference(red) maps contoured at the 4σ level. Ion-binding sites 1 and 2 (shown withtheir symmetry mates, designated by lower case letters) were located in theanomalous difference Patterson map and used for phasing. Ion-binding site 3was found at this stage and is characterized by a significantly greater peakheight than the remaining peaks in the double-difference density map. (B) Stereodiagram of the density-modified electron density map contoured at the 1σ leveland superimposed on the central TAT portion of the structure. DNA atoms arecolored yellow, red, cyan, orange and green for carbon, oxygen, nitrogen,phosphorus and fluorine, respectively. Electron density for the FET substituentof T6 is clearly visible in this map.

1212 Nucleic Acids Research, 2001, Vol. 29, No. 5
parameters of all duplexes are depicted in Figure S3. Interest-ingly, the magnitude of the kink appears to be independent of
the nature of the bound ion. The packing mode of decamers inthe orthorhombic lattice involves stacking of terminal basepairs from two duplexes into the minor groove of a third. Theobserved metal ions either stabilize lattice interactions (sites 1and 3) or the kink of duplexes (site 2), the latter likely beingcaused by the particular packing mode. Thus, each duplex is in
Figure 3. (A) Superposition of A-DNA decamer duplexes crystallized in the presence of different alkali or earth alkali metal ions. The bottom halves of duplexeswere used in the superposition (r.m.s.d. <0.5 Å). The view depicts binding site 2 in the major groove common for all ions and demonstrates similar kinks forduplexes at the T4pA5 base-pair steps. Binding site 1 involving phosphate groups is exclusively occupied by alkali metal ions and is shown along with symmetry-related sites (1a and 1b). DNA duplexes listed in Table 1 are drawn as stick models with color codes indicated. The low salt Mg-MEP (21) and Mg-TOE (22) formswere also included in the superposition and are colored red and magenta, respectively. Mg2+ and Ba2+ coordinated in the major groove are shown as spheres withlarger radius. Alkali metal ions are drawn as smaller spheres. (B) Schematic of the major groove of the A-DNA decamer with sequence GCGTATACGC. A greencircle indicates ions binding at the G3pT4 step. No ion was found at the chemically identical G13pA14 step. Asterisks indicate 2′-O-modified nucleotides.
Figure 4. Coordination geometry of alkali metal ions bound at site 1, involvingphosphate groups from three adjacent duplexes. (A) Cs-MEP, Rb-FET (highsalt), Cs-TOE and Rb-TOE (medium salt) structures. (B) K-MEP (high salt)and K-TOE (medium salt) structures. Ordered ions (green) are arranged in theplane defined by P10, P15 and P20 (A and B) and ion–DNA (green) and ion–watercontacts (red) are represented by dashed lines. (C) Na-TOE and Na-FETstructures (medium salt). (D) Mg-MEP (low salt). No ordered ions were foundin the structures depicted in (C) and (D). P…P distances are in Å and correspondto average values with standard deviations in parentheses (A and C). Watermolecules are red and open circles in (B) are waters absent in K-MEP due tolimited resolution.
Figure 5. Major groove solvation around GpTpA portions. (A) G3pT4pA5:Mg-MEP and Mg-TOE (low salt). (B) G3pT4pA5: Ba-AOE. (C) G3pT4pA5:consensus geometry of site 2 in the Cs-MEP and Rb-FET (high salt) as well asin Cs-, Rb-, K- and Na-TOE (medium salt) crystals. The water drawn with anopen circle is absent in all medium salt forms. (D) Hydration of the chemicallyequivalent G13pT14pA15 portion. Residues from strands one and two aredrawn with solid and open bonds, respectively, C1′ atoms are black and ion–DNA(green) and ion–water contacts (red) are represented by dashed lines.

Nucleic Acids Research, 2001, Vol. 29, No. 5 1213
contact with seven ions; three symmetry-related ions each atthe type 1 and 3 sites and one ion at site 2.
Occupancies of binding sites
In addition to B-factor refinements (values for individual ionsare listed in Table 1), analyses of ion–ligand distances incrystals may furnish insight into the occupancy of a particular site.For example, comparisons of alkali metal ion–ligand distances atsites 1–3 as a function of the metal ion concentration demonstratethat site 1 can contract to accommodate the smaller ions (Fig. 7).For the high salt Cs+, Rb+ and K+ crystal forms the site appearsto be fully occupied, while medium ion concentrations seem to
lower the occupancies for K+ and Rb+. On the other hand, site 2appears to be ideal for Cs+, independent of the ion concentration,while the geometric constraints of the binding site may not beideal for Rb+ and K+. Based on an analysis of ion–liganddistances, site 3 appears to be well suited for coordination byCs+ and Rb+. However, the high B factors of these ions (Table 1)plus the fact that they were not visible in Patterson mapssuggest relatively low occupancies. The reduced occupanciesat site 3 compared with site 1 are probably due to the differentnumbers of phosphates present at the two sites (three versusone at sites 1 and 3, respectively). These data are in line withthe observation that sites 1 and 3 are exclusively occupied byalkali metal ions and that site 2 is optimal for the larger alkaliand all earth alkali metal ions. Taken together, it appears thatanalyses of ion–ligand distances in DNA crystals can givequalitative information about ion occupancy.
Anomalous diffraction versus high resolution data
Do resolution-dependent Fourier electron density maps andanomalous maps provide a consistent picture concerning thelocations of alkali metal ions in the DNA crystals? Weexamined this question by comparing the putative identities ofpeaks in both types of maps (Fig. 8). Accordingly, we foundonly one case (Cs-MEP, high salt form) where the top threepeaks in the electron density map coincide with the threestrongest peaks in the anomalous map, independent of theresolution of the former. In all other cases the locations of atleast two of the peaks identified as ions based on the anoma-lous data deviate from those hinted at as ions based on electrondensity peak lists (Fig. 8). In general, the two techniquesprovide a more consistent picture with high resolution data
Figure 6. Coordination geometry of Cs+ and Rb+ at binding site 3 in the Cs-MEPand Rb-FET (high salt) structures. Residues from three adjacent duplexes at theminor groove–terminal base pair interface are drawn with solid, gray and openbonds and are numbered. Ion–DNA and ion–water contacts are drawn withgreen and red dashed lines, respectively. An ion bound at site 1 and the watermolecule (W) corresponding to the peak indicated by red arrows and lines inFigures 7 and 8, respectively, are included. In the Rb-, K- and Na-TOE(medium salt) structures, the peak at site 3 was found to be shifted from its posi-tion in the Cs-MEP and Rb-FET structures (see Table S4)..
Figure 7. Average distances between alkali metal ions and oxygen atoms(DNA or water) plotted as a function of ion type for high and medium saltconcentrations. The black solid line indicates ideal coordination distances forindividual alkali metal ions. Open circles indicate coordination spheres thatlack water molecules compared with fully occupied sites (high salt Cs-MEPand Rb-FET; see Tables S2–S4).
Figure 8. Dependence of ‘solvent’ peak height in electron density maps ofselected DNA decamers as a function of X-ray data resolution, nature of alkalimetal ion and ion concentration. Blue, cyan and green arrows represent ionscoordinated at sites 1, 2 and 3, respectively, and red arrows represent hydrationsite W (Fig. 6).

1214 Nucleic Acids Research, 2001, Vol. 29, No. 5
based on crystals grown from solutions containing relativelyhigh concentrations of alkali metal ion salts (Rb-FET and Cs-TOE,Fig. 8).
A particular peak in the electron density maps that is amongthe four highest in all structures (Fig. 8, red arrows) is absent inanomalous maps. Without the availability of anomalous dataone may have been tempted to interpret the peak as an ion,particularly when taking into account the fact that its primarycoordination sphere involves only oxygen atoms (Fig. 6, siteW, and Table S5). The interpretation that this conserved peakis indeed a water molecule and not an ion is borne out by itsdistance geometry, which is independent of the nature andconcentration of the ion in the individual crystals (Fig. 7).Thus, anomalous and high resolution data provide a basis forreliable identification of K+, Rb+ and Cs+ ions around DNA.Sites that bind these three types of ions are likely to also harborNa+, albeit with different occupancies and coordinationgeometries (Figs 4–6). Conversely, high resolution electrondensity maps alone are not sufficient to unambiguously differ-entiate between water and partially ordered ions.
Provided data to ultra-high resolution were available, couldone differentiate between light alkali metal ions and watermolecules based on the presence of difference electron densityfor hydrogen atoms around the latter? To answer this questionand examine if hydrogen atoms of water molecules can indeedbe visualized in DNA crystals at ultra-high resolution, werefined the structure of a Z-DNA hexamer duplex to 0.6 Å(Table 1). However, the vast majority of ‘solvent’ peaks(refined as oxygen atoms) did not exhibit the expected lobes ofdifference electron density expected for hydrogen atoms ofwater (data not shown). Therefore, electron density maps evenat this level do not provide insight into the exact nature of apeak, apart from the fact that most crystals will not yielddiffraction data to such a resolution. Conversely, the use ofboth anomalous diffraction and atomic resolution data fornucleic acid crystals grown from solutions of different ionicstrengths allows a refined understanding of alkali metal ioncoordination to DNA and should benefit nucleic acid crystallo-graphy in general.
SUPPPLEMENTARY MATERIAL
Supplementary Material is available at NAR Online.
ACKNOWLEDGEMENTS
We would like to thank Mr Guillermo Vasquez, Mr MartinCasper and Dr Haoyun An (Isis Pharmaceuticals Inc.,Carlsbad, CA) for providing the 2′-O-modified AOE, FET andMEP decamers, Dr M.Teplova for help with the crystalliza-tions and Dr Lucy V.Malinina for discussions. This work wassupported by NIH grant GM-55237 (M.E.) and C.J.W.acknowledges fellowship support by the Natural Sciences andEngineering Research Council of Canada. The DuPont-North-western-Dow Collaborative Access Team SynchrotronResearch Center at the Advanced Photon Source (Sector 5) issupported by E. I. DuPont de Nemours & Co., The Dow Chem-ical Company, the National Science Foundation and the Stateof Illinois.
REFERENCES
1. Quigley,G.J., Teeter,M.M. and Rich,A. (1978) Structural analysis ofspermine and magnesium ion binding to yeast phenylalanine transferRNA. Proc. Natl Acad. Sci. USA, 75, 64–68.
2. Scott,W.G., Finch,J.T. and Klug,A. (1995) The crystal structure of anall-RNA hammerhead ribozyme: a proposed mechanism for RNAcatalytic cleavage. Cell, 81, 991–1002.
3. Cate,J.H. and Doudna,J.A. (1996) Metal-binding sites in the major grooveof a large ribozyme domain. Structure, 4, 1221–1229.
4. Cate,J.H., Hanna,R.L. and Doudna,J.A. (1997) A magnesium core at theheart of a ribozyme domain. Nature Struct. Biol., 4, 553–558.
5. Correll,C.C., Freeborn,B., Moore,P.B. and Steitz,T.A. (1997) Metals,motifs, and recognition in the crystal structure of a 5S rRNA domain. Cell,91, 705–712.
6. Ippolito,J.A. and Steitz,T.A. (1998) A 1.3-Å resolution crystal structure ofthe HIV-1 trans-activation response region RNA stem reveals a metal-iondependent bulge conformation. Proc. Natl Acad. Sci. USA, 95, 9819–9824.
7. Gessner,R.V., Frederick,C.A., Quigley,G.J., Rich,A. and Wang,A.H.-J.(1989) The molecular structure of Z-DNA at high resolution. J. Biol. Chem.,264, 7921–7935.
8. Tereshko,V., Minasov,G. and Egli,M. (1999) The Dickerson-DrewB-DNA dodecamer revisited at atomic resolution. J. Am. Chem. Soc., 121,470–471.
9. Minasov,G., Tereshko,V. and Egli,M. (1999) Atomic-resolution crystalstructures of B-DNA reveal specific influences of divalent metal ions onconformation and packing. J. Mol. Biol., 291, 83–99.
10. Soler-Lopez,M., Malinina,L., Liu,J., Hyunh-Dinh,T. and Subirana,J.A.(1999) Water and ions in a high resolution structure of B-DNA. J. Biol.Chem., 274, 23683–23686.
11. Kielkopf,C.L., Ding,S., Kuhn,P. and Rees,D.C. (2000) Conformationalflexibility of B-DNA at 0.74 Å resolution: d(CCAGTACTGG)2. J. Mol.Biol., 296, 787–801.
12. Chiu,T.K. and Dickerson,R.E. (2000) 1 Å crystal structures of B-DNAreveal sequence-specific binding and groove-specific bending of DNA bymagnesium and calcium. J. Mol. Biol., 301, 915–945.
13. Berman,H.M., Olson,W.K., Beveridge,D.L., Westbrook,J., Gelbin,A.,Demeny,T., Hsieh,S.-H., Srinivasan,A.R. and Schneider B. (1992) Thenucleic acid database: a comprehensive relational database of three-dimensional structures of nucleic acids. Biophys. J., 63, 751–759.
14. Phillips,K., Dauter,Z., Murchie,A.I.H., Lilley,D.M.J. and Luisi,B. (1997)The crystal structure of a parallel-stranded guanine tetraplex at 0.95Ångstrom resolution. J. Mol. Biol., 273, 171–182.
15. Tereshko,V., Minasov,G. and Egli,M. (1999) A “hydrat-ion” spine in aB-DNA minor groove. J. Am. Chem. Soc., 121, 3590–3595.
16. Bleam,M.L., Anderson,C.F. and Record,M.T.,Jr (1980) Relative bindingaffinities of monovalent cations for double-stranded DNA. Proc. NatlAcad. Sci. USA, 77, 3085–3089.
17. Basu,S., Rambo,R.P., Strauss-Soukup,J., Cate,J.H., Ferré-D’Amaré,A.R.,Strobel,S.A. and Doudna,J.A. (1998) A specific monovalent metal ionintegral to the AA platform of the RNA tetraloop receptor. Nature Struct.Biol., 5, 986–992.
18. Brünger,A.T. (1992) Free R value: a novel statistical quantity forassessing the accuracy of crystal structures. Nature, 355, 472–475.
19. Chen,L.Q., Rose,J.P., Breslow,E., Yang,D., Chang,W.R., Furey,W.F.,Sax,M. and Wang,B.C. (1991) Crystal structure of a bovine neurophysin-IIdipeptide complex at 2.8 Å determined from the single-wavelengthanomalous scattering signal of an incorporated iodine atom. Proc. NatlAcad. Sci. USA, 88, 4240–4244.
20. Dauter,Z., Dauter,M., de La Fortelle,E., Bricogne,G. and Sheldrick,G.M.(1999) Can anomalous signal of sulfur become a tool for solving proteincrystal structures? J. Mol. Biol., 289, 83–92.
21. Egli,M., Usman,N. and Rich,A. (1993) Conformational influence of theribose 2′-hydroxyl group: crystal structures of DNA-RNA chimericduplexes. Biochemistry, 32, 3221–3237.
22. Egli,M., Tereshko,V., Teplova,M., Minasov,G., Joachimiak,A.,Sanishvili,R., Weeks,C.M., Miller,R., Maier,M.A., An,H., Cook,P.D. andManoharan,M. (2000) X-ray crystallographic analysis of the hydration ofA- and B-form DNA at atomic resolution. Biopolymers, 48, 234–252.
23. Tereshko,V., Portmann,S., Tay,E., Martin,P., Natt,F., Altmann,K.-H. andEgli,M. (1998) Structure and stability of DNA duplexes with incorporated2′-O-modified RNA analogues. Biochemistry, 37, 10626–10634.
24. Teplova,M., Minasov,G., Tereshko,V., Inamati,G.B., Cook,P.D.,Manoharan,M. and Egli,M. (1999) Crystal structure and improved

Nucleic Acids Research, 2001, Vol. 29, No. 5 1215
antisense properties of 2′-O-(2-methoxyethyl)-RNA. Nature Struct. Biol.,6, 535–539.
25. Teplova,M., Wallace,S.T., Minasov,G., Tereshko,V., Symons,A.,Cook,P.D., Manoharan,M. and Egli,M. (1999) Structural origins of theexonuclease resistance of a zwitterionic RNA. Proc. Natl Acad. Sci. USA,96, 14240–14245.
26. Malinina,L.V., Makhaldiani,V.V., Tereshko,V.A., Zarytova,V.F. andIvanova,E.M. (1987) Phase diagrams for DNA crystallization systems.J. Biolmol. Struct. Dyn., 5, 405–433.
27. Fernandez,L.G., Subirana,J.A., Verdaguer,N., Pyshnyi,D., Campos,L. andMalinina,L.V. (1997) Structural variability of A-DNA in crystals of theoctamer d(pCpCpCpGpCpGpGpG). J. Biomol. Struct. Dyn., 15, 233–245.
28. Otwinowski,Z. and Minor,W. (1997) Processing of X-ray diffraction datacollected in oscillation mode. Methods Enzymol., 276, 307–326.
29. Brünger,A.T. (1998) Crystallography & NMR System (CNS), Version 0.5.Yale University, New Haven, CT.
30. Cambillau,C. and Roussel,A. (1997) Turbo Frodo, Version OpenGL.1.Université Aix-Marseille II, Marseille, France.
31. Sheldrick,G.M. and Schneider,T.R. (1997) SHELXL: High-resolutionrefinement. Methods Enzymol., 276, 319–343.