Embed Size (px)
Citation preview
0010-9525/04/4203- © 2004
MAIK “Nauka
/Interperiodica”0203
Cosmic Research, Vol. 42, No. 3, 2004, pp. 203–209. Translated from Kosmicheskie Issledovaniya, Vol. 42, No. 3, 2004, pp. 211–218.Original Russian Text Copyright © 2004 by Kuznetsov, Nymmik, Panasyuk, Sosnovets, Teltsov.
INTRODUCTION
Permanent monitoring of the radiation environmentinside the manned orbital stations (OS) is a necessarycondition of ensuring the radiation safety of the crew. Inparticular, this is of great importance during the occur-rence of powerful solar proton events (SPE), whendaily radiation doses can exceed the background values(the doses produced onboard the station by the fluxes ofparticles of the Earth’s radiation belts (ERB) and galac-tic cosmic rays (GCR) behind the aluminum shield witha thickness of a few g/cm
2
) by several orders of magni-tude [1]. Such a sharp increase of the radiation hazardfor the crew requires special protective steps, likerestricted access of astronauts to different station’scompartments and changed modes of operation ofsome onboard systems. These steps should be taken inadvance or at least at the initial stage (
~<
1 h) of evolu-tion of a powerful flux of SPE particles.
The problem of urgent information of the OS crewabout this radiation danger is a complicated problembecause of a random character of occurrence of solarproton fluxes in the Earth’s vicinity and the absence ofreliable precursors of this phenomenon.
Onboard the International Space Station (ISS) thisproblem is solved using the radiation monitoring sys-tem (RMS) [2], whose function is not only to measurethe radiation doze inside the stations modules. In cer-tain cases it allows one, using a specially developedprogram, to relate RMS data to the occurrence of anSPE proton flux. However, in this case one has theinformation that requires protective steps to be taken inan emergency regime, since the system reacts to anenhanced proton flux of already developing SPE. There
†
Deceased.
is a high probability that the initial stage of SPF evolu-tion will escape notice, since at many “protected” orbitsof the ISS the SPE flux is strongly suppressed due toscreening by the Earth’s magnetic field. In the last casethe data about the SPE appearance during passages inthe “protected” orbits would allow astronauts to havemore time in order to take some safeguarding steps.
From this point of view the use of certain satellitesdetecting the initial stage of an SPF evolution in theinterplanetary space or in the geosynchronous orbit,without distortion of the solar proton flux in the mag-netosphere, could be the most promising method offorecasting SPE on the OS. Such proton fluxes arerecorded by the
GOES
or
IMP-8
American satellites.However, at present the decision-making about the dan-ger of SPE on the basis of these data cannot be suffi-ciently prompt, since the data on proton fluxes appearon the Internet
1
with a considerable time delay. More-over, in order to solve the problem of signaling aboutthe danger and power of an event, a special softwarepackage is required providing for fast processing of thenecessary data in real-time (taking additionally intoaccount ballistic data and the data about geomagneticconditions).
In this paper we suggest a simpler solution to theproblem of prompt forecasting of an SPE appearance:the use real-time data of a dosimeter operation onboarda geosynchronous satellite (GSS). In order to demon-strate the feasibility and prospects of solving the prob-lem in this way, we made an analysis of proton fluxesrecorded for several strong SPEs onboard the
GOES-8
American satellite and compared them with the data ofdosimeters obtained at the same time onboard the
Ekspress A3
Russian geosynchronous satellite and
1
Website http://SPIDR.ngdc.noaa.gov.
Detection and Prediction of Absorbed Radiation Doses from Solar Proton Fluxes onboard Orbital Stations
N. V. Kuznetsov, R. A. Nymmik, M. I. Panasyuk, E. N. Sosnovets
†
, and M. V. Teltsov
Skobeltsyn Institute of Nuclear Physics, Moscow State University, Vorob’evy gory, Moscow, 119899 Russia
Received November 19, 2002
Abstract
—We consider cases of simultaneous detection of the absorbed doses produced by proton fluxes ofpowerful solar events onboard the
Mir
and
ISS
orbital stations and the
Ekspress A3
geosynchronous satellite.Experimental data are analyzed using a software package that takes into account the energy spectra of protonsat the Earth’s orbit depending on the time of event evolution, as well as their penetration to near-earth orbits andthrough the protective shields of spacecraft. Based on a comparison of the experimental data of dosimeters withthe calculation of absorbed doses under the action of solar proton events, we developed a method of estimatingthe effective thickness of the shielding of dosimeters and made some estimates. A possibility is considered forpredicting the radiation hazard onboard orbital stations upon the appearance of solar proton events using dosim-eter data from a geosynchronous orbit.
204
COSMIC RESEARCH
Vol. 42
No. 3
2004
KUZNETSOV
et al
.
onboard the
Mir
orbital station (OS). This analysis hasbeen made using computer codes of simulation of pro-ton fluxes in the interplanetary space, their propagationinto satellite orbits, and penetration through the matterof constructions and instrumentation of spacecraft.
DOSIMETERS AND FLIGHT DATA
For a prompt monitoring of radiation environmentthe dosimetric instrument R-16 was installed onboardthe
Mir
orbital station. It consists of two dosimeters(nos. 1 and 2) representing the integral ionizationchambers with electrostatic relays, which have almostisotropic sensitivity and high accuracy of measure-ments (
~
5%) [3]. The proper shield of dosimeter no. 2is plexiglass with a thickness of
~0.5
g/cm
2
, whiledosimeter no. 1 has an additional tissue-equivalent
screen for measuring the depth dose, and its total shieldis
~
3 g/cm
2
. The R-16 instrument is adjusted to detectmean daily doses, and one pulse of ionization chamberscorresponds to 5 mrad. At the moment a similar instru-ment is installed on board the ISS.
During the flight of the
Mir
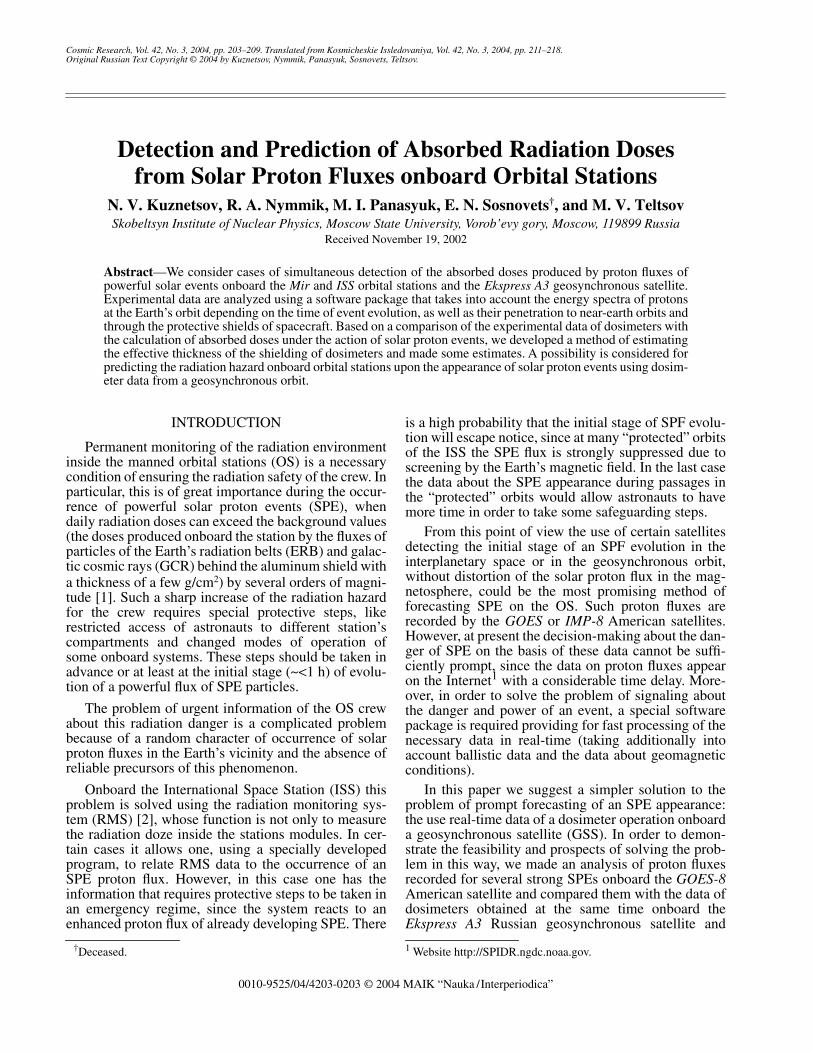
OS, i.e., for almost15 years, the R-16 instrument has reliably detectedonly 15 SPEs, so that within the instrument’s accuracythe remaining SPEs were not discerned on the back-ground of mean daily doses accumulated from the ERBand GCR particles. As an example, Fig. 1 presents therecords D2 and D1 of the dosimeters nos. 2 and 1,respectively, obtained onboard the
Mir
OS during theyear 2000. One can see in this figure that there are two“bursts” against the background of mean daily doses(5–15 mrad). They are produced by two strong SPEs inJuly (700/500 mrad) and November (285/50 mrad).
Mir
D2
1
10
10
2
10
3
May 24 June 3 June 13 June 23 July 3 July 13 July 23 Aug. 2 Aug. 12, 2000
Date
Dose, mrad per day
1
10
10
3
Oct. 1 Oct. 11 Oct. 21 Oct. 31 Nov. 10 Nov. 20 Nov. 30 Dec. 10 Dec. 20 Dec. 30, 2000
Date
D1
10
2
Fig. 1.
The data of dosimeters of the R-16 instrument onboard the
Mir
orbital station during the year of 2000.
COSMIC RESEARCH
Vol. 42
No. 3
2004
DETECTION AND PREDICTION OF ABSORBED RADIATION DOSES 205
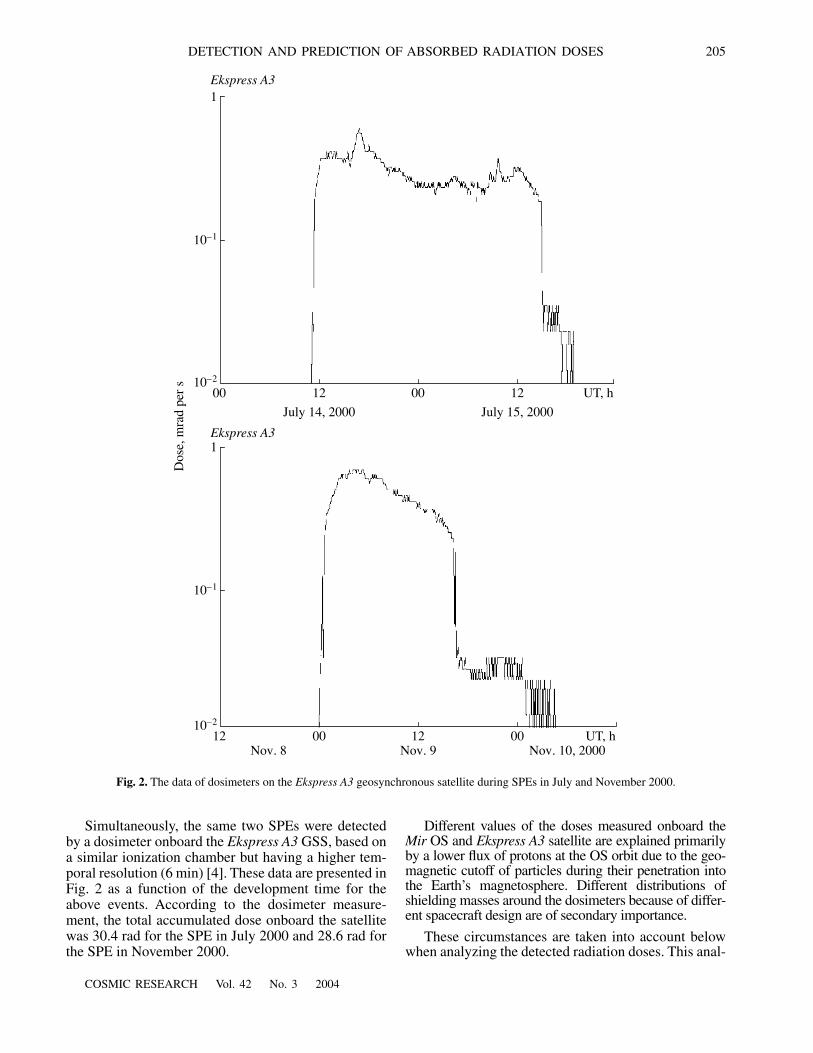
Simultaneously, the same two SPEs were detectedby a dosimeter onboard the
Ekspress A3
GSS, based ona similar ionization chamber but having a higher tem-poral resolution (6 min) [4]. These data are presented inFig. 2 as a function of the development time for theabove events. According to the dosimeter measure-ment, the total accumulated dose onboard the satellitewas 30.4 rad for the SPE in July 2000 and 28.6 rad forthe SPE in November 2000.
Different values of the doses measured onboard the
Mir
OS and
Ekspress A3
satellite are explained primarilyby a lower flux of protons at the OS orbit due to the geo-magnetic cutoff of particles during their penetration intothe Earth’s magnetosphere. Different distributions ofshielding masses around the dosimeters because of differ-ent spacecraft design are of secondary importance.
These circumstances are taken into account belowwhen analyzing the detected radiation doses. This anal-
10
–1
0012 12 00
UT, h
10
–2
1
Ekspress A3
10
–1
1200 00 12
UT, h
10
–2
1
Ekspress A3
July 14,
2000
July 15,
2000
Dos
e, m
rad
per
s
Nov. 8 Nov. 9 Nov. 10, 2000
Fig. 2.
The data of dosimeters on the
Ekspress A3
geosynchronous satellite during SPEs in July and November 2000.
206
COSMIC RESEARCH
Vol. 42
No. 3
2004
KUZNETSOV
et al
.
ysis has been made using the data on the SPE protonfluxes measured onboard the
GOES-8
satellite (seefootnote 1 above).
ANALYSIS OF FLIGHT DATA
The software package used for analyzing theabsorbed dose of radiation observed by dosimetersunder the action of the SPE particles included the fol-lowing programs:
—program of processing the
GOES-8
data and con-verting them into differential energy spectra
F
0
(
E
,
t
)
ofprotons at instants
t
reckoned from the beginning of theSPE appearance at the Earth’s orbit;
—program of converting the energy spectra
F
0
(
E
,
t)
to the energy spectra
F
éS
(
E
,
t
)
of proton fluxes at theOS orbit with allowance made for the regularities ofpenetration of solar protons into the Earth’s magneto-sphere and the OS position in its orbit during the SPFevolution;
—program of converting the spectra
F
0
(
E
,
t
)
and
F
éS
(
E
,
t
)
into the proton spectra
(
E
,
t
)
and
(
E
,
t
)
after the protective shield (Al) and calculating theabsorbed dose rate
P
(
t
)
or the absorbed dose
D
(
t
) =
(
t
)
dt
.
F0sh( ) FOS
sh( )
P∫
The program of processing the
GOES-8
data andconverting them into the energy spectra
F
0
(
E
,
t
)
of pro-ton flux at any time
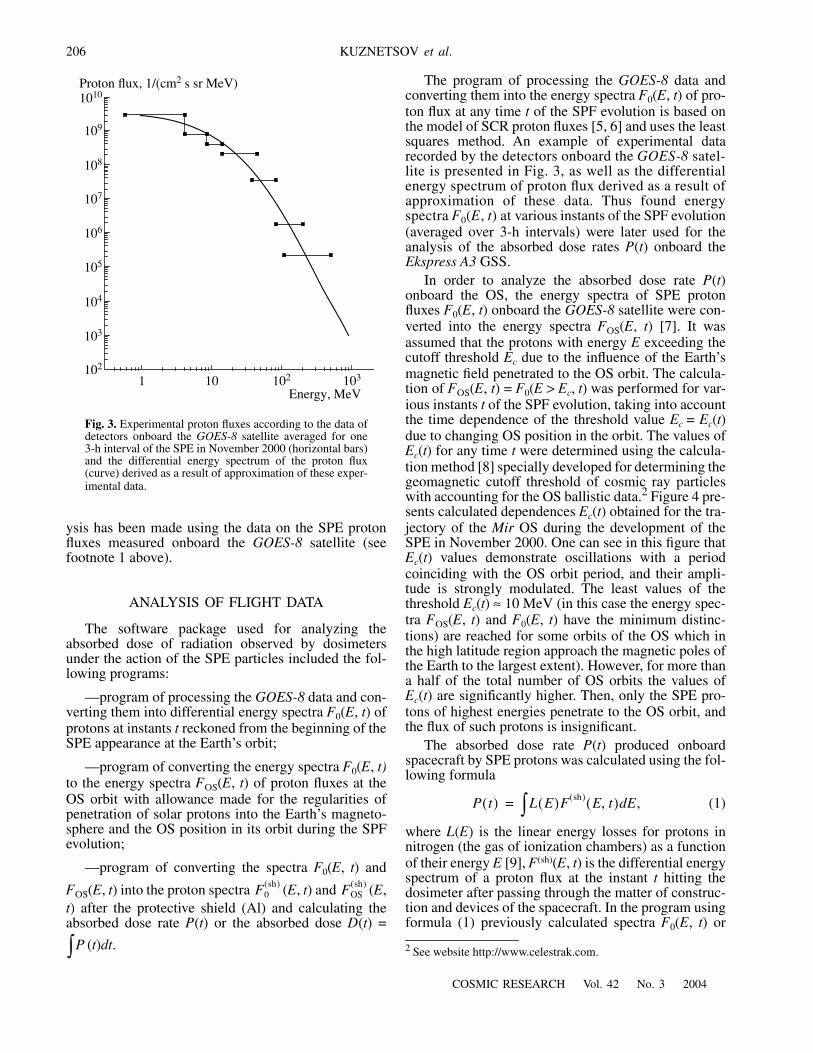
t of the SPF evolution is based onthe model of SCR proton fluxes [5, 6] and uses the leastsquares method. An example of experimental datarecorded by the detectors onboard the GOES-8 satel-lite is presented in Fig. 3, as well as the differentialenergy spectrum of proton flux derived as a result ofapproximation of these data. Thus found energyspectra F0(E, t) at various instants of the SPF evolution(averaged over 3-h intervals) were later used for theanalysis of the absorbed dose rates P(t) onboard theEkspress A3 GSS.
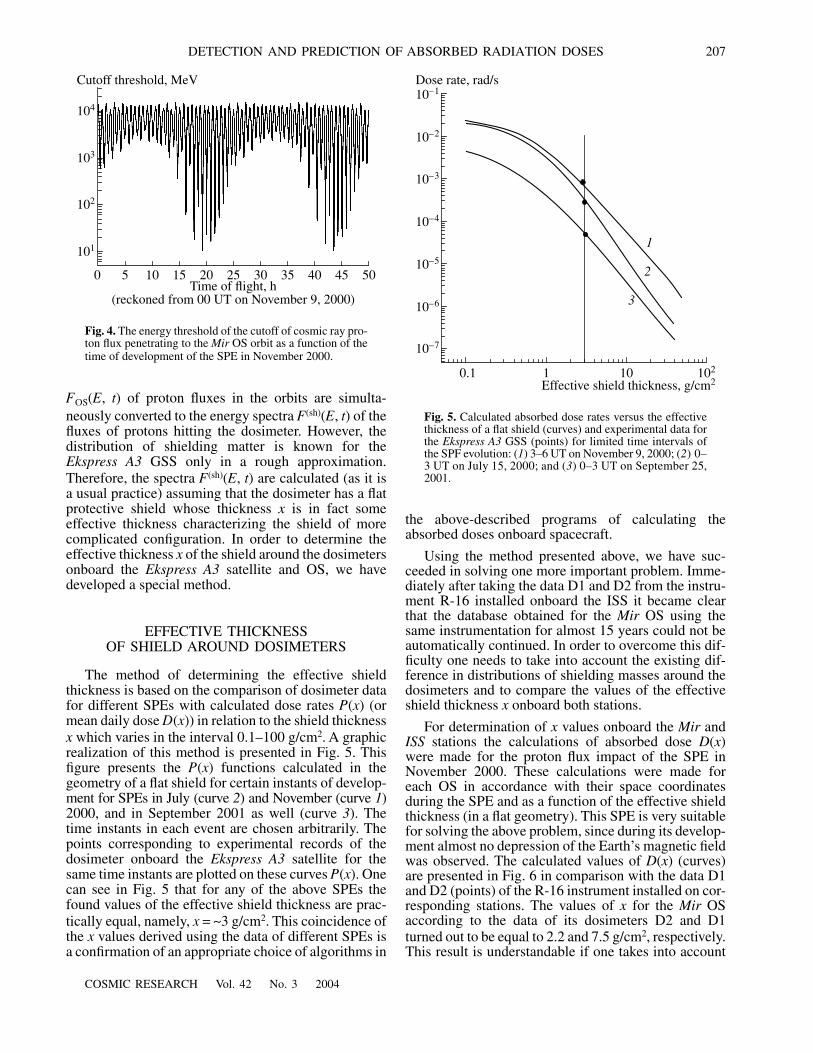
In order to analyze the absorbed dose rate P(t)onboard the OS, the energy spectra of SPE protonfluxes F0(E, t) onboard the GOES-8 satellite were con-verted into the energy spectra FéS(E, t) [7]. It wasassumed that the protons with energy E exceeding thecutoff threshold Ec due to the influence of the Earth’smagnetic field penetrated to the OS orbit. The calcula-tion of FéS(E, t) = F0(E > Ec, t) was performed for var-ious instants t of the SPF evolution, taking into accountthe time dependence of the threshold value Ec = Ec(t)due to changing OS position in the orbit. The values ofEc(t) for any time t were determined using the calcula-tion method [8] specially developed for determining thegeomagnetic cutoff threshold of cosmic ray particleswith accounting for the OS ballistic data.2 Figure 4 pre-sents calculated dependences Ec(t) obtained for the tra-jectory of the Mir OS during the development of theSPE in November 2000. One can see in this figure thatEc(t) values demonstrate oscillations with a periodcoinciding with the OS orbit period, and their ampli-tude is strongly modulated. The least values of thethreshold Ec(t) ≈ 10 MeV (in this case the energy spec-tra FéS(E, t) and F0(E, t) have the minimum distinc-tions) are reached for some orbits of the OS which inthe high latitude region approach the magnetic poles ofthe Earth to the largest extent). However, for more thana half of the total number of OS orbits the values ofEc(t) are significantly higher. Then, only the SPE pro-tons of highest energies penetrate to the OS orbit, andthe flux of such protons is insignificant.
The absorbed dose rate P(t) produced onboardspacecraft by SPE protons was calculated using the fol-lowing formula
(1)
where L(E) is the linear energy losses for protons innitrogen (the gas of ionization chambers) as a functionof their energy E [9], F(sh)(E, t) is the differential energyspectrum of a proton flux at the instant t hitting thedosimeter after passing through the matter of construc-tion and devices of the spacecraft. In the program usingformula (1) previously calculated spectra F0(E, t) or
2 See website http://www.celestrak.com.
P t( ) L E( )F sh( ) E t,( ) E,d∫=
1 10 102 103102
103
104
105
106
107
108
109
1010
Energy, MeV
Proton flux, 1/(cm2 s sr MeV)
Fig. 3. Experimental proton fluxes according to the data ofdetectors onboard the GOES-8 satellite averaged for one3-h interval of the SPE in November 2000 (horizontal bars)and the differential energy spectrum of the proton flux(curve) derived as a result of approximation of these exper-imental data.
COSMIC RESEARCH Vol. 42 No. 3 2004
DETECTION AND PREDICTION OF ABSORBED RADIATION DOSES 207
FéS(E, t) of proton fluxes in the orbits are simulta-neously converted to the energy spectra F(sh)(E, t) of thefluxes of protons hitting the dosimeter. However, thedistribution of shielding matter is known for theEkspress A3 GSS only in a rough approximation.Therefore, the spectra F(sh)(E, t) are calculated (as it isa usual practice) assuming that the dosimeter has a flatprotective shield whose thickness x is in fact someeffective thickness characterizing the shield of morecomplicated configuration. In order to determine theeffective thickness x of the shield around the dosimetersonboard the Ekspress A3 satellite and OS, we havedeveloped a special method.
EFFECTIVE THICKNESS OF SHIELD AROUND DOSIMETERS
The method of determining the effective shieldthickness is based on the comparison of dosimeter datafor different SPEs with calculated dose rates P(x) (ormean daily dose D(x)) in relation to the shield thicknessx which varies in the interval 0.1–100 g/cm2. A graphicrealization of this method is presented in Fig. 5. Thisfigure presents the P(x) functions calculated in thegeometry of a flat shield for certain instants of develop-ment for SPEs in July (curve 2) and November (curve 1)2000, and in September 2001 as well (curve 3). Thetime instants in each event are chosen arbitrarily. Thepoints corresponding to experimental records of thedosimeter onboard the Ekspress A3 satellite for thesame time instants are plotted on these curves P(x). Onecan see in Fig. 5 that for any of the above SPEs thefound values of the effective shield thickness are prac-tically equal, namely, x = ~3 g/cm2. This coincidence ofthe x values derived using the data of different SPEs isa confirmation of an appropriate choice of algorithms in
the above-described programs of calculating theabsorbed doses onboard spacecraft.
Using the method presented above, we have suc-ceeded in solving one more important problem. Imme-diately after taking the data D1 and D2 from the instru-ment R-16 installed onboard the ISS it became clearthat the database obtained for the Mir OS using thesame instrumentation for almost 15 years could not beautomatically continued. In order to overcome this dif-ficulty one needs to take into account the existing dif-ference in distributions of shielding masses around thedosimeters and to compare the values of the effectiveshield thickness x onboard both stations.
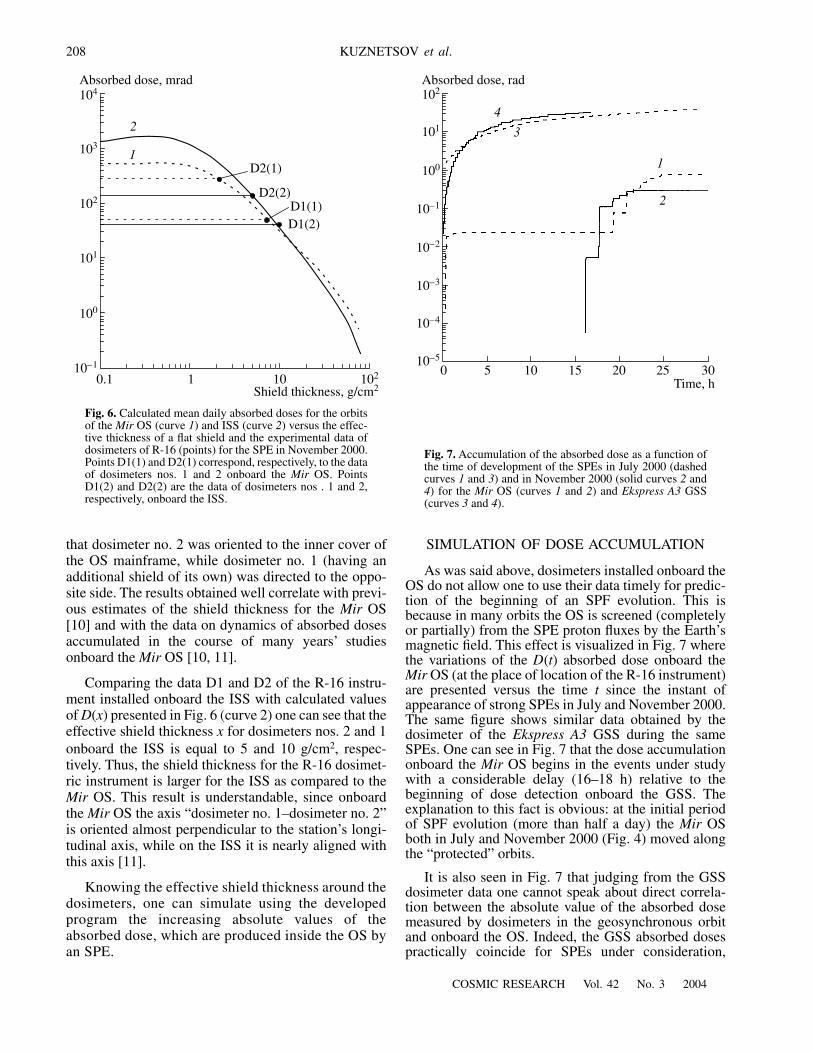
For determination of x values onboard the Mir andISS stations the calculations of absorbed dose D(x)were made for the proton flux impact of the SPE inNovember 2000. These calculations were made foreach OS in accordance with their space coordinatesduring the SPE and as a function of the effective shieldthickness (in a flat geometry). This SPE is very suitablefor solving the above problem, since during its develop-ment almost no depression of the Earth’s magnetic fieldwas observed. The calculated values of D(x) (curves)are presented in Fig. 6 in comparison with the data D1and D2 (points) of the R-16 instrument installed on cor-responding stations. The values of x for the Mir OSaccording to the data of its dosimeters D2 and D1turned out to be equal to 2.2 and 7.5 g/cm2, respectively.This result is understandable if one takes into account
102
50 10 15 20 25 30 35 40 45 50Time of flight, h
(reckoned from 00 UT on November 9, 2000)
103
104
101
Cutoff threshold, MeV
Fig. 4. The energy threshold of the cutoff of cosmic ray pro-ton flux penetrating to the Mir OS orbit as a function of thetime of development of the SPE in November 2000.
1
2
3
1 10 1020.1
10–7
10–6
10–5
10–4
10–3
10–2
10–1
Effective shield thickness, g/cm2
Dose rate, rad/s
Fig. 5. Calculated absorbed dose rates versus the effectivethickness of a flat shield (curves) and experimental data forthe Ekspress A3 GSS (points) for limited time intervals ofthe SPF evolution: (1) 3–6 UT on November 9, 2000; (2) 0–3 UT on July 15, 2000; and (3) 0–3 UT on September 25,2001.
208
COSMIC RESEARCH Vol. 42 No. 3 2004
KUZNETSOV et al.
that dosimeter no. 2 was oriented to the inner cover ofthe OS mainframe, while dosimeter no. 1 (having anadditional shield of its own) was directed to the oppo-site side. The results obtained well correlate with previ-ous estimates of the shield thickness for the Mir OS[10] and with the data on dynamics of absorbed dosesaccumulated in the course of many years’ studiesonboard the Mir OS [10, 11].
Comparing the data D1 and D2 of the R-16 instru-ment installed onboard the ISS with calculated valuesof D(x) presented in Fig. 6 (curve 2) one can see that theeffective shield thickness x for dosimeters nos. 2 and 1onboard the ISS is equal to 5 and 10 g/cm2, respec-tively. Thus, the shield thickness for the R-16 dosimet-ric instrument is larger for the ISS as compared to theMir OS. This result is understandable, since onboardthe Mir OS the axis “dosimeter no. 1–dosimeter no. 2”is oriented almost perpendicular to the station’s longi-tudinal axis, while on the ISS it is nearly aligned withthis axis [11].
Knowing the effective shield thickness around thedosimeters, one can simulate using the developedprogram the increasing absolute values of theabsorbed dose, which are produced inside the OS byan SPE.
SIMULATION OF DOSE ACCUMULATION
As was said above, dosimeters installed onboard theOS do not allow one to use their data timely for predic-tion of the beginning of an SPF evolution. This isbecause in many orbits the OS is screened (completelyor partially) from the SPE proton fluxes by the Earth’smagnetic field. This effect is visualized in Fig. 7 wherethe variations of the D(t) absorbed dose onboard theMir OS (at the place of location of the R-16 instrument)are presented versus the time t since the instant ofappearance of strong SPEs in July and November 2000.The same figure shows similar data obtained by thedosimeter of the Ekspress A3 GSS during the sameSPEs. One can see in Fig. 7 that the dose accumulationonboard the Mir OS begins in the events under studywith a considerable delay (16–18 h) relative to thebeginning of dose detection onboard the GSS. Theexplanation to this fact is obvious: at the initial periodof SPF evolution (more than half a day) the Mir OSboth in July and November 2000 (Fig. 4) moved alongthe “protected” orbits.
It is also seen in Fig. 7 that judging from the GSSdosimeter data one cannot speak about direct correla-tion between the absolute value of the absorbed dosemeasured by dosimeters in the geosynchronous orbitand onboard the OS. Indeed, the GSS absorbed dosespractically coincide for SPEs under consideration,
2
1D2(1)
D2(2)D1(1)D1(2)
1 10 1020.1Shield thickness, g/cm2
10–1
100
101
102
103
104Absorbed dose, mrad
Fig. 6. Calculated mean daily absorbed doses for the orbitsof the Mir OS (curve 1) and ISS (curve 2) versus the effec-tive thickness of a flat shield and the experimental data ofdosimeters of R-16 (points) for the SPE in November 2000.Points D1(1) and D2(1) correspond, respectively, to the dataof dosimeters nos. 1 and 2 onboard the Mir OS. PointsD1(2) and D2(2) are the data of dosimeters nos . 1 and 2,respectively, onboard the ISS.
1
2
3
4
10–5
10–4
10–3
10–2
10–1
100
101
102
Time, h0 5 10 15 20 25 30
Absorbed dose, rad
Fig. 7. Accumulation of the absorbed dose as a function ofthe time of development of the SPEs in July 2000 (dashedcurves 1 and 3) and in November 2000 (solid curves 2 and4) for the Mir OS (curves 1 and 2) and Ekspress A3 GSS(curves 3 and 4).
COSMIC RESEARCH Vol. 42 No. 3 2004
DETECTION AND PREDICTION OF ABSORBED RADIATION DOSES 209
while the dose recorded onboard the Mir OS in July 2000(700 mrad) was several times higher than in November2000 (285 mrad). It seems that only rough estimatescan be made here without taking into account thedepression of the Earth’s magnetic field during the SPFevolution, which leads to changing conditions of pene-tration of protons to the OS orbit and can change theabsorbed dose value by an order of magnitude and morein comparison with the “quiet” magnetosphere condi-tions.
CONCLUSIONThe results presented in this work show that GSS
dosimeter detecting the SPE occurrence from the initialinstant of its appearance can serve as a sensor predict-ing a possible increase of the absorbed dose onboardthe OS. The time interval between the signal of this sen-sor and the onset of the absorbed dose increase onboardthe OS can be calculated if the ballistic data of the OSare known.
When comparing the absolute values of theabsorbed dose detected onboard different spacecraftone needs to take into account the effective thickness ofthe shield around dosimeters. We have demonstrated inthis paper that in order to determine this thickness onecan use the dosimeter data during the SPF evolution,comparing them with the calculated data. However, forstudying the possibility of predictions of the absorbeddose absolute value expected onboard the OS duringSPE with the use of GSS dosimeters one needs addi-tional investigations based on the statistical analysis ofexperimental data accounting for the depression of theEarth’s magnetic field during SPF evolution.
ACKNOWLEDGMENTSWe thank V.V. Tsetlin for his assistance. The work is
done with a partial support of the INTAS.
REFERENCES1. Tverskaya, L.V., Tel’tsov, M.V., and Shumshurov, V.I.,
Measurements of the Radiation Dose onboard the Mir
Station during Solar Proton Events in September–Octo-ber 1989, Geomagn. Aeron., 1991, vol. 31, no. 5,pp. 928–930.
2. Panasyuk, M.I., Akulin, A.A., Benghin, V.V., et al., Cur-rent Status of Radiation Monitoring System for ISS/RSand Preliminary Results of Its Component Testingonboard Mir station, Abstracts of Space Radiation Envi-ronment Workshop & Workshop on Radiation Monitor-ing for the International Space Station (1–5 November1999, Farnborough, UK). Book of Abstracts, DERA,1999, p. 12.
3. Yuryatin, E.I., Shumshurov, V.I., Fominykh, V.A., andTel’tsov, M.V., Investigation of Dosimetric Characteris-tics of Ionization Chambers with Electrostatic Relay,Izm. Tekh., 1979, no. 3, pp. 48–53.
4. Ivanova, T.A., Pavlov, N.N., Reizman, S.Ja., et al., Mon-itoring of Radiation Conditions at Geostationary Orbitduring a Maximum of 23rd Solar Active Cycle, PhysicsProblems of Ecology, 2001, no. 6, pp. 12–20.
5. Nymmik, R.A., A Model of Particle Fluxes and Aver-aged Energy Spectra of Solar Cosmic Rays, Kosm.Issled., 1993, vol. 31, no. 6, pp. 51–59.
6. Nymmik, R.A., Probabilistic Model for Fluences andPeak Fluxes of Solar Energetic Particles, Rad. Meas.,1999, vol. 30, pp. 287–296.
7. Nymmik, R.A., Radiation Environment Induced by Cos-mic Ray Particle Fluxes in the International Space Sta-tion Orbit According to Recent Galactic and Solar Cos-mic Ray Models, Adv. Space. Res., 1998, vols. 21(12),pp. 1689–1698.
8. Nymmik, R.A., The Problems of Cosmic Ray ParticleSimulation for the Near-Earth Orbital and InterplanetaryFlight Conditions, Rad. Meas., 1999, vol. 30, pp. 669–677.
9. Ziegler, J.F. and Biersack, J.P., The Stopping and Rangeof Ions in Solids, New York: Pergamon, 1985.
10. Panasyuk, M.I., Tel’tsov, M.V., Shumshurov, V.I., andTsetlin, V.V., Radiation Dose Variations onboard the MirStation, Kosm. Issled., 1997, vol. 35, no. 5, pp. 555–558.
11. Mitrikas, V.G. and Tsetlin, V.V., Radiation Controlonboard the Mir Orbital Manned Station during the 22ndSolar Cycle, Kosm. Issled., 2000, vol. 38, no. 2, pp. 121–126.


![[DAN letterhead] TLD POSTAL DOSE QUALITY AUDIT FOR X-R ...€¦ · The TLD measured absorbed doses will be compared to the dose calculations from the hospital’s TPS for each of](https://img.pdfslide.us/doc/110x75/5fa0b361514ae42756474160/dan-letterhead-tld-postal-dose-quality-audit-for-x-r-the-tld-measured-absorbed.jpg)