Embed Size (px)
Citation preview
Detection and identification of geometric formsusing peripheral and central vlewlng1
STEPHEN HANDEL2 AND RICHARD E. CHRISTKANSAS STATE UNIVERSITY
Two tasks. using identical geometric forms. compared nasalperipheral. temporal peripheral. and central viewing. In the firsttask. using a yes-no confidence rating scale procedure, four Ssjudged the presence or absence of a known geometric form(detection). In the second task. the same Ss judged which ofseveNI knOWfJ forms was presented (identirJaltion). The majorresult is tMt tIIUIll aPld tempora! peripheralviewingQN! similarandthat both peripheral regions differ from central viewing. Also,detection and identification are relatively independent processes;the ease of detection of a form does not predict the ease ofidentification of that form.
Previous work comparing nasal and temporal peripheralvieWing (Wyke & Ettlinger. 1961; Crovitz & Daves, 1962; Wyke &Chorover, 1965) have led to conflicting results. This is notsurprising since each study used a different set of experimentalconditions (e.g.• stimuli, tasks. viewing positions, methods ofstimulus presentation). Nasal and temporal peripheral viewing ofthe same stimuli have not been compared using different tasksand rarely has peripheral viewing been compared with centralVieWing. Therefore, this experiment attempted to generalizeprevious work by comparing performance in the detection andidentification of the same geometric forms using nasal peripheral.temporal peripheral, and central viewing.
Detection TalkIn the detection task, S judged simply the presence or absence
of one known geometric form. A yes-no confidence rating scaleprocedure was used to generate an ROC curve. This procedureyiel<led a measure of the detectability of the form unaffected byS's response bias. Although signal detection theory was originallydeveloped for auditory detection, Nachmias and Steinman(1963), and Lee (1965) have demonstrated its applicability toVisual detection tasks.
Identification TaskIn the identifICation task, one of a set of known stimuli was
presented, and S ju<lged which stimulus was presented. Previouswork (Whitmer, 1933; Munn & Geil, 1932; Collier, 1931) hasshown that in peripheral viewing, triangles and squares are easierto identify than circles. Casperson (1950) has shown thatidentification in central vieWing is quite complex; factors such asperimeter, area, and length of maximum dimension differentiallyaffect identification of geometric forms.
Detection, in a logical sense, is the first step in identification(Kaswan & Young, 1963). In detection, S judges whether or not astimulus was presented; in identifi~ation, S judges, given that astimulus was presented, which of several alternatives he hasviewed. Therefore, it can be .hypothesized that the ease ofdetection of a form should be correlated with the ease ofidentification of that form. However, if detection andidentification are relatively independent processes, there shouldbe no simple relationship between the ease of detection of a formand the ease of identification of that same form.
METHODApparatus
The stimuli and fixatien point were exposed in an IconixModel 6131 three-field tachistoscope, driven and controlled bysolid state equipment, Both the flxation and stimulus fields were6 in. wide and 4.5 in. high. The ground luminance of both fieldswas .13 ml. The S's head wallheld in a rigid position by means ofa bite-bar attached to the tachistoscope. The left eye wasoccluded. The S was 57.3 in. from the stimuli. Therefore, incheson the stimulus cards are equivalent to visual angles (e.g., 2 in. areequivalent to 2 deg).
The S responded by using a two-throw toggle switch and fivepush buttons (arranged in a semicircle) mounted on a chassis box.The toggle switch and push buttons activated lamps mounted onE's monitor panel. The tachistoscope, response panels, S, and Ewere in a sound-shielded room that was dark except for a smalllight used by E for changing stimuli and monitoring S'sperformance.
Viewing PositionThree viewing positions were used for stimulus presentation:
central, 4.75 deg to the temporal side, and 4.75 deg to the nasalside.
When the stimuli were presented centrally, the fixation pointwas placed in the center of the visu" fteld and the stimulus wasalso placed in the center of the Held (no problems with maskingwere encountered). When the stimuli were presented in thetemporal periphery, the fixation point was placed 2.375 in. to theleft (nasal) of the center of the field, and the stimulus was placed2.375 in. to the right of the center. Thus, presentation was at atotal of 4.75 in. (4.75 deg) to the temporal side of the viewingfield. The reverse procedure was used for nasal presentation.
StimuliThe five forms were a circle, two equilateral triangles, one with
the apex pointing upwards and the other with the apex pointingdownwards, and two open triangles ("V" shapes) formed byremoving the horiZontal sides of the equilateral closed triangles.The circle had an outside diameter of .29 in. and the open andclosed triangles had sides that measured .29 in. The fixationpoints consisted of two horizontal and two vertical crosshairs.375 in. long terminating at the circumference of an imllginarycircle with a 1.31 in. diam. The width of all lines was .033 in.
The forms and fixation points were drawn on vellum paper,photographically reduced, made into 6 x 8 in. matte prints, andmounted on cardboard. The reflectance of the matte paper was80% and the reflectance of the black lines of the forms andfixation points was 2.5%.
There were 15 form cards and 3 fixation point cards, fiveforms, and one fixation point for each vieWing position. Oneadditional card, a blank field created by photographing a blanksheet of vellum paper, was used for the detection task.
SubjectsThe two authors and two graduate students served as Ss. All Ss
Perception & Psychophysics, 1969, Vol. 6 (1) Copyright 1969, Psychonomic Joumals, Inc., Austin, Texas 47
had normal visual acuity and were right-eye dominant. All Ss hadserved in previous studies and were familiar with both theapparatus and stimuli.
Procedure3
Prior to the experimental sessions, the exposure times werevaried for both the detection and identification task in order toachieve a criterion performance. When performance had stabilizedusing one exposure time to this criterion, the experimentalsessions began. Also, the order of presentation of conditions forboth tasks was counterbalanced. This proved unnecessary as littleimprovement in performance was found.
Before each session, S stayed in a dark room for 15 min todark adapt.
Detection. Each session of the detection task consisted of arandom sequence of 60 stimulus-form trials and 60 blank-fieldtrials. Only one stimulus form and one viewing position were usedin a given session and S knew this before the session began. Eachsession took about 15 min. Several sessions were run per day untila total of 30 sessions had been run per S; there were tworeplications of each stimulus form by viewing positioncombination. A different random order was used in each session.
The exposure times necessary for 80% correct detections foreach viewing position were determined separately for each S.These values, for different Ss, ranged from 60 to 75 msec forperipheral viewing and from 35 to 50 msec for central viewing.The same exposure time for each S was used for nasal andtemporal presentation. In the actual experimental sessions, therewere 82, 75, and 85% correct detections for nasal, temporal, andcentral viewing, respectively.
To begin a trial, E would push a start button which activatedthe warning tone for I sec. Two seconds after this toneterminated, the stimulus field was exposed. The S would thenrespond with the toggle switch to indicate whether or not he sawthe stimulus and with one of the five push buttons to indicate hisconfidence, ranging from a guess to absolute certainty. Afterrecording S's response, E would initiate the next trial.
Identification. For the identification task, 75 trials consistingof a random sequence of the five forms (each form occurring 15times) constituted one block of trials at one of the three viewingpositions. Two such trial blocks, each at a different Viewingposition, were run during one session. Each session lasted about2S min with a S min rest between trial blocks. Eighteen sessionswere completed by each S, six at each of the three viewingpositions. A different random order of forms was used for eachtrial block. The S responded by pushing the button thatcorresponded to the form he thought he saw during the stimulusexposure.
The exposure times necessary to yield about 50% correctidentifications at each vieWing position were determinedseparately for each S. These values ranged from 90 to 100 msecfor nasal and temporal viewing and from 45 to 55 msec forcentral viewing.4 The same exposure time for each S was used fornasal and temporal viewing.
RESULTSDetection T8IIk
The area under an ROC curve was the measure of thedetectability of a form; +.50 indicates chance detection and +1.0indicates perfect detection. The area under the ROC curve,discussed in Green and Swets (1966), provides a simpledistribution-free index of the detectability of a signal.
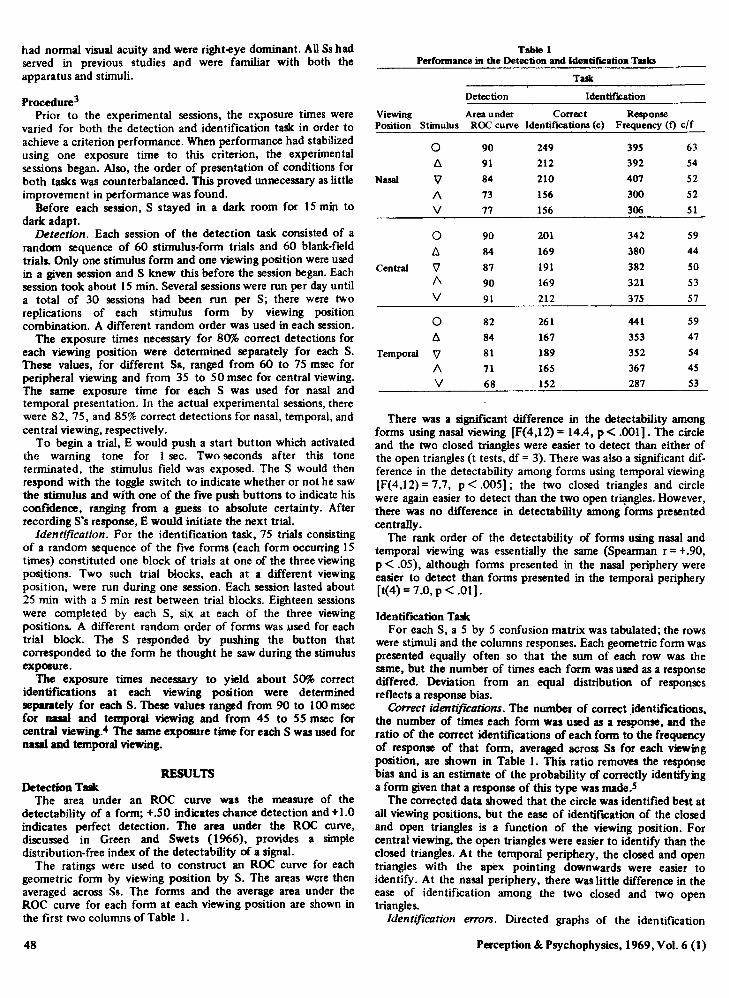
The ratings were used to construct an ROC curve for eachgeometric form by viewing position by S. The areas were thenaveraged across Ss. The forms and the average area under theROC curve for each form at each viewing position are shown inthe first two columns of Table I.
48
Table IPerfonnanc:e in the ~tection and IdentifICation Tub
Talk
Detection IdentifICation
Viewing Area under Correct ResponsePosition Stimulus ROC curve Identifications (c) Frequency (0 elf
0 90 249 395 63
t:. 91 212 392 54
Nasal 'V 84 210 407 52
A 73 156 300 52
V 77 156 306 51
0 90 201 342 59
t. 84 169 380 44
Central 'V 87 191 382 50A 90 169 321 53V 91 212 375 57
0 82 261 441 59
t. 84 167 353 47
Temporal 'V 81 189 352 54
A 71 165 367 45
V 68 152 287 53
There was a significant difference in the detectability amongforms using nasal viewing [F(4,12) =14.4, p< .001). The circleand the two closed triangles were easier to detect than either ofthe open triangles (t tests, df =3). There was also a significant difference in the detectability among forms using temporal viewing[F(4,12) =7.7, P < .005]; the two closed triangles and circlewere again easier to detect than the two open triangles. However,there was no difference in detectability among forms presentedcentrally.
The rank order of the detectability of forms using nasal andtemporal viewing was essentially the same (Spearman r =+.90,p < .05), although forms presented in the nasal periphery wereeasier to detect than forms presented in the temporal periphery[t(4) =7.0, P < .01).
Identification T8IIkFor each S, a 5 by 5 confusion matrix was tabulated; the rows
were stimuli and the columns responses. Each geometric form waspresented equally often so that the sum of each row was thesame, but the number of times each form was used as a responsediffered. Deviation from an equal distribution of responsesreflects a response bias.
Correct identifications. The number of correct .identif"teations,the number of times each form was used as a response, and theratio of the correct identifications of each form to the frequencyof response of that form, averaged across Ss for each viewingposition, are shown in Table I. This ratio removes the responsebias and is an estimate of the probability of correctly identifyinga form given that a response of this type was made.5
The corrected data showed that the circle was identified best atall viewing positions, but the ease of identifICation of the closedand open triangles is a function of the viewing position. Forcentral viewing, the open triangles were easier to identify than theclosed triangles. At the temporal periphery, the closed and opentriangles with the apex pointing downwards were easier toidentify. At the nasal periphery, there was little difference in theease of identification among the two closed and two opentriangles.
Identification e"OTS. Directed graphs of the identification
Perception & Psychophysics, 1969, Vol. 6 (1)
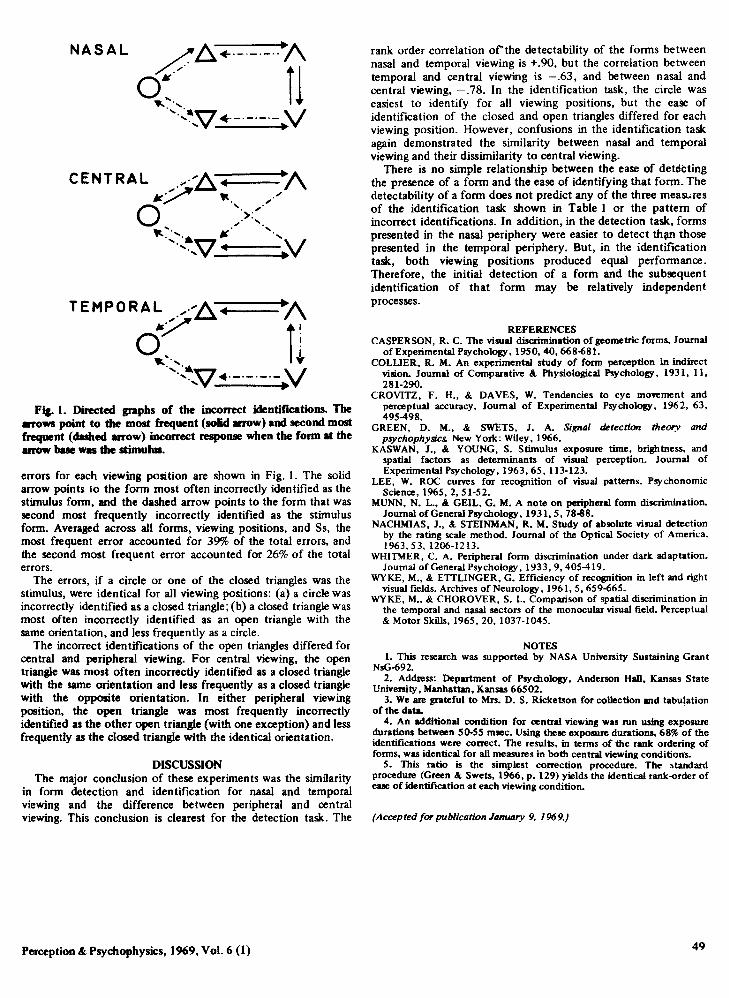
NASAL
Fia. l. Direc:ted graphs of the incorrect identifications. Themows point to the most frequent (solid arrow) and second mostfrequent (dashed arrow) incorrect response when the fonn at thearrow base wa the stimulus.
errors for each viewing position are shown in Fig. 1. The solidarrow points 10 the form most often incorrectly identified as thestimulus form. and the dashed arrow points to the form that wassecond most frequently incorrectly identified as the stimulusform. Averaged across all forms. viewing positions, and Ss, themost frequent error accounted for 39% of the total errors, andthe second most frequent error accounted for 26% of the totalerrors.
The errors, if a circle or one of the closed triangles was thestimulus, were identical for all viewing positions: (a) a circle wasincorrectly identified as a closed triangle; (b) a closed triangle wasmost often incorrectly identified as an open triangle with thesame orientation. and less frequently as a circle.
The incorrect identifications of the open triangles differed forcentral and peripheral viewing. For central viewing, the opentriangle was most often incorrectly identified as a closed trianglewith the same orientation and less frequently as a closed trianglewith the opposite orientation. In either peripheral viewingposition, the open triangle was most frequently incorrectlyidentified as the other open triangle (with one exception) and lessfrequently as the closed triangle with the identical orientation.
DISCUSSIONThe major conclusion of these experiments was the similarity
in form detection and identification for nasal and temporalviewing and the difference between peripheral and centralviewing. This conclusion is clearest for the detection task. The
Perception & Psychophysics, 1969, Vol. 6 (1)
rank order correlation of'the detectability of the forms betweennasal and temporal viewing is +.90, but the correlation betweentemporal and central viewing is -.63, and between nasal andcentral viewing. -.78. In the identification task, the circle waseasiest to identify for all viewing positions, but the ease ofidentification of the closed and open triangles differed for eachviewing position. However, confusions in the identification taskagain demonstrated the similarity between nasal and temporalviewing and their dissimilarity to central viewing.
There is no simple relationship between the ease of detectingthe presence of a form and the ease of identifying that form. Thedetectability of a form does not predict any of the three measuresof the identification task shown in Table I or the pattern ofincorrect identifications. In addition, in the detection task, formspresented in the nasal periphery were easier to detect than thosepresented in the temporal periphery. But, in the identificationtask, both viewing positions produced equal performance.Therefore, the initial detection of a form and the subsequentidentification of that form may be relatively independentprocesses.
REFERENCESCASPERSON, R. C. The visual discrimination of geometric forms.lournal
of Experimental Psychology, 1950,40,668-681.COLLIER, R. M. An experimental study of form perception in indirect
vision. Journal of Comparative & Physiological Psychology, 1931,11,281-290.
CROVITZ, F. H., & DAVES, W. Tendencies to eye mowment andperceptual accuracy. Journal of Experimental Psychology, 1962, 63,495-498.
GREEN, D. M., & SWETS, 1. A. Signal detection theory andpsychophyllic&. New York: Wiley, 1966.
KASWAN, 1., & YOUNG, S. Stimulus exposure time, brightness, andspatial factors as determinants of visual perception. Journal ofExperimental Psychology. 1963, 65,113-123.
LEE, W. ROC curves for recognition of visual patterns. PsychonomicScience, 1965,2,51·52.
MUNN, N. L.• & GEIL, G. M. A note on peripheral form discrimination.Journal of General Psychology, 1931. 5, 78~8.
NACHMIAS, J., & STEINMAN, R. M. Study of ab!lOlute visual detectionby the rating scale method. lournal of the Optical Society of America,1963,53,1206-1213.
WHITMER, C. A. Peripheral form discrimination under dark adaptation.Journal of General Psychology, 1933,9,405-419.
WYKE, M., & ETTLINGER, G. Efficiency of recognition in left and rightvisuallields. Archives of Neurology, 1961,5,659-665.
WYKE, M., & CHOROVER, S. L. Comparison of spatial discrimination inthe temporal and nasal sectors of the monocular visual field. Perceptual& Motor Skills, 1965,20, 1037-1045.
NOTES1. This research was supported by NASA University Sustaining Grant
NsG-692.2. Address: Department of Psychology, Anderson Hall. Kansas State
University, Manhattan, Kansas 66502.3. We are grateful to Mrs. D. S. Ricketson for collection and tabulation
of the datL .4. An additional condition for central viewing was run using exposure
durations between 50-55 msec, Using these exposure durations. 68% of theidentifications were correct. The results. in terms of the rank ordering offorms, was identical for all measures in both central viewing condition's.
5. This ratio is the simplest correction procedure. The standardprocedure (Green & Swets, 1966, p, 129) yields the identical rank-order ofease of identification .at each viewing condition.
(Accepted for publication January 9, 1969.)
49