Embed Size (px)
Citation preview

1
Regulatory genetic variation in the Flavin-
containing monooxygenase 1 gene (FMO1):
detection and functional consequences
Matthew Hancock
A dissertation submitted to the Faculty of Life Sciences in partial fulfilment
of the requirements for the degree of Doctor of Philosophy in the
University of London.
Department of Structural and Molecular Biology
University College London

2
Abstract
The amount of both FMO1 mRNA and protein in various human tissues has
previously been shown to vary by as much as 10-fold between individuals. This is
likely to be caused by genetic variation as the enzyme‟s expression profile is not
affected by exogenous agents.
DNA sequences controlling transcription (promoter regions) have been defined
upstream of the three transcriptional start sites P0, P1 and P2 within different cell
lines. The use of these promoters has also been defined in various mouse tissues by
real-time PCR.
A number of SNPs are present within the three defined FMO1 promoters in addition
to the 3′UTR. Sequencing of individuals from the Corriel repository consisting of
individuals from Africa, Asia and Europe has revealed further variation including a
CT deletion at the P1 transcriptional start site.
To test the effect of genetic variation high-throughput DNase I capillary footprinting
has been used to check for the effect of SNPs on DNA-protein binding. The
technique has been shown to detect the effects of mutations on DNA-protein binding
but no differences have been seen for FMO1 SNPs within promoter regions as yet.
The technique has the potential to rapidly analyse regulatory polymorphism in a
number of genes and the effect in different tissues without the need for cloning or
cell culture.
A SNP which introduces an additional in-frame upstream translation initiation codon
has been tested in-vitro for its effect on translational efficiency. The upstream ATG
variation has been shown to have a 2-fold increase in protein expression over the
downstream ATG and therefore individuals with this SNP are likely to produce 2-fold
more FMO1 protein resulting in different effects to drugs.

3
Acknowledgements
During my PhD I have had a wonderful experience of Science and the community
within it. Therefore, there are many people I wish to acknowledge for the help and
support I received. I thank my supervisor Professor Elizabeth Shephard. I could not
have asked for a better supervisor in terms of her help and support. I particularly
appreciate the help she gave me when first starting in the lab. I had no previous lab
experience before undertaking the PhD and she took the time to help me develop my
practical work. I also would like to especially thank Dr. Azara Janmohamed for
advice and support throughout my PhD.
I would like to thank Dr. Mina Edwards for helping me with cell culture and
transfection and especially with difficult to transfect cell lines. I thank Dr. Lyndsey
Houseman for helping me with experiments during the first year of my PhD. I thank
all the members past and present in Lab 402 for making it a really pleasant place to
work, especially to Sandra Gonzalez-Malagon who has been a great friend
throughout my time at the lab.
I thank the members of my thesis committee, Professor Dallas Swallow and Dr. Kate
Bowers for very constructive meetings and comments. I thank Dr. Neil Bradman for
part-funding of my BBSRC-case studentship. I thank Prof. Ian Phillips for interesting
and developing discussions.
Within the department I would like to thank the members of Professor Jeremy
Brockes lab for the help and support I received, especially Mr. Phil Gates for advice

4
in cloning and molecular biology, Dr. James Godwin for advice in developing my
project, and Dr. Robert Blassberg for developing the RT-PCR strategy. I also thank
all the members of the Brockes lab for creating a fantastic social environment in wish
to discuss science.
Lastly, I would like to thank my family who, although are not scientists, have really
understood the stresses and strains of PhD life. I recommend Devon as an excellent
escape from PhD life! I also thank my partner Dr. Zanna Briscoe for supporting me
throughout this work. Without her help and support I do not think this could have
been achieved.

5
I, Matthew Andrew Hancock confirm that the work presented in this thesis is my own.
Where information has been derived from other sources, I confirm that it has been
indicated in the thesis.
6
Contents
Chapter 1 : Introduction ............................................................................................................. 16
1.1Xenobiotic metabolism ................................................................................................................... 16
1.2 Flavin-containing monooxygenases, background ............................................................... 16
1.3 FMO catalytic cycle and substrates ........................................................................................... 18
1.4 The Flavin-containing monooxygenase family ..................................................................... 23
1.4.1 Human FMO chromosomal locations ............................................................................... 28
1.5 Contribution of FMOs to xenobiotic metabolism................................................................. 29
1.6 FMO1 chemical regulation ............................................................................................................ 33
1.7 Mechanisms of gene regulation .................................................................................................. 33
1.8 Chromosomal localisation and structure of the human and mouse FMO1 genes ... 37
1.9 FMO1 expression ............................................................................................................................. 40
1.10 Alternatively spliced, non-coding exons and their function ......................................... 43
1.11 FMO1 Genetic Variation .............................................................................................................. 45
1.11.1 Protein coding region variation ...................................................................................... 45
1.11.2 Untranslated mRNA Variants ........................................................................................... 49
1.11.3 Promoter Variants ................................................................................................................ 49
1.12 FMO1 in drug metabolism ......................................................................................................... 51
1.13 FMO1 and disease ......................................................................................................................... 54
1.14 Expression Profiles ....................................................................................................................... 54
1.15 How Regulatory polymorphisms and polymorphism influencing splicing cause changes in gene expression ................................................................................................................. 59
1.16 Regulatory polymorphism and splice-site polymorphism observed in drug metabolizing enzyme genes ................................................................................................................ 62
1.17 Methods of identifying and analysing regulatory polymorphism .............................. 64
1.18 Illumina second-generation sequencing and its application for regulatory polymorphism .......................................................................................................................................... 68
1.19 Polymorphism effecting translation efficiency .................................................................. 70
1.20 3T3-L1 adipocytes and their use as a model for adipocyte biology .......................... 72
1.21: Aims of this study ............................................................................................................... 75
Chapter 2 : Materials and Methods ......................................................................................... 78
2.1 Escherichia coli (E. coli) strains and culture conditions .................................................... 78
2.1.1 Genotypes of E. coli strains .................................................................................................. 78
2.1.2 Culture of E. coli cells ............................................................................................................. 78
2.2 Small scale isolation of plasmid DNA from E. Coli ............................................................... 79

7
2.3 Large-scale isolation of plasmid DNA from E. Coli .............................................................. 80
2.4 Quantification of DNA/RNA by UV spectrophotometry ................................................... 82
2.5 Bacterial Transformation.............................................................................................................. 82
2.6 Preparation of glycerol stocks .................................................................................................... 83
2.7 Restriction endonuclease digestion of DNA .......................................................................... 84
2.8 Agarose gel electrophoresis of DNA fragments ................................................................... 85
2.9 Purification of DNA fragments from agarose gels ............................................................... 86
2.9.1 Purification of DNA in solution .......................................................................................... 87
2.10 DNA ligation .................................................................................................................................... 87
2.11 Polymerase chain reaction (PCR) ........................................................................................... 88
2.11.1 Bio-X-act DNA polymerase ..................................................................................................... 91
2.12 Reverse transcriptase polymerase chain reaction ........................................................... 92
2.13 TOPO T/A cloning ......................................................................................................................... 93
2.14 Isolation of RNA from cells, mouse and human tissues .................................................. 95
2.14.1 Tissue preparation ............................................................................................................... 95
2.14.2 RNA isolation from tissue cultured cells ...................................................................... 95
2.15 COS-7 AND 3T3-L1 cell culture ................................................................................................ 97
2.15.1 HK-2 cell culture .................................................................................................................... 97
2.16 Transient transfection of cells .................................................................................................. 98
2.17 Isolation of Nuclear proteins from cell lines ....................................................................... 99
2.18 Dual-luciferase® reporter assay and pGL3 vectors ..................................................... 100
2.19 RNA Transfection ....................................................................................................................... 103
2.20 Reporter constructs used for transfection studies ........................................................ 103
2.20.1 FMO1 promoter reporter constructs ......................................................................... 103
2.20.2 FMO1 P2 leader sequence construct .......................................................................... 104
2.21 Protein concentration determination ................................................................................ 108
2.22 Protein Gel Electrophoresis (SDS/PAGE) ......................................................................... 109
2.23 Electrophoretic Mobility Shift assay ................................................................................... 110
2.24 Real-time PCR .............................................................................................................................. 112
2.24.1 Calculation of relative amounts of FMO1 transcripts within and between tissues ....................................................................................................................................................... 115
2.25 3T3-L1 differentiation .............................................................................................................. 116
2.26 3T3-L1 adipocyte nucleofection ........................................................................................... 117
2.27 In-vitro RNA production .......................................................................................................... 118
2.28 Phusion® site-directed mutagenesis ................................................................................. 119
2.28.1 FMO1 promoter mutation constructs ............................................................................. 120
2.29 DNA sequencing .......................................................................................................................... 121

8
2.29.1 PCR for sequencing ........................................................................................................... 122
2.29.2 Sequencing reaction .............................................................................................................. 123
2.29.3 Cleaning the sequencing reaction ................................................................................ 123
2.29.4 Phase haplotype reconstruction .................................................................................. 124
2.30 DNase I capillary footprinting ............................................................................................... 124
2.30.1 Labelling DNA ...................................................................................................................... 124
2.30.2 Binding reaction ................................................................................................................. 124
2.30.3 DNase I digestion ............................................................................................................... 125
2.30.4 Capillary electrophoresis and data analysis ............................................................ 126
2.30.5 Dye terminator sequencing ............................................................................................ 126
2.31 Software Packages ..................................................................................................................... 127
Chapter 3 : Profiling of Fmo1 gene expression in mouse tissues and cell-lines ... 130
3.1 Quantification of the expression of Fmo1 in different mouse tissues by real-time PCR ............................................................................................................................................................. 132
3.1.1 Selection of reference genes to normalise FMO1 expression .............................. 132
3.1.2 Quantification of the FMO1 global transcript in different mouse tissues....... 136
3.1.3 Quantification in different mouse tissues of the P0, P1 and P2 FMO1 mRNA transcripts .......................................................................................................................................... 138
3.1.4 The relative expression of the P0, P1 and P2 transcripts combined to that of the global expression of FMO1 mRNA ..................................................................................... 138
3.2 Expression of Fmo1 in 3T3-L1 cells undergoing differentiation to adipocytes .... 143
3.2.1 Fmo1 expression during differentiation of the EACC™, 3T3-L1 mouse fibroblast cell line ............................................................................................................................ 143
3.2.2 Fmo1 expression during differentiation of the ATCC™ 3T3-L1 cell line ......... 147
3.2.3 Fmo1 P0, P1 and P2 transcript expression during 3T3-L1 differentiation .... 151
3.2.4 Fmo1 global expression during differentiation of the ATCC™. 3T3-L1 mouse fibroblast cell line ............................................................................................................................ 151
Chapter 4 : Characterisation of different FMO1 promoters ........................................ 157
4.1 Definition of human FMO1 promoters in COS-7, HK-2, and 3T3-L1 cells ............... 158
4.1.1 Reporter gene assay controls .......................................................................................... 158
4.1.2 Optimisation of transfection for COS-7, HK-2 and 3T3-L1 cell lines ................ 160
4.1.3 COS-7 cell transfection ....................................................................................................... 163
4.1.4 Ratio of FMO1 promoter usage in COS-7 cells ........................................................... 163
4.1.5 Tranfection of HK-2 cells with FMO1 promoter constructs ................................. 166
4.1.6 Ratio of FMO1 promoter usage in HK-2 cells ............................................................. 167
4.1.7 FMO1 promoter usage in 3T3-L1 fibroblast cells .................................................... 169
4.1.8 Ratio of FMO1 promoter usage in 3T3-L1 cells ......................................................... 169

9
4.2 Transfection using nucleofection of 3T3-L1 differentiated into adipocytes ......... 172
4.3 The FMO1 P2 promoter region and prediction of transcription factor binding ... 176
4.4 The defined P1 promoter region and potential protein binding sites ..................... 179
4.5 Epigenetic analysis of the human FMO1 promoters ........................................................ 182
4.5.1 DNase I hypersensitive regions (HRs) located within and surrounding the FMO1 gene (Fig4.10) ...................................................................................................................... 182
4.5.2 DNase I Hypersensitivity regions in different tissues surrounding the P1 and P2 promoters .................................................................................................................................... 185
4.5.3 The CTCF insulator binds upstream of the P0 promoter and may play a role in FMO1 repression within the human liver .............................................................................. 187
4.5.4 Chip-seq experiments identifying transcription factor binding within P0, P1 and P2 promoters ............................................................................................................................ 190
4.6 FMO1 P2 promoter mutations and their influence on promoter activity ............... 194
4.6.1 Mutations in the FMO1 P1 promoter ............................................................................ 194
4.6.2 A mutation introduced into the FMO1 P2 promoter reduces reporter gene activity ................................................................................................................................................. 195
4.6.3 Loss of protein binding due to a mutation within the GC box protein binding region of the P2 promoter is detected by a gel shift assay .............................................. 198
4.7 The significance of a polymorphism, -11C>T, which potentially reduces the translational efficiency of the FMO1 protein ............................................................................. 200
Chapter 5 : Dideoxy sequence analysis of the human FMO1 P0, P1, and P2 promoters ..................................................................................................................................... 207
5.1 Experimental design: Number of individuals and regions to be sequenced.......... 208
5.2 Identification of novel polymorphism within the FMO1 P1 and P2 promoter regions ...................................................................................................................................................... 211
5.3 Confirmation of the -515G>A and -503C>T SNPs and genotyping in CEU, YRI and JPT/HAN populations ......................................................................................................................... 212
5.4 Construction and analysis of FMO1 P1, P2 haplotypes in CEU, YRI and JPT/HAN populations ............................................................................................................................................. 217
5.5 Construction and analysis of FMO1 P0 haplotypes in CEU, YRI and JPT/HAN populations ............................................................................................................................................. 222
Chapter 6 : Optimisation and development of capillary DNase I footprinting for the detection of regulatory polymorphisms that alter DNA-protein binding events .......................................................................................................................................................... 228
6.1 Labelling and detection of DNA fragments for capillary DNase I footprinting ..... 229
6.2 Footprinting analysis of the Simian Virus 40 promoter (SV40) ................................. 230
6.2.1 Optimisation of the SV40 promoter nuclear protein binding reaction ........... 233
6.2.2 DNase I digestion .................................................................................................................. 233

10
6.2.3 Increasing the binding competitor does not affect the DNA-protein binding profile of the promoter .................................................................................................................. 237
6.2.4 Increasing DNA amount increases the FAM signal and DNA-Protein binding is less specific ........................................................................................................................................ 237
6.2.5 Confirmation of DNA-protein binding events ........................................................... 238
6.2.6 Analysis of digested DNA fragments ............................................................................. 242
6.3 Dye terminator sequencing reactions to determine location of DNA-protein binding ...................................................................................................................................................... 244
6.4 Description of the SV40 DNA-protein binding profile .................................................... 244
6.5 Normalisation of signal intensity to the LIZ marker ....................................................... 247
6.6 Footprinting analysis of the novel FMO1 P1 and P2 promoters ................................ 248
6.6.1 P1 Promoter............................................................................................................................ 248
6.6.2 The FMO1 P2 promoter footprint analysis ................................................................. 250
6.7 Loss of protein binding at the P2 promoter was visualised by DNase I capillary footprinting and therefore validates this technique for screening regulatory polymorphism via this method ....................................................................................................... 252
List of figures
Chapter 1: Introduction Figure 1.1 Catalytic cycle of FMOs ......................................................................................................... 20
Figure 1.2 The predicted FAD and NADPH binding sites of mammalian FMOs .................. 27
Figure 1.3 Illustration of methods of gene regulation within the cell ..................................... 36
Figure 1.4 The 5′FMO1 gene region of (A) human and (B) mouse ............................................ 38
Figure 1.5. The FMO1 gene and the location of protein coding SNPs ...................................... 48
Figure 1.6 Mechanisms that result in differences in protein expression between individuals ...................................................................................................................................................... 61
Figure 1.7 Illustration of the morphological and gene regulatory changes that occur during 3T3-L1 adipocyte differentiation ............................................................................................ 74
Chapter 2: Materials and methods Figure 2.1 pCR®4-TOPO vector map (Invitrogen catalogue) ..................................................... 94
Figure 2.2 Maps of pGL3 vectors and the pRL vector ................................................................. 106
Figure 2.3 Cloning of the FMO1 P2 leader sequence into the pSP-luc+NF fusion vector .......................................................................................................................................................................... 107
Chapter 3 : Profiling of Fmo1 gene expression in mouse tissues and cell-lines Figure 3.1 Selection of suitable reference genes for the normalisation of Fmo1 expression in different mouse tissues .............................................................................................. 135
Figure 3.2 Global Fmo1 expression in different mouse tissues............................................... 137
Figure 3.3 Relative gene expression of Fmo1 mouse transcripts within different mouse tissues ............................................................................................................................................................ 139
Figure 3.4 Comparison of the total relative expression of the Fmo1 P0, P1, and P2 transcripts with the relative expression of the Fmo1 global transcript .............................. 142

11
Figure 3.5 Images of (A) EACC™ 3T3-L1 fibroblasts and (B) differentiated EACC™ 3T3-L1 adipocytes .............................................................................................................................................. 145
Figure 3.6 Fmo1 and adipocyte markers, LPL, FABP, and PPAR-γ expression in 3T3-L1 (ECACC™ cell line) pre-adipocyte and mature adipocytes ........................................................ 146
Figure 3.7 Comparison of the EACC 3T3-L1 differentiated cell line with the ATCC™ 3T3-L1 differentiated cell line ....................................................................................................................... 149
Figure 3.8 Expression profiling of (A)FMO1, (B) LPL (C) PPAR-γ (D) FABP mRNAs during 3T3-L1 differentiation .............................................................................................................. 150
Figure 3.9 Quantification of Fmo1 global gene expression during 3T3-L1 differentiation (ATCC) ........................................................................................................................................................... 153
Chapter 4 : Characterisation of different FMO1 promoters Figure 4.1 Illustration of the sequences upstream of each of the FMO1 transcriptional start sites cloned within the pGL3-Basic plasmid ........................................................................ 159
Figure 4.2 Determination of DNA/LIPID ratios for optimal transfection of (A) COS-7 and (B) HK-2 cells .............................................................................................................................................. 162
Figure 4.3 Reporter gene activity of PGL3-Basic constructs containing DNA sequences upstream of the three FMO1 transcriptional start sites transfected into COS-7 cells ... 165
Figure 4.4 Reporter gene activity of PGL3-Basic constructs containing DNA sequences upstream of the three FMO1 transcriptional start sites transfected in HK-2 cells .......... 168
Figure 4.5 Reporter gene activity of PGL3-Basic constructs containing DNA sequences upstream of the three FMO1 transcriptional start sites transfected in 3T3-L1 cells ..... 171
Figure 4.6 GFP Nucleofection of 3T3-L1 adipocytes ................................................................... 173
Figure 4.7 Illustration of human FMO1 promoters defined by reporter gene assays .... 175
Figure 4.8 Annotation of P2 promoter .............................................................................................. 178
Figure 4.9 Annotation of P1 promoter............................................................................................. 181
Figure 4.10 Genome wide DNase I chromatin assays outlining DNase I sensitive sites upstream of the FMO1 P0, P1 and P2 promoter. .......................................................................... 184
Figure 4.11 Illustration of DNase I hypersensitivity sites within the defined FMO1 P1 and P2 promoter regions ....................................................................................................................... 186
Figure 4.12 Schematic representation of CTCF binding upstream and downstream of the P0 promoter, as well as DNase I hypersensitive sites within human tissues .................... 189
Figure 4.13 Illustration of transcription factor binding within the FMO1 P1 and P2 promoter regions ...................................................................................................................................... 192
Figure 4.14 Schematic representation of transcription factors that bind to the P0 promoter ...................................................................................................................................................... 193
Figure 4.15 Illustration of mutations introduced to the P2 promoter reporter gene construct and the natural variations occurring within the P1 promoter ........................... 196
Figure 4.16 Reporter gene activity of the pGL3-255_128 P2 promoter construct and the pGL3-255_128* GC box mutant within COS-7 cells ..................................................................... 197
Figure 4.17 Gel shift assay showing loss of protein binding at the FMO1 P2 promoter due to a mutation within the GC binding box ................................................................................ 199
Figure 4.18 Reporter gene activities of RNA produced from the pSP-ATG/ATG and the pSP-ACG/ATG vectors ............................................................................................................................. 202
Chapter 5 : Dideoxy sequence analysis of the human FMO1 P0, P1, and P2 promoters Figure 5.1 Location of primers used to amplify DNA from individuals for subsequent dideoxy sequence analysis .................................................................................................................... 210

12
Figure 5.2 The frequency of alleles and genotypes within (A) the FMO1 P1 and P2 promoter and (B) the FMO1 P0 promoter ....................................................................................... 214
Figure 5.3 Ilustration of the HapMap consortium genotyped SNPs within the FMO1 P1 and P2 promoter region ......................................................................................................................... 216
Figure 5.4 Predicted haplotype frequencies of the FMO1 P1 and P2 promoter regions in different populations ............................................................................................................................... 220
Figure 5.5 (A) Illustration of the polymorphisms that reside within the P1 and P2 promoter regions of FMO1 and (B) the high frequency haplotypes within the populations analysed ............................................................................................................................... 221
Chapter 6 : Optimisation and development of capillary DNase I footprinting for the detection of regulatory polymorphisms that alter DNA-protein binding events Figure 6.1 Annotation of the SV40 promoter sequence and PCR FAM labelling of the sequence ....................................................................................................................................................... 232
Figure 6.2 0.005U of DNase I is optimal to produce an evenly size-distributed set of DNA fragments ..................................................................................................................................................... 236
Figure 6.3 Increasing the amount of competitor DNA does not affect the DNase I footprinting trace of the SV40 promoter ......................................................................................... 239
Figure 6.4 Capillary DNase I footprinting of the SV40 promoter with increased amounts of SV40 DNA template ............................................................................................................................. 240
Figure 6.5 Treatment of DNA-protein binding reaction with proteinase K removes DNase I footprints within the SV40 promoter ............................................................................... 241
Figure 6.6 The chromatograms above show the DNase I digested fragments from the 5′FAM labelled SV40 promoter after incubation with COS-7 nuclear protein extract ... 243
Figure 6.7 Illustration of a section of the SV40 footprinted promoter aligned with dye-terminated sequencing reactions ....................................................................................................... 246
Figure 6.8 DNase I footprinting of the human FMO1 P1 promoter using COS-7 nuclear extract ............................................................................................................................................................ 249
Figure 6.9 DNase I footprinting of the human FMO1 P2 promoter using COS-7 nuclear extract ............................................................................................................................................................ 251
Figure 6.10 Detection of the loss of DNA-protein binding within the FMO1 P2 promoter .......................................................................................................................................................................... 253
List of tables Table 1.1 Xenobiotic Metabolism........................................................................................................... 17
Table 1.2 Examples of some FMO1 substrates and their sites of oxidation .......................... 22
Table 1.3 Expression levels of FMO1 mRNA or protein measured in different human tissues ............................................................................................................................................................... 42
Table 1.4 Drugs metabolized by FMO1 ................................................................................................ 53
Table 1.5 Geoprofile data which show an increase in Fmo1 expression ................................ 57
Table 1.6 Geoprofiles which show a decrease in human FMO1 or mouse Fmo1 expression ....................................................................................................................................................... 58
Table 2.1 PCR cycling conditions ........................................................................................................... 90
Table 2.2 PCR cycling used for quantitative real time PCR....................................................... 114
Table 2.3 PCR cycling conditions for site-directed mutagenesis ............................................ 121
Table 2.4 Amplification parameters used for dye-terminator sequencing reactions .... 127

13
Abbreviations
ABI Applied Biosystems
ALS amyotrophic lateral sclerosis
amp Ampicillin
AP1 activator protein 1
bp base pairs
BSA bovine serum albumin
C/EBP CC/AAT enhancer binding protein
CANX Calnexin
CAT Catalase
cDNA complementary DNA
Chip-seq chromatin immunoprecipitation
CYPs cytochrome P450s
dATP deoxyadenosine triphosphate
DMEs drug-metabolizing enzymes
DNA deoxyribonucleic acid
DNase I deoxyribonuclease I
DTT Dithiothreitol
ECACC European Collection of Animal Cell Culture
EDTA ethylene diaminetetracetate
EGTA ethylene glycol-bis (β-aminoethyl ether)- N,N,N' tetraacetate
EIF1AX eukaryotic translation initiation factor 1A, X-linked
EMSA electrophoretic mobility shift assay
ENCODE The Encyclopedia of DNA Elements
ESE exon splicing enhancer
EST expression sequence tag
EtBr ethidium bromide
FAD flavin adenine dinucleotide
FAIRE-seq formaldehyde-Assisted Isolation of Regulatory Elements
FMO flavin-containing monooxygenase
GAPDH glyceraldehyde 3-phosphate dehydrogenase
HBG1 hemoglobin subunit gamma-1
HEPES N-2-hydroxyethyl piperazine N'-2-ethanesulphonic acid
HiDi highly deionized
HNF1α hepatocyte Nuclear Factor 1
HNF4α hepatocyte Nuclear Factor 4
hr Hour
HRs hypersensitive regions
IGF2 insulin-like growth factor 2
Kb Kilobase
KDa kilo Daltons
LB Luria Bertani
LD linkage disequilibrium
LEF1 lymphoid enhancer-binding factor 1
LPL lipoprotein lipase

14
MI myocardial infarction
MPP+ 1-methyl-4-phenylpyridine
MPTP 1-methyl-4-phenyl-1,2,3,6-tetrahydropyridine
NAPDH nicotinamide adenine dinucleotide phosphate
NF-Y nuclear transcription factor Y
NP-40 nonidet P40
NRG1 neuregulin 1
nt Nucleotide
ORFs open reading frame
OTX2 orthodenticle homeobox 2
PAGE polyacrylamide gel electrophoresis
PBS phosphate buffered saline
PCR polymerase chain reaction
PGC1-α peroxisome proliferator-activated receptor gamma coactivator 1
RACE rapid amplification of cDNA clones
RLU relative light units
RNA ribonucleic acid
RNase Ribonuclease
ROS reactive-oxygen species
RT-PCR real-time PCR
SDS sodium dodecyl sulphate
SNP single nucleotide polymorphism
SOLiD Supported Oligo Ligation Detection
SORT1 Sortilin
SV40 Simian virus 40
TBE tris-Borate EDTA
TE tris-EDTA
TEMED N,N,N',N'-Tetramethylethylenediamine
UCSC University of California Santa Cruz
UTR untranslated region
UV Ultraviolet
YY1 yin yang 1

15
Chapter 1
Introduction

16
Chapter 1: Introduction
1.1 Xenobiotic metabolism Xenobiotics are chemicals that are taken up by the body from exogenous sources.
These chemicals are usually lipophilic and therefore chemical modifications are
required to facilitate their removal from the body. Drug metabolising enzymes
(DMEs) modify xenobiotics by bio-transformation. These bio-transformations convert
the xenobiotics into inactive, more polar and more readily excretable metabolites.
Xenobiotic metabolism is divided into two phases; phase I and phase II reactions
(Table 1.1). Phase I reactions bio-transform the xenobiotic in preparation for
downstream phase II reactions by either unmasking or creating a functional group.
Phase II enzymes conjugate the metabolite produced from the phase I reaction with
a more polar chemical of endogenous origin.
Phase I reactions can be separated into three pathways. Two of these pathways
function to unmask existing functional groups by either the use of hydrolytic or
reductive enzymes. The third pathway consists of oxidising enzymes, which add a
new functional group on to the xenobiotic. It is this group of enzymes to which the
Flavin-containing monooxygenases (FMOs) belong.
1.2 Flavin-containing monooxygenases, background The flavin-containing monooxygenases (FMOs) are the second largest family of
phase-1 drug-metabolizing enzymes (DMEs). The enzymes are membrane-bound

17
Phase I enzymes Phase II enzymes
1.Hydrolytic enzymes 1.UDP-glucuronyl transferases
a) Amidases 2.Glutathione transferases
b) Esterases 3.Glycine N-acetyl transferases
c) Epoxide hydrolases 4. Sulfotransferases
2. Reductive enzymes 5. Acetyl CoA transferases
a) Azo reductases
b) Disulfide reductase
c) Aldo-keto reductases
d) Nitro reductases
e) Reductive dehalogenation
3. Oxidative enzymes
a) Flavin-containing monooxygenases
b) Amine oxidases
c) Alcohol and aldehyde dehydrogenases
d) Cytochrome P450 monooxygenases
Table 1.1 Xenobiotic Metabolism The table shows drug metabolising enzymes from the two phases of metabolism. Modified from Schenkman et al 1999.

18
and are located within the endoplasmic reticulum with relative molecular masses of
between 59-63 kDa. The FMOs all contain a flavin-adenine dinucleotide (FAD) group
and are able to catalyze, in the presence of NAPDPH, the oxidation of a wide range
of foreign chemicals including therapeutic drugs, dietary-derived compounds and
pesticides (Cashman and Zhang, 2006; Krueger and Williams, 2005; Ziegler, 1993).
The xenobiotic being metabolized is said to be mono-oxygenated by the FMO
enzyme as only one atom of molecular oxygen is inserted into the molecule within
the xenobiotic (for reviews on this process see Ziegler, 1990; Hines et al., 1994;
Phillips et al.,1995). FMO activity was first discovered in 1964 (Pettit et al., 1964) and
an FMO protein was first purified in 1972 (Ziegler and Mitchell, 1972). The FMO
protein was initially named after the person who isolated it, Daniel Ziegler, and was
known as “Ziegler‟s enzyme”. FMO activity has been observed and tested in human,
rabbit, mouse, rat, dog, sheep and guinea pig. A prokaryotic equivalent of FMO, the
cyclohexanone monooxygenase from Acinetobacter exists. This is described as an
FMO due to its mechanistic similarities (Ryerson et al., 1982). The homology
between mammalian and the prokaryotic form is only 25% (Donoghue et al., 1976).
FMO-like proteins have also been observed in plants within the Arabidopsis species
(Zhao et al., 2001). Some evidence suggests an FMO role in resistance to microbial
pathogens within Arabidopsis (Koch et al., 2006). As the products of FMO
metabolism are generally less toxic or pharmacologically active than the parent
compound these proteins play an important role in detoxification.
1.3 FMO catalytic cycle and substrates
The FMO catalytic cycle is unique to this family of enzymes. The cycle is based on
kinetic and spectral studies with FMO protein purified from pig liver (Poulsen et al.,
19
1979; Beaty and Ballou, 1980; Beaty and Ballou, 1981). The cycle is described
below.
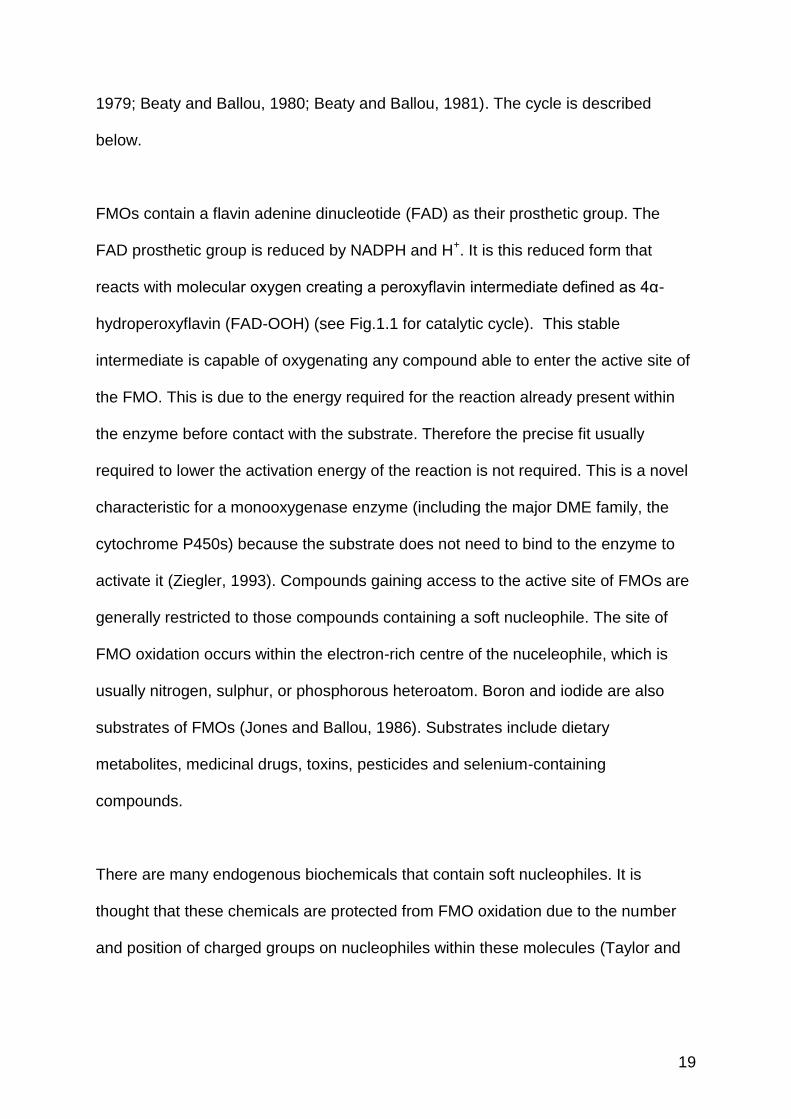
FMOs contain a flavin adenine dinucleotide (FAD) as their prosthetic group. The
FAD prosthetic group is reduced by NADPH and H+. It is this reduced form that
reacts with molecular oxygen creating a peroxyflavin intermediate defined as 4α-
hydroperoxyflavin (FAD-OOH) (see Fig.1.1 for catalytic cycle). This stable
intermediate is capable of oxygenating any compound able to enter the active site of
the FMO. This is due to the energy required for the reaction already present within
the enzyme before contact with the substrate. Therefore the precise fit usually
required to lower the activation energy of the reaction is not required. This is a novel
characteristic for a monooxygenase enzyme (including the major DME family, the
cytochrome P450s) because the substrate does not need to bind to the enzyme to
activate it (Ziegler, 1993). Compounds gaining access to the active site of FMOs are
generally restricted to those compounds containing a soft nucleophile. The site of
FMO oxidation occurs within the electron-rich centre of the nuceleophile, which is
usually nitrogen, sulphur, or phosphorous heteroatom. Boron and iodide are also
substrates of FMOs (Jones and Ballou, 1986). Substrates include dietary
metabolites, medicinal drugs, toxins, pesticides and selenium-containing
compounds.
There are many endogenous biochemicals that contain soft nucleophiles. It is
thought that these chemicals are protected from FMO oxidation due to the number
and position of charged groups on nucleophiles within these molecules (Taylor and

20
Ziegler, 1987). FMOs are able to oxidise monocationic amines or anionic sulphur
compounds where the charge is localised to the sulphur atom. However, if there is
Figure 1.1 Catalytic cycle of FMOs NADPH reduces the flavin group, FAD, to FADH2 (1). Oxygen binds to the reduced enzyme and an internal electron transfer generates the 4α-hydroperoxyflavin form of the enzyme. (2) It is in this state that the substrate contacts FMO1. One atom of oxygen is attached to the substrate to form SO and one atom to form water and the product is released immediately (3). H20 and NADP+ are released (4 and 5). The enzyme is then once again available for the generation of the 4α-hydroperoxyflavin form of the enzyme (Krueger and Williams, 2005).

21
an additional charged group within the molecule the FMO enzyme does not
metabolize it. All essential nucleophiles are dications (polyamines), dipolar ions
(amino acids) or have one or more anionic groups distal to an electron-rich
heteroatom (e.g. biotin). An exception to this is cysteamine which has been observed
as a substrate for FMOs (Duffel et al., 1987). It is for this reason outlined that cellular
nucleophiles are not substrates, and FMOs are able to discriminate between
essential and xenobiotic soft nucleophiles.
There are a few known endogenous substrates of FMO1. As mentioned previously
cystamine can be converted to the disulphide cysteamine by pig liver FMO (Duffel et
al., 1987) and the yeast FMO (Suh and Robertus, 2000). As yet, only two other
endogenous substrates have been identified, cysteine S-conjugates (Elfarra, 1995;
Krause et al., 2003) and methionine (Duescher et al., 1994; Krause et al., 1996).
Both of these are converted to sulphoxides by FMOs. The KM for methionine
sulphoxidation (Elfarra, 1995) suggests that this reaction is only significant when
toxic levels of methionine are present in the diet or in the event of a defect in
methionine metabolism (Regina et al., 1993). Table 1.2 lists some of the known
substrates for FMO1, the isoform that is the subject of this thesis.

22
Compound Site of oxidation Type of compound Reference
MPTP N Neurotoxin (Cashman and Ziegler, 1986)
Nicotine N Stimulant (Park et al., 1993)
Cimetidine S Gastric ulcer drug (Cashman et al., 1995)
Thiobenzamide S Hepatoxicant (Hodgson, 1999b)
Phorate S Pesticide (Hodgson, 1999b)
Ranitidine N/S Gastric/ duodenum ulcer drug (Chung et al., 2000)
Tamoxifen N Anti-cancer drug (Hodgson et al., 2000)
Amphetamine N Behaviour stimulant (Cashman et al., 1999)
Trimethylamine N Dietary derived amine (Lang et al., 1998)
Maclobemide N Monoamine oxidase inhibitor (antidepressant) (Hoskins et al., 2001)
Imipramine N Tricyclic antidepressant (Narimatsu et al., 1999)
Clozapine N Tricyclic antidepressant (Tugnait et al., 1997)
Brompheniramine N Antihistamine (Cashman et al., 1993)
Albendazole S Tapeworm infection drug (Fargetton et al., 1986)
Fonofos P Pesticide (Venkatesh et al., 1991)
Methimazole S Anti-thyroid drug (Kedderis and Rickert, 1985)
Table 1.2 Examples of some FMO1 substrates and their sites of oxidation The first column is the compound metabolized by FMO1. The next column shows the atom that is oxygenated within the molecule by FMO, the third column shows the type of compound the FMO substrate is.

23
1.4 The Flavin-containing monooxygenase family As mentioned previously, FMO activity was first identified in pig liver in 1964.
Subsequently, FMO was identified within liver (Kimura et al., 1983), lung, and
kidney of rat, mouse (Sabourin et al., 1984), rabbit (Tynes et al., 1985),
guinea pig (Yamada et al., 1990), dog (Lattard et al., 2002) and sheep
(Williams et al., 1989; Longin-Sauvageon et al., 1998). Characterization of
FMO protein preparations suggested multiple forms of FMOs. The rate of
dimethylaniline N-oxidation, a reaction carried out by the FMO enzyme, was
shown to be effected differently within different tissues. The addition of Hg2+
and Mg2+ ions increased the rate of reaction using purified FMO from rabbit
lung but decreased the rate of reaction when purified FMO was used from
rabbit liver (Devereux et al., 1977). Further characterisation of the rabbit lung
and liver FMO forms revealed that they are immunologically and catalytically
distinct (Williams et al., 1984). It was later discovered that these proteins were
products of two distinct genes.
Molecular biology techniques were used to isolate FMO cDNAs from various
species by a number of different research groups. As a result of sequence
analysis it was clear that the FMOs could be divided into 5 distinct groups.
These groups corresponded to the different FMO isoforms. These isoforms
were named FMO1, FMO2, FMO3, FMO4 and FMO5 (Lawton et al., 1994).
Pig liver FMO was renamed FMO1 and the rabbit lung isoform was named
FMO2. Each isoform is encoded by a different gene.

24
The FMOs have been well characterised within mice as mouse is an
important model organism for toxicological studies. A mouse liver cDNA
library was screened with the rabbit FMO3 cDNA as the probe. As a result the
mouse FMO3 cDNA was isolated (Falls et al., 1997). The purified FMO3
protein has a molecular weight of 58 kDa (534 amino acids) and has 82%
sequence homology with human FMO3. The mouse FMO2 cDNA was
obtained from an expressed sequence tag (EST) from the IMAGE consortium
(Karoly and Rose, 2001). This cDNA was also expressed within E. coli and
encodes a protein of 61 kDa (535 amino acids) in size and shows 86%
sequence homology with human FMO2. The mouse FMO1 and FMO5 cDNAs
were isolated by screening a mouse liver library with rabbit cDNA sequences
as probes (Cherrington et al., 1998b). Analysis of the cDNA sequences
revealed the FMO1 mouse protein to have a molecular weight of 59.9 kDa
and was 532 amino acids in length. It shares an 83.8% sequence similarity
with human FMO1. The FMO5 protein has a molecular weight of 60 kDa and
was 533 amino acids in length. It shares an 84.1% sequence similarity with
human FMO5.
The human FMO1 cDNA was isolated using a pig FMO1 cDNA probe and
revealed that the human protein is 532 amino acids in length (Dolphin et al.,
1991). The human FMO4 cDNA was also isolated by the same research
group using the newly isolated FMO1 cDNA as a probe (Dolphin et al., 1992).
The paper describes the now classified FMO4 gene as the FMO2 gene. The
genes were renamed at a later date, with numbers being given in order of the
isolation of the purified proteins (Lawton et al., 1994). The isolated cDNA

25
encodes an FMO4 protein of 558 amino acids (Dolphin et al., 1992). The
human FMO3 gene was isolated using three synthetic 36-mer oligonucleotide
probes which were designed from the pig FMO1 nucleic acid sequence.
Analysis of the FMO3 cDNA sequence revealed a protein length of 533 amino
acids (Dolphin et al., 1996). The human FMO2 cDNA was isolated from a
human lung cDNA library using a PCR product from the rabbit FMO2 cDNA
(Dolphin et al., 1998). The identified FMO2 protein was shown to contain a
premature stop codon and contains 64 fewer amino acids compared to the
orthologues of other mammals (Dolphin et al., 1998). When the human FMO2
protein was heterologously expressed, the protein produced was inactive.
This premature stop codon has been shown not to occur in some African and
Hispanic populations (Dolphin et al., 1998; Veeramah et al., 2008). About
28% of individuals of African descent carry at least one copy of the functional
gene (Dolphin et al., 1998, Veeramah et al., 2008). The human FMO5 cDNA
was isolated using the rabbit FMO5 cDNA. The cDNA encodes a protein of
533 amino acids (Overby et al., 1995).
Once isolated, the FMO cDNA clones of the different FMO isoforms were
expressed heterologously in E .coli, yeast or in Sf9 insect cells. This allowed
the substrate for each isoform to be studied. There is a substantial amount of
data comparing substrate specificity of rabbit lung FMO2 and the pig lung
FMO1. It has been shown that FMO2 can oxygenate long aliphatic primary
amines (e.g. n-octylamine) but the FMO1 enzyme cannot (Poulsen et al.,
1986)(Nagata et al., 1990). The FMO1 enzyme metabolizes short side chain
tertiary amines (e.g. imipramine) but the FMO2 enzyme does not.

26
Comparative studies have compared different mouse FMOs using different
pesticide substrates. This study revealed specific and common substrates
between the isoforms (Hodgson, 1999a). For example, the pesticide phorate
is the preferred substrate of FMO1 and the pesticide fonofos is a substrate for
FMO5 (Hodgson, 1999a). Methimazole, a drug used in the treatment of hyper-
thyroidism is oxidised by the FMO isoforms at different efficiencies (Itagaki et
al., 1996). The KM value for the oxidation of methimazole by FMO5 is very
high compared to other isoforms.
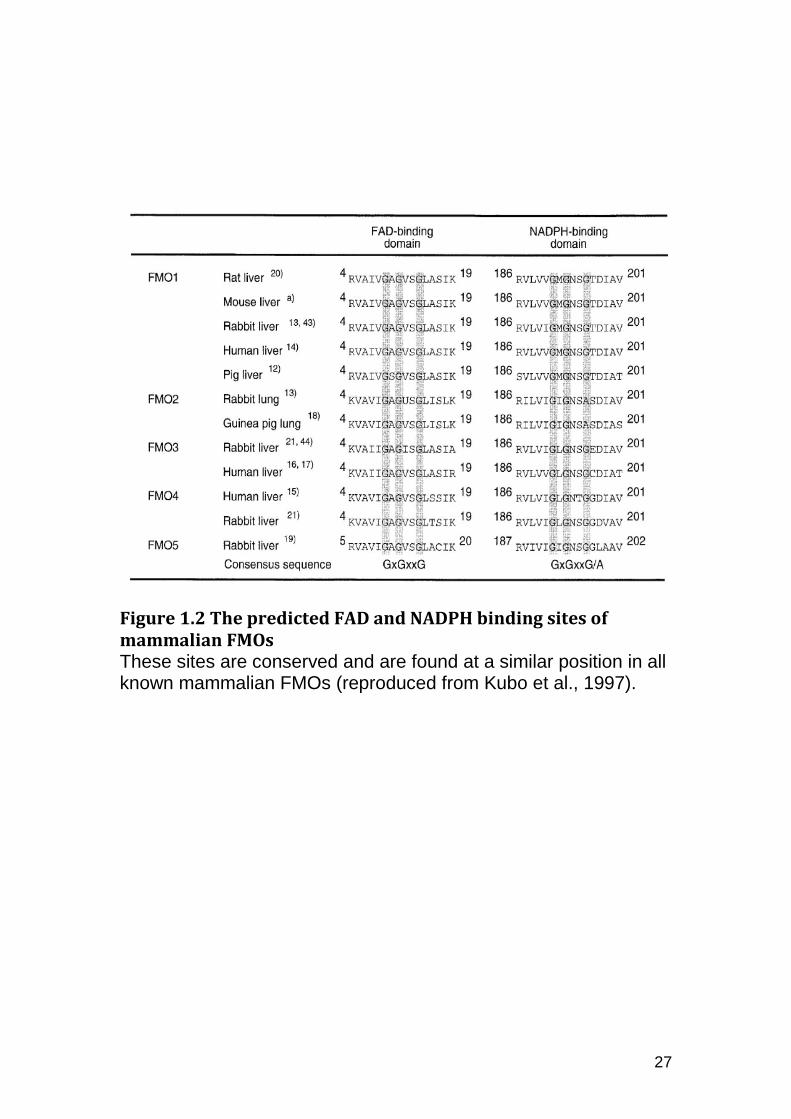
The five functional FMOs share 51-57% amino acid sequence homology and
>80% similarity exists between the orthologous mammalian isoforms. The
conserved functional domains within the protein sequence include two
GXGXXG motifs which are proposed to be binding sites for FAD (amino acids
9-14) and NADP (amino acids 191-206) (Fig.1.2). These domains are present
in the five functional FMOs. The three glycine residues in the proposed FAD
binding site were mutated independently in the rat FMO1 protein. The mutant
proteins were expressed within yeast. This experiment revealed that all three
glycines are required for a catalytically active FMO (Kubo et al., 1997).
The FAD binding site is within a fingerprint sequence which predicts a βαβ
secondary structure known as a Rossman fold. This fingerprint sequence is
predicted to be involved in the binding of di-nucleotides (Wierenga, 1985). A
hydrophobic motif is conserved through the functional FMOs (F (A/T) TGY)
centred around residue 330. The conservation of these residues is illustrated
within Fig. 1.2. As yet no mammalian structure exists for any of the functional
FMOs. However a structure exists for the yeast Schizosaccharomyces pombe
27
Figure 1.2 The predicted FAD and NADPH binding sites of mammalian FMOs These sites are conserved and are found at a similar position in all known mammalian FMOs (reproduced from Kubo et al., 1997).

28
(Eswaramoorthy et al., 2006). This FMO is cytosolic and lacks an extra 85
residues from the mammalian FMOs at the C-terminus. It is thought this
protein plays a role in regulating the thiol/disulfide ratios in the cell (Suh et al.,
1999). Deletion of the enzyme within yeast reduces proper folding of
endogenous carboxypeptidase Y by about 40%.
1.4.1 Human FMO chromosomal locations FMO1- FMO4 genes were localised to a cluster spread out over a region of
245kb along the long arm of chromosome 1(1q24.3) (Shephard et al.,
1993)(Phillips et al., 1995). FMO5 was mapped closer to the centromere in
the region 1q21 (McCombie et al., 1996). The order and position of the FMO
genes were determined experimentally which was in agreement with the order
determined by the human genome project. An additional gene was identified
from the human genome project data and named FMO6P
(http://www.sanger.ac.uk/UGP/Chr1/). Later Hines et al showed that FMO6P
probably encodes a pseudogene as full-length transcripts were not identified
(Hines et al., 2002). A second cluster of 5 FMO genes was identified from the
human genome data (http://www.sanger.ac.uk/UGP/Chr1/) but all have shown
to be pseudogenes (FMO7P-FMO11P) (Hernandez et al., 2004).
The five functional FMOs, through phylogenetic analysis, have been shown to
have evolved around 210-275 million years ago through several gene
duplications of an ancestral gene (Hernandez et al., 2004). This pre-dates the
evolution of mammals and therefore it is predicted that all mammals possess
the five functional FMOs.

29
An endogenous role for FMOs has yet to be fully determined, however, a few
endogenous substrates exist as discussed earlier. Two mouse knockout lines
recently developed by our laboratory, (Fmo1 (-/-), Fmo2 (-/-), Fmo4 (-/-) and
Fmo5 (-/-), show evidence for a role for FMOs in energy homeostasis. The
Fmo1 (-/-), Fmo2 (-/-), Fmo4 (-/-) mice are as healthy as their age matched
wild-types but have a significantly lower weight (Veeravalli et al., 2010).
Histology of white adipose tissue has also shown reduced storage of fat
(Veeravalli et al., 2010).This is a consequence of enhanced whole-body
energy expenditure, due mostly to increased resting energy expenditure,
attributed, partly, to increased fatty acid β-oxidation in skeletal muscle. The
knockout mice have an increased capacity for exercise, with no evidence for
an increase in adaptive thermogenesis (Veeravalli et al., 2010).
1.5 Contribution of FMOs to xenobiotic metabolism
Before the discovery of the FMO family of drug-metabolising enzymes,
oxygen and NADPH-dependent microsomal oxidations were attributed to the
cytochrome P450 (CYP) family of monooxygenases. This is the largest family
of drug metabolizing enzymes in humans containing over 50 isoforms
(Danielson, 2002). Like the FMOs the CYPs catalyse the oxidation of
xenobiotics and chemicals. In addition endogenous roles have been defined
for many of the CYP enzymes, e.g. the metabolism of steroids (Danielson,
2002). There exists an overlap between some FMO and cytochrome P450
substrates. There are a number of substrates that can be oxidised by both the
FMOs and cytochrome P450s. For example, within the mouse liver
thioridizane which is an anti-psychotic drug is oxidised at two sulphur atoms
30
by CYP or oxidised at a nitrogen atom by FMO (Blake et al., 1995).
Tamoxifen, an estrogen receptor inhibitor, used in the treatment of mammary
cancer has shown to be metabolized to its N-oxide form by FMOs and is
metabolized to other metabolites by CYP (Mani et al., 1993).
There are cases where both CYPs and FMOs monooxygenate a substrate to
produce the same product. Thiobenzamide, which is a liver toxicant, is
oxygenated by both families and the contribution ratio of this compound was
1:1 to 1:4 in the mouse liver and 1:2 in the rat liver and 2:3 in the rat lung
(Tynes and Hodgson, 1983).
The relative contribution of each family to the metabolism of a substrate can
be determined by selectively inhibiting the activity of either FMOs or CYPs.
There are no known chemical inhibitors for FMOs, but their activity can be
knocked down by heating, whereas CYPs are more thermally stable
(Cashman, 2008; Shephard and Phillips, 2010). There are several CYP
inhibitors but all microsomal CYP activity can be inhibited by knocking out the
activity of NADPH-dependent cytochrome P450 reductase with an antibody to
this protein. FMO activity can be inferred by monitoring activity in the
presence and absence of the FMO substrate methimazole (Kedderis and
Rickert, 1985).
MPTP is metabolized in the mitochondria by monoamine oxidase type B. One
of the products of this reaction is a neurotoxin, the MPP+ (1-methyl-4-
phenylpyridinium) ion. MPP+ induces the degeneration of dopaminergic

31
neurons and causes Parkinson‟s disease-like symptoms in humans and
monkeys (Langston and Irwin, 1986)(Tipton and Singer, 1993). MPTP is
detoxified in the liver by MTP N-oxide, by FMOs (Tipton and Singer, 1993)
and to 4-phenyl-1, 2, 3, 6 tetrahydropyridine (PTP) by CYPs (Weissman et al.,
1985). Before the MPTP drug was administered, mice were treated with an
FMO substrate. This caused an increased level of MPP+ in the mouse brain
(Chiba et al., 1988) and a reduction of dopamine in the brain (Chiba et al.,
1990). This suggests FMOs play an important role in MPTP detoxification.
MPTP metabolism has been studied with the house musk shrew due to the
low level of FMO1 expression within this model organism (Mushiroda et al.,
2000b). In contrast the house musk shrew contains a high expression of CYP
enzymes. Brain homogenates from rat and Suncus were both able to produce
the MPP+ toxin. However, only the MPTP N-oxide was detected within rat
brain homogenates. Interestingly the administration of MPTP results in the
accumulation of MPP+ toxins within the Suncus brain and not in the rat brain
(Mushiroda et al., 2001). It is hypothesised that FMO expression in the small
microvessels of the rat brain allows the detoxification of the MPTP toxin,
preventing its entry to the brain by its conversion to the N-oxide.
An FMO and CYP substrate called Ranitidine is a drug used to treat gastric
ulcers and Zollinger Ellison Syndrome (Zeldis et al., 1983). The drug can be
metabolized to its N-or S-oxide or to desmethylrantidine. By competitively
inhibiting FMOs with methimazole it was shown that FMOs are responsible for
93% of the N- or S oxidations (Zeldis et al., 1983). By using a specific CYP

32
inhibitor, SKF525A, it was shown that CYPs are responsible for all of the
desmethylations (Zeldis et al., 1983).
FMOs exclusively carry out the N-oxidation of the dietary derived tertiary
amine trimethylamine (TMA) (Lang et al., 1998). An inability to process this
compound results in the disorder trimethylaminuria (Humbert et al., 1970).
Recently mice lacking FMOs have shown adverse effects to the drug
imipramine. An Fmo1 (-/-), Fmo2 (-/-), Fmo4 (-/-) mouse line was produced by
using chromosomal engineering and Cre-loxP technology (Hernandez et al.,
2009). Imipramine has four major metabolites, three produced by
cytochromes P450 and one, imipramine N-oxide, solely by FMO1. When
treated with imipramine, wild-type mice became sedated and produced
imipramine N-oxide in the brain and other tissues. In contrast, knockout mice
did not produce imipramine N-oxide, but showed exaggerated
pharmacological behavioural responses, such as tremor and body spasm,
and had a higher concentration of the parent compound imipramine in the
serum and kidney and there was an increase in desipramine in the brain
(Hernandez et al., 2009). The absence of FMO1-mediated N-oxidation of
imipramine shows enhanced central nervous system effects of the drug.

33
1.6 FMO1 chemical regulation It was shown by Ziegler et al. that the short amine n-octylamine can increase
the rate of oxidation of dimethylaniline by pig FMO1 (Ziegler et al., 1971).
However, n-octylamine is not a substrate for FMO1 (Nagata et al., 1990). It
was proposed that FMO possesses distinct catalytic and regulatory sites
(Ziegler et al., 1971).
Indole-3-carbinol is a breakdown product of gucobrassin which is a
component of cruciferous vegetables (McDanell et al., 1988). The compound
has been shown to inhibit the expression of the FMO1 protein by 75-90% in
the rat liver (Katchamart et al., 2000). This compound is not however able to
inhibit FMO1 expression within the guinea pig, mouse and the rabbit
(Katchamart and Williams, 2001). The effect of nitric oxide on FMO1 was
investigated within the rat. FMO1 mRNA levels were decreased to 33% of
control levels when nitric oxide was over produced in the rat liver (Park et al.,
1999). Within rat also, the FMO1 protein was shown to be induced by a
polycyclic aromatic hydrocarbon, 3-methylcholanthrene (3MC). FMO1 mRNA
level was induced by 3.5 fold and the catalytic activity was induced by 2.9 fold
by 3MC (Chung et al., 1997).
1.7 Mechanisms of gene regulation The regulation of human gene expression is a highly coordinated, complex
and critical process. Gene regulation determines the biological variability seen
between different cell types, different developmental states, and

34
environmental reactions. A region of DNA crucial for gene expression is the
promoter region. In protein-coding genes these regions are located upstream
of the transcriptional start site. They consist of a core promoter where the
RNA polymerase II and its co-factors bind forming the pre-initiation complex.
This sequence is usually about 50 bp in size. The further sequence upstream
is defined as the extended promoter region. Transcription factors will bind
within these regions. This region is where factors may bind which allow
temporal and spatial transcription of the gene. These factors interact with the
RNA initiation complex to enhance or reduce the amount of transcription. This
region semantically can be defined as the promoter, however regulatory
sequence which affects transcription have been shown to occur megabases
away from the transcriptional start site or occur downstream of the
transcriptional start site and in general are defined as enhancers. Enhancers
can be affected by further binding factors called insulators which bind
between the enhancer and the promoter preventing their interaction.
Insulators can prevent the binding of enhancers to neighbouring genes or to
the native loci.
Epigenetics plays a large role in the regulation of genes. Epigenetics
describes the modifications to the DNA in structure and chemistry.
Methylation and acetylation of DNA, can switch genes on and off by
preventing the binding of a regulatory factor or preventing that region of DNA
to be structurally modified to allow regulatory factors to bind. For example the
IGF2 gene is regulated differentially depending on the methylation state of an
insulator (Sasaki et al., 2000). Insulators can act differently depending on

35
which parental allele is inherited through a phenomenon known as genomic
imprinting. Due to methylation of the DNA the insulator is no longer able to
bind. The paternal IGF2 allele is methylated and prevents the binding of the
insulating factor CTCF whereas the mother‟s IGF2 allele is unmethylated and
the CTCF factor can bind. This results in only the paternal allele being active
(Giannoukakis et al., 1993).
A project was begun in 2004, as a collective effort of many laboratories, to
identify the functional elements in 1% of the human genome (The ENCODE
Project Consortium 2004). Transcriptional start sites and promoter regions
were predicted for the 900 genes found within this resource. Promoter
sequences were cloned into a reporter plasmid and tested for their ability to
drive transcription within the environment of 16 different cell lines. Using
correlative data comparing RNA expression and promoter activity, the
contribution of the promoter to overall transcriptional activity was predicted for
the 900 genes. It is predicted from the data that promoter regions defined as
between -300 to -50 upstream of the transcriptional start site contributes to
28% of the variability seen in RNA expression (Cooper et al., 2006). This
shows that the promoter region plays an important role in overall expression
of the gene but also that enhancer elements outside of this region contribute
to RNA expression. Extended sequence of up to 1000 bp of the transcriptional
start sites were tested for 45 genes. These extended regions were shown to
contain negative regulatory elements in 55% of the genes studied (Cooper et
al., 2006). Fig.1.3 summarises different regulatory elements that interact with
the core promoter.

36
Figure 1.3 Illustration of methods of gene regulation within the cell (A) Different types of regulatory factors illustrated positionally to the binding of RNA polymerase II and cofactors. RNA pol II and cofactors represent the core promoter. Upstream of this region, further transcription factor binding sites are present within a region defined as the extended promoter. Upstream of the promoter, further regulatory factors are present which enhance or reduce transcriptional activity. Insulators can bind to prevent the effect of enhancers. (B) Illustration of how enhancers might activate transcription and (C) the ability of insulators to block enhancer activity. The black bars represent alterations in the methylation state of the DNA altering DNA structure and allowing insulator binding.

37
1.8 Chromosomal localisation and structure of the human and mouse FMO1 genes The human FMO1 gene is 37.5 kb long and the mouse Fmo1 gene is 37.5 kb
and in both species the gene has 8 coding exons (2-9) and 2 non-coding
exons (0 and 1). Translation initiation occurs within exon 2 at a weak Kozak
consensus sequence. Transcription starts at promoter sites located within
intron 1, or upstream of exons 0 or 1. The choice of promoter is tissue-
specific. In the human, it has been discovered that transcription only begins in
the foetal liver from the beginning of exon 0 from a promoter designated P0
(Shephard et al., 2007), and the mRNA is produced by a splicing event from
exon 0 to exon 2 (Fig.1.4) (Hernandez et al., 2004). In the kidney,
transcription also begins from P0 and the kidney mRNA is also spliced in the
same way (Fig.1.4). In addition to this promoter, in the kidney the FMO1
mRNA is transcribed from a promoter designated P2, located just upstream of
exon 2 in an intronic sequence (see Fig.1.4) (Shephard et al., 2007). A cDNA
that encodes a full-length protein has been found that has a transcriptional
start site at the beginning of exon 1. This cDNA was found in the human small
intestine (accession no. AK097039). The method of oligo-capping was used to
isolate the cDNA. The P1 transcript is therefore predicted to be full length (Ota
et al., 2004). This promoter has been designated P1 (see Fig.1.4). The mRNA
is formed by a splicing event from the sequences derived from exon 1 to exon
2 (see Fig.1.4). Alternative promoters in the FMO1 gene do not result in
variations in protein sequence as exon 0 and 1 are non-coding exons.

38
Figure 1.4 The 5′FMO1 gene region of (A) human and (B) mouse The illustrations show the two non-coding exons 0 and 1 that are present in both mouse and human. The translation of the FMO1 protein occurs within and near the start of exon 2. The human and mouse both produce transcripts from the start of the non-coding exon 0 and 1. These transcripts are spliced as shown in the illustration. The P0 transcript is spliced from exon 0 to exon 2. The P1 transcript is spliced from exon 1 to exon 2. A third transcript which starts intronically from exon 2, defined as P2, has been observed in both human and mouse. Each of the transcriptional start sites are depicted in the above figure by P0, P1 or P2.

39
Inter-individual variation in the amount of FMO1 protein has been shown to be
high. Within the foetal liver, variation is between 10-20 fold depending on
gestational age (Koukouritaki et al., 2002). In the kidney, variation has been
reported to be less than 4-fold (Krause et al., 2003), or less than 5-fold
(Hamman et al., 2000). In the small intestine variation has been reported to be
up to 5-fold (Yeung et al., 2000). As FMO1 is rarely inducible by exogenous
agents it is highly likely these variations in amount of protein are manifested
by genetic polymorphism. By locating these polymorphisms, the function and
impact of this enzyme in humans for drug metabolism can be assessed.
Analysis of available mouse liver cDNA clones found within the NCBI
database identified (D16215, BC011229, BF532824, AI115B9, AA245076,
AI255718, AA238774 and BI247068) show different lengths of cDNA, but
each contain exon 0. Therefore all the cDNAs isolated from the liver are the
P0 transcript. There are five available kidney cDNA clones. Three of these
cDNA clones have 5′UTR sequences derived from the 3′-end of intron 1 and
exon 2. RT–PCR and sequence analysis of the amplified products confirmed
that, in kidney, transcription can occur from within intron 1, from a promoter
designated P2 (Shephard et al., 2007). Two other cDNA clones, AI118998
and CB955318 are the products of a splicing event between exon 2 and a
novel exon 1. Figure 4 show the production of the alternatively spliced
transcripts seen in mouse and human.

40
1.9 FMO1 expression
In 1971 Daniel Ziegler isolated and identified a novel mixed-function oxidase
which metabolized nitrogen- and sulphur- containing compounds. The
enzyme is therefore sometimes referred to as Ziegler‟s enzyme (Ziegler et al.,
1971). As described above, a cDNA for the mixed function oxidase was
isolated in 1991 (Dolphin et al., 1991) and was mapped to the long arm of
chromosome 1 (Shephard et al., 1993) which encodes a protein with 532
amino acid residues and a molecular weight of 60 Kda. The protein was
classified as FMO1 in 1993 (Lawton et al., 1994). In the human foetal liver
FMO1 is expressed but is switched off shortly after birth and is not expressed
in the adult (Koukouritaki et al., 2002). Currently it is not known what causes
the silencing of the FMO1 gene in human adult liver. There is evidence from
transfection studies of HepG2 cells that repetitive elements specific to the
human just upstream of the liver core promoter repress transcription from P0
in the foetal liver (Shephard et al., 2007). It is thought that continuation of
expression in adult extra-hepatic tissues can be explained by the use of the
alternative promoters found for kidney and small intestine. Table 1.3
summarises the amounts of FMO1 RNA or protein detected in different
tissues.
FMO1 is also expressed in mouse and rabbit foetal liver (Dolphin et al., 1996).
The expression of FMO1 in the foetus suggests a possible role for FMO1 in
the metabolism of xenobiotics that the foetus is exposed to via the placenta.
The FMO1 enzyme may also have an endogenous role within the foetus.
41
In all other mammals including mouse, rat, dog, pig and rabbit, FMO1 remains
expressed in the adult liver (Cherrington et al., 1998a; Gasser et al., 1990;
Lattard et al., 2002; Lawton et al., 1990; Stevens et al., 2003). The main site
of expression of FMO1 in the adult human is the kidney (Dolphin et al., 1991;
Dolphin et al., 1996; Phillips et al., 1995; Yeung et al., 2000). In the adult
human kidney expression levels are not much lower than the major hepatic
cytochrome P450 (CYP450) CYP3A4 (see table 1.3 for amount of expression)
(Shimada et al., 1994) and greater than the total content of CYP450s in the
kidney (Jakobsson and Cintig, 1973). It is therefore likely FMO1 plays a major
role in renal drug metabolism within the human. The human FMO1 gene is
also expressed, but to a lesser extent, in the small intestine (see table 1.3)
(Yeung et al., 2000). In addition to the kidney and small intestine, EST profiles
have shown FMO1 to be expressed in heart, pineal gland, lymph node,
mammary gland, pharynx, placenta, testis, pancreas, thymus, thyroid, medulla
and muscle. EST profiles have also shown FMO1 expression to significantly
decrease in tumours. The expression of FMO1 in numerous extra-hepatic
tissues suggests a possible further as yet unknown endogenous role for this
protein.
Mouse Fmo1 has been localised in different cell types using antisense RNA
probes specific to FMO1 (Janmohamed et al., 2004). Within the liver, FMO1
was localised to the perivenous region. In kidney it was localised to the
proximal and distal tubules as well as the glomerulus. In lung it was localised
to the terminal bronchiote and the alveoli and within the brain it is localised to
the neurons of the cerebellum and the choroid plexus. EST profiles within the

42
mouse show Fmo1 expression in the kidney, embryonic and mammary
tissues, brain, lung, heart, ovaries, testis, foetal kidney and liver.
Tissue RNA molecules per cell
Protein (pmol/mg) Reference
Foetal Liver 945.7 (Zhang and Cashman, 2006)
Adult Liver 96 (Zhang and Cashman, 2006)
Adult Kidney 6198.2 (Zhang and Cashman, 2006)
Adult Lung 595.7 (Zhang and Cashman, 2006)
Adult Small Intestine 522.9
(Zhang and Cashman, 2006)
Adult Liver <1 (Yeung et al., 2000)
Adult Kidney 47±9 (Yeung et al., 2000)
Adult Small Intestine 2.9±1.9 (Yeung et al., 2000)
Foetal liver 14.4±3.5 (Koukouritaki et al., 2002)
Foetal liver <15weeks 7.8±5.3
(Koukouritaki et al., 2002)
Foetal liver 15W≤26W 3.8±2.6
(Koukouritaki et al., 2002)
Foetal liver 26W≤3days 2.0±1.8
(Koukouritaki et al., 2002)
Foetal liver >3 days 0.1±0.3
(Koukouritaki et al., 2002)
Table 1.3 Expression levels of FMO1 mRNA or protein measured in different human tissues The left column identifies the tissue being analysed. The second and third column give RNA and protein quantification respectively and with standard deviations.

43
1.10 Alternatively spliced, non-coding exons and their function The use of alternative splicing by mammalian genes allows for the expansion
of transcript and protein diversity. A variety of mRNAs can be produced from a
single gene to produce proteins of diverse function (Pajares et al., 2007). A
number of genes display complex gene regulation due to the use of
alternative promoters, which in turn produce alternative transcripts (Landry et
al., 2003). Genome-wide analysis indicate that >60% of human genes use
alternative splicing (Baek et al., 2007; Sun et al., 2006; Takeda et al., 2007;
Kimura et al., 2006; Cooper et al., 2006). It is predicted that between 30-50%
of human genes have multiple promoters (Cooper et al., 2006). ENCODE
regions which are characterised promoters (representing 1% of the human
genome) were analysed in 16 diverse cell lines using transient transfection
reporter assays. That study identified more than 20% of genes as having
functional alternative promoters (Birney et al., 2007). An independent study
found that 35% of 100 erythroid genes examined had evidence of alternative
first exons and promoters in humans (Tan et al., 2006). These studies indicate
the common existence of alternative promoters in mammalian genomes.
Although alternative promoters are common, the functional significance and
their role in disease has been minimally explored, with the exception of a few
genes e.g. TP53, tumor protein p53; LEF1, lymphoid enhancer-binding factor
1; GNAS, guanine nucleotide binding protein (Murray-Zmijewski et al., 2006).
Alternative promoter usage allows for the diversification of gene regulation.
Separate promoters allow for tissue- , developmental-, cell-, and lineage-
specific regulation. For example the EIF1AX (eukaryotic translation initiation
factor I, X linked) and HBG1 (haemoglobin, g A) genes both contain a TATA-

44
box promoter and a TATA-less promoter. The TATA box promoter is used
during and after embryonic development (Davis and Schultz, 2000; Duan et
al., 2002). This allows for developmental-specific factors to regulate the gene
at the desired level between the different developmental states. This
regulation can be very complex, for example the NRG1 gene contains 9
alternative promoters (Steinthorsdottir et al., 2004). NRG1 is tightly regulated
during neuronal differentiation and the different promoters, which consist of
non-coding and coding alterations, are believed to regulate spatio and
temporal expression (Steinthorsdottir et al., 2004). Modifications of this
regulation have been linked to cancer and schizophrenia (Tan et al., 2007).
The FMO1 gene is in the category of genes that use multiple promoters that
do not change the overall protein sequence. The transcripts contain different
5′ regions due to alternative splicing of non-coding exons (Fig.1.4). The FMO1
gene has three alternative promoters P0, P1 and P2 which are regulated
tissue-specifically and developmentally. Alternative promoters which alter the
5′ region of the transcript have been shown to alter the translational efficiency
of the protein. The mRNA for the gene RUNX1 which is initiated from the
proximal promoter has a long 5′UTR which contains an internal ribosomal
entry site (Levanon and Groner, 2004). This internal ribosome site mediates
cap-independent translation (Pozner et al., 2000). OTX2 (orthodenticle
homeobox 2) which is associated with medulloblastoma brain tumor, like
FMO1 is transcribed from three alternative promoters which produce identical
proteins (Courtois et al., 2003). The sequence characteristics within 5′ UTRs,
which can contain upstream translation initiation codons (AUGs), upstream

45
open reading frames (ORFs), secondary structure and internal ribosomal
entry sites) play important roles in differential regulation of translation
efficiency.
1.11 FMO1 Genetic Variation The genomic reference sequence used in this thesis is NT_004487.19. The
cDNA reference sequence used to describe protein-coding variation in this
thesis is NM_002021.1. The Adenine base of the methionine initiation codon
is defined as +1. The FMO1 transcripts have been reported to start from
different locations. I am therefore reporting SNPs in untranslated regions from
the adenine base of the methionine initiation codon for ease of comparison.
1.11.1 Protein coding region variation Sequencing of the FMO1 gene in 50 unrelated individuals of African American
descent identified four non-synonymous single nucleotide polymorphisms.
The dbSNP reference number is given followed by the nucleotide and protein
position relative to the reference sequence.
rs56841822
NM_002021.1: c.291C>G
NP_002012.1: p. (His97Gln)
rs1684314
NM_002021.1: 907A>G
NP_002012.1: p. (Leu303Val),

46
rs28360418
NM_002021.1: 908T>C
NP_002012.1: p. (Leu303Thr)
rs606390545
NM_002021.1: g.1504C>T
NP_002012.1: p. (Arg502X)
(Fig.1.5) (Furnes et al., 2003). These are all rare variations except for
Ile303Val. This is found within African American populations and more
specifically the Yoruba population of Nigeria at a frequency of 10-15%. This
variant has so far not been found in Asians and Europeans. For each of these
protein-coding variants catalytic activity has been assessed using a
heterologous expression system. The four substrates tested were
methimazole, imipramine, fenthion, and methyl p-tolyl sulphide (Furnes and
Schlenk, 2004). Three of the variants His97Gln, Ile303Thr, and Ile303Val had
no significant effect on enzyme activity. Arg502X which causes a premature
stop codon resulting in 31 residues missing from the FMO1 protein had
variable effect on enzyme activity. On imipramine, fenthion and methyl p-tolyl
sulphide there were only modest affects. Towards methimazole the variant
was completely inactive. This study shows protein coding SNPs in FMO1 may
have a substrate specific affect on enzyme activity. The Arg502X variant is
very rare and would therefore have little or no effect on the general
population. An additional SNP is reported within dbSNP126 classified as
rs16864310. There is currently no functional data on this SNP. Its prevalence

47
so far has been shown to be limited to a Chinese population and has only a
frequency of 2% within this population and is therefore unlikely to have an
effect on the general population.
There are three synonymous variants,
rs742350
NM_002021.1:c.746C>T
NP_002012.1: p. (Thr249Thr)
rs1126692
NM_002021.1:c.1187A>G
NP_002012.1: p. (Val396Val)
rs28360432
NM_002021.1:c.1400A>G
NP_002012.1: p. (P467P)
(See Fig.1.5) (Furnes et al., 2003), within FMO1 which have not been
analysed for any possible effect on RNA secondary structure or splicing rates
and efficiency.

48
Figure 1.5 The FMO1 gene and the location of protein coding SNPs The figure shows the position of the SNP relative to the amino acid position. If there is a non-synonymous change the amino acid substitution is shown, reproduced from Phillips and Shephard, 2008.

49
1.11.2 Untranslated mRNA Variants There are four verified SNPs within the 3′ untranslated region of the FMO1
mRNA: +27590G>A (dbSNP126, rs28360435), +27578 G>A (dbSNP126,
rs28360434), +27568C>T (dbSNP126, rs12954) and +27664C>T
(dbSNP126, rs7877) (Hines et al., 2003). The SNP rs12954 has been verified
by eight sequencing panels. Hardy Weinberg estimates of genotype
frequencies suggest selection against the T/T genotype. This SNP and
+27664C>T has also been associated with amyotrophic lateral sclerosis as
discussed later.
1.11.3 Promoter Variants There is a large amount of variation upstream of the FMO1 transcriptional
start sites (see chapter 5) which may influence the amount of transcript
produced. Due to the 10-20 fold observed variation between individuals in the
amount of FMO1, this is a strong hypothesis. This variation is also likely to be
due to genetic polymorphism as FMO1 expression has been shown not to be
greatly affected by foreign chemicals as is the case for the CYP genes.
To date there has been limited analysis of polymorphisms within sequences
upstream of the FMO1 transcriptional start sites. The largest sequencing
study was undertaken by Hines and co-workers. They sequenced and
analysed FMO1 regions in 177 individuals who collectively represented a
diverse population of individuals including Northern Europeans, Africans, and
East and South Asians (Hines et al., 2003). Regions flanking the P0 promoter,
exons 0, 2, 9 and short flanking intronic sequences were examined for SNPs.

50
Four SNPs were identified upstream of P0 (g.-10361T>A, dbSNP126, g.-
10330C>T, g.-10046A>G and g.-9782C>A) but none were found to be within
previously defined regulatory regions (Luo and Hines, 2001). A polymorphism
within exon 0 (-9536C>A relative to the ATG translation start site) lies within a
conserved core binding sequence for the yin yang 1 (YY1) transcription factor.
Electrophoretic mobility shift assays (EMSAs) using HepG2 cellular extracts
demonstrated that the C>A transversion eliminates YY1 binding (Hines et al.,
2003). However this transversion also increased the affinity for this sequence
to bind to other regulatory factors Oct1, HNF1α and HNF1β indicating a
complex mechanism of gene regulation. Transfection of HepG2 cells with
reporter constructs under the control of either the -9536C or -9536A alleles
showed no difference in the activity of the minimal promoter (Hines et al.,
2003). An extended construct caused a 2-3 fold loss of reporter gene activity
expression only when the -9536A variation was present.
There is a distinct question mark over these results as FMO1 expression data
of two human foetal livers homozygous for the -9536G>A variant showed
expression of FMO1 in the upper quartile range within their age bracket. This
result contradicts the reporter gene data that suggested that this variant
reduces FMO1 expression (Koukouritaki et al., 2002). Further analysis is
needed to elucidate the role of other transcription factors, which may bind to
this region and compensate for the loss of expression as a consequence of
YY1 binding.

51
Two SNPs, -11T>C and +17248T>C are located within splice acceptor sites
(Hines et al., 2003). However, it is unlikely they affect splicing of the FMO1
transcript and subsequently the amount of protein as both SNPs are
pyrimidine to pyrimidine changes. SNPs within the P1 and P2 promoters have
yet to be defined and this aspect forms part of this thesis (Chapter 4). Defining
of these promoters will allow the testing of polymorphism identified upstream
of the P1 and P2 transcriptional start sites for their influence on gene
expression.
1.12 FMO1 in drug metabolism FMO1 metabolizes a number of therapeutic drugs (Krueger and Williams,
2005). These are generally nitrogen or sulphur (see Table 1.4) containing
compounds and are used as treatments for a wide range different diseases
and disorders including breast cancer (FMO1 metabolizes tamoxifen) and
tuberculosis (FMO1 metabolizes thiacetazone). FMO1 substrates are, in
general, also metabolized by members of the cytochrome P450 family of
DMEs.
The metabolites of the two enzyme systems (the FMOs and the CYP450s)
can be quite different e.g. tamoxifen metabolism CYP3A4 produces a toxic
metabolite whereas FMO1 produces the N-oxide, which is considered to be a
detoxification pathway (Parte and Kupfer, 2005). The FMO1 metabolite is also
capable of being reduced back to tamoxifen by CYP3A4 (Parte and Kupfer,
2005). The role of FMOs and CYPs in the metabolism of the same drug and

52
the retro-reduction of FMO products is discussed in a recent review
(Shephard and Phillips, 2010).
Knockout mice that are null for the Fmo1 gene show extreme adverse affects
towards the drug imipramine, which was not seen in age-matched wild type
mice (Hernandez et al., 2009). The drug is also a substrate for various CYPs.
The knockout mice produce no imipramine N-oxide (a product only of FMO1).
The adverse affects of the drug, in the absence of FMO1, show that the
protein is required for the detoxification of this drug in vivo. This study also
provides evidence for a more important role for FMO1 in the metabolism of
imipramine than was previously thought. To understand an individual‟s
response to a specific drug a good understanding of the contribution of both
the FMO and CYP systems is required as well as the other enzymes that may
be involved in the detoxification (or activation) of a drug.

53
Compound Type Health condition Oxidation site Reference
Benzydamine Nonsteroidal antiinflammatory N (Lang and Rettie, 2000), (Stormer et al., 2000)
Chlorpromazine Dopamine D2 antagonist Psychosis N (Kim and Ziegler, 2000)
Deprenyl Monoamine oxidase type B inhibitor Parkinson‟s disease N (Szoko et al., 2004)
Imipramine 5HT/noradrenalin re-uptake inhibitor Antidepressant N (Kim and Ziegler, 2000)
Itopride Dopamine D2 antagonist Gastroprokinetic N (Mushiroda et al., 2000a)
Methamphetamine Psychostimulant N (Szoko et al., 2004) N-deacetyl ketoconazole* Antifungal agent N (Rodriguez and Miranda, 2000)
Olopatadine Antihistamine N (Kajita et al., 2002)
Orphenadrine Anticholinergic Parkinson‟s disease N (Kim and Ziegler, 2000)
SNI-2011 Muscarinic receptor agonist Sjogren's Syndrome N (Washio et al., 2003)
Tamoxifen Estrogen receptor modulator Breast Cancer Therapy N (Parte and Kupfer, 2005)
Xanomeline Muscarinic receptor agonist Alzheimer‟s Disease N (Ring et al., 1999)
Ethionamide Antibiotic Tuberculosis S (Krueger and Williams, 2005)
Methimazole Thyroperoxidase inhibitor Hyperthyroidism S (Furnes and Schlenk, 2004)
S-methyl esonarimod* Cytokine production inhibitor Rheumatism S (Ohmi et al., 2003)
Tazarotenic acid** Retinoic acid receptor modulator Acne/Psoriasis S (Attar et al., 2003)
Thiacetazone Antibiotic Tuberculosis S (Qian and Ortiz de Montellano, 2006)
Table 1.4 Drugs metabolized by FMO1 The table above shows the compounds metabolized by FMO1, the type of compound, and the site of oxidation by FMO1.

54
1.13 FMO1 and disease
Gene expression profiling of myocardial tissue from patients with atrial
fibrillation showed a significant increase in FMO1 mRNA (Kim et al., 2003).
Most of the genes up-regulated in this study were involved in oxidative stress.
No SNPs within FMO1 have been associated with this disease. Expression
profiling of spinal cord tissue from patients suffering from sporadic
amyotrophic lateral sclerosis (ALS) showed significant decrease in FMO1
mRNA (Malaspina et al., 2001). An association study was subsequently
carried out on two SNPs within the 3′UTR region of FMO1, +27568C>T
(rs12954) and +27664C>T (rs7877) in a group of sporadic ALS patients and a
control group (Cereda et al., 2006). They were shown to both be over-
represented in female, but not male, ALS patients.
1.14 Expression Profiles There are a number of expression profiles available for mouse and human
FMO1 from a range of microarray data. This resource is available through the
National Centre for Biotechnology Information database
(http://www.ncbi.nlm.nih.gov/GEOprofiles). These profiles give clues to the
regulation of the FMO1 gene and support evidence for an endogenous role for
the protein in energy homeostasis. The GEO profiles where FMO1 expression
changes significantly are illustrated in table 1.5 and 1.6. The fatty acid
palmitate, which is a negative regulator of PGC-1 , represses Fmo1
expression (GDS2648 / 1417429_at / Fmo1 / Mus musculus) (Crunkhorn et
al., 2007). PGC-1 is a transcription co-factor which plays a role in the
55
regulation of reactive oxygen species (ROS) metabolism (Uldry et al., 2006),
thermogenesis, gluconeogenesis, brown adipose differentiation, mitochondrial
biogenesis and fatty acid oxidation (Liang and Ward, 2006). These processes
that are involved in energy homeostasis can be linked to the metabolic
phenotype of the Fmo1 (-/-), 2 (-/-), 4(-/-) knockout mouse observed in our
laboratory.
Expression profiles have also shown that knocking out the transcription factor
HNF4α results in severe down regulation of Fmo1 within mouse embryonic
liver (see GEO profile: GDS1916/1417429_at/FMO1/Mus musculus (Battle et
al., 2006). However, the absence of HNF4 has no effect on Fmo1 expression
in the foetal colon (Garrison et al., 2006). HNF4α and PGC-1α as a cofactor,
regulate genes involved in gluconeogenesis in the liver and pancreas, but not
the small intestine (Puigserver, 2005). Another transcription factor from the
same family as HNF4α, HNF-1α, down regulates Fmo1 in pancreatic β-cells
(see GEO profile: GDS1916/1417429 _at/FMO1/Mus musculus) (Akpinar et
al., 2005). HNF-1α and HNF4α have been linked to type 2 diabetes in the
young (Ellard, 2000). Many other expression profiles show increased Fmo1
expression in differentiated cells. Time course studies of myocyte and
adipocyte differentiation show increased FMO1 mRNA over time. A
microarray study of within 3T3-L1 adipocytes using RNA isolated from mice in
which insulin receptors were knocked out to disable differentiation shows
FMO1 mRNA to be significantly repressed (p<0.003) (Tseng et al., 2005). A
number of other factors involved in cellular differentiation also seem to
regulate Fmo1 within different tissues (see table 1.4 and 1.5).

56
An analysis of the available FMO1 expression data indicates transcription
factor candidates that might regulate the gene and lends further evidence for
a role of the FMO1 protein in regulating energy homeostasis.

57
Geoprofile code Regulatory factor
Role/Function Organism System Reference
GDS1473 / 101911_at/FMO1/Mus musculus HNF1-α Pancreatic beta cell growth, Glucose homeostasis
mouse Pancreatic islets (Akpinar et al., 2005)
GDS1916 / 1417429_at/FMO1/Mus musculus HNF4-α Hepatogenesis, Gluconeogenesis, Glucose homeostasis
mouse Embryonic Liver (Battle et al., 2006)
GDS2854 / 1417429_at / Fmo1 / Mus musculus
MYOD Regulates myogenic differentiation
mouse Embryonic fibroblasts
(Di Padova et al., 2007)
GDS2334 / 1417429_at / Fmo1 / Mus musculus
MYOD Regulates myogenic differentiation
mouse Embryonic fibroblasts
(Cao et al., 2006)
GDS2660 / Msa.63.0_s_at / Fmo1 / Mus musculus
Adipocyte differentiation mouse 3T3-L1 differentiation
(Cheung et al., 2007)
GDS2412 / 1417429_at / Fmo1 / Mus musculus
Myotube differentiation mouse Myotube differentiaion
(Chen et al., 2006)
Table 1.5 GEO profile data which show an increase in Fmo1 expression The GEO profile is shown on the left column. The next column describes the regulatory factor that influences the expression of Fmo1. The third column describes the role of this factor and the next two columns describe the organism system used for the analysis.

58
Geoprofile code Regulating factor
Role/Function Organism System used Reference
GDS1384 / 205666_at / FMO1 / Homo sapiens
v-myb, c-myb transcription factors
Induces apoptosis in tumours
human MCF7 cells (Liu et al., 2006)
GDS1434 / 101991_at / Fmo1 / Mus musculus
P63 transcription factor
Epidermal morphogenesis
mouse 18.5 days skin layer embryo
(Koster et al., 2006)
GDS2184 / 101991_at / Fmo1 / Mus musculus
Runx2 Skeletogenesis mouse Embryo 14.5 days developed
(Hecht et al., 2007)
GDS2629 / 1417429_at / Fmo1 / Mus musculus
Get-1 Epidermal differentiation mouse Embryonic skin (Yu et al., 2006)
GDS2648 / 1417429_at / Fmo1 / Mus musculus
Palmitate Induces apoptosis in the Heart
mouse CDC12 myotubes (Crunkhorn et al., 2007)
GDS2610 / 1417429_at / Fmo1 / Mus musculus
glycerol kinase knock down
GK is at the interface of fat and carbohydrate metabolism
mouse brown adipose (Rahib et al., 2007)
Table 1.6 GEO profiles which show a decrease in human FMO1 or mouse Fmo1 expression The GEO profile is shown on the left column. The next column describes the regulatory factor influencing the expression of the gene. The third column describes the Role of this factor and the next two columns describe the organism system used within the experiment.

59
1.15 How Regulatory polymorphisms and polymorphism influencing splicing cause changes in gene expression Many studies have shown that variation in the expression of genes is
heritable. Expression profiling and genome-wide mapping studies have added
to our knowledge of the extent of variation and its influence. Inter-individual
variation in mRNA amounts can be accounted for in general by differences in
cis-acting elements (such as DNA polymorphism in such an element) and the
binding of trans-acting modulators (transcription factors) to these elements. It
is predicted that 25-35% of inter-individual differences in gene expression are
due to variation in cis-acting elements (Pastinen and Hudson, 2004). A DNA
polymorphism changing a cis-acting element sequence, and as a
consequence the transcript abundance, can be defined as a regulatory
polymorphism. Transcript expression can be changed by a number of different
mechanisms. In general, regulatory polymorphism is found outside the
protein-coding region of the gene, although premature translation stop codons
also influence the amount of mRNA produced (Willing et al., 1996).
Regulatory polymorphism can influence transcription by altering the binding of
RNA polymerase and transcription factors to the DNA, pre-mRNA splicing,
exonic splicing enhancers (ESEs), exon skipping (Gregory et al., 2007),
mRNA stability (Carter et al., 2002; Sheets et al., 1990; Conne et al., 2000; Di
Paola et al., 2002), mRNA trafficking, or induce epigenetic changes (Ober et
al., 2003; Ober et al., 2006). Epigenetic regulatory variation can alter
transcription rates by changing the methylation state of the promoter or
enhancer. Alterations in methylation patterns due to regulatory polymorphism
can alter the imprinting of the gene (Singh et al., 2010). Regulatory

60
polymorphism may also cause disruption of insulator binding (Roberts et al.,
2007).
Regulatory polymorphism has been observed to alter the binding of
transcription factors in a variety of ways. This can be through disruption of a
binding site or modification of a binding site so that the efficiency of protein
binding is altered (Taulan et al., 2007). With the advent of genome wide
association studies a large number of cis-acting regulatory polymorphism are
being shown to be associated with disease. Functional studies on these SNPs
have shown cis-acting regulatory variation to alter transcription factor binding
in novel ways. For example, a genome-wide association study identified a
locus on chromosome 1p13 strongly associated with both plasma low-density
lipoprotein cholesterol (LDL-C) and myocardial infarction (MI) in humans. The
authors showed, through a series of studies in human cohorts and human-
derived hepatocytes, that a common non-coding polymorphism at the 1p13
locus, rs12740374, creates a C/EBP (CCAAT/enhancer binding protein)
transcription factor binding site and alters the hepatic expression of the
SORT1 gene (Musunuru et al., 2010).

61
Figure 1.6 Mechanisms that result in differences in protein expression between individuals The diagram shows the nucleus within the cell. The two chromosomes are depicted. The chromosomes show how different mechanisms can alter the expression of genes. Epigenetic mechanisms including methylation and acetylation as shown in the diagram can lead to changes in mRNA expression. Differential recruitment of transcription factor binding can also lead to differences in mRNA expression. The processing of the transcript (splicing, transport) can also vary between individuals resulting in varied availabilities of transcripts within the cytoplasm for translation. All these factors contribute to the overall variability in protein expression between individuals.
62
1.16 Regulatory polymorphism and splice-site polymorphism observed in drug metabolizing enzyme genes This section outlines a number of regulatory SNPs and SNPs that influence
splicing that have been identified in some important genes coding for drug
metabolising enzymes. This will reinforce the importance of regulatory
polymorphism in drug metabolism and outline some of the issues which make
their identification difficult.
The majority of regulatory polymorphisms have been found within promoter or
enhancer regions. Other SNPs that influence mRNA splicing and thus the
amount of activity of the protein are also included. The CYP family have been
extensively studied for regulatory polymorphism. This is the major hepatic
family of drug metabolizing enzymes. I will review the literature on the
CYP1A2, CYP2D6 and CYP2A6. CYP1A2, which metabolizes clozapine,
paracetamol, phenacetin, theophylline, imipramine, and tacrine. Four
regulatory polymorphisms have been observed in CYP1A2 that alter transcript
abundance. The SNP, -2964G>A is found within an enhancer region.
Individuals with the A allele have a reduction in enzyme activity compared to
individuals that possess the G allele (Nakajima et al., 1999). The SNP -
163C>A was found associated with increased enzyme induction in patients
given caffeine (Sachse et al., 1999). A novel SNP -730C>T was identified
within an Ethiopian population. A haplotype containing the T variant showed
significantly decreased enzyme activity towards the substrate caffeine. The T
allele was shown to prevent the binding of the transcription factor ets (Aklillu
et al., 2003). A CYP1A2 splice donor site polymorphism, found in a single

63
individual, was implicated in the poor metabolism of clozapine (Allorge et al.,
2003).
CYP2D6 is the most polymorphic of the CYP genes and the protein
constitutes 2% of total hepatic CYP protein. CYP2D6 is involved in the
oxidative metabolism of more than 70 drugs. Two SNPs alter the splicing of
the gene. A G>A SNP within the consensus sequence at the splice site of the
third intron causes a loss of protein in individuals with the A/A genotype.
These individuals have been shown to be poor metabolizers of CYP2D6
substrates (Kagimoto et al., 1990). The second polymorphism, a splice
acceptor site found within intron 1, which causes a premature stop codon,
was observed in a poor metabolizer of CYP2D6 substrates (Marez et al.,
1995). The third SNP, a regulatory polymorphism, 1584G>C, in the promoter
of CYP2D6, was shown to be associated with CYP2D6 activity in vivo (Lovlie
et al., 2001) possibly due to an increase in protein expression (Zanger et al.,
2001). More recent evidence suggests the -1584G>C is in linkage
disequilibrium with the functional CYP2D6*35 allele, which has been found in
many duplication-negative "ultra rapid" metabolizers (Gaedigk et al., 2003).
These are individuals which do not contain duplications of the gene and are
ultra-rapid metabolizers. This outlines the difficulty in defining regulatory
polymorphism based on purely associative studies.
The enzyme CYP2A6 accounts for about 10% of all CYP expression within
the liver (Pelkonen et al., 2000). The enzyme metabolizes nicotine, cotinine,
and some drugs (e.g., fadrozole, halothane, losigamone, letrozole,

64
methoxyflurane). A SNP, -48T>G, which disrupts the TATA box of the gene,
was identified in a Turkish individual. This SNP was further identified in
different populations and allele frequencies (the G allele) were between 5-
15%. The G/G genotype reduces reporter gene activity to 50% of the T/T
genotype (Pitarque et al., 2001). A polymorphism was identified within an
enhancer region of CYP2A6 located at position -1013A>G. Reporter gene
assays showed the region, between -1005 and -1019, containing the
polymorphism elicited a strong enhancer effect. The CYP2A6*1D allele,
containing the -1013 G/G genotype showed significantly reduced reporter
gene activity. An EMSA showed that the A/A genotype have higher affinity
nuclear protein binding than does the G/G genotype (Pitarque et al., 2004). A
novel polymorphism was identified in the 5′ flanking region of the CYP2A6
gene located at position -745A>G. This polymorphism lowers the binding
efficiency of the NF-Y transcription factor to the CCAAT binding sequence.
Reporter gene assays show the -745 G variant reducing promoter activity to
78% of the wild type activity (von Richter et al., 2004).
1.17 Methods of identifying and analysing regulatory polymorphism Linkage disequilibrium can be described as the non-random association of
alleles. Definition of regulatory polymorphisms is complicated by linkage
disequilibrium (LD) within the human genome. A variant in one individual or a
population may seem like the causative polymorphism when in reality it is only
in linkage disequilibrium with the causative polymorphism. To illustrate, the
lactase persistence phenotype is conferred by a regulatory SNP, C>T, 14 kb
upstream of the start of translation (Enattah et al., 2002). The T allele is in
65
complete association with lactase persistence within a Finish population
(Enattah et al., 2002). Subsequent studies show, that in some individuals,
there is equal contribution of expression from the C and T allele (Poulter et al.,
2003). The variation has not been associated with lactase persistence within
certain African populations (Mulcare et al., 2004).
In the previous section the CYP2D6 gene polymorphism, -1584G>C, was
described. This shows an in vivo association with reduced CYPD26 activity
(Gaedigk et al., 2003). The polymorphism was shown to be in strong linkage
disequilibrium with a coding region SNP associated with a poor metabolizer
phenotype. Therefore the SNP could potentially only be in linkage with the
causative polymorphism. To partly overcome the problem of LD, the order of
polymorphisms that exist along the chromosome of an individual (known as a
haplotype) can be tested for functional effect instead of testing only a single
variant. This way the influence of regulatory polymorphism can be deduced by
studying the effects of different genetic backgrounds. This, however, requires
detailed knowledge of the regulatory sequence. Therefore there is a
requirement for in vivo associative data to be combined with functional data to
define the influence of a regulatory polymorphism.
There are many methods to analyse regulatory polymorphism and I will review
both common and more recent methodologies. The most common and
traditional way of identifying a regulatory polymorphism is by measuring its
ability to drive transcription when attached to a synthetic reporter construct.
The reporter gene produces an exogenous product allowing quantification of

66
this protein within transfected cells. Originally, the reporter gene used was the
chloramphenicol acetyltransferase (CAT) gene. Subsequently the reporter
gene luciferase was introduced due to its ability to be easily quantified by
luminescence, in comparison to the quantification of radioactive acetylated
products of chloramphenicol. Before regulatory polymorphisms can be tested,
the promoter needs to be defined. This is achieved by refining the sequences
upstream of the transcriptional start sites until the most important regulatory
sequences have been established. Polymorphisms can then be studied, either
by introducing the mutation by site-directed mutagenesis or by amplifying and
cloning the promoter sequence from different individuals. Candidate
polymorphisms can be chosen which disrupt consensus DNA binding sites for
transcription factors. These are good candidates for playing a role in
regulating the gene being studied. This technique is limited as the causative
SNP may be in LD with the promoter SNP being analysed. Thus the influence
of the causative SNP will be missed as it is not present within the promoter
region that has been defined.
Additional techniques are required to observe the physical effect of the SNP
on gene regulation. DNase I footprints have traditionally been used to identify
the DNA-protein binding profile along the promoter. The EMSA can be used to
determine if the SNP affects the binding of a trans-acting regulatory factor.
There are disadvantages to analysing regulatory polymorphism in vitro. The
regulatory variation is not found in its natural environment. The DNA is not in
the natural chromatic state and the DNA will not necessarily regulate
expression or influence protein binding as it does in vivo.

67
In an attempt to overcome some of the limitation of regulatory polymorphism
analysis, use has been made of allele-specific markers to analyse the
influence of an individual allele. First, allele-specific markers are identified.
Subsequently, gene expression from each allele is measured by specific RT-
PCR toward each allele (Singer-Sam et al., 1992). This technique is limited
because it cannot identify differences in trans-acting-factor binding that may
cause differences in gene regulation between individuals. To address the
problem, allelic expression and differences in trans-acting factor binding
measuring can be carried out within the same individual using the same cell
type. The allelic expression can then be determined for individuals and
association studies made to obtain candidate regulatory SNPs. This technique
is limited to studying markers within the mRNA coding region or with SNPs
that are in LD.
The development of an assay, which does not require a heterozygote marker,
is that which measures the amount of RNA polymerase II phosphorylation.
The phosphorylation of specific serine residues within RNA polymerase II
allows its release from the initiation complex and the commencement of
elongation (Knight et al., 2003). Phosphorylation is therefore directly linked to
the activation of transcription. The authors showed that chromatin
immunoprecipitation assays, using antibodies to phosphorylated RNA
polymerase II, allows the influence of allelic differences on transcription to be
assessed.

68
Measurements of allele-specific expression that better reflect the in vivo
situation are a powerful and accurate tool for elucidating regulatory
polymorphism. The causative SNP responsible for influencing expression
must of course be identified. To identify causative regulatory SNPs, allele-
specific approaches would have to be combined with techniques that can
directly test the effect of individual SNPs on gene expression.
1.18 Illumina second-generation sequencing and its application for regulatory polymorphism The techniques described thus far have been based on analysing a single
gene or a small group of genes. Genome-wide sequencing is now feasible
with the advent of second-generation sequencing (Shendure and Ji, 2008).
There are a number of different types of second-generation sequencing and I
describe here the use of cyclic-array sequencing. Cyclic array sequencing has
been realized in different commercial products. The 454 sequencing
technology (used in the 454 Genome Sequencers, Roche Applied Science;
Basel), Solexa technology (used in the Illumina (San Diego) Genome
Analyzer) and the SOLiD platform (Applied Biosystems; Foster City, CA,
USA), the Polonator (Dover/Harvard). All systems are based on a similar work
flow. The DNA to be sequenced is fragmented. The fragments are each
ligated to a linker sequencer. PCR by amplification from the linker DNA is
used to generate amplicons. Within the different systems these PCR products
are spatially oriented (Solexa). The amplified products are sequenced via
enzymatic reaction (454) or fluorescence imaging of terminated reactions
(Solexa and SOLiD).

69
The ability to sequence whole genomes using second-generation sequencing
will lead to the rapid increase in the identification of human genetic variation.
A project to sequence 1000 individual genomes from various populations is
currently being undertaken which should identify novel variation (Siva, 2008).
The second-generation sequencing platforms have been utilised to study not
only variation but also the analysis of gene regulation on a genomic scale.
Researchers are now able to analyse the epigenome using second-
generation sequencing technology. The epigenome can be described as the
source of variation within the genome other than the sequence itself. This
includes the chromatin, methylation and acetylation state of the DNA. These
modifications are extremely important in overall gene expression in altering
the chromatin structure of DNA thus effecting the regulation of genes. As a
result epigenetics is responsible for cell-type specificity, differentiation,
development, proliferation, and the cell‟s environmental responses.
Analysis of the epigenome can identify regulatory regions that are specific to
the condition of the cell. DNase I-seq (Song and Crawford, 2010), NA-seq
(Gargiulo et al., 2009), and Formaldehyde-Assisted Isolation of Regulatory
Elements (FAIRE-seq) (Giresi et al., 2007), are three epigenetic techniques
which allow the identification of regulatory regions throughout the whole
genome. The techniques work under the same principle. The DNA is treated
with DNase I, which digests DNA that is in a relaxed state as opposed to a
nucleosomal state. In the relaxed state the DNA is more liable to be digested
by DNase I. These digested regions will result in many smaller fragments.
These DNase I digested fragments will therefore be enriched. The DNA
70
fragments are transferred to an illumina sequencing machine and analysed.
The sequence signal strength is correlated with the amount of DNase I
digestion and areas of high signal strength are good indicators of regulatory
regions. DNase I-seq has identified a substantial number of open regions
within many different cell lines and tissues revealing a large number of tissue
specific regulatory regions. For example the epigenome of human pancreatic
islet cells has been examined by Formaldehyde-Assisted Isolation of
Regulatory Elements (FAIRE-seq) analysis (Gaulton et al., 2010). By
removing identified regulatory regions from other cell types, regions specific to
the islet cells can be determined (Gaulton et al., 2010). By locating regulatory
specific regions polymorphism can be identified and tested for their functional
effect (Gaulton et al., 2010).
DNase I-seq has been undertaken at a resolution high enough to resolve the
sequence to which individual proteins are bound. However the resolution
required means that the number of sequence reads is extremely expensive
(Hesselberth et al., 2009).
1.19 Polymorphism effecting translation efficiency A number of genetic polymorphisms have been shown to occur within the
mRNA coding sequence that influences the translational efficiency of the
protein. Polymorphism has been shown to alter the rate of translation and the
production of protein. This can occur due to the polymorphism introducing a
mutation within the Kozak sequence. A polymorphism within the Kozak

71
sequence of the glycoprotein ib alpha gene is a major determinant of plasma
membrane levels of the platelet GPIb-IX-V complex (Afshar-Kharghan et al.,
1999). A polymorphism within the Kozak sequence of the annexin V gene is
associated with myocardial infarction in young people (Gonzalez-Conejero et
al., 2002). Polymorphism has also been shown to disrupt or create ATG
initiation codons. A polymorphism within the vitamin D receptor gene
introduces a second upstream ATG initiation codon. This polymorphism has
shown to be a risk factor associated with insulin resistance in Caucasians
(Chiu et al., 2001), associated with bone mineral density and vertebral
fractures in postmenopausal Italian women(Gennari et al., 1999), and
associated with height (Minamitani et al., 1998). The polymorphism creates a
second translation initiation site. It has been shown that individuals with this
polymorphism produce two distinct proteins (Arai et al., 1997). The upstream
ATG was shown to produce 1.7-fold increase in reporter gene activity than the
ACG form in transfected COS-7 cells (Arai et al., 1997).
In the course of the work described in this thesis, a common polymorphism
was identified within the FMO1 gene. This results in a second ATG upstream
of the defined translational start site. This polymorphism, a C>T transition,
occurs in-frame, 12 base pairs upstream of the accepted ATG for FMO1. This
is the same distance as seen between the ATG initiation sites in the vitamin D
receptor gene (Zysow et al., 1995). Chapter 2 describes the experimental
work carried out on the FMO1 ATG polymorphism.

72
1.20 3T3-L1 adipocytes and their use as a model for adipocyte biology 3T3-L1 cells were used in the experiments described in Chapters 1 and 2.
Several different fibroblast cell lines exist that can be differentiated into
adipocytes in culture. The 3T3 cell line was immortalised from primary
embryonic stem cells from the Swiss mouse strain. These cells were
originally isolated to obtain immortal cell lines suitable for viral transformation
(Todaro and Green, 1963). When in culture, the cells were observed to
produce foci of cells that accumulated lipid. In 1972, 3T3 cells were clonally
expanded based on lipid accumulation within the cells. Different clones
produced differing amounts of lipid. The 3T3-L1 line is one of the clonal
expansions of the 3T3 cells that convert to cells accumulating a large amount
of lipid (Green and Meuth, 1974). The cells were shown to possess a latent
programme of differentiation that, when activated, converts them to
adipocytes. The differentiation process was shown to have specific stages of
conversion (Fig.1.7). The first stage is the accumulation of triglycerides, which
could be stained with oil-red O. In the second stage the cells have extended
processes. When the cells enter the third stage they become spherical and
take on the morphology of young, adipose cells. The cells were shown to
accumulate the enzymes and proteins responsible for the synthesis and
degradation of triglyceride and hormonal regulation of lipid accumulation. 3T3-
L1 cells were confirmed as containing a latent programme of adipocyte
differentiation when they developed into mature fat pads after injection into
athymic mice (Green and Kehinde, 1979). The 3T3-L1 adipocytes have been
shown to possess most of the structural and organelle characteristics of

73
animal adipocytes (Novikoff et al., 1980). The formation and development of
fat droplets also mimic primary adipose tissue (Green and Meuth, 1974).
Adipose conversion was shown to be more efficient when a cocktail of
adipogenic factors are introduced to the culturing media. These factors are
high concentrations of insulin, a glucocorticoid, usually dexamethasone, and
an agent that elevates intracellular cyclic adenosine monophosphate (cAMP)
levels, a signalling molecule which activates protein kinases and subsequently
changes glycogen, sugar, and lipid metabolism with the cell, and foetal bovine
serum(Student et al., 1980). This cocktail is added to the cells after they reach
confluency when cultured in foetal bovine serum. Twenty four hours later, with
the addition of the differentiation cocktail, the cells undergo a post-confluent
mitosis and subsequent growth arrest (Bernlohr et al., 1985). This is followed
by one round of DNA replication and cell division. At day 2, the cells complete
post-confluent mitosis and enter into an unusual growth arrest called GD (Scott
et al., 1982). This has been hypothesised to happen so the DNA can unwind
and allow transcription factors access to the open form of the DNA (Cornelius
et al., 1994). After growth arrest the cells are committed to becoming
adipocytes. The growth arrest is a requirement for subsequent differentiation.
At day 3, growth-arrested cells begin to express late markers of differentiation.
These late markers consist of lipogenic and lipolytic enzymes in addition to
other proteins responsible for producing the mature adipocyte phenotype. At
day 5-7 the cells round up, accumulate fat droplets, and become terminally
differentiated adipocytes.

74
Figure 1.7 Illustration of the morphological and gene regulatory changes that occur during 3T3-L1 adipocyte differentiation The diagram shows the 3T3-L1 differentiation process post addition of differentiation media (MIX (methylisobutylxanthine), DEX (dexamethasone), and INSULIN). The time course of morphological changes is shown. The illustration below shows the time course of expression of key regulators of 3T3-L1 differentiation and key changes within the cell cycle.

75
1.21: Aims of this study 1. To further investigate the usage of the FMO1 alternative promoters in
different mouse tissues and mouse cell lines.
FMO1 has a role in drug metabolism and more recently a role in energy
homeostasis has been defined. Further definition of promoter usage in
different tissues and cell types will help further our understanding of the
multiple promoters used and the mechanisms that regulate FMO1
transcription. Identifying which of the FMO1 transcripts is produced in different
tissues will give context to a genetic polymorphism that may have a transcript-
specific effect.
2. To define the human FMO1 P1 and P2 promoter sequences that are
responsible for transcription of FMO1.
This will be carried out in the context of different cell types. These promoter
regions will help define regulatory polymorphism that may be responsible for
the large inter-individual variation seen between individuals in the expression
of FMO1. Data will be collated from genome-wide expression analysis to
further validate the defined promoter regions.
3. To identify the amount of genetic variation within the FMO1 P0, P1 and P2
promoters.

76
Re-sequencing of the FMO1 promoters may yield novel variation that may be
responsible for the high inter-individual variation seen between individuals.
Re-sequencing will also identify genotype frequencies in different populations
for previously discovered polymorphism.
4. To examine the effects of FMO1 promoter polymorphism a novel approach
will be taken to improve the speed at which promoter polymorphism may be
analysed by the researcher.
Recent developments in DNase I capillary footprinting will be further
developed and used to analyse promoter polymorphism. This approach will
also allow the effects of the polymorphism on DNA-protein binding to be
visualised. The FMO1 promoter polymorphism will ideally be examined with
this method as well as the DNA-protein binding profile of the FMO1 P1 and P2
promoters.

77
Chapter 2
Materials and Methods

78
Chapter 2: Materials and Methods
General laboratory chemicals were purchased from BDH. Trizma base was
purchased from Sigma. Other chemicals and materials were purchased from
various companies. Company names, other than BDH, have been indicated in
bracket.
2.1 Escherichia coli (E.coli) strains and culture conditions
2.1.1 Genotypes of E.coli strains
XL-Blue MRA strain: Δ (mcrAI) 183, (mcrCB-hsdSMR-mrr) 173, endA1,
supE44, thi-1, gyrA96, relA1, lac) (Stratagene)
Library efficiency DH5α™ competent cells [supE44, Δlac U169 (Ф80
lacZΔM15), hsdR17, recA1, endA1, gyr A96, thi-1, relA1] (Invitrogen)
2.1.2 Culture of E. coli cells Materials
-Luria Bertani (LB) agar medium (10 g bactotryptone, 5 g yeast extract, 5 g
NaCl, 15 g agar per litre) (BIO101, Anachem).
-Luria Bertani (LB) medium (10 g bactotryptone, 5 g yeast extract, 5 g NaCl
per litre) (BIO101, Anachem).
-Ampicillin (amp), 50 mg/mL stock solution (Sigma)
Method
LB Medium and LB agar were both purchased in tablet form. After addition of
an appropriate amount of distilled water the media were autoclaved. The

79
medium was cooled to 50°C in a water bath. At this temperature ampicillin
was added to a concentration of 100 µg/mL. The agar was poured into 82 mm
Petri dishes (20 mL/plate). The agar solidified at room temperature and plates
were stored at 4°C. Bacteria (either from a glycerol stock or transformed cells)
were streaked or spread on to the plates. Inverted plates were incubated at
37°C.
Ampicillin was added to LB medium to a concentration of 50 µg/mL. A single
colony of bacteria from an agar plate was used to inoculate 5 mL of LB-amp
media and incubated overnight at 37°C in a shaking incubator. This is referred
to as a starter culture.
2.2 Small scale isolation of plasmid DNA from E. Coli Materials
-Luria Bertani (LB) medium (10 g bactotryptone, 5 g yeast extract, 5 g NaCl
per litre) (BIO101, Anachem).
-Qiaprep Miniprep Kit (all solutions were provided in the kit) (QIAGEN).
Method
All centrifuge steps were carried out using a Tube centrifuga 5415R.
A 4 mL starter culture was divided into two 2 mL Tube tubes and centrifuged
at 4,000 rpm in a bench top centrifuge for 4 minutes (min). The supernatant
was discarded and the bacterial pellet was re-suspended in 150 µL of P1

80
buffer. The two samples, containing the resuspended bacteria, were added
together. All subsequent centrifugation steps were carried out at 13,000 rpm.
Cells were lysed by the addition of 250 µL of lysis solution, P2 and mixed
gently. The lysis solution was neutralized by the addition of 350 µL of solution
N3. This is a high salt buffer, which precipitates denatured genomic DNA and
proteins leaving plasmid DNA in solution.
The precipitate was pelleted by centrifugation for 10 min. The lysate is added
to the QIAprep column, which fits in a collection tube. The resin in the column
selectively binds plasmid DNA at high salt concentrations and elutes at low
salt concentration.
The column was centrifuged for 1 min and the eluate discarded. The column
was then washed with 750 µL of PE buffer and centrifuged for 1 min and the
eluate discarded. The column was centrifuged for a further 1 min to remove
any traces of buffer PE. The collection is discarded and the column is placed
in a fresh 1.5 mL Tube. Plasmid DNA was eluted with 50 µL of water followed
by centrifugation for 1 min.
2.3 Large-scale isolation of plasmid DNA from E. Coli Materials
-Isopropanol
-Ethanol (70%)

81
-TE Buffer (10 mM Tris-HCL, 1 mM EDTA pH 8)
-QIAfilter Plasmid Midi Kit (QIAGEN). Kit includes the following solutions:
-P1, resuspension buffer (50 mM Tris-Cl (pH 8), 10 mM EDTA, 100 U/mL
RNase A).
-P2, lysis solution (200 mM NaOH, 1% w/v SDS).
-P3, neutralization buffer (3 M potassium acetate, pH 8).
-QBT, equilibration buffer (750 mM NaCl, 50 mM MOPS, pH 7, 15% v/v
isopropanol, 0.15% v/v Triton X-100).
-QC, wash buffer (1 M NaCl, 50 mM MOPS pH 7, 15% v/v isopropanol).
-QF, elution buffer (1.25 M NaCl, 50 mM Tris-CL pH 8.5, 15% v/v
isopropanol).
Method
100 mL of LB media was inoculated with 5 mL of an overnight starter culture.
The culture was incubated 37oC overnight in a shaking incubator. The culture
was centrifuged at 4000 rpm (using a Sorvall Evolution RC 728411) for 15
min. The supernatant was discarded and the bacterial pellet resuspended in 4
mL of buffer P1.
Cells were lysed with the addition of 4 mL of buffer P2. The tube was inverted
4-6 times and left to stand for 5 min. 4 mL of buffer P3 was added to
neutralise the lysis solution. This results in formation of a white precipitate.
The lysate was immediately poured into a filter cartridge. The cartridge was
left for 10 min at room temperature to allow separation of the precipitate.

82
The cleared lysate was filtered into a column which had previously been
equilibrated with 10 mL of buffer QBT. The resin in the column selectively
binds plasmid DNA. The lysate was allowed to pass through the column.
Cellular metabolites and RNA were washed off the column with the addition of
2, 10 mL washes with solution QC.
A 10 mL plastic tube was placed under the column and 5 mL of elution buffer
was added to the column to elute plasmid DNA. 1.5 mL of isopropanol was
added to the eluate, the sample mixed well. Plasmid DNA was pelleted by
centrifugation at 4oC at 8000 rpm (Sorvall Evolution RC 728411). The
supernatant was discarded and the clear pellet was transferred to a 1.5 mL
tube using a pipette tip. The pellet was washed with ~1.4 mL of 70% ethanol
and the sample centrifuged at 13000 rpm for 10 min (Tube centrifuga 5415R).
The supernatant was removed and the pellet dried in a heat block at 50oC for
10 min. The dried pellet was re-suspended in an appropriate volume of TE
buffer.
2.4 Quantification of DNA/RNA by UV spectrophotometry The concentration of DNA or RNA was determined using the Nanodrop™
1000. After setting a blank reading (TE buffer), 1 µL of DNA sample was
added directly onto the reader. The absorbance of this solution was measured
at 260 nm. The machine gave a reading of ng (DNA/RNA)/µL.
2.5 Bacterial Transformation Materials

83
-Library efficiency DH5α competent cells (Invitrogen).
-SOC medium (20 g tryptone, 5 g yeast extract, 5 g NaCl, 2.5 mM KCL, per
litre, pH 7.5) (Sigma).
-LB/amp plates (see 2.1)
Method
Competent cells were thawed on ice. Cells (10 µL) were mixed with 1 ng of
plasmid DNA or 50 µL of cells were mixed with 2 µL of a ligation reaction. The
mixture was incubated on ice for 30 min. The cells were subsequently heat-
shocked for 60 s at 42oC and transferred back to ice. 250 µL of SOC medium
was added and the cells were incubated at 37oC for 1 hr in a shaking
incubator. 100 µL of the bacterial culture was placed on LB/amp plates.
2.6 Preparation of glycerol stocks Materials
Glycerol (100%, autoclaved)
Overnight culture of E.coli.
Method
For long-term storage of E. coli cultures, 1 mL of bacterial culture was mixed
with 200µl of glycerol in a 1.5 mL tube. The contents were mixed well and
immediately stored at -70oC.

84
2.7 Restriction endonuclease digestion of DNA Materials
-Restriction enzymes (NEB). Enzyme concentration was 10,000units/mL
-10X Reaction buffer1 (NEB) 10 mM Bis Tris Propane-HCL, 10 mM MgCl2, 1
mM dithiothreitol (pH 7.0 @ 25C).
-10X Reaction buffer 4:50 mM potassium acetate, 20 mM Tris-acetate,
10 mM Magnesium Acetate, 1 mM Dithiothreitol (pH 7.9 @ 25°C).
-BSA (10mg/mL stock solution) (NEB).
Note: the reaction buffer was selected according to the enzyme used.
Methods
Plasmid DNA, reaction buffer (to a final concentration of 1x) and BSA to a
final concentration of 0.1 μg/μL were added to a 1.5 mL tube. Different total
reaction volumes (ranging from 20 to 100 μL) were used depending on the
amount of DNA being digested. The restriction enzyme was added last, at a
concentration of 1 unit per μg of DNA. The sample was incubated at 37oC (the
optimum temperature of the restriction enzymes used). The incubation time
was at least 1 hr.
When two enzymes were used, with two different optimal buffer conditions,
the most compatible buffer was chosen and the amount of enzyme added
modified to allow for any loss in enzyme activity.
85
2.8 Agarose gel electrophoresis of DNA fragments
Materials
-10x Tris borate-EDTA buffer (TBE) (0.89 M Tris-base, 0.09 M Boric acid, 20
mM EDTA (pH 8)
-Agarose (BioLine)
-6x loading buffer (0.25% bromophenol blue, 0.25% xylene cyanol, 30%
glycerol), stored at room temperature.
-Ethidium Bromide (EtBr) (10 mg/mL stock solution, stored at 4oC) (Fisher)
-DNA hyperladder I and V (BioLine)
Method
A 1% agarose gel was prepared by melting 1 g of agarose in 100 mL of
1xTBE buffer in a microwave oven. EtBr was added to the mixture to a final
concentration of 0.5 μg/mL. The cooled mixture was poured into a gel mould
with the appropriate comb in place. The gel was left to set for at least 30 min.
Once set, running buffer (1xTBE) was poured in to the gel mould placed in the
gel tank. TBE was added until the gel was completely submerged. The comb
was then removed.
DNA marker (10 μL, containing loading buffer) was loaded into the first well.
Three microlitres of loading buffer (on Nesco film) was mixed with each
sample prior to loading the gel. The gel was electrophoresed at 60-100 volts
to separate the DNA fragments. After electrophoresis the DNA fragments
were visualised on a UV transilluminator.

86
2.9 Purification of DNA fragments from agarose gels Isolation of DNA using QIA quick Gel extraction kit.
Materials
-Agarose gel (1%, w/v, supplemented with EtBr).
-Electrophoresis buffer (1xTBE)
-6x loading buffer
-Isopropanol
-Qiaquick Gel extraction kit (QIAGEN). All solutions were supplied with the kit.
Method
DNA was mixed with the loading buffer and electrophoresed on a 1% agarose
gel in TBE as described above. The separated DNA fragments were
visualised on a UV transilluminator. The fragment of interest was excised
using a sterile blade. The piece of agarose was transferred to a 1.5 mL tube
and weighed.
Three volumes of buffer QG was added to the tube (3 volumes more than the
weight of the piece of agarose gel). The agarose was melted by heating to
50oC for 10 min. 1 volume of isopropanol was added. The mixture was loaded
onto a QIAquick column, which had been placed inside a collection tube. The
column was centrifuged for 1 min at 13000 rpm in a bench top centrifuge for 1
min. The DNA fragment binds to the resin and the eluate was discarded. All
centrifuge steps in this protocol were carried out at 13000 rpm in a bench top
centrifuge for 1 min.

87
500 μL of Solution QG was added the column centrifuged to remove traces of
agarose. 750 μL of Solution PE was added and the column centrifuged to
remove salts. After removing the eluate the column was centrifuged for a
further 1 min to remove all traces of solution. DNA was eluted by adding 30 μL
of water to the column, followed by centrifugation. The amount and quality of
DNA was assessed with a nanodrop spectrophotometer by determining
absorbance at 260 and 280 nm.
2.9.1 Purification of DNA in solution Additional materials from method 2.9
Buffer PB - (supplied within the Qiagen PCR purification kit)
Method
Purification of DNA in solution (from PCR reactions or binding reactions) was
carried out using the above protocol but without the need to dissolve the
agarose gel in buffer QG. 5 parts buffer PB was added to one part of DNA
and mixed before passing through the column.
2.10 DNA ligation Materials
-DNA ligase kit (BioLine). The kit includes the following:
-Quick-stick ligase (2000 U/μL)
-Quick-stick buffer

88
Method
20 ng of vector was mixed with a 3-fold molar excess of insert in a 1.5 mL
Tube. The volume was adjusted to 14 μL using sterile water. 1 μL of QS
ligase was added. Finally 5 μL of QS buffer (4x stock solution) was added to
make a total reaction volume of 20 μL.
The reaction sample was mixed thoroughly by pipetting and incubated at
room temperature for 5 min. 2 μL of the ligation reaction was used to
transform 50 μL of competent cells. Plasmid DNA was isolated from 5 of the
resulting bacterial colonies. Plasmid DNA was analysed by restriction
endonuclease digestion to confirm which colony corresponds to a
recombinant plasmid, resulting from the ligation reaction.
2.11 Polymerase chain reaction (PCR) All PCR reactions were carried out in a Techne Genium PCR machine.
Materials
-BioTaq DNA polymerase (BioLine)
-10x NH4 Reaction Buffer-160 mM (NH4)2SO4, 670 mM Tris-HCL (pH 8.8 at
25oC). (BioLine)
-50 mM MgCl2 (BioLine)
-100 mM dNTPs (BioLine)
-Forward and reverse primers lyopholised (MWG), resuspended and stored at
100 ng/µl and used at a working concentration of 10 ng/µl.

89
Method
The PCR consisted of 10 ng of genomic DNA or 1 ng of plasmid DNA, 1x
reaction buffer, 0.2 mM dNTP mix, 0.5 μM reverse and forward primers,
1.5mM MgCl2 made up to 24.9 μL using sterile water. Finally 0.5 U of BioTaq
polymerase was added. If multiple PCR reactions were carried out, a
mastermix was made and 24.9 μL distributed to each tube before adding the
taq enzyme separately. A control reaction, with no DNA template, was used
as a negative control.
Amplification parameters are shown in table 2.1. The annealing temperature
was dependent on the melting temperature of the primers. The melting and
annealing temperature of the primers was determined using the equation in
table 2.1. The amplified products were visualised using agarose gel
electrophoresis.

90
Programme Cycle and temperature Time
Programme 1 1 cycle Time
95°C 5min
annealing temp 30 sec
72°C/68°C 1min/kb
Programme 2 30 cycles
95°C 30 sec
annealing temp 30 sec
72°C/68°C 1min/kb
Programme 3 1 cycle
72°C/68°C 10min
B
Tm = 69.3+ (0.41x (G+C))- 650/length (nt)
Annealing temperature= ((Tm1 + Tm2)/2) -6
Table 2.1 PCR cycling conditions Extension temperature was 72°C for Taq and 68°C for BioXact. The annealing temperature is dependent on the primer pair. The Tm of each primer was calculated using the equation in (B). The Tm values of both primers were used to calculate the annealing temperature.

91
2.11.1 Bio-X-act DNA polymerase This is a mixture of polymerase enzymes that display 3′-5′ proof reading
activity in addition to 5′-3′ polymerase activity. This reduces the chance of
misincorporated nucleotides during primer extension. This enzyme was used
to produce constructs used in reporter gene assays as accurate replication of
the template was essential.
Material
BIO-X-ACT Long DNA polymerase (4 U/μL) (BioLine)
-OptiBuffer (10x reaction buffer) (BioLine)
-dNTP mix (100 mM) (BioLine)
-Forward and reverse primers (lyophilized) (MWG) resuspended and stored at
100 ng/µL and used at a working concentration of 10 ng/µL.
-MgCl2 (50 mM) (BioLine)
Method
The PCR reaction consisted of 10 ng of human genomic DNA, 1x reaction
buffer, 0.2 mM dNTP mix, 4 mM MgCl2 and 0.5 μM reverse and forward
primers. The volume of the reaction was made to 24.5 μL. Finally, 1 unit of
Bio-X-Act long was added.
The amplification parameters were devised in the same way as for BioTaq
polymerase, but the optimum extension temperature is 68oC rather than 72oC.
The extension time is also increased to 1 min/1kb).

92
2.12 Reverse transcriptase polymerase chain reaction Materials
-First-Strand cDNA Synthesis Kit containing the following materials:
-Superscript II reverse transcriptase (50 U/μL)
-Reaction buffer (200 mM Tris-HCL (pH 8.4), 500 mM KCl)
-dNTP mix (10 mM)
-MgCL2 (25 mM)
-RNase OUT (recombinant ribonuclease inhibitor (40 U/μL))
-Oligo (dT) 12-16 (0.5 μg/μL)
-Diothiothreitol (DTT) (0.1 M)
Method
In a 1.5 mL tube an RNA/Primer mix was made consisting of up to 5 μg of
total RNA, 1 mM of dNTPs, 1 μL Oligo (dT) 12-18 and made up to 10 μL with
DEPC-treated water. The RNA/Primer mix was then incubated at 65oC in a
heat block for 5 min. During this time the reaction mixture was prepared. This
consisted of 2 μL Reaction buffer, 4 μL MgCl2, 2 μL DTT and 1 μL of RNAse
OUT (40 U/µl). Nine microlitres of reaction mixture was added to each
RNA/Primer mixture which was incubated at 42oC in a heat block. Fifty units
of superscript enzyme was added per tube and samples were incubated for
50 min at 42oC. The reaction was terminated by increasing the incubation
temperature to 70oC for 15 min. This denatured the enzyme and therefore
stopped the reaction. The samples were collected by brief centrifugation and
1 μL of RNase H was added followed by incubation at 37oC for 20 min to

93
degrade any RNA. The DNA product was used as a template for PCR
amplification.
2.13 TOPO T/A cloning Materials
-TOPO TA cloning kit for sequencing (Invitrogen). The kit included in the
following components:
-PCR4-TOPO vector (Fig.2.1) This was provided as a solution which
contained 10 ng plasmid DNA/mL in 50% (v/v) glycerol, 50 mM Tris-HCL, (pH
7.4 (at 25oC)), 1 mM EDTA, 2 mM DTT, 0.1% (v/v) Triton X-100, 100 mg/mL
BSA, 30 μM phenol red.
-Salt solution (1.2 M NaCl, 0.06 M MgCl2)
Method
The TOPO vector is a linearised vector and possesses single thymine
overhangs. The PCR products, produced by the Bio-X-act enzyme, have
adenosine bases at the 3′ end of each DNA strand. The adenine overhangs of
the PCR product can be ligated to the thymine overhangs from the TOPO
vector and the DNAs are ligated with a DNA ligase that is covalently bound to
the linearised vector.
In a 1.5 mL Tube, 4 μL of a PCR product was mixed with 1 μL of salt solution
and 1 μL of PCR 4-TOPO vector. The tube was incubated at room
temperature for 5min. 2 μL of this reaction was used to transform 50 μL of

94
competent cells. DNA was isolated from bacterial colonies cultured on
ampicillin agar plates.
Figure 2.1 pCR®4-TOPO vector map (Invitrogen catalogue) The pCR®4-TOPO vector was used to clone PCR products.

95
2.14 Isolation of RNA from cells, mouse and human tissues Materials
-Ribopure RNA extraction kit (Ambion) containing:
-TRI reagent
-Filter cartridges
-Collection tubes (2 mL)
-1-bromo-3-chloropropane (BCP)
-Wash solution concentrate
-Ethanol
-Elution buffer
2.14.1 Tissue preparation Adult C57BL/6 mice were sacrificed. The relevant tissues were excised and
stored in RNAlater (SIGMA). To isolate RNA, 100 mg of tissue was
transferred to a 1.5 mL Tube containing 1 mL of TRI reagent. Using a hand-
held tissue homogeniser tissues were homogenised and then left at room
temperature for 5 min. After centrifugation for 10 min at 12,000 g, insoluble
material is removed from the top of the homogenate.
2.14.2 RNA isolation from tissue cultured cells Cells were grown in a monolayer to confluency in 35-mm cell culture dishes.
TRI reagent was added directly to the culture dish. Cell clumps were removed
by pipetting up and down several times. The mixture was then transferred to a
1.5 mL tube.

96
100 μL of BCP was added per 1 mL of homogenate and vortexed at maximum
speed for 15 s. This mixture was left to incubate at room temperature for 5
min. After centrifugation at 12000 g for 10 min at 4oC, the mixture is separated
into a lower, red, organic phase (phenol-BCP phase); an interphase; and a
colourless, upper, aqueous phase.
The RNA remains in the aqueous phase while DNA and proteins are in the
interphase and organic phase. The aqueous layer (around 400 μL of 1 mL) is
transferred to a new 1.5 mL tube. 200 μL of 100% ethanol is added to 400 μL
of the aqueous phase and the sample vortexed immediately for 5 s. This
avoids precipitation of RNA.
The sample was transferred to a filter cartridge, which binds RNA. The filter
cartridge is placed inside a collection tube and centrifuged for 1 min at 12,000
g in a bench top centrifuge. The eluate is discarded and 500 μL of wash
solution is applied to the column and centrifuged for 1 min. This is then
repeated once.
The filter cartridge is then transferred to a new collection tube and 100 μL of
elution buffer is added to the cartridge and centrifuged for 1 min. The eluate
contains the RNA. The RNA is then used as the template to create cDNA.

97
2.15 COS-7 AND 3T3-L1 cell culture Materials
-COS-7, 3T3-L1 cells (Obtained from European Collection of Animal cell
culture (ECACC™))
-Dulbecco‟s Modified Essential Medium (DMEM) (Gibco). Supplemented with
50 μg/mL of gentamycin (Gibco), 10% foetal calf serum (Gibco). Once
supplemented the medium is referred to as complete medium.
-PBS (1x) (137 mM NaCl, 2.7 mM KCL, 10 mM Na2HPO4, 1.8 mM KH2PO4)
(PAA).
Method
COS-7 and 3T3-L1 cells were seeded into Nunclone tissue culture flasks (MG
Scientific) and grown in a Heraeus incubator (Kendro), at 37oC with 5% CO2
until the cells were 70-75% confluent. Cells were then washed twice with
PBS, detached with 4mM EDTA in 1x PBS and pelleted by centrifugation at
1900 rpm for 2 min at room temperature in a bench top centrifuge (Sigma).
The pellet was resuspended in complete medium and seeded on to 24-well
plates. Cells were seeded 24 hr prior to transfection.
2.15.1 HK-2 cell culture Materials
-Defined Keratinocyte-SFM (1X) liquid (Gibco)
Method

98
Cells were cultured in the same conditions as COS-7 and 3T3-L1 cells.
2.16 Transient transfection of cells The chosen method of transfection of cultured cells was lipid-mediated
transfection (Felgner and Ringold, 1989). The chosen lipid was LTX
(Invitrogen). This is a highly efficient lipid for the transfection of cells in culture.
The lipid forms vesicles that associates with DNA and is thought to aid the
transfer of DNA into cells by fusion of vesicles with the cell membrane.
Materials
-LTX transfection reagent (Invitrogen)
-Opti-MEM® I Reduced Serum Media without serum (Invitrogen)
Method
24 hrs prior to transfection, cells were transferred into 24-well plates, so on
the day of transfection the cells were 80-90% confluent. Each well
represented an individual transfection experiment and each transfection was
carried out in triplicate. The amount of DNA was optimised for each cell line
and was therefore dependent on the cells that were transfected (section
4.1.2). COS-7 and 3T3-L1 cells were transfected with 0.4 µg of reporter
construct DNA and 0.05 µg of pRL-TK (internal control plasmid). HK-2 cells
were transfected with 1 µg of reporter plasmid and 0.125 µg of pRL-TK. A 1:1
ratio of transfection was shown to be suitable for COS-7, 3T3-L1, and HK-2
transfection. A mastermix solution was made for triplicate experiments. DNA
was added to 300 µl of Opti-MEM® Reduced Serum Media without serum.
LTX was added to this solution at a ratio of 1:1, e.g. for transfection of COS-7

99
cells, 0.45 µg of DNA is used for each reaction. This is multiplied by three as
transfection is carried out in triplicate. This results in a total of 1.35 µg. 1.35
µL of LTX was added to the solution. The solution was gently mixed and left at
room temperature for 30 min. After 30 min, 100µL of the solution was added
directly into the well. Culture media was replaced after 24 hours with the
growth medium and cells assayed after 48 hours.
2.17 Isolation of Nuclear proteins from cell lines Materials
-PBS (1x) (137 mM NaCl, 2.7 mM KCl, 10 mM Na2HPO4, 1.8 mM KH2PO4).
-Hypotonic buffer (10 mM HEPES (pH 7.9), 10 mM KCl, 0.2 mM EDTA, 0.1
mM EGTA). Immediately before use, the buffer was supplemented with a
protease inhibitor cocktail (Roche) and 1 mM DTT.
-Roche Complete Protease Inhibitor Cocktail Tablets - Mixture of several
protease inhibitors with broad inhibitory specificity. For the inhibition of serine,
cysteine, and metalloproteases.
-NP-40 (Sigma)
-Nuclear lysis buffer (20 mM HEPES (pH 7.9), 0.4 M NaCl, 1 mM EDTA).
Immediately before use the buffer was supplemented with 1 mM DTT,
protease inhibitor cocktail (Roche) and 0.02% v/v NP-40.
-Dialysis buffer (20 mM HEPES (pH 7.6), 1 mM EDTA (pH8)). Buffer was
autoclaved and stored at 4oC. Immediately before use, 1 mM DTT was added
to the buffer.

100
Method
Approximately 107 cells were pelleted by centrifugation at 2500 rpm for 5 min
in an Eppendorf bench centrifuge. The pellet was washed with 1x cold PBS
and resuspended in 1 mL of cold hypotonic buffer. Cells were incubated on
ice for 15 min. 0.4% (v/v) NP-40 was added to the cells. Cells were passaged
through a 25G needle, 5-6 times to lyse the cells. The lysate was centrifuged
at 10000 g for 2 min at 4oC. Supernatent was discarded and 300 µL of nuclear
lysis buffer was added to the nuclear pellet. The samples were rolled on a
denly spiramix for 30 min at 4oC. The supernatant (the nuclear extract) was
transferred into another tube and was dialysed to remove excess salt. A 500
µL sample was placed in a Slide-a-Lyzer® Dialysis cassette (Pierce). The
cassette was attached to a buoy and immersed in 1 litre of cold dialysis
bufferin a glass beaker which contained a magnetic stirrer. The dialysis took
place in the cold room and the buffer was constantly stirred. After 2 hours the
buffer was replaced with fresh buffer. After an additional 2 hours of dialysis
the sample was removed from the cassette and transferred into a 1.5 mL
Eppendorf tube. The samples were alliquoted and stored at -70oC.
2.18 Dual-luciferase® reporter assay and pGL3 vectors The pGL3-Basic vector contains a multiple cloning site upstream of the firefly
(Photinus pyralis) luciferase gene. FMO1 DNA sequences upstream of
transcriptional start sites were cloned within the multiple cloning site upstream
of the luciferase gene. The ability of these sequences to drive transcription of
the reporter gene was measured. The cells were simultaneously transfected
with a second vector, pRL-TK, which contains a luciferase gene sequence

101
from Renilla reniformis (Renilla) under the control of the herpes simplex virus
thymidine kinase (HSV-TK) promoter.
The basis of the Dual-Luciferase reporter assay is the different substrate
requirements for the firefly and the renilla luciferase proteins. The firefly
luciferase activity is measured first by mixing the cell lysate (containing the
expressed luciferase protein) with the Luciferase assay reagent II (LARII). To
the same well, the substrate for the Renilla luciferase protein (Stop and Glo®
reagent) is added and its activity measured. The Stop and Glo buffer also
inhibits the firefly luciferase reaction measured previously. This allows both
luciferase protein activities to be measured within the same sample. The
Renilla reporter acts as an internal transfection control and allows for the
normalisation of the firefly luciferase gene expression.
Materials
-PBS (1x) (137 mM NaCl, 2.7 mM KCl, 10 mM Na2HPO4, 1.8 mM KH2PO4).
(PAA)
-Dual-Luciferase® Reporter assay System (Promega) contains
-Passive Lysis Buffer (PLB, 5x) (11.5 g Na2HPO4, 2 g KH2PO4, 80 g NaCl, 2 g
KCl per litre. Final pH 7.4)
-Luciferase Assay Buffer II and substrate
-Stop and Glo® substrate and buffer
-Vectors: pGL3 basic, pGL3 control, pRL-TK
-RNA produced from the vector pSP-LUC containing the P2 FMO1 leader
sequence.

102
Method
COS-7, HK-2, 3T3-L1 fibroblasts and 3T3-L1 adipocytes were transfected
with the above vectors as described previously. Cells were harvested 48
hours post transfection. This was shown to be the optimal conditions for
luciferase activity. The medium was removed and cells were washed 1x with
PBS. 3T3-L1 fibroblasts and adipocytes require careful removal of PBS so
cells remain intact. The amount of passive lysis buffer (PLB) added depended
on the area of cells to be lysed. COS-7, 3T3-L1 fibroblasts, and HK-2 cells
were lysed within 24-well plates. The amount of PLB added was 100 µL. 3T3-
L1 adipocytes were grown in 18 mm dishes and 200 µL of PLB was added.
The plates were left on a rocking platform for 15 min. The lysate was removed
and transferred into a 1.5 mL tube. Samples were pipette up and down and
centrifuged briefly before performing the dual-luciferase assay.
One-hundred microlitres of Luciferase assay buffer was added to wells of a
black 96-well plate. Twenty microlitres of cell lysate was added to each well.
Luminescence was measured using the micro plate reader, PHERAstar.
Timing of the addition of cell lysate ensured the luciferase reaction took place
for an equal amount of time within each well. A delay in measurement of 10 s
took place for each well. One hundred microlitres of the Stop and Glo reagent
was added to the wells and the Renilla luciferase activity was measured in the
same format as the luciferase activity. The final luciferase reading for each
assay was in the form of a ratio of firefly: renilla luciferase activity.

103
The control plasmid, pGL3-control, contains the SV40 promoter upstream of
the firefly luciferase reporter gene and an SV40 enhancer located
downstream of it. Each cell line was transfected with this vector as a positive
control for the transfection procedure. The vector pGL3-Basic was used as a
negative control.
2.19 RNA Transfection Materials
-COS-7 cells
-RNA produced in-vitro (section 2.27) from pSP-ATG and pSP ACG vectors
(section 2.20.2 for cloning procedure)
-LTX lipid transfection reagent (Invitrogen)
Method
Cells were transfected as shown previousy (section 2.16). The amount of
RNA used for each individual transfection was 1µg. It was shown that a 2:1
ratio of LTX lipid reagent to RNA was optimal for transfection (section 4.7).
2.20 Reporter constructs used for transfection studies
2.20.1 FMO1 promoter reporter constructs
The promoter fragments -255_-128, -858_-128, -1243_-128, -2433_-128 and -
858_-343, -1243_-343, -2433_-343 were amplified from genomic DNA
(BioLine Cat.no.BIO-35025) by PCR (see section 2.11).
104
For cloning of promoter fragments, HindIII and SacI restriction endonuclease
sites were integrated into the primer sequences (see appendix). The amplified
products were cloned into the TOPO vector as described above. Upon
cleavage out of the TOPO vector the fragments were purified from an agarose
gel (see above) and ligated to a HindIII/SacI digested pGL3-Basic vector. The
resulting reporter constructs are defined as pGL-255_-128, pGL-1243_-128,
pGL-2433_-128 and pGL-858_-343, pGL-1243_-343, pGL-2433_-343.
2.20.2 FMO1 P2 leader sequence construct
The FMO1 P2 leader sequence was cloned into the pSP-luc vector to test the
significance of a polymorphism which introduces an in-frame ATG 12 bp
upstream of the translational start site (Fig.2.3). The translation initiation
codon of the luciferase gene is within an NcoI restriction site; this site and a
KpnI site further upstream were used to clone the P2 leader sequence within
the vector. This positioned the FMO1 leader sequence directly in-frame with
the luciferase gene. Due to the 3′ sequence similarities between the FMO1
sequence and the NcoIsite, the NcoI site could form part of the leader
sequence.
Once the leader sequence was cloned, the leader sequence contained an
additional cytidine residue from the NcoI restriction site. This was deleted by
site-directed mutagenesis (section 2.28), ligated (section 2.10) and
transformed into competent cells (section 2.5). The plasmid was isolated and
the upstream ATG was mutated to ACG using site-directed mutagenesis.

105
Both plasmids were prepared using large-scale purification and transfected
into COS-7 cells. The luciferase activity was measured after 48 hr transfection
using the dual luciferase assay reporter system (section 2.18).

106
Figure 2.2 Maps of pGL3 vectors and the pRL vector The plasmids that were used to analyze FMO1 reporter gene constructs in combination with the Dual-Luciferase® Reporter assay system. DNA sequences upstream of the FMO1 transcriptional start sites were cloned adjacent to the (A) pGL3-Basic vector. (B) The pGL3-Control vector containing the SV40 promoter sequence and was used as a positive control within the reporter gene assay. The pGL3 plasmids contain a luciferase gene sequence which codes for luciferase from the firefly Photinus pyralis. The third plasmid (C) pRL-TK contains a luciferase gene sequence which codes for the luciferase protein from the Renilla reniformis. The pRL-TK plasmid is used to normalise the expression of firefly luciferase to control for transfection efficiency. The plasmid images are taken from the Promega catalogue.

107
Figure 2.3 Cloning of the FMO1 P2 leader sequence into the pSP-luc+NF fusion vector (A)The pSP-luc vector is shown containing a multiple cloning site upstream of the start site of luciferase and at the end of the
luciferase gene. The vector contains a site for the SP6 bacterial polymerase to bind. (B) The sequence directly upstream of the SP6 binding region and the start of the luciferase gene. (C) Illustration of primers used to amplify the P2 leader sequence. The plasmid image and sequence is taken from the Promega catalogue.

108
2.21 Protein concentration determination Materials
-DC Protein Assay (BioRad). This is a colorimetric assay for protein
concentration. The reaction is based on the Lowry assay (Lowry et al., 1951).
The kit is supplied as two reagents, Reagent A (alkaline copper tartrate
solution) and Reagent B (Folin reagent).
-BSA (1.4 mg/mL) (BioRad).
Method
BSA was used as a standard. Various amounts of BSA, ranging from 2 µg to
20 µg, were pipetted into test tubes. The volume of each sample was adjusted
to 100µL with water. At the same time 10 µL of mouse nuclear protein or cell-
line protein was placed in a test tube and adjusted to 100 µL.
Five-hundred microlitres of reagent A was added to each test tube and
vortexed. Four millilitres of reagent B was added to the tube and the sample
vortexed immediately. The tubes were incubated at room temperature for 30
min. During this time the samples turned blue. The absorbance of each
sample at 750 nm was measured in a spectrophotometer. The standards
were measured to produce a standard curve. The protein concentration of the
sample was determined from the standard curve.

109
2.22 Protein Gel Electrophoresis (SDS/PAGE)
Materials
-Protogel solution (30% w/v acrylamide, 0.8% bisacrylamide (National
Diagnostics). The amount of protogel used determines the acrylamide
concentration of the gel.
-TEMED (BioRad)
-Ammonium Persulfate (10%)
-SDS (0.1%, w/v)
-Tris-HCl (1.5 M, pH8.8)
-Stacking solution (0.5 M Tris-HCl, 0.4% (w/v) SDS, pH 6.8).
-Running buffer (0.025 M Trizma base, 0.192 M Glycine, 0.1% w/v SDS)
-Protein loading buffer (30% v/v glycerol, 0.2% w/v Bromophenol blue, 0.2%
w/v xylene cyanol) (10x)
-SDS PAGE broad range markers (BioRad)
-β-mercaptoethanol
-Coomassie staining solution (0.25% w/v Coomassie brilliant blue dye, 45%
methanol, 10% glacial acetic acid)
-De-staining solution (45% methanol, 10% glacial acetic acid)
Method
The integrity of the proteins from cell-line and tissue nuclear extracts was
assessed by electrophoresis of the extracts on a 10% denaturing SDS-
polyacrylamide gel. 50mL of gel mixture contained 16.65 mL protogel, 12.5mL
Tris-HCl (pH 8.8), 0.1% (v/v) SDS and 19.8 mL water. This solution was
supplemented with 0.5mL of ammonium persulfate and 50 µL TEMED and

110
was poured into a gel mould and overlaid with 0.1% SDS. The gel was
allowed to set overnight.
The resolving gel was overlaid by 10 mL of 3% stacking gel (1.3mL Protogel,
2.5 mL stacking buffer, 6.1 mL water, 50 µL ammonium persulphate and 10
µL TEMED). The stacking gel was left to set for 1 hr.
The protein samples were mixed with an equal volume of loading buffer and
boiled for 3 min. β-mercaptoethanol was added to each sample to a final
concentration of 20% (v/v). The samples were centrifuged for 2 min and
loaded on a gel. The gel was electrophoresed with running buffer at 25 mA
until the proteins stacked and then at 35 mA for separation.
After electrophoresis the gel was stained overnight with Coomassie blue
staining solution.
2.23 Electrophoretic Mobility Shift assay Materials
-Infra-red labelled forward and unlabelled reverse primers (10ng/µl)
-Binding buffer (50 mM hepes (pH 7.6), 2.5 mM DTT, 60% glycerol (v/v), 250
mM NaCl, 0.25% NP40 (Sigma)). Aliquots of buffer were stored at -20ºC.
-Annealing buffer (10x) (0.1 M Tris-HCl (pH 8), 0.1 M MgCl2, 0.5 M NaCl)
-Poly dI/dC (dissolved in 5 mM NaCl to a final concentration of 4µg/µL and
stored in aliquots at -20ºC) (Sigma).

111
-Protogel solution (30% w/v acrylamide, 0.8% bisacrylamide) (National
Diagnostics)
-Tris borate-EDTA buffer (TBE) (10X) (0.89 M Tris-base, 0.09 M Boric acid,
20 mM EDTA (pH 8)).
-TEMED (BioRad)
-Ammonium persulfate (10%) (National Diagnostics)
-60% glycerol
-Proteinase K (1.5 mg/mL) (Qiagen)
-SP1 competitive oligonucleotides (Eurofins MWG)
Method
A 4% non-denaturing polyacrylamide gel was made. 50mL of the gel solution
contained 6.66 mL of protogel, 2.5 mL of TBE (10x), 40.29 mL water, 50µl
TEMED, 50 µL ammonium persulfate. The mixture was poured into a mould
with a comb and the gel was allowed to set at 4ºC overnight.
Nuclear extracts were thawed on ice. 10 µg of extract was mixed with 4 µL of
binding buffer and 1 µL of Poly dI/dC. The volume of the binding reaction was
adjusted to 20 µL with water and incubated on ice for 10 min.
10 ng of an appropriate DNA fragment, which has been labelled at the 5′end
with an IR-700 dye, was added to the binding reaction. The binding reaction
was incubated for a further 30 min to allow nuclear proteins to bind to the
DNA. A binding reaction, without the labelled DNA, was also set-up. Also, in
further reactions proteinase K (5 µg) was added to the binding reaction after
the 30 min incubation. These reactions were further incubated at 37ºC for 15
min, before loading on to the gel.

112
The samples were mixed with 2 µL of 60% glycerol. This is to allow the
sample to enter the wells efficiently. The samples were loaded on to a gel that
had been pre-run for 30 min. This is to allow for the correct flow of charged
ions. The gel was electrophoresed at 150V at 4ºC in 0.5x TBE in a PROTEAN
II xi cell-electrophoresisapparatus (Bio-Rad) for 4 hours. After electrophoresis
the gel was removed with gel plates attached and imaged using an Odyssey®
Infrared Imaging System.
In some instances, 100-fold molar excess of an unlabelled competitor oligo
was added to the binding reaction. The competitor DNA used contained
consensus binding sites for transcription factors predicted to bind within the
FMO1 promoters. Competition oligonucleotides were made by annealing
single stranded oligos to create a double stranded oligo. The oligos were
annealed by adding equimolar amounts of each oligo in 1x annealing buffer.
The oligos were annealed by heating to 95ºC in a heat block for 5 minutes.
The heat block was switched off and cooled to room temperature to allow the
annealing of oligos.
2.24 Real-time PCR Real-time PCR was used to quantify different mouse Fmo1 transcripts. The
cDNA used for real-time PCR experiments were synthesized as described
previously. The Bio-Rad iCycler iQ5 Real-time PCR instrument was used to
carry out all real-time PCR experiments.

113
Materials
-mastermix (PrimerDesign)
-Forward and reverse primers at 10 ng/µL (PrimerDesign)
-cDNA (see section 2.12)
Method
Real-time PCR reactions were made up of 2x master mix, 0.5µM forward and
reverse primers, RNase free water, and cDNA template. A mastermix was
made for each gene to be quantified. This contained 2x mastermix, 0.5 µM
forward and reverse primers, and RNase free water. The mastermix was
added to wells of a 96-well plate. The cDNA to be used was diluted by 10-fold
prior to its production. Five microlitres of the diluted cDNA was individually
added to each well. The plates were centrifuged briefly in a 5804 Eppendorf
centrifuge at a speed of 1000 rpm. The samples were analysed using the Bio-
Rad iCycler iQ5 Real-time PCR instrument. Amplification parameters are
shown in table 2.2. The annealing temperature was set at 60ºC as all primers
used are designed to amplify most efficiently at this temperature. After
amplification, a melt curve was undertaken to determine the number of
products being formed within the PCR reaction.

114
Programme Cycle and temperature Time
Programme 1 1 cycle
95°C 10 min
annealing temp/extension 1 min
Programme 2 40 cycles
95°C 15 sec
annealing temp/extension 1 min
Programme 3 80 cycles
60°+0.5°C 10 sec
Table 2.2 PCR cycling used for quantitative real time PCR Cycling reactions shown above were used for all real-time PCR experiments. Cycling conditions for a DNA melt curve are shown as Programme 3.

115
2.24.1 Calculation of relative amounts of FMO1 transcripts within and between tissues The quantities obtained from the Bio-Rad iCycler iQ5 Real-time PCR
instrument are ct values. A ct value is the cycle number at which the
exponential phase of the amplified product is observed. The point at which the
Ctvalue is taken is manually determined. The ΔΔCtmethod was used to
calculate fold differences between samples and relative differences in
amount. The ΔΔCt makes the assumption that the number of amplicons
doubles after each cycle. This assumption can be made in these real-time
PCR experiments as the primers have been pre-determined to be close to
100% efficient. The data can be expressed in fold difference or relative
quantities. I have used both throughout my research.
To determine fold difference between samples, the ct value is normalised to
the reference gene ct value for that sample. This gives a relative Ct value.
This Ct value is then converted from a logarithmic function to a linear function.
This value will represent the relative number of molecules of the transcript
within the sample. This value, which comparisons would be made to, is
converted to 1 and all other values will be relative to this.
To determine the relative difference the Ct value is linearly converted before
being normalised to the reference gene. The linear function of the sample is
normalised by the linear function of the reference gene by dividing the sample
into the reference value. This gives a sample value relative to the reference
gene.

116
2.25 3T3-L1 differentiation
Materials
-3T3-L1 cells were purchased from the ECACC™ and ATCC™®
-3T3-L1 pre-adipocyte medium -DMEM with 4 mM L-glutamine adjusted to contain
1.5 g/L sodium bicarbonate and 4.5 g/L glucose [ATCC™®; Cat. No. 30-2002], 90%;
calf bovine serum, and 10% [ATCC™®; Cat. No. 30-2030]
-3T3-L1 Differentiation medium (ZenBio) (cat# DM-2-L1) – DMEM / Ham‟s F – 12
medium (1:1, v/v), HEPES pH 7.4, Foetal bovine serum (FBS), biotin, pantothenate,
human Insulin, dexamethasone, penicillin, streptomycin, amphotericin B,
isobutylmethylxanthine, PPARγ agonist.
-3T3-L1 Adipocyte medium (ZenBio) (cat# AM-1-L1) - DMEM / Ham‟s F – 12
medium (1:1, v/v), HEPES pH 7.4, foetal bovine serum (FBS), biotin, pantothenate,
human insulin, dexamethasone, penicillin, streptomycin, amphotericin B.
Method
Upon arrival from the supplier, 3T3-L1 cells were plated and grown in 3T3-L1 pre-
adipocyte medium to a low density (30-50%) and then were stored in DMSO within
liquid nitrogen. This is to ensure the cells do not contact each other, as this will result
in differentiation being compromised. A new stock of cells was used every time a
differentiation experiment was undertaken. Cells were seeded into Nunclone T75
tissue culture flasks (MG scientific) and grown in a Heraeus incubator at 37ºC. At
50% confluency, cells were washed twice with PBS, detached with 0.25% trypsin-
EDTA in 1x PBS and pelleted by centrifugation at 1900 rpm for 2 min, at room
temperature, in a bench top centrifuge (Tube). The pellet was resuspended in pre-
adipocyte medium and seeded into either Nunc T75 flasks or 24-well tissue culture

117
plates depending on the amount of adipocytes required. Cells were grown to 100%
confluency in 1mL of pre-adipocyte media (24-well plate) or 20mL (T75 flask) and left
for a further two days. The pre-adipocyte media was removed and replaced with
3T3-L1 differentiation media. This remained on the cells for 3 days. A percentage of
the 3T3-L1 differentiation media was removed (0.6 mL for 24-well format, 12 mL for
T75 format) and replaced with 3T3-L1 maintenance media (0.8 mL for 24-well
format, and 16 mL for T75 format). The cells were left for at least a further seven
days before cells were used for experiments. The media was changed every 2-3
days depending on media coloration.
2.26 3T3-L1 adipocyte nucleofection Materials
-3T3-L1 adipocytes (see section 1.20)
-Nuceleofector solution L (Lonza)
-DMEM [ATCC™®; Cat. No.30-2002], 10% foetal bovine serum [ATCC™®; Cat. No.
30-2020]
-Plasmid DNA
Method 3T3-L1 adipocytes were differentiated as described previously. Cell-culture medium
was removed from the adipocytes. The cells were washed once with PBS and
subsequently trypsinised using 0.25% Trypsin-EDTA. Cells were incubated for 10
minutes at 37ºC. Cells were removed and the solution within the flask moved around
the cell to help cells to become detached. Once cells were detached, the trypsin was
neutralised using post-differentiation medium. The cells were pipetted up and down
to remove clumps of cells. The culture media was pipetted into Falcon tubes and

118
centrifuged at 90 g for 10 minutes at room temp. Cell media was removed
completely. 100 µL of nucleofector solution L was added to the cell pellet and pellets
gently resuspended by pipetting up and down. Once resuspended, the DNA for
transfection was added to the cell/solution L sample and mixed gently by pipetting.
This solution was then transferred to a cuvette and placed in the nucleofector. The
nucleofection conditions have been pre-optimised; by the manufacturer, for 3T3-L1
adipocytes and the program used is A-033. After nucleofection the cells were
transferred directly into an 18 mm gelatin-coated culture dish, which had been pre-
incubated at 37ºC, and contained post-differentiation media. The cells were gently
placed into the incubator and left overnight. The next day the media was changed to
remove dead cells (caused as a result of the nucleofection). Reporter gene assays
were carried out after 48 hr using the dual reporter luciferase assay (described in
section 2.18).
2.27In-vitro RNA production Materials
-Plasmid template
-mMESSAGE mMACHINE® kit (Ambion) containing:
-SP6 Enzyme mix – buffered 50% glycerol containing RNA polymerase, RNase
inhibitor, and other components
-10x Reaction buffer
-2xNTP/CAP – neutralised buffer solution containing 10 mM ATP, CTP, UTP and 2
mM GTP and 8 mM cap analogue
-TURBO DNase I (2U/µl)

119
-Ammonium acetate stop solution – 5 M ammonium acetate solution, 100 mM EDTA
-Lithium chloride precipitation solution - 7.5 M lithium chloride, 50 mM EDTA
Method
RNA was transcribed in vitro from the pSP-luc plasmid containing the FMO1 P2
leader sequence (see section 2.20.2 for cloning protocol). The plasmid was first
linearised with restriction digest (see section 2.7) and was purified by being passed
through a Qiagen silica based column (see section 2.9.1). The DNA was quantified
spectrophetomically (see section 2.4).
1 µg of DNA was added to a microfuge tube. 10 µl of 2xNTP/CAP, 2 µL 10x reaction
buffer and 2 µL of enzyme mix was added to this and made up to a total reaction
volume of 20 µL. The reaction mixture was incubated for 2h at 37ºC. 1 µL of turbo
DNase I was added and the reaction was incubated for a further 15 min to digest the
template DNA. The RNA produced from the reaction was purified by lithium chloride
precipitation. Thirty microlitres of nuclease free water and 30µl of lithium chloride
precipitation solution. This solution is chilled for 1 hour at -20oC. The solution is
centrifuged at 13,000 rpm in a benchtop centrifuge for 15 min. The solution was
decanted and ~1.4 mL of 70% ethanol added to the RNA pellet. The solution was
centrifuged for 1 min at 13,000 rpm. The RNA pellet was air dried and resuspended
in 20 µL of nuclease free water.
2.28 Phusion® site-directed mutagenesis Method

120
The Phusion describes the enzyme used in the mutagenesis protocol. It is a highly
efficient, accurate, hot-start DNA polymerase. Site-directed mutagenesis occurs
through replication of the template DNA. Primers were designed to replicate the
plasmid template and to introduce the desired mutation in the replicated products.
The primers are designed back to back so to replicate the whole plasmid template
resulting in linear PCR products representing the whole plasmid sequence.
To introduce a single point mutation the middle of the forward primer contains the
desired point mutation. The reverse primer is designed back to back to this primer.
To create deletions, primers are designed back to back surrounding the DNA
sequence that you wish to delete. This results in the amplified products of the
template containing the desired point mutation or removing the sequence which is
not amplified.
2.28.1 FMO1 promoter mutation constructs The FMO1 pGL3 reporter constructs pGL-255_-128 and pGL-858_-343 was used as
templates to create mutant reporter constructs. Two reporter gene constructs,
containing point mutations within the pGL-255_-128, were made. Three reporter
gene constructs, two of which contained point mutations and a third with a deletion
was created (see results chapter 4.7 for location).
The site-directed mutagenesis reaction was set-up with 5x Phusion high fidelity
buffer (10µL), 10 mM dNTPs, forward and reverse primers (0.5 µM) and the template
DNA (1 ng). The reaction was made up to 50 µL with nuclease free water.

121
Amplification parameters are shown in table 2.3. The annealing temperature is
recommended from 65-72ºC and was arbitrarily chosen at 65ºC. This was successful
for all mutagenesis reactions.
The products of the replication are linear. The primers used were 5′ phosphorylated.
The two linear strands were ligated to form circular DNA. The ligation reaction
contained 25 ng of the mutagenesis product, 5 µL of 2x T4 Quick-stick ligation buffer
mix. 0.5µl of quick T4 DNA ligase, and the reaction was made up to 5 µL. The
reaction was left at room temperature for 5 minutes then transformed into competent
cells (see section 2.5 for transformation protocol).
Programme Temperature Time
Programme 1 1 cycle
95°C 10 min
65°C 30 sec
72°C 10 min
Programme 2 25 cycles
95°C 10 sec
annealing temp 30 sec
72°C 10 min
Programme 3 1 cycle
72°C 10min
Table 2.3 PCR cycling conditions for site-directed mutagenesis
2.29 DNA sequencing Materials
-ABI BigDye Terminator v3.1 Cycle Sequencing Kit (cat no. 4336917)

122
-2/3rds HM-MC (40% PEG-8000), 1 M NaCl, 2 mM Tris-HCl pH9, 0.2mM EDTA, 3.5
mM MgCl2).
-HM Better Buffer, 200 mM Tris-HCl pH9, 5 mM MgCl2
Method
2.29.1 PCR for sequencing DNA was first amplified by PCR in 96-well plates (see 2.11). The PCR products were
cleaned within the 96-well plate. 3x volume (30 µL) HM-MC was added to each PCR
reaction (10 µL), a lid applied to each plate, and the contents were thoroughly mixed.
The plates were centrifuged at 4000 rpm within a Centra 4b centrifuge to pellet the
DNA. The lids were removed, and the plates inverted on tissue paper and placed
back into the centrifuge. The plates were centrifuged at 20 g for 30 s and inverted on
tissue paper to remove the HM-MC along with free nucleotides and other reagents
from the PCR reaction. One-hundred and fifty microlitres of ethanol was added to the
pelleted DNA, the lid replaced, and the samples centrifuged for 25 min at 4000 rpm
in the Centra 4b centrifuge. The plates were removed from the centrifuge, inverted
on to tissue paper, and centrifuged at 20 g for 30 sec. This removes salts from the
DNA. The lids were removed and the plate left to stand for the pellets to dry. 10 µL of
nuclease-free water was added to the DNA pellets and samples were left for 15 min
to allow DNA to resuspend.

123
2.29.2 Sequencing reaction The amount of DNA to be used within the sequencing reaction was determined by
electrophoresis of 1 µL of cleaned PCR product. If a strong band was visualised, 2
µL of the PCR product would be used in the sequencing reaction. Two separate
master mixes were made, one for a forward sequencing reaction, and one for a
reverse sequencing reaction. These reactions were made up of 5 x ABI buffer (2 µL
per reaction), Big Dye v3.1 (0.5 µL), primers (1 µL each at 1.6 µM), The reaction is
made up to 8 µL with water. For a 96-well plate this was scaled up to 100 reactions
per sequencing reaction. 8 µL of the mastermix is added to each PCR product. The
sequencing reactions are carried out with the conditions set out in table 4.
2.29.3 Cleaning the sequencing reaction The sequence reactions are mixed with 2.5 µL of 125 µM EDTA and then 30 µL of
100% ethanol was added to each well. The contents of the wells are thoroughly
mixed and centrifuged at 4000 rpm for 60 min. The plates were removed and
inverted on tissue paper and centrifuged at 100 rpm for 1 min. 30 µL of 70% of
ethanol was added to the wells and the samples centrifuged for 20 min at 4000 rpm.
The plates were inverted on to tissue paper and centrifuged at 100 rpm for 1 min.
The lids of the plate were removed and the samples air-dried for 15 min at room
temperature. The samples were analysed using the Applied Biosystems Genetic
Analyzer 3730.

124
2.29.4 Phase haplotype reconstruction The programme Sequencher was used to identify genetic polymorphism in
individuals within the sequenced promoter regions. A database was created in
Microsoft Excel of genotype data of the individuals sequenced. The genotypes of
each individual were ordered as they appear along the chromosome in a text
document. Haplotypes were constructed for each population studied (see chapter 5
for populations and analysis) using PHASE software (Stephens et al., 2001).
2.30DNaseI capillary footprinting The development of a method for analysing regulatory polymorphism is described in
chapter 6. The method describes the use of capillary DNase I footprinting to test the
effects of regulatory polymorphism. The main method is set out within this chapter.
The method for DNase I digestion, the binding reaction and dideoxy termination
sequencing is set out below.
2.30.1 Labelling DNA
The template used for footprinting was labelled using PCR. The 5′ primer contained
a fluorescent protein FAM. The amplified products from the PCR therefore
contained the 5‟ FAM label. The PCR method is set out in section 2.11.
2.30.2 Binding reaction
Materials
-FAM labelled forward and unlabelled reverse primers (10 ng/µl)
125
-Binding buffer (50 mM hepes (pH 7.6), 2.5 mM DTT, 60% glycerol (v/v), 250 mM
NaCl, 0.25% NP40 (Sigma)). Aliquots of buffer were stored at -20ºC.
-Poly dI/dC (dissolved in 5 mM NaCl to a final concentration of 4 µg/µl and stored in
aliquots at -20ºC) (Sigma).
Method
- A 50 µL total reaction volume was used. The Binding buffer (5x), primers (1 µL of
each), 1 µL of poly dI-dC and dH2O was added to a chilled tube on ice for 5 minutes.
Fifty ng of template DNA was added and the mixture was gently mixed using a
pipette tip. The binding reaction was left for 30 min to allow for DNA-Protein binding
to take place.
2.30.3 DNase I digestion
Materials
DNase I, 2000U/ µl (NEB)
1X DNase I Reaction Buffer: 10 mM Tris-HCl, 2.5 mM MgCl20.5 mM CaCl2 (NEB)
Method
After 30 minutes of the binding reaction 50 µL of DNase1 reaction buffer is gently
added. 0.005 U of DNase I enzyme is added and the sample is left for 5 min at room
temperature. The reaction is terminated by the addition of 100 µL of 0.5 M EDTA.
Once terminated the DNA is purified as described in section 2.9.

126
2.30.4 Capillary electrophoresis and data analysis
The materials and methods are set out in section 6.2.5.
2.30.5 Dye terminator sequencing Materials
-Plasmid DNA (template).
-Thermo Sequenase Dye Primer Manual Cycle Sequencing Kit (USB CORP)
containing:
-Reaction Buffer (concentrate): 150mM Tris-HCl pH9.5, 35mM MgCl2
-ddA Term Mix: 300 μM each of dATP, dCTP, dTTP & 7-deaza-dGTP, 3 μM ddATP
-ddC Term Mix: 300 μM each of dATP, dCTP, dTTP & 7-deaza-dGTP, 3 μM ddCTP
-ddG Term Mix: 300 μM each of dATP, dCTP, dTTP & 7-deaza-dGTP, 3 μM ddGTP
-ddC Term Mix: 300 μM each of dATP, dCTP, dTTP & 7-deaza-dGTP, 3 μM ddTTP
-Thermo Sequenase DNA polymerase: 20 U/μL with 0.03 U/μL Thermoplasma
Acidophilum inorganic pyrophosphatase in 50 mM Tris-HCl pH 8.0, 1 mM EDTA,
1 mM DTT, 0.5% Tween-20, 0.5% Nonidet™ P-40, 50% glycerol.
Method
The Dye termination sequencing reactions were setup as follows: A mastermix was
made containing 200 ng plasmid DNA (template), 2.2 µL of reaction buffer, 1µL
labelled primer (FAM), this is made up to a volume of 19 µL with nuclease free water.
1 µL of the Thermosequenase enzyme is added to the mastermix. 4 µL of the mix is
aliquoted into 4 tubes (kept on ice), one tube for each of the terminating nucleotides.
Each nucleotide termination mix is added to the appropriate tube. The tubes are

127
mixed and dye terminator sequencing reactions are carried out using the
amplification procedure shown in the table below.
Programme Temperature Time
Programme 1 40 cycles
95°C 30 sec
55°C 30 sec
72°C 60 sec
Table 2.4 Amplification parameters used for dye-terminator sequencing reactions
2.31 Software Packages Transcription factor binding prediction tools
-PROMO v3.0 (Messeguer et al., 2002),
http://alggen.lsi.upc.es/recerca/menu_recerca.htmL
A virtual laboratory for the study of transcription factor binding sites in DNA
sequences
-Ali Baba v2.1, http://www.gene-regulation.com/pub/programs/alibaba2/index.htmL
-MatInspector 8.0 (Cartharius et al., 2005),
http://www.genomatix.de/online_help/help_matinspector/matinspector_help.htmL
-ApE plasmid editor v2.0
Sequence alignment and primer design
-ApE plasmid editor v2.0
Haplotype phase construction

128
-PHASE (Stephens et al., 2001)
Di-deoxy sequence analysis
-Sequencher® v4.10.1
-geNORM http://medgen.ugent.be/~jvdesomp/genorm/geNorm_manual.pdf

129
Chapter 3
Profiling of Fmo1 gene expression in
mouse tissues and cell-lines
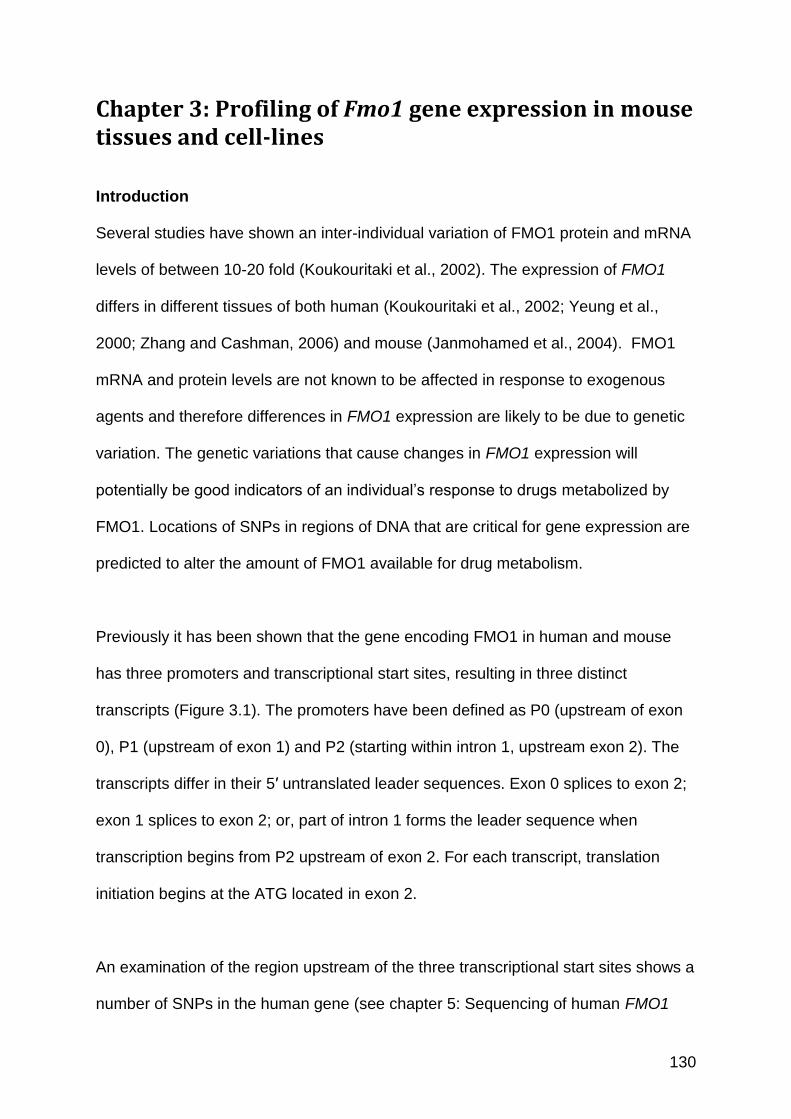
130
Chapter 3: Profiling of Fmo1 gene expression in mouse tissues and cell-lines
Introduction
Several studies have shown an inter-individual variation of FMO1 protein and mRNA
levels of between 10-20 fold (Koukouritaki et al., 2002). The expression of FMO1
differs in different tissues of both human (Koukouritaki et al., 2002; Yeung et al.,
2000; Zhang and Cashman, 2006) and mouse (Janmohamed et al., 2004). FMO1
mRNA and protein levels are not known to be affected in response to exogenous
agents and therefore differences in FMO1 expression are likely to be due to genetic
variation. The genetic variations that cause changes in FMO1 expression will
potentially be good indicators of an individual‟s response to drugs metabolized by
FMO1. Locations of SNPs in regions of DNA that are critical for gene expression are
predicted to alter the amount of FMO1 available for drug metabolism.
Previously it has been shown that the gene encoding FMO1 in human and mouse
has three promoters and transcriptional start sites, resulting in three distinct
transcripts (Figure 3.1). The promoters have been defined as P0 (upstream of exon
0), P1 (upstream of exon 1) and P2 (starting within intron 1, upstream exon 2). The
transcripts differ in their 5′ untranslated leader sequences. Exon 0 splices to exon 2;
exon 1 splices to exon 2; or, part of intron 1 forms the leader sequence when
transcription begins from P2 upstream of exon 2. For each transcript, translation
initiation begins at the ATG located in exon 2.
An examination of the region upstream of the three transcriptional start sites shows a
number of SNPs in the human gene (see chapter 5: Sequencing of human FMO1

131
promoters). This variation suggests that differences in promoter base sequence may
be a source of the variability, observed in the amount of FMO1, in different
individuals. A number of studies have shown the effect of polymorphisms within
promoter regions that affect mRNA production of genes for other drug metabolizing
enzymes (Johnson et al., 2005).
As mentioned above, the expression of the gene for FMO1 is different in different
tissues. We would therefore like to know which of the three promoters is used in
different tissues. SNPs shown to affect a tissue-specific promoter may influence
expression of the protein in a single tissue or a limited number of tissues. This
chapter describes promoter usage of the Fmo1 gene in different tissues of the
mouse and in selected cell lines.
Fmo1 (-/-), Fmo2 (-/-), Fmo4 (-/-) mice show a phenotype of altered energy
homeostasis (Omar, 2009; Veeravalli et al., Unpublished). The knockout mice have
less fat than age-matched, wild-type mice and the ratio of pre-adipocytes to
adipocytes is altered. To further understand the role of FMO1 in fat, and to
understand the regulation of the gene in this tissue, we have used 3T3-L1 fibroblast
cells that have been differentiated in vitro into adipocytes (see Chapter 1:
Introduction). Each of the three Fmo1 transcripts has been quantified at different
stages of 3T3-L1 cell differentiation.

132
3.1 Quantification of the expression of Fmo1 in different mouse tissues by real-time PCR Figure 3.1 shows the different splicing events that produce the three different
transcripts of the FMO1 gene. The same splicing events occur in both human and
mouse. Previously P0 has been shown to be active in mouse liver, and P1 and P2 in
mouse kidney (Shephard et al., 2007). Primer pairs were designed to amplify regions
specific to each of the three alternatively spliced transcripts (see Figure 1.4). In
addition to the quantification of each individual transcript in a tissue, the total FMO1
transcript was also quantified using primers designed to amplify the protein-coding
region. The primers used are given in the appendix. Quantifying each individual
transcript and the total FMO1 transcript amounts in a tissue/cell line will reveal, for
example, if there are additional, unknown transcripts or if there is attenuation of
transcription from different promoters.
3.1.1 Selection of reference genes to normalise Fmo1 expression To normalise the quantity of Fmo1 transcripts produced in different tissues,
reference genes were co-amplified in the PCR reaction. The reference gene is one
that is expressed at the same level in the different tissues tested, and controls for
differences in the amount of RNA in each sample to be amplified. There are a
number of reference genes that are classically chosen for this purpose. However, the
expression of these traditionally chosen genes can vary between samples depending
on the tissue or biological context. Because FMO1 mRNA expression levels were to
be quantified in six different tissues, a selection of reference genes was tested for
their expression variability between the different mouse tissues to be analysed. This

133
would ensure accurate quantification of Fmo1 expression within the different mouse
tissues.
A published algorithm called geNorm was used to choose the most stably expressed
genes in each tissue (Vandesompele et al., 2002). The geNorm algorithm functions
by comparing the expression profile of each reference gene with all other reference
genes tested. The reference genes with the most similar profile to the other
reference genes will be those whose expression is most constant in a tissue.
The algorithm ranks the stability of the reference genes. This is achieved by
calculating the standard deviation between the logarithmically transformed
expression ratios (Figure 3.1A). The average standard deviation (M) is calculated for
each reference gene compared to the other reference genes. The lower the value of
M, the more stable the expression of the gene between different tissues. The most
stably expressed genes between the different mouse tissues were found to be β-
actin and calnexin (CANX), a gene that encodes a member of the calnexin family of
molecular chaperones (Figure 3.1B).
The geNorm algorithm calculates the pairwise variation between the reference genes
in different tissues. The number of reference genes to use to normalise gene
expression is dependent on the amount of variation observed between the different
reference genes. The amount of pairwise variation between the reference genes
analysed in different mouse tissues is high (Figure 3.1C). This is to be expected as a
number of diverse tissues were tested. Thus, to define gene expression accurately,
between the different tissues, a number of reference genes need to be analysed.
This will ensure accurate gene expression comparisons between different tissues.

134
The algorithm predicts higher accuracy of gene expression when three reference
genes are used compared to two. The three most stably expressed reference genes
were elf4e, CANX, and β-actin. These genes were chosen to normalise Fmo1 gene
expression in the different mouse tissues. The data given throughout the thesis has
been normalised to CANX.
The primers for quantifying Fmo1 transcripts were designed by the company Primer
Design (http://www.primerdesign.co.uk/) to be 100% efficient in their amplification
and therefore the quantity of each Fmo1 transcript can be compared to each-other.
When primer efficiencies are not comparable it can lead to differences in
amplification and therefore the amounts of different mRNAs cannot be compared
accurately.
The tissues analysed for Fmo1 expression by quantitative real-time PCR were
kidney, liver, white and brown fat, brain, lung and muscle. Kidney and liver were
chosen as these tissues are known to express Fmo1 and are key tissues in drug
detoxification. The other extra-hepatic tissues which were examined play roles in
energy homeostasis. In mouse kidney, FMO1 cDNAs have been observed starting
from the P0, P1 and P2 transcriptional start site. Only the P0 transcript is observed in
the liver. It has not yet been determined which transcripts are produced in the other
tissues to be investigated.

135
Figure 3.1 Selection of suitable reference genes for the normalisation of Fmo1 expression in different mouse tissues (A) The table shows the expression of each reference gene relative to each other in different mouse tissues. (B) The average expression stability of each reference gene. This is calculated from the pairwise variation of each reference gene when compared to other reference genes. (C) The optimal number of reference genes to be used to accurately define gene expression. CANX and β-actin are shown to be equally stable. The data throughout the thesis is normalised to CANX.

136
3.1.2 Quantification of the FMO1 global transcript in different mouse tissues
Using primers designed within the protein-coding region the total transcript amount
for FMO1 was determined (Figure 3.2). This is referred to as the global expression.
Fmo1 expression is highest in the kidney, where global expression in this tissue,
relative to the reference gene CANX, is 6.2 ± 4.4. Global expression was measured
in lung (3.7 ± 0.71), brown fat (3.7 ± 1.59), white fat (1.6 ± 0.44) muscle (0.55 ± 0.15)
and brain (0.06 ± 0.01). The high standard error shown in kidney was due to the
variation in expression between triplicate mice.
It has previously been shown by protein and mRNA quantification methods that
Fmo1 is expressed highly in the kidney. This validates the data obtained by RT-PCR.
It has previously been shown that FMO1 is expressed in brown and white fat. The
RT-PCR data confirms and extends this data. Because Fmo1 is highly expressed
within these tissues it seems probable that the enzyme plays some role in fat. FMO1
is known to be expressed in lung, and the RT-PCR data show that the amount is
high and similar to that found in white and brown fat. Fmo1 is expressed in muscle at
about 10% of the amount present in kidney. In brain, the Fmo1 global transcript is
expressed at a low level compared to the reference gene.

137
Figure 3.2 Global Fmo1 expression in different mouse tissues The bar graph shows Fmo1 global expression levels relative to the CANX reference gene in different tissues. From left to right: white fat (WF), lung, muscle (MUS), brain, brown fat (BF), kidney (KID) and liver. All experiments were done in triplicate and the error bars represent the standard error.

138
3.1.3 Quantification in different mouse tissues of the P0, P1 and P2
FMO1 mRNA transcripts (Figure 3.3).
In kidney the P1 transcript is the most highly expressed, while the transcripts from
P0 and P2 are both low and only represent about 1% of the transcript produced from
the P1 promoter (Figure 3.3). Therefore the P1 transcript constitutes the majority of
FMO1 transcripts in mouse kidney. P1 is also the predominant transcript found in
brown fat, brain and muscle (Figure 3.3). In brown fat the P1 transcript is about 80%
higher than the P0 and P2 transcripts. In brain, the P1 transcript is about 95% more
abundant than each of the P0 and P2 transcripts. In white fat and muscle the P1
transcript is about 90% more abundant than the P0 and P2 transcripts. In contrast, in
the lung, both P0 and P1 transcripts are abundantly expressed at similar levels
(Figure 3.3). The P2 transcript makes up only about 1% of the FMO1 transcripts in
the lung. The P0 transcript is the only transcript present within the liver.
3.1.4 The relative expression of the P0, P1 and P2 transcripts
combined to that of the global expression of FMO1 mRNA (Figure 3.4)
The P0, P1 and P2 transcripts were each quantified by amplification of transcript
specific sequences. This was achieved by using an upstream, leader-specific,
forward primer. The global FMO1 transcript was quantified using primers located
within the protein-coding region that is present within transcripts that are expected to
be translated into FMO1 protein.
In brown fat, kidney, and liver the global transcript amount is similar to that of the
combined P0, P1, P2 transcripts. The expression of the P0, P1 and P2 transcripts in
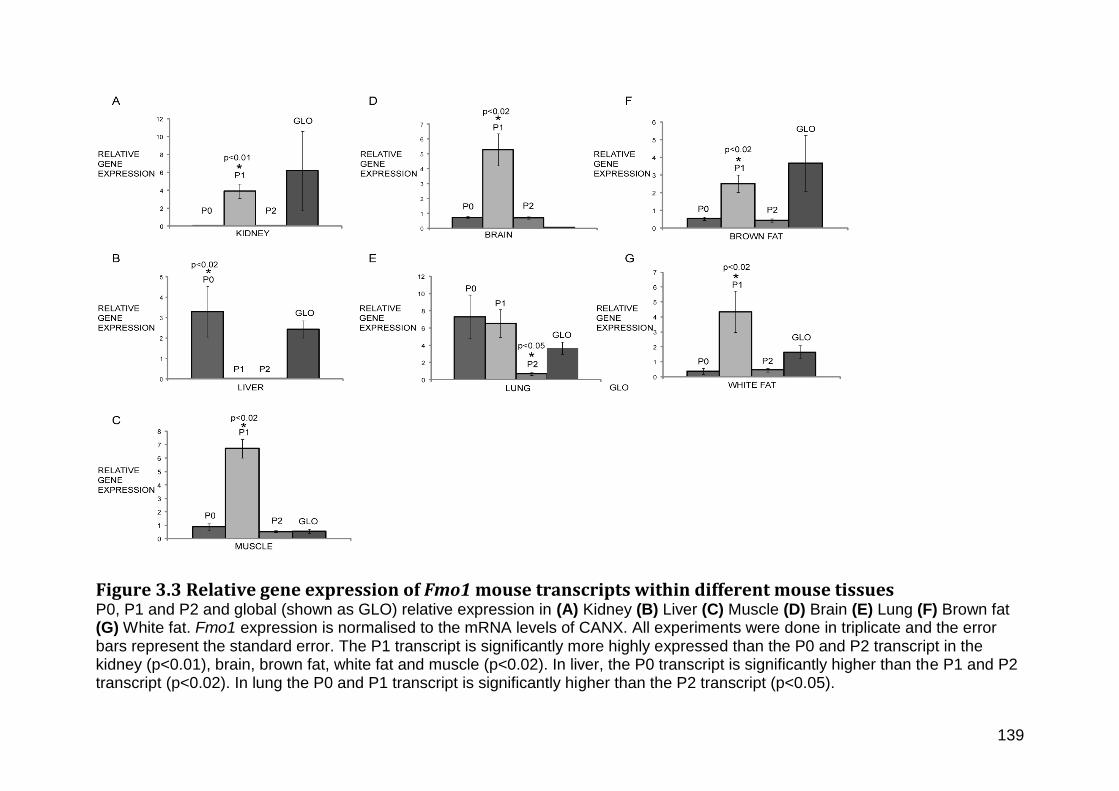
139
Figure 3.3 Relative gene expression of Fmo1 mouse transcripts within different mouse tissues
P0, P1 and P2 and global (shown as GLO) relative expression in (A) Kidney (B) Liver (C) Muscle (D) Brain (E) Lung (F) Brown fat (G) White fat. Fmo1 expression is normalised to the mRNA levels of CANX. All experiments were done in triplicate and the error bars represent the standard error. The P1 transcript is significantly more highly expressed than the P0 and P2 transcript in the kidney (p<0.01), brain, brown fat, white fat and muscle (p<0.02). In liver, the P0 transcript is significantly higher than the P1 and P2 transcript (p<0.02). In lung the P0 and P1 transcript is significantly higher than the P2 transcript (p<0.05).

140
kidney is 1.65 ± 0.64 higher than the global expression. In brown fat, the expression
of P0, P1 and P2 added together is 1.27 ± 0.58 times higher than the global
expression. In liver, the expression of P0, P1 and P2 added together is 1.32 ± 0.2
higher than the global expression. These differences are not significant and therefore
it is likely that the P0, P1 and P2 transcripts account for the overall Fmo1 global
expression within these tissues.
In the lung, white fat, brain, and muscle, the expression of P0, P1 and P2 added
together is significantly different from the global expression. In the lung the P0, P1
and P2 transcripts added together are 4.13 ± 0.29 times higher than the global
expression. These differences are significant (p<0.02). In white fat, the expression of
P0, P1 and P2 added together is 3.07 ± 0.27 times higher than the global
expression. This expression difference is significant (p<0.03). In brain, the
expression of P0, P1 and P2 added together is 116.9 ± 21.42 times higher than the
global expression. This expression difference is significant (p<0.006). In muscle, the
expression of P0, P1 and P2 added together is 16.1 ± 4.4 times higher than the
global expression. This expression difference is not significant (p<0.08).
It seems likely that these differences are due to the production of shorter, attenuated
transcripts. These transcripts may contain only the 5′ region of the mRNA and would
be detected only when primers are used that amplify from within the 5′ leader
sequence. The relative expression data of P0, P1 and P2 transcripts (Figure 3.4)
indicate that attenuated transcription is most likely from the P1 promoter.
In whole brain, Fmo1 global expression is 0.06 ± 0.01 fold higher than the reference
gene and shows very little variation between mice. This is a relatively low amount of

141
expression relative to the other mouse tissues quantified for Fmo1 expression.
However, the brain is a complex tissue and the expression of Fmo1 is localised to
neurons of the cerebrum and in the choroid plexus (Janmohamed et al., 2004). The
combined P0, P1 and P2 transcript amount in brain is about 100-fold higher than that
of the global FMO1 mRNA amount. Each individual transcript is present in amounts
greater than that of the global transcript. Therefore, it seems that in the brain,
transcription is attenuated from each of the three promoters. FMO1 protein is,
however, present in mouse brain (Hernandez et al., 2009; Itoh et al., 1997). The
results suggest that the amounts of protein produced might be tightly regulated via
an as yet unknown mechanism of transcription attenuation.
In muscle Fmo1 global expression is 0.55 ± 0.15 relative to the reference gene. The
total, combined, relative expression of the P0, P1 and P2 transcripts is 8.1 ± 0.98.
This represents a 15-fold higher expression of the individual transcripts than that of
the global transcript. This increase is mostly due to the abundance of P1 transcripts.
As with other tissues, transcription from P1 seems highly active, but transcription
seems to be attenuated.

142
Figure 3.4 Comparison of the total relative expression of the Fmo1 P0, P1, and P2 transcripts with the relative expression of the Fmo1 global transcript (A) Relative expression of the P0, P1 and P2 transcripts next to the Fmo1 global expression for ease of comparison in brain and muscle.(B)Relative expression of the P0, P1 and P2 transcripts next to the Fmo1 global expression for ease of comparison in brown fat, white fat, kidney, liver and lung. All transcript expression was normalised to the expression of the CANX gene. All values shown are relative to CANX gene expression within each tissue. All experiments were done in triplicate and the error bars represent the standard error.

143
3.2 Expression of Fmo1 in 3T3-L1 cells undergoing differentiation to adipocytes A Fmo1 mouse knock-out line has led to advances in understanding an endogenous
role for FMO1. The phenotype of the mouse indicates that FMO1 plays a role in the
regulation of energy homeostasis. The mice have decreased body weight and
decreased amounts of white adipose tissue. The mouse transcriptome microarray
(Su et al., 2002) and quantitative real-time data generated in our laboratory confirm
the expression of FMO1 mRNA within white adipose tissue. Initial experiments
carried out in undifferentiated 3T3-L1 cells show no expression of FMO1 mRNA.
However, when differentiated into adipocytes, Fmo1 expression is switched on. The
results are described in the next section. The rationale for examining Fmo1
expression in differentiated cells is several-fold. 1. We will be able to identify the
Fmo1 promoter used and activated in this cell type. 2. This will provide an
experimental model for determining the transcription factors involved in regulating
Fmo1 expression in adipocytes. 3. Any SNPs identified within the promoter region
used in adipocytes can be introduced by site-directed mutagenesis and their
influence on transcription tested using a reporter gene assay.
3.2.1 Fmo1 expression during differentiation of the EACC™, 3T3-L1 mouse fibroblast cell line The cell line that was used for our initial analysis of Fmo1 expression was obtained
from the EACC™. The cell line is able to differentiate into adipocytes, but we
encountered some problems with this line. The cells are able to differentiate into
adipocytes but the efficiency is low. Only 30-40% of the cells differentiate due to the
cells‟ loss of ability to be contact inhibited (Figure 3.5). Contact inhibition of cells is a

144
key process in the differentiation process. The cells that did differentiate required
more than ten days to appear visually as adipocyte-like cells. Quantification of
adipocyte markers by RT-PCR was carried out to ensure adipocyte differentiation
had occurred. GAPDH was chosen as the house-keeping gene as it was previously
shown to be one of the most stable genes during adipocyte differentiation
(Gorzelniak et al., 2001). The 3T3-L1 cells did express Lipoprotein Lipase, PPAR-γ,
and FABP which are markers of mature adipocytes (Figure 3.6). The adipocyte
markers PPAR-γ and LPL expression is 200-fold higher in 3T3-L1 adipocytes
compared to 3T3-L1 pre-adipocyte expression. The adipocyte marker FABP
expression is 800-fold higher in 3T3-L1 adipocytes compared to 3T3-L1 pre-
adipocytes. Fmo1 expression is 200 fold higher in 3T3-L1 adipocytes compared to
3T3-L1 fibroblasts. Experiments on Fmo1 transcript expression during differentiation
was initially carried out within these cells. However, because the differentiation of
these cells was not consistent, a 3T3-L1 cell line was purchased from the
ATCC™™. This cell line is able to be contact inhibited when differentiated. These
cells were very consistently and efficiently differentiated with 95-100% efficiency
(Figure 3.7). The experiments on the quantification of Fmo1 mRNA transcripts during
differentiation were repeated in this cell line and are described below.
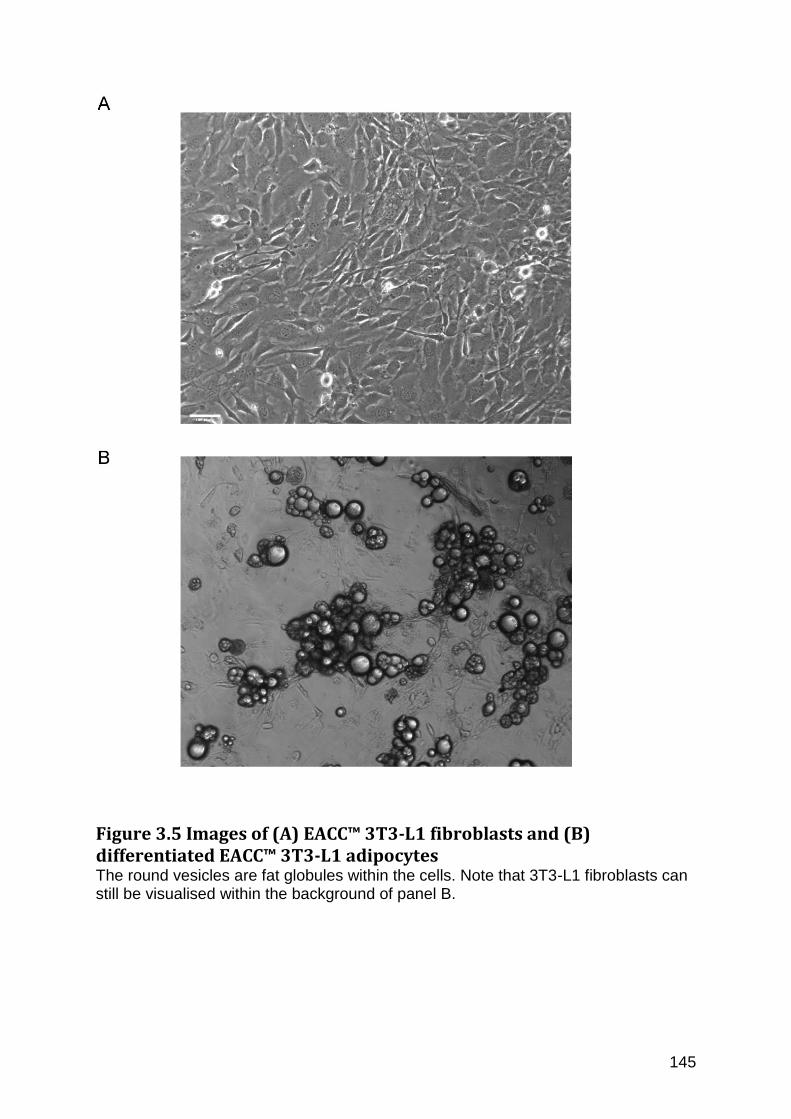
145
Figure 3.5 Images of (A) EACC™ 3T3-L1 fibroblasts and (B) differentiated EACC™ 3T3-L1 adipocytes The round vesicles are fat globules within the cells. Note that 3T3-L1 fibroblasts can still be visualised within the background of panel B.

146
Figure 3.6 Fmo1 and adipocyte markers, LPL, FABP, and PPAR-γ expression in 3T3-L1 (ECACC™ cell line) pre-adipocyte and mature adipocytes Markers of adipocytes and 3T3-L1 adipocytes were quantified to test the differentiated state of the 3T3-L1 cells. Differences are shown in fold difference. The data was obtained from triplicate wells of 3T3-L1 cells. The markers tested are PPAR-γ (peroxisome proliferator-activated receptor), LPL (lipoprotein lipase), and FABP (fatty-acid binding protein). Fibroblast = 3T3-L1 fibroblast, ADIP = 3T3-L1 adipocyte.

147
3.2.2 Fmo1 expression during differentiation of the ATCC™ 3T3-L1 cell line When grown to full confluency, the 3T3-L1 ATCC™ cells stop growing. This is
because the cells are contact inhibited. This is a requirement for efficient
differentiation. Differentiation of 3T3-L1 ATCC™ cells as explained previously, is 95-
100% efficient compared to 30-40% for the European cell line. The morphology of
the 3T3-L1 ATCC™ cells is different from the 3T3-L1 European cell line (Figure 3.7).
Fmo1 and three adipocyte markers (PPAR-γ, FABP and LPL) expression was
measured in the 3T3-L1 pre-adipocytes and at a number of time-points after the
addition of the media that allows the cells to differentiate into adipocytes. RNA was
isolated from the cells at confluency and 3 hours, 1 day, 3 days, and 10 days after
the addition of differentiation media. FMO1, LPL, PPAR-γ, and FABP mRNAs were
quantified at each of these time-points.
FMO1 mRNA is 200-fold higher in the ATCC™ 3T3-L1 adipocytes compared to the
pre-adipocytes (Figure 3.8). This is comparable to the FMO1 mRNA fold difference
seen when the EACC 3T3-L1 cells are differentiated. Fmo1 expression is increased
10-fold, 1 day after the addition of differentiation media (Figure 3.8) and is reduced at
day 3 back to pre-adipocyte levels. This may be due to a direct response to one of
the hormones within the differentiation media. The majority of the increase in Fmo1
expression is seen after 10 days and it is therefore defined as a late marker of
adipocyte differentiation. The LPL adipocyte marker in the ATCC™ 3T3-L1 cell line
is expressed in 3T3-L1 pre-adipocytes and throughout the time-points measured
after addition of differentiation media. In comparison the LPL adipocyte marker is not
expressed in the EACC 3T3-L1 pre-adipocyte and is only expressed after 3T3-L1

148
adipocyte differentiation. PPAR-γ and FABP are increased through the period of
3T3-L1 differentiation. This is comparable to the observations in the 3T3-L1 EACC
cell line.

149
Figure 3.7 Comparison of the EACC 3T3-L1 differentiated cell line with the ATCC™ 3T3-L1 differentiated cell line (A) Differentiated EACC 3T3-L1 cells imaged at 10 days post addition of differentiation media. (B) Differentiated ATCC™ 3T3-L1 cells.

150
Figure 3.8 Expression profiling of (A)FMO1, (B) LPL (C) PPAR-γ (D) FABP mRNAs during 3T3-L1 differentiation Each graph shows the expression of the gene relative to the expression of GAPDH. Each bar represents a different time-point through 3T3-L1 differentiation. From left to right, in each graph, the time points are 3T3-L1 cells at 100% confluent, 3 hours, 1 day, 3 days, and 10 days after the addition of differentiation media. All experiments were done in triplicate and the error bars represent the standard error.

151
3.2.3 Fmo1 P0, P1 and P2 transcript expression during 3T3-L1 differentiation In 3T3-L1 fibroblasts the three Fmo1 transcripts (P0, P1, and P2) are expressed at a
low amount relative to GAPDH. The P0 transcript is expressed at background levels.
The P1 transcript is expressed at 0.00000036 the level of GAPDH. The P2 transcript
is expressed at 0.000000077 the level of GAPDH. The global FMO1 transcript is
expressed at 0.000006 the level of GAPDH.
Fmo1 transcripts were quantified at a number of time points throughout the
differentiation period of the 3T3 cells into adipocytes (Figure 3.9). We decided to
measure transcripts at day 6, as opposed to day 3, to identify the earliest time point
when Fmo1 transcripts are significantly increased. The global Fmo1 transcript was
measured at the same time points as the individual transcripts. The P1 and P2 Fmo1
transcripts are increased significantly (9 -fold) after 1 day post addition of
differentiation media. At day 6 post differentiation the P1 transcript was increased a
further 9-fold and the P2 transcript a further 15-fold. At day 10, the P1 transcript
increased a further 3-fold and the P2 transcript increased a further 4-fold.
3.2.4 Fmo1 global expression during differentiation of the ATCC™. 3T3-L1 mouse fibroblast cell line The global Fmo1 transcript is expressed at 0.000003 relative to the reference gene
(GAPDH) within undifferentiated 3T3-L1 fibroblasts. On day 1, post addition of
differentiation media, the Fmo1 transcript increases to 0.000025 relative to GAPDH.
This is an 8-fold increase in the amount of Fmo1 transcript. After 6 days post
addition of differentiation media the Fmo1 transcript increases to 0.000082. This is a

152
further 3-fold increase from 3 hours post addition of differentiation media. After 10
days, when the cells are visibly differentiated and express adipocyte markers. Fmo1
expression relative to GAPDH is 0.0015.
When compared to the P1 and P2 transcripts the global Fmo1-transcriptis on
average 10-fold higher throughout the differentiation process. Within fibroblasts the
total relative expression of the P1 and P2 transcripts are present at 8% of the global
transcript. After 1 day post differentiation, P0 and P2 transcripts constitute 6% of the
global Fmo1 transcript. At day 6, the P1 and P2 transcripts are expressed at 20% of
the global Fmo1 transcript. At day 10, the P1 and P2 transcripts are expressed at
11% of the global Fmo1 transcript (Figure 3.9C).
The global transcript is present in greater abundance than the combined P1 and P2
transcripts. It is possible that there is another promoter active in the 3T3-L1 cells and
we are measuring the mRNA from this promoter in the global transcript expression.
In the mouse the combined expression of P0, P1 and P2 in white adipose tissue is
greater than that of the global transcript amount. As the 3T3-L1 cells are a cell line,
there may be different mechanisms of Fmo1 regulation than seen within adipose
tissue. Mouse adipose tissue contains other cell types e.g. those of the immune
system including macrophages. The non-fat cell types may have an increase in P0,
P1 and P2 transcripts over the global transcript. This could obscure the true
transcript ratio of adipocytes.

153
Figure 3.9 Quantification of Fmo1 global gene expression during 3T3-L1 differentiation (ATCC) Relative expression of (A) the Fmo1 P1 transcript (B) Fmo1 P2 transcript and (C) global Fmo1 transcript at different stages of 3T3-L differentiation. The different stages are undifferentiated cells at 100% confluency (100% CONF) and at 1 day, 6 days and 10 days post addition of differentiation media. Fmo1 gene expression is normalised to the reference gene GAPDH. All experiments were done in triplicate and the error bars represent the standard error. (D) The relative amount of P1+P2 Fmo1 transcript as a percentage of relative global Fmo1 transcript.

154
Discussion
The work described above is the first report of the quantification of global Fmo1
expression in white fat, muscle, brain and brown fat. Global FMO1 mRNA amounts
in white and brown fat is comparable to that found in kidney and liver, where Fmo1 is
expressed at a high level. These data provide support for a role for FMO1 in
additional tissues previously not known to express the mRNA (or protein). Fmo1
expression level in muscle is low relative to other tissues, but expression is high
when compared to the reference gene. There may be a role for FMO1in this tissue.
Previously it was not known to what extent each of the alternatively spliced
transcripts of Fmo1, the P0, the P1, and P2 transcript are produced in different
tissues. The experimental data presented within this chapter show the relative
amounts of each transcript produced within different tissues. The expression of each
transcript has been compared to each of the other transcripts and to the global
FMO1 mRNA. This has identified promoter usage in the different tissues and
indicated that attenuation of transcription may take place from some promoters in
some tissues. The expression of the P1 and P2 Fmo1 transcripts were quantified
during 3T3-L1 differentiation and demonstrate that the mRNAs are increased as cells
differentiate from fibroblasts into adipocytes.
The results show that, in the mouse, the P1 promoter is used in all extra-hepatic
tissues and that the P1 transcript is abundant in all tissues analysed. The P0 and P2
promoters are active to a similar level in kidney, muscle, brain, brown fat, and white
fat. This suggests a common regulatory mechanism between these two promoters
within these tissues. In the liver however, only the P0 promoter is used.

155
In some tissues, the combined amount of the three transcripts does not always equal
that of the global Fmo1. This suggests that transcription from, in particular, the P1
promoter, is attenuated and that shorter transcripts might be produced. These
shorter transcripts would not be detected using the primers designed in the protein-
coding region of the mRNA. In the differentiated 3T3-L1 cells, global Fmo1
expression is much greater than that of the individual transcripts. This may represent
the presence of a promoter that is switched on only during the differentiation process
and that we have yet to identify. Both the P1 and P2 promoters are used in 3T3-L1
cell differentiation.

156
Chapter 4
Characterisation of different FMO1
promoters

157
Chapter 4: Characterisation of different FMO1 promoters
Introduction
The human FMO1 gene has three known transcriptional start sites (Hernandez et al.,
2004). These start sites are homologous to those used in the mouse Fmo1 gene
(Hernandez et al., 2004). In both species three different transcripts are produced,
P0, P1 and P2. Previous work has shown that promoter P0 is used predominantly in
the human foetal liver. The human P0 promoter has previously been characterized
using reporter gene assays (Shephard et al., 2007). The reporter gene construct was
transfected into HepG2 cells, which were derived from an adult human hepatoma
cell line. The P1 and P2 promoters have yet to be characterised. This chapter will
outline the defining of the human FMO1 P1 and P2 promoters.
A number of genetic polymorphisms are present upstream of both the P1 and P2
transcriptional start sites. These polymorphisms may be present within regulatory
sequences and therefore affect the amount of transcript produced. It is desirable to
identify polymorphisms that influence transcription. These could be used as markers
to identify individuals for whom drug metabolism of FMO1 substrates might be
altered because of production of lower or higher amounts of the protein.
The P1 and P2 promoters have previously not been defined, and the factors that
regulate transcription from each, is not known. This chapter describes the
experiments carried out to define the regions that comprise the FMO1 P1 and P2
promoters in different cell types. Subsequently, a bioinformatics approach was used
to predict factors that may regulate the activity of the promoters.

158
Recent advances in genome wide epigenetic analysis has given rise to a large public
resource of epigenetic data. We have reviewed these resources which identify open
chromatin regions within the FMO1 gene and identify binding locations of regulatory
factors. These data have been used to further justify the experimental data of
defining the P1 and P2 promoters.
4.1 Definition of human FMO1 promoters in COS-7, HK-2, and 3T3-L1 cells The FMO1 promoters have been defined by quantifying the activity of a reporter
gene under the control of upstream sequences of each transcriptional start site.
Sequences of increasing size, each starting from the transcriptional start site, are
introduced to a vector where they act as the promoter responsible for the expression
of a luciferase reporter gene (Figure 4.1). The FMO1 transcripts are known to be
expressed at different levels in different tissues (Dolphin et al., 1996; Yeung et al.,
2000; Zhang and Cashman, 2006). Therefore I have transfected a number of
different cell lines to allow for the tissue-specificity of FMO1 expression. COS-7 is a
monkey kidney fibroblast, HK-2 is a human kidney proximal tubule cell line, and 3T3-
L1 is a fibroblast which can be differentiated into adipocytes in culture.
4.1.1 Reporter gene assay controls
To determine the amount of background activity in the transfected cells, the parent
plasmid, used to prepare the reporter gene constructs, is used as a negative control.
The negative control is the pGL3-Basic vector, which contains the luciferase gene
from the firefly Photinus pyralis. The vector is identical to the plasmid containing
FMO1 sequences except that it does not contain a promoter sequence upstream of

159
Figure 4.1 Illustration of the sequences upstream of each of the FMO1 transcriptional start sites cloned within the pGL3-Basic plasmid The figure shows the three regulatory exons of FMO1. These are exon 0, exon 1, and exon 2. Within exon 2 translation begins. The location of FMO1 DNA sequences cloned into luciferase constructs are outlined by the open boxes. The numbers designate the location of the DNA region inserted into the plasmid. The numbers are relative to the A of the ATG translation initiation codon. Constructs were designed from the P2 transcriptional start site which is at location -128 and upstream of the P1 transcriptional start site which starts at position -343.

160
the transcriptional start site. Therefore any activity detected from the pGL3-Basic
vector can be considered as the background activity. A positive control is required to
assess the experimental conditions. The positive control used for the reporter gene
assays is the pGL-SV40 plasmid, which also contains the luciferase gene from the
firefly Photinus pyralis. This plasmid contains the SV40 viral promoter and produces
high luciferase reporter gene activity within transfected mammalian cells. A third
control is required to control for the transfection efficiency of mammalian cells by
each plasmid construct. A plasmid is used that contains a coding sequence and is
capable of expressing a luciferase protein from a different organism to the firefly
Photinus pyralis. The plasmid pRL-TK contains a luciferase gene from the sea pansy
Renilla reniformis and is co-transfected along with the experimental plasmids. The
reporter gene activity of the pRL-TK plasmid can be measured separately from the
firefly luciferase and is used to normalise the firefly luciferase expression.
4.1.2 Optimisation of transfection for COS-7, HK-2 and 3T3-L1 cell lines DNA and lipofectamine reagent (LTX) amounts were optimised for reporter gene
activity within COS-7 and HK-2 cell lines. The optimised conditions for 3T3-L1 cell
transfection were obtained from the supplier, Invitrogen. Transfection was optimised
using a reporter gene construct under the control of the SV40 promoter, pGL-SV40.
The SV40 promoter is used as this is a highly efficient viral promoter and will
produce a high reporter gene activity within mammalian cell lines. COS-7 and HK-2
cell lines were transfected with 0.6 µg, 0.8 µg and 1 µg of reporter plasmid. Each
pGL-SV40 concentration was transfected into the cells using 1 µL, 1.5µL or 2 µL of
LTX reagent to determine the amount of lipid required for optimal transfection.

161
COS-7 (Figure 4.2A) cells transfected with 0.6 µg PGL3-SV40 reporter gene activity
using 1 µL, 1.5 µL and 2 µL produced reporter gene activity of about 20 RLU.
Transfection of COS-7 cells with 0.8 µg DNA using 1 µL, 1.5 µL or 2 µL showed no
significant improvement in RLU. When the amount of pGL3-SV40 DNA was
increased to 1 µg and 2 µL of LTX was used, reporter gene activity increased to 60
RLU.
HK-2 cells (Figure 4.2B) transfected with 0.6 µg, 0.8 µg, and 1 µg of pGL-SV40 DNA
using 1 or 1.5 µL of LTX reagent all produced activity averaging 20 RLU. When 0.8
µg and 1 µg of pGL-SV40 DNA was transfected into the HK-2 cells using an
increased amount of LTX of 2 µL, reporter gene activity was increased to about 80
RLU. As reporter gene activity of the pGL3-SV40 construct was slightly higher when
transfecting 1 µg of reporter plasmid and 2 µL of LTX it was decided these conditions
would be used for transfection of FMO1 reporter constructs into HK-2 cells.

162
Figure 4.2 Determination of DNA/LIPID ratios for optimal transfection of (A) COS-7 and (B) HK-2 cells The pGL-SV40 plasmid was transfected into both cell types at different DNA concentrations. These were 0.6 µg, 0.8 µg and 1 µg. Each DNA concentration was transfected using 1 µL, 1.5 µL and 2 µL of lipid reagent. The conditions used are shown in the figure. Cells were transfected with pRL-TK vector to control for transfection efficiency. The RLU values are pGL-SV40 light units relative to the pRL-TK light units. All experiments were done in triplicate and the error bars represent the standard deviation.

163
4.1.3 COS-7 cell transfection (Figure 4.3)
The construct pGL-255_-128 which contains the sequence directly upstream of the
FMO1 P2 transcriptional start site produces an average of 37±13.7 RLU of reporter
gene activity within COS-7 cells. The construct pGL-858_-128 containing additional
further sequence upstream of the P2 transcriptional start and continuing through the
P1 transcriptional start site produces 87±22.4 RLU. This is a nearly 3-fold increase in
reporter gene activity from the pGL-255_-128 construct. The construct pGL-858_-
343 containing sequence directly upstream of the P1 transcriptional start site
produces an average of 217±63.3 RLU. This is about 4-fold higher than the pGL-
255_-128 construct and over 2-fold higher than the pGL-858_-128 construct. The
constructs pGL-1243_-128 and pGL-1243_-343, which contains additional upstream
sequence produce only 1 RLU. The sequence -1243_-858 must contain a sequence
that negatively regulates the reporter gene activity. Reducing the length of the pGL-
858_-343 construct to contain the sequence between -600_-343 results in loss of
reporter gene activity to 1 RLU. Therefore the sequence -858_-600 of the FMO1
gene upstream of the P1 promoter is responsible for the reporter gene activity
observed within COS-7 cells. The reporter gene construct (Pgl-521_+50) which
defines the P0 promoter was transfected into COS-7 cells but showed low reporter
gene activity.
4.1.4 Ratio of FMO1 promoter usage in COS-7 cells COS-7 cell transfection results defined the P1 promoter region as the sequence
between -858_-343 upstream of the FMO1 translation initiation start site. This is
because the pGL-858_-343 construct when transfected into COS-7 cells gave the
highest luciferase activity. The activity was reduced when additional upstream

164
sequence was included (pGL-1243_-343 construct). The P2 promoter region active
within COS-7 cells was defined as the region between -255_-128. This is because
the construct, pGL-255_-128 (upstream of the P2 transcriptional start site) produced
the highest reporter gene activity. The promoter was not defined further upstream as
these sequences would overlap with the P1 transcriptional start site.
Comparison of reporter gene activity from P1 and P2 was made by normalising
reporter gene construct activity to the activity of the P2 promoter construct. The
activity of pGL-255_-128 is set to 1. The reporter gene activity of the P1 promoter
construct shows a significant 5-fold increase in reporter gene activity compared with
the P2 promoter. The P1 promoter is therefore a stronger promoter in COS-7 cells
than is P2. To understand the ratio of promoter usage between the P1 and P2
construct the reporter gene activity of the pGL-858_-128 needs to be considered.
The reporter gene activity of this construct will identify in which ratio the promoters
are being used. When reporter gene activities are normalised to the P2 construct the
pGL-858_-128 construct is, significantly, 2.35-fold more active than this. When the
pGL-858_-128 and the P1 promoter construct relative activity to P2 are compared
the pGL-858_-128 construct is significantly 2.5-fold lower than the P1 promoter
construct. Therefore the reporter gene activity of the construct containing both P1
and P2 shows intermediate activity between the P1 and P2 constructs alone. It is
likely that within COS-7 cells the two promoters are being used equally but that the
P1 promoter is the stronger promoter.

165
Figure 4.3 Reporter gene activity of PGL3-Basic constructs containing DNA sequences upstream of the three FMO1 transcriptional start sites transfected into COS-7 cells COS-7 cells were transfected with pGL3 constructs containing FMO1 sequences upstream of each of the three FMO1 transcriptional start sites. The sequence location is shown next to each bar and the co-ordinates are relative to the FMO1 mRNA translation start codon. The constructs are grouped based on which transcriptional start site they are directly upstream of. The P0 construct is labelled red. Constructs upstream of P1 are labelled blue and constructs upstream of P2 are labelled green. The pGL3 basic plasmid was transfected as a negative control. All experiments were done in triplicate and the error bars indicate the standard deviation. The construct pGL-858_-128 is significantly different from pGL-255_-128 and pGL-858_-343(p<0.03,*). The construct pGL-1243_-343 and pGL-600_343 are significantly different from pGL-858_-343, (P<0.009**).

166
4.1.5 Transfection of HK-2 cells with FMO1 promoter constructs (Figure 4.4) The HK-2 cell line was derived from human proximal tubule kidney cells and was
used to test reporter gene activity because FMO1 mRNA has been localised to these
cells in the mouse kidney using in-situ hybridization experiments (Janmohamed et
al., 2004).
The P0 promoter construct (pGL-521_+50) produces reporter gene activity of
4.5±0.9 RLU. The construct pGL-255_-128 which contains the sequence directly
upstream of the P2 transcriptional start site produces an average of 3±0.1RLU of
reporter gene activity. The construct pGL-858_-128, containing additional further
sequence upstream of the P2 transcriptional start and continuing through the P1
transcriptional start site produces 2.7±0.4RLU. This is similar to that of the activity of
the P2 reporter gene construct. The construct pGL-858_-343 containing sequence
directly upstream of the P1 transcriptional start site produces an average of
8±1.1RLU, which is higher than obtained with both the P2 and P0 reporter gene
constructs. The constructs pGL-1243_-128 and pGL-1243_-343 which contain
additional upstream sequence produce 1±0.1RLU. The sequence -1243_-858 within
the construct is negatively regulating the reporter gene activity as was seen also in
COS-7 and 3T3 cells (see below). Reducing the length of the pGL-858_-343
construct to -600_-343 results in loss of reporter gene activity to 1±0.3 RLU. The
FMO1 sequence between -858_-600 is therefore responsible for the reporter gene
activity within HK-2 cells upstream of the P1 promoter.

167
4.1.6 Ratio of FMO1 promoter usage in HK-2 cells (Figure 4.4) Transfection of HK-2 cells with the series of FMO1 promoter constructs define the P1
promoter region in these cells as the sequence -858_-343 upstream of the FMO1
translational start site. As within COS-7 cells, but in contrast to 3T3-L1 cells (see
below), the sequence -1243_-858 significantly reduces reporter gene activity. The
P2 promoter region within HK-2 is defined as the region -255_-128 as was the case
for transfected COS-7 cells. The construct, pGL-255_-128 (upstream of the P2
transcriptional start site) produces the highest reporter gene activity. The promoter is
not defined further as upstream sequence as this overlaps with the P1 transcriptional
start site. The ratio of promoter activity was determined as previously explained for
COS-7 cell transfections. The activity of the pGL-255_-128 is set to 1. The reporter
gene activity of the P1 promoter is significantly higher, 3-fold, than the P2 promoter.
The P1 promoter is therefore a stronger promoter within HK-2 cells than the P1
promoter. The reporter gene activity of the construct containing the P1 and P2
promoter (pGL-858_-128) is equal to the P2 promoter construct. Within HK-2 cells it
is likely that the P2 promoter is favoured over the P1 promoter.
168
Figure 4.4 Reporter gene activity of PGL3-Basic constructs containing DNA sequences upstream of the three FMO1 transcriptional start sites transfected in HK-2 cells HK-2 cells were transfected with pGL3 constructs containing FMO1 sequences upstream of each of the three FMO1 transcriptional start sites. The sequence location is shown next to each bar and the co-ordinates are relative to the FMO1 mRNA translation start codon. The constructs are grouped based on which transcriptional start site they are directly upstream of. The P0 construct is labelled red. Constructs upstream of P1 are labelled blue and constructs upstream of P2 are labelled green. The pGL3 basic plasmid was transfected as a negative control. All experiments were done in triplicate and the error bars indicate the standard deviation. The construct pGL-858_-343 is significantly different from pGL-255_-128, pGL-858_-128, pGL-1243_-343 and pGL-858_-600 (p<0.002, **). The construct pGL-+50/521 is significantly different from the pGL-255_-128 and the construct pGL-858_-343 (p<0.03, *) and pGL-600_-343 are significantly different from pGL-858_-343, P<0.009.

169
4.1.7 FMO1 promoter usage in 3T3-L1 fibroblast cells (Figure 4.5)
The 3T3-L1 cell line is a mouse fibroblast cell line. It is possible to differentiate these
cells into white adipocytes. The reporter construct pGL-255_-128, which contains the
sequence directly upstream of the P2 transcriptional start site produces an average
of 11±2.2 RLU of reporter gene activity in transfected 3T3-1 cells. The pGL-521_+50
construct containing the previously defined P0 promoter shows an average reporter
gene activity of 14±0.33RLU. This is comparable to the P2 reporter gene activity.
The construct pGL-858_-128 containing additional further sequence upstream of the
P2 transcriptional start and continuing through the P1 transcriptional start site
produces a reduced amount of reporter gene activity of 7±0.4 RLU. The construct
pGL-858_-343 containing sequence directly upstream of the P1 transcriptional start
site produces an average of 7±0.16 RLU. The constructs pGL-1243_-128 and pGL-
1243_-343, which both contain additional upstream sequence, produce 4±0.16 RLU.
As seen in COS-7 cells the sequence -1243_-858 also reduces reporter gene activity
in 3T3-L1 cells, although the reduction is not as great as that observed in transfected
COS-7 cells. When the pGL-858_-343 construct length is reduced to -600_-343
reporter gene activity is reduced further, to 2 RLU. Therefore, as was observed in
transfected COS-7 cells the FMO1 sequence between -858_-600, upstream of the
P1 promoter, is responsible for the reporter gene activity observed in 3T3-L1 cells.
4.1.8 Ratio of FMO1 promoter usage in 3T3-L1 cells Transfection of 3T3-L1 cells with various FMO1 promoter constructs define the P1
promoter region as the sequence -858_-343 upstream of the FMO1 translational
start site. In comparison to the results obtained from transfected COS-7 cells the
sequence -1243_-858 does not reduce reporter gene activity as much in 3T3-L1

170
cells. This sequence region does not however increase reporter gene activity and
can therefore be disregarded as contributing to the P1 promoter. The P2 promoter
region within 3T3-L1 cells is defined as the region -255_-128 as was the case in
transfected COS-7 cells. The ratio of FMO1 promoter activity in 3T3-L1 cells was
determined as explained above for COS-7 cells. Comparison of reporter gene
activity was made by normalising reporter gene construct activity to the activity of the
P2 promoter construct for ease of comparison with other cell lines tested for
promoter activity. The activity of the pGL-255_-128 is set to 1. The reporter gene
activity of the P2 promoter is 1.6-fold higher than that of the P1 promoter and it is
significantly stronger (p<0.03). The reporter gene activity of pGL-858_-128
containing the P1 and P2 promoters is 6.75 fold higher than the P2 promoter. It is not
significantly different from the P1 promoter reporter gene activity. Extension of the
promoter from -255_-128 to -858_-128 shows that the P1 promoter, when present
with the P2 promoter, is favoured.

171
Figure 4.5 Reporter gene activity of PGL3-Basic constructs containing DNA sequences upstream of the three FMO1 transcriptional start sites transfected in 3T3-L1 cells 3T3-L1 cells were transfected with pGL3 constructs containing FMO1 sequences upstream of each of the three FMO1 transcriptional start sites. The sequence location is shown next to each bar which is relative to the FMO1 translation start codon. The constructs are grouped based on which transcriptional start site they are directly upstream of. The P0 construct is labelled red. Constructs upstream of P1 are labelled blue and constructs upstream of P2 are labelled green. The pGL3 basic plasmid was transfected as a negative control. All experiments were done in triplicate and the error bars indicate the standard deviation. The construct pGL-255_-128 is significantly different from pGL-858_-128 and pGL-858_-343 (p<0.03). The construct pGL-858_-343 is significantly different from the pGL-1243_-343 and pGL-600_-343 constructs (p<0.0006, **). The construct pGL-521_+50) is significantly different from the pGL-858_-343 (p<0.00002, **).

172
4.2 Transfection using nucleofection of 3T3-L1 differentiated into adipocytes We now know that FMO1 is highly expressed in white adipose tissue (Omar, Ph D
thesis, 2009; Veeravalli et al., Unpublished). In the previous section I described the
poor expression of FMO1 promoter constructs in undifferentiated 3T3-L1 cells. In this
section the transfection of 3T3-L1 cells differentiated into adipocytes is described.
3T3-L1 cells differentiated into adipocytes are notoriously difficult to transfect.
Transfection has been achieved previously using lenti-viruses (Inoue et al., 2010)
and electroporation (Rolland et al., 1995; Rolland et al., 1996). Lenti-viral methods
have safety implications and require a dedicated category 3 laboratory.
Electroporation methods require high amounts of optimisation and yield a very
limited transfection efficiency of 10-20%. Cationic-lipid methods of transfection which
were used to transfect cell lines previously to a high efficiency are not effective at
transfecting 3T3-L1 adipocytes.
Recent advances in electroporation have resulted in companies producing
electroporation units with optimised conditions for different cell lines. This includes
optimisations for 3T3-L1 adipocytes. To test the transfection efficiency of 3T3-L1
adipocytes a plasmid encoding the enhanced green fluorescent protein eGFP was
nucleofected into the adipocytes and the percentage of GFP expressing cells was
determined. Transfection efficiency was observed to be 30-40% (Figure 4.6). The
PGL-SV40 construct which was used in previous experiments as a positive control
was nucleofected into 3T3-L1 adipocytes. This plasmid produced luciferase activity
of between 50-100000 RLU. Therefore the 3T3-L1 adipocytes could be used to test

173
human FMO1 promoters in the context of expression of the gene in white fat. The
FMO1 P2 promoter was transfected into the 3T3-L1 adipocytes and showed a high
Figure 4.6 GFP Nucleofection of 3T3-L1 adipocytes 2 µg of pmaxGFP® Vector (Lonza) was nucleofected using 1x10⁷ 3T3-L1 adipocytes. Cells were plated onto 18mm dishes and imaged using fluorescence microscopy. Transfection efficiency was predicted to be 30%.

174
activity of between 20-30000 RLU. This data is not normalised as the pRL-TK
construct used to normalise the transfection efficiency shows low or no activity in the
differentiated cells. Therefore this activity could not be compared to the results
obtained for undifferentiated 3T3-L1 cells described in the previous section.
However, the increase in firefly luciferase activity is orders of magnitude greater than
that obtained in undifferentiated 3T3-L1 cells. It seems reasonable to assume that
FMO1 promoter activity has increased due to differentiation of the cells into
adipocytes. This conclusion is supported by our findings that FMO1 mRNA is not
expressed in 3T3-L1 fibroblasts, but is expressed in the differentiated cells (see
chapter 1).
In future these promoter sequences identified as being responsible for the increase
in transcription of FMO1 P1 and P2 transcripts can be used to observe any
differences in transcription amounts caused by SNPs.

175
Figure 4.7 Illustration of human FMO1 promoters defined by reporter gene assays The numbered grey boxes above represent exons within human FMO1. The P0 transcriptional start site begins at the start of exon 0. Upstream of this represents the previously defined promoter within HepG2 cells. The P2 promoter is represented between exon 1 and exon 2 which is active in all 3 cell lines (shown in blue). The P1 promoter has a positive promoter element directly upstream of P1 (shown in blue). Increasing the length of this construct results in repressed luciferase activity (shown in red). This repression is seen in both primate cell lines (COS-7 and HK-2) but less repression is seen within the mouse cell line (3T3-L1).

176
4.3 The FMO1 P2 promoter region and prediction of transcription factor binding The human P2 promoter has been defined as the region of DNA between exon 1
and exon 2, which is located between -255_-128 upstream of the ATG translation
start site. Different bioinformatics programs were used to predict binding of
transcription factors to the P1 and P2 promoter regions including Matinspector,
PROMO, and AliBaba. The human P2 promoter region was aligned with the mouse
sequence directly upstream of the P2 transcriptional start site (Figure 4.8). This
revealed large regions of sequence conservation. The human promoter region was
then examined for transcription factor binding motifs. The mouse sequence was also
examined in this way. This is to account for conservation in transcription factor
binding between mouse and human as well as for sequence homology.
A number of different factors were predicted to bind to the P2 promoter. The
promoter contains no TATA box which is a common motif found within the core
promoter of several genes. The human FMO1 P2 promoter can therefore be
described as TATA-less promoters. The most conserved transcription factor binding
motif within the P2 promoter is a GC box binding motif which is predicted to bind
SP1, a constitutively expressed transcription factor (Figure 4.8). This is within a
conserved region with the mouse, however the mouse does not contain a GC box as
there is a C>T transition within this motif (Figure 4.8). The transcription factor E2F is
predicted to bind upstream of SP1 but does not show conservation when aligned to
the mouse sequence (Figure 4.8). Further downstream there is a large region of
conservation and contains a sequence which is predicted to bind a nuclear hormone
receptor. It could be a potential binding site for a number of proteins including the
177
estrogen, thyroid, progesterone, or vitamin D receptors, PPAR-γ or RXR-alpha
(Figure 4.8).
Previous observations (described in chapter 3) showed an increase in P2 transcripts
when 3T3-L1 fibroblasts are differentiated into adipocytes. The factors predicted to
bind to the P2 promoter which could be responsible for this effect are RXR-alpha and
PPAR-γ or the thyroid hormone receptor (T3R alpha). PPAR-γ and RXR-alpha form
a heterodimer to regulate genes during adipocyte differentiation. PGC1-alpha, a
transcriptional co-activator also interacts with both RXR-alpha and PPAR-γ to
activate transcription. PGC1-alpha‟s possible role in the regulation of FMO1 will be
discussed later.

178
Figure 4.8 Annotation of the FMO1 P2 promoter (A) Predicted binding locations of transcription factors within the defined FMO1 P2 promoter. (B) Alignment of the FMO1 human and mouse P2 promoter regions and predicted transcription factor binding regions. E2F and SP1 transcription factor binding predictions are shown. The mouse sequence contains one variation within the SP1 consensus binding sequence of GGGGCGGG. Further downstream a sequence predicted to bind a hormone receptor (Vitamin D receptor, Progesterone receptor, estrogen receptor, retinoid x receptor, thyroid hormone receptor, Peroxisome proliferator-activated receptor – γ). Within the same region HNF-1α is predicted to bind. The region containing the hormone receptor sites are conserved with the mouse sequence.

179
4.4 The defined P1 promoter region and potential protein binding sites Transfection experiments of three different cell lines cell lines have identified a
region in the human FMO1 gene between -858_-343 that positively regulates
reporter gene transcription. A number of transcription factor binding sites are
predicted in this region and correlate with the expression profiles revealed for FMO1.
The muscle specific transcription factors, HEB, MyoD, and myogenin are predicted
to bind within the P1 promoter within conserved regions with mouse (Figure 4.9).
Previously, it was shown by RT-PCR that the predomininant FMO1 transcript in
muscle is from the P1 promoter (see chapter 3). Expression data from microarrays
show mouse Fmo1 being upregulated during C2C12 myotube differentiation (Cam et
al., 2006). When treated with a p73 inhibitor the myoblast cell line increases the
expression of FMO1 to the level observed within the differentiated myotubes (Cam et
al., 2006). Additional expression profiles suggest this is due to direct or indirect
regulation by the transcription factor MyoD (a transcription factor required for muscle
cell differentiation). When MyoD is overexpressed within a fibroblast cell line FMO1
mRNA is significantly upregulated (Di Padova et al., 2007). When a mutant form of
MyoD is overexpressed the amount of FMO1 mRNA upregulation is reduced by 50%
(Di Padova et al., 2007).
Additional expression profiles give clues that Fmo1 may be regulated by PGC1-
alpha, a co-activator of many factors including PPAR-gamma. Palmitate treatment
which inhibits PGC1-alpha also knocks down Fmo1 expression in muscle. In
comparison in mouse brown fat, when PGC1-alpha is knocked down, Fmo1
expression is increased. It therefore seems that the effect of PGC1-alpha on

180
Fmo1expression may be tissue specific and may be involved in the use of multiple
promoters for Fmo1.
A number of consensus DNA binding sites for the thyroid hormone receptor are
predicted by Matinspector, Ali baba, and Promo transcription factor prediction tools.
This hormone receptor has been shown to interact with the co-factor PGC1-alpha
and subsequently activate transcription (Wu et al., 2002). This could be responsible
for Fmo1 activation in brown fat and muscle. PGC1 alpha is not expressed in white
fat and therefore the thyroid hormone receptor may be upregulating Fmo1
independently within this tissue. Other transcription factors that may be responsible
for the increase in Fmo1 P1 transcript are PPAR-gamma and CCAAT binding
proteins. There are 3 predicted sites for CCAAT transcription factor binding within
the P1 promoter (Figure 4.9).
The CCAAT binding protein and PPAR-gamma transcription factors are predicted to
bind within the P1 promoter. These transcription factors are responsible for the
increase in transcription of many genes during adipocyte differentiation and may be
involved in Fmo1 upregulation during 3T3-L1 differentiation.
A number of sites for a neuro-developmental factor (hen-1) are predicted within the
P1 promoter region. This transcription factor was observed to be significantly over-
represented in the promoter of genes which are upregulated during adipocyte
differentiation. The same study also showed the upregulation of Fmo3 during
adipocyte differentiation (Kim et al., 2007).

181
Figure 4.9 Annotation of FMO1 P1 promoter (A) Predicted binding locations of transcription factors within the defined FMO1 P1 promoter. (B) Alignment of the FMO1 human and mouse P1 promoters. Three CCAAT protein binding regions are outlined in the above figure. Their conservation with mouse is shown below. The figure outlines further predictions for binding sites for muscle specific factors myogenin and myoD. Within the same region Hen1, AP-4, and HEB are predicted to bind. Downstream of these sites a half-site for a nuclear hormone receptor is illustrated.

182
4.5 Epigenetic analysis of the human FMO1 promoters Recent advances in epigenomics have led to genome-wide studies of chromatin
analysis becoming available to the researcher. Two sources of data could tell us
more about potential regulatory regions of FMO1. These are epigenetic studies
undertaken in different human tissues and genome-wide DNase I hypersensitive
(HR) assays undertaken in both cell lines and tissues. The data are obtained from
The University of California, Santa Cruz (UCSC) genome browser (Kent et al., 2002)
using the UCSC Genome Browser database (Rhead et al., 2010)
http://genome.ucsc.edu/. This is an open resource which provides genome
annotation for examining and comparing the genomes of organisms, aligning
sequence to genomes, and displaying and sharing users' own annotation data. The
data showing DNase I-seq data from different human tissues were obtained from the
Epigenomics Data Analysis and Coordinating Centre (EDACC)
http://nihroadmap.nih.gov/epigenomics/. Chip-seq data was produced within the
UCSC genome browser from data obtained from the Myers Lab at the Hudson Alpha
Institute for Biotechnology and by the labs of Michael Snyder, Mark Gerstein and
Sherman Weissman at Yale University; Peggy Farnham at UC Davis; and Kevin
Struhl at Harvard.
4.5.1 DNase I hypersensitive regions (HRs) located within and surrounding the FMO1 gene (Fig. 4.10) The Figure (Figure 4.10) shows a schematic diagram of DNase I HR sites in multiple
human foetal tissues. These tissues are adrenal gland, brain, heart, kidney and lung.
A DNase I hypersensitive region (HR) is present roughly -2000 bp upstream of the

183
P0 transcriptional start site (Figure 4.10). This HR is present within the adrenal gland
and heart but not present within the kidney, brain, and lung. A second DNase I HR is
present 3500 bp downstream of the P0 transcriptional start site (Figure 4.10). This
HR is seen in all tissues analyzed. The tissue-specific HR is highlighted within Figure
4.10(*). In all tissues analysed DNase I HRs are present within the P1 and P2
promoter regions defined earlier within this chapter. However, differences are seen
in the size and signal of these HRs between different tissues.

184
Figure 4.10 Genome wide DNase I chromatin assays outlining DNase I sensitive sites upstream of the FMO1 P0, P1 and P2 promoter. DNase I sensitivity assay in human tissue (A) foetal adrenal (B) foetal brain (C) foetal heart (D) foetal kidney (E) foetal lung and (F) Location of the defined FMO1 P0, P1 and P2 promoters. DNase I hypersensitivity sites occur within the different human tissues for the previously defined P0, P1 and P2 promoters further validating their existence. The asterisk represents DNase I hypersensitive sites that change dramatically between different tissues. The above figure shows data obtained from the UCSC genome browser. The individuals who contributed to this work are cited at the beginning of this section (4.5).
185
4.5.2 DNase I Hypersensitivity regions in different tissues
surrounding the P1 and P2 promoters (Figure 4.11)
As discussed in the introduction DNase I-seq is a technique which identifies regions
of DNA susceptible to DNase I digestion. These regions are good predictors of
regulatory regions as the chromatin is in an open conformational state. When whole
genomic DNA is treated with DNase I and fragments are sequenced, the DNase I
sensitive regions will be enriched. This is illustrated as a peak within the schematic
diagrams shown below. The stronger the peak the more sensitive that region is to
DNase I digestion.
There are two prominent DNase I HRs within the P1 and P2 promoter region. The
HR region closest to the start of FMO1 translation is present between the start of
exon 1 and ends at the start of exon 2. This region overlaps the P2 promoter -255_-
128 defined previously (Figure 4.7). The second DNase I HR is present 500/600bp
upstream of exon 1 and ends at the beginning of exon 1. This region overlaps the P1
promoter -858_-343 defined previously (Figure 4.7). The sequence upstream of this
region is not sensitive to DNase I digestion. This indicates that the DNA within this
region is conformationally not available for transcription factors to bind. It is therefore
likely that the sequence within this region shown to reduce reporter gene activity
within the pGL-1243_-343 (Figure 4.7) would not have this effect within a cellular
context. The DNase I HRs overlapping the promoter regions defined previously gives
further evidence for their existence.

186
Figure 4.11 Illustration of DNase I hypersensitivity sites within the defined FMO1 P1 and P2 promoter regions The FMO1 transcripts are shown at the top of the illustration, the first being the P0 transcript, the next being the P1 transcript and below this the P2 transcript. Below are the DNase I Hypersensitivity regions present within human (A) foetal adrenal (B) foetal brain (C) foetal heart (D) foetal kidney (E) foetal lung. (F) The regions of the P1 and P2 promoter are outlined in blue. The region shown to reduce reporter gene activity is highlighted in red. The above figure shows data obtained from the UCSC genome browser. The individuals who contributed to this work are cited at the beginning of this section (4.5).

187
4.5.3 The CTCF insulator binds upstream of the P0 promoter and may
play a role in FMO1 repression within the human liver (Figure
4.114.11)
Chip-seq experiments on the whole genome are carried out by first fixing proteins to
DNA within the cells or tissue. A specific antibody is used to isolate regions of DNA
that are bound to specific proteins. The DNA attached to this complex is then
sequenced. The sequences will be enriched where a protein has been bound. These
enriched regions are illustrated as peaks in the following figures.
Chip-seq experiments in HepG2 cells show binding of the CCCTC-binding factor
(CTCF) to the DNase I sensitive regions. CTCF is an 11 zinc-finger protein which
has a diverse regulatory function. It has been shown to be involved in the
activation/repression of transcription, insulation, imprinting and X-chromosome
inactivation (Phillips and Corces, 2009). The two CTCF-binding regions align to
previously described sequences that are sensitive to DNase I digestion within the
human tissues analysed.
The sequence containing the CTCF-binding factor present -2000 bp upstream of the
P0 transcriptional start site shows tissue-specific DNase I sensitivity. The sequence
is sensitive to DNase I digestion in heart and adrenal gland. It is not sensitive in
kidney and brain. There is low sensitivity in lung. The tissue-specific differences in
chromatin confirmation may result in tissue-specific differences in CTCF binding. The
sequence containing the CTCF binding region located further downstream shows
sensitivity to DNase I digestion within all tissues analysed.

188
In human liver the FMO1 mRNA and protein is not expressed after birth (Dolphin et
al., 1996). Reporter gene assays have shown sequences upstream from the
promoter that negatively regulate reporter gene activity (Shephard et al., 2007). The
construct which negatively regulates the human P0 minimal promoter contains the
CTCF binding region. The CTCF binding may be responsible for the loss of FMO1
expression within the human adult liver.

189
Figure 4.12 Schematic representation of CTCF binding upstream and downstream of the P0 promoter, as well as DNase I hypersensitive sites within human tissues The P0 transcript is located at the top of the page. (A) CTCF chip-seq experiment showing the location of CTCF binding within the FMO1 gene. (B) DNase I-seq experiment within HepG2 cells. (C-G) represent DNase I-seq experiments within (C) adrenal gland, (D) brain, (E) heart, (F) kidney and (G) lung. The asterisks represent the tissues where regions of DNase I sensitivity are lowered. The above figure shows data obtained from the UCSC genome browser. The individuals who contributed to this work are cited at the beginning of this section (4.5).

190
4.5.4 Chip-seq experiments identifying transcription factor binding
within P0, P1 and P2 promoters (Figure 4.13 and Figure 4.14)
Genome-wide chip-seq experiments have identified transcription factors binding
within the P0, P1 and P2 promoters. The transcription factors CEBP-β and Ini1 bind
within the defined P1 promoter. CEBP-β bound to the P1 promoter within HepG2
cells. The Ini1 factor was bound to the P1 promoter within Hela cells.
Ini1 is a component of the SW1/SNF chromatin remodelling complex. It is present
within this complex as a core sub-unit defined as SNF5/INI1 (Ae et al., 2002). This
complex physically and functionally interacts with transcriptional activators and
repressors (Sullivan et al., 2001). The complex is involved in a variety of cellular
processes by regulating cell growth and differentiation specifically myeloid,
erythropoietic, adipogenic, neuronal or myogenic differentiation pathways (Caramel
et al., 2008). The SNF5/Ini1 sub-unit is a tumor suppressor gene. It is observed to
always be inactivated in a group of highly aggressive cancers of unknown cellular
origin termed malignant rhabdoid tumours (MRT) (Muchardt and Yaniv, 1999). When
the SNF5/INI1 complex is re-expressed within these cancerous cells the cells show
adipocyte characteristics (Caramel et al., 2008). Knock down experiments using
shRNA has shown the SNF5/Ini1 is required for the differentiation of 3T3-L1
adipocytes (Caramel et al., 2008).
The second transcription factor binding within the FMO1 P1 promoter, CEBP-β, is a
critical regulator of adipocyte differentiation (Lane et al., 1999). Bioinformatic
analysis has shown a number of CCAAT binding sequences within the P1 promoter.

191
CEBP-β is able to activate transcription through binding to these sequences. The
FMO1 P1 transcript is also increased during differentiation. It is therefore possible
that CEBP-β could be activating the expression of the FMO1 P1 transcript. CEBP-β
and Ini1 have been shown to synergistically regulate PPAR-γ. Transient transfection
assays have shown upregulation of the PPAR- γ promoter dependent on both the
upregulation of CEBP-β and the SNF5/INI1 (Caramel et al., 2008). Chip-seq has
confirmed the presence of both factors within the promoter (Caramel et al., 2008).
It has therefore been observed that the SNF/INI1 complex upregulates genes during
adipocyte differentiation and it is this mechanism that could be responsible for the
upregulation of FMO1 mRNA during adipocyte differentiation.
Chip-seq experiments within HepG2 cells have shown the insulating factor CTCF
binding within the P0 extended promoter region. Within the P0 extended region Chip-
seq experiments carried out in multiple cell lines have revealed other transcription
factor binding events. These are a second insulating factor, Rad21, which can co-
regulate genes with the CTCF factor and NFκB also binds within a region of the P0
extended promoter.

192
Figure 4.13 Illustration of transcription factor binding within the FMO1 P1 and P2 promoter regions The FMO1 transcripts are shown at the top of the illustration, the first being the P0 transcript, the next being the P1 transcript and below this the P2 transcript. Below are the DNase I Hypersensitivity regions for human (A) foetal adrenal (B) foetal brain (C) foetal heart (D) foetal kidney (E) foetal lung, (F) Illustration of the chip-seq signal for the binding of the transcription factors Ini1 and C/EBP-β (grey bars), (G) The regions of the P1 and P2 promoter are outlined in blue. The above figure shows data obtained from the UCSC genome browser. The individuals who contributed to this work are cited at the beginning of this section (4.5).

193
Figure 4.14 Schematic representation of transcription factors that bind to the P0 promoter A-E represent DNase I-seq experiments within (A) adrenal gland, (B) brain, (C) heart, (D) kidney and (E) lung, (F) Illustration of Chip-seq signals showing binding of transcription factors to the P0 extended promoter region and a downstream DNase I hypersensitive region. The above figure shows data obtained from the UCSC genome browser. The individuals who contributed to this work are cited at the beginning of this section (4.5).

194
The region downstream shown to be sensitive to DNase I digestion in all tissues
examined and HepG2 cells binds the CTCF factor. In addition chip-seq experiments
in multiple cell lines has shown the binding of additional transcription factors
including Ini1, c-myc, POU2F2, PAX5-N19, TCF12, EBF and PU.1 (Figure 4.14).
4.6 FMO1 P2 promoter mutations and their influence on promoter activity FMO1 sequences with mutations were created to help define protein factors that
regulate the expression of the gene. Mutations were created within protein-binding
regions predicted by bioinformatics and conserved between human and mouse.
Two independent mutations were created within the defined human FMO1 P2
promoter (-255_-128) (Figure 4.15). The first mutation to be examined lies within the
GC-box sequence predicted to bind SP1 (Figure 4.8). Site-directed mutagenesis was
used to change the sequence from GGGGCGGG to GGGTTGGG. This mutant
plasmid is defined as pGL3-255_128* in section 4.6.2. This change is known to
inhibit SP1 binding (Santa Cruz Biotechnology). The second mutant sequence was
created by mutating a predicted half site for a nuclear receptor. In this case the
sequence was changed from AGGTCA to AGCACA. This change is known to inhibit
nuclear-receptors which bind to this motif (Santa Cruz Biotechnology). This mutant
plasmid is defined as pGL3-255_128** in section 4.6.2.
4.6.1 Mutations in the FMO1 P1 promoter A natural variation, -809G>A, is observed within the P1 promoter active region which
was defined as the region -858_-600 (see chapter 3). A second natural variation, -
338_-337CTdel occurs at the start of exon 1. The -809G>A is not predicted to be

195
present within a DNA-Protein binding region. However, it has been shown that that
polymorphism can effect gene expression from further distances than directly to the
DNA sequence to which the transcription factor binds. Separate PGL3 reporter gene
constructs were made containing the two natural variations using site-directed
mutagenesis.
4.6.2 A mutation introduced into the FMO1 P2 promoter reduces reporter gene activity Luciferase activity driven by the P2 promoter GC box mutant (pGL-255_-128)*
sequence was reduced to that of the negative control indicating that the mutation
abolishes P2 promoter activity (Figure 4.16). However, when the mutant pGL3-255_-
128**, which is present further downstream was transfected into COS-7 cells there
was no significant change in reporter activity compared with that of the wild-type
sequence.
The P1 mutants were unable to be tested as when COS-7 cells were transfected
with the P1 promoter the activity of the promoter was severely reduced. Therefore
comparisons to the mutants would not be as informative.
Many variables had been tested to find the reason for this loss of activity. The
construct containing both the P1 and P2 promoter sequences also lost reporter gene
activity which is suggestive of a transcriptional response within the cells rather than
the DNA being the cause of the loss of activity. Even though, DNA was remade on
independent occasions and tested for subsequent activity. New cell stocks were
grown to test if the cells had biochemically changed due to increased numbers of
passages. The promoter activity still remained low.

196
Figure 4.15 Illustration of mutations introduced to the P2 promoter reporter gene construct and the natural variations occurring within the P1 promoter (A) The P2 promoter showing factors predicted to bind. The red asterisks represent mutations made. (B) The P1 promoter sequence showing the location of natural variants (blue asterisk) that were introduced into the P1 reporter gene vector.

197
Figure 4.16 Reporter gene activity of the pGL3-255_128 P2 promoter construct and the pGL3-255_128* GC box mutant within COS-7 cells COS-7 cells were transfected with pGL3 constructs. The sequence location is
shown within the legend. The co-ordinates are relative to the FMO1 translation start codon. The pGL3 basic plasmid was transfected as a negative control. All experiments were done in triplicate and the error bars indicate the standard deviation.
198
Bioinformatic analysis was undertaken and heat shock factor was predicted to bind
within the P1 promoter. This factor has been shown to regulate genes in combination
with the insulating factor lin1. Lin1 has been shown to bind within the FMO1 P1
promoter through chip-seq experiments (Figure 4.14).
Therefore media were and incubation conditions were changed (incase of stress or
oxygen changes in regulation). This did not result in a change in reporter gene
activity. Future experiments could produce a second shorter construct to identify the
possible negative transcriptional regulator. Activity has currently not been achieved
again for the P1 promoter within COS-7 cells.
4.6.3 Loss of protein binding due to a mutation within the GC box protein binding region of the P2 promoter is detected by a gel shift assay To determine whether protein binding had been affected, a gel-shift assay was
undertaken. The probe which contained the P2 promoter (-255_-128) was amplified
from the PGL3-BASIC (-255_-128) vector and the PGL3-BASIC (-255_-128)* vector.
This probe was incubated with 10 µg of COS-7 protein and subsequently passed
through a 4% native polyacrylamide gel.
The wild-type probe (-255_-128) resulted in a number of shifted bands representing
different DNA-protein binding events. When the mutant form of the probe (-255_-
128)* is analysed with the same conditions, two of these bands are removed.
Therefore mutation of the GC box binding region of the FMO1 P2 promoter removes
binding of a protein within this region in addition to reducing reporter gene activity
(Figure 4.17).

199
Figure 4.17 Gel shift assay showing loss of protein binding at the FMO1 P2 promoter due to a mutation within the GC binding box The lowest band represents the unbound (free) DNA, and above this, bands represent DNA-protein complexes. Comparing the GC box sequence wild-type (255_-128) and mutant (-255/-128*) shows the loss of a DNA-protein complex. The asterisk shows the loss of protein-DNA complexes with -255_-128 DNA compared with the complexes formed with -255_-128*.

200
4.7 The significance of a polymorphism, -11C>T, which potentially reduces the translational efficiency of the FMO1 protein The effect of polymorphism on translational efficiency was discussed in chapter 1.18
and several examples were discussed where secondary ATG translation initiation
sites exist, and have affected translational efficiency, and as a result play roles in
disease.
In the course of the work described in this thesis, a common polymorphism was
identified within the FMO1 gene. This results in a second ATG upstream of the
defined translational start site. This polymorphism, a C>T transition, occurs in-frame,
12 base pairs upstream of the accepted ATG for FMO1. This is the same distance as
seen between the ATG initiation sites in the vitamin D receptor gene (Zysow et al.,
1995).
Two constructs were made using the vector pSP-luc, containing the FMO1 P2 5′UTR
sequence. The making of this vector is outlined in the methods section (2.20.2 FMO1
P2 leader sequence construct). This vector contains an SP6 bacterial RNA
polymerase binding site which allows RNA to be made in-vitro using a viral vector as
a template. The RNA contains the luciferase gene, the upstream FMO1 P2 5′UTR
sequence, and the FMO1 3′UTR. RNA can be made in-vitro and translational
efficiency of different constructs can be observed in cells using the dual luciferase
reporter gene assay.
As with the pGL3 reporter gene constructs, the pSP-luc vector contains the
luciferase reporter gene and therefore expression of the protein product can be

201
monitored. Both constructs to be tested for translational efficiency contain the
accepted FMO1 translational start codon. Within the upstream ATG region a
polymorphism is observed. Some individuals contain an ATG, and others an ACG
(see chapter 3 for frequencies). One of the constructs contains the ATG form and the
other the ACG form. The variation was introduced using PCR site-directed
mutagenesis (2.28).
The amount of lipid was optimised for 1µg of RNA. The lipid ratios of 1:1 and 2:1
were tested. Transfection of RNA produced from the ATG plasmid was transfected
with a RNA:lipid ratio of 1:1 and 2:1. The RNA lipid ratio of 2:1 produced significantly
higher reporter gene activity.
Preliminary data (Figure 4.18) suggest that the construct containing the ATG/ATG
form produces a significantly larger amount of protein than the ACG/ATG construct.
This polymorphism would only have an effect within P2 transcripts as it occurs within
the P2 leader sequence for translation. Individuals containing the upstream ATG
may therefore produce more protein and, as a result, may process drugs at an
increased rate.

202
Figure 4.18 Reporter gene activities of RNA produced from the pSP-ATG/ATG and the pSP-ACG/ATG vectors (A) The amount of lipid-reagent (LTX) used to transfect RNA was optimised. (B) The relative reporter gene activity of the RNA produced from the pSP-ATG/ATG and the pSP-ACG/ATG vectors. The asterisk indicates that RNA produced from the pSP-ATG/ATG produces significantly more reporter protein than RNA produced from the pSP-ACG/ATG vector. (C) The FMO1 5′UTR of the P2 transcript illustrating the two ATG translation sites and the location of the -11T>C polymorphism.

203
Discussion
Chapter 1 describes the quantification of Fmo1 expression in multiple mouse tissues.
The results reveal the high expression of the gene in extra-hepatic tissues and in
particular in tissues that are fundamental in energy homeostasis. This gives support
for a role for FMO1 in energy homeostasis. This chapter aim was to identify the
regulatory regions controlling the transcription of the different FMO1 transcripts.
These regions could then be used to identify and test genetic variation for effects on
transcription.
Transfection of the three different cell lines with reporter gene constructs has
identified novel promoter regions upstream of the P1 and P2 transcriptional start
sites. Chromatin analysis within multiple human tissues gives evidence for both
promoters also being within open chromatin regions. Selective use for the P1 and P2
promoter has been observed in the three cell lines. In the human kidney cell line HK-
2 the P2 promoter is favoured and within the mouse cell line 3T3-L1 the P1 promoter
is favoured. Several cDNA clones have been isolated from mouse that correspond to
P1 transcripts. However, only a single cDNA clone has been reported that arises
from the P1 promoter in humans (Shephard et al., 2007). In contrast, several cDNAs
corresponding to transcripts from the P2 promoter have been reported in humans.
The real-time quantitative PCR data from mouse tissues shows a preference for the
P1 promoter over the P2 promoter. The data suggests the P2 promoter is favoured
within human and the P1 promoter is favoured within mice. This would explain the
lack of polymorphism within the human P2 promoter and the presence of a number
of SNPs for the human P1 promoter. The mouse contains polymorphism within the
homologous P2 promoter region.
204
Analysing the FMO1 P1 and P2 promoters reveals transcription factor binding sites
that could be responsible for increases in both transcripts. CCAAT binding regions
are predicted within the P1 promoter. Chip-seq data also gives evidence for CCAAT
binding protein (CEBP-β) binding within the defined promoter. As the P1 and P2
transcripts are both elevated when 3T3-L1 cells undergo differentiation to adipocytes
it is possible that CEBP-β binding could responsible. The thyroid hormone receptor is
also predicted to bind within the P1 and P2 promoter. This is a good candidate in the
future to analyse its effect on Fmo1 expression due to its role in energy homeostasis
in the mouse.
Transfection of differentiated 3T3-L1 adipocytes was successful and reporter gene
activity was high. In future experiments, regulatory polymorphism could be analysed
in the context of these cells with further optimisation of controls. Protein extracts can
also be isolated and gene expression analysis can be analysed using these extracts
to further understand Fmo1 gene regulation within brown and white adipose tissue.
The insulating factor CCTF has been shown to bind in two locations surrounding the
FMO1 P0 transcriptional start site. One site is -2700 bp upstream of the human P0
promoter. This region has been shown to down regulate reporter gene activity when
attached to either the human or mouse P0 minimal promoter. Comparative analysis
between mouse and human sequences show the binding regions of CCTF are not
conserved between mouse and human. Down regulation of the human P0 promoter
in the liver shortly after birth could be due to CTCF binding within the P0 promoter.
A second CCTF binding region is present downstream of exon 0. This could play a
role in the regulation of the downstream P1 and P2 promoters, although this is purely

205
speculative without experimental evidence. Further experiments to repress the CTCF
binding factor and development of an assay to measure FMO1 expression would
determine the effects of the CTCF binding.
Observing Fmo1 expression increasing in 3T3-L1 adipocyte differentiation (see
chapter 1) gives an opportunity to understand Fmo1 regulation in fat. Transcription-
factor binding consensus sites are present within the P1 and P2 promoter regions
that are good candidates for upregulating FMO1 during 3T3-L1 differentiation.

206
Chapter 5
Dideoxy sequence analysis of the human FMO1 P0, P1, and P2
promoters

207
Chapter 5: Dideoxy sequence analysis of the human FMO1 P0, P1, and P2 promoters Introduction
In the previous chapter, two FMO1 promoters, P1 and P2 were defined using
reporter gene assays. Genetic polymorphism located within these promoter regions
may alter the binding of cis-acting regulatory elements and influence transcription
efficiency. Therefore it is desirable to identify polymorphism present within these
regions as well as the previously defined P0 promoter (Shephard et al., 2007). In
addition to the sequence analysis of the two novel FMO1 promoters carried out as
part of this thesis, the NIEHS (National Institute of Environmental Health Sciences)
based in Washington University has sequenced these regions from 90 individuals of
unknown origin (Zaitlen et al., 2005). The SNPs discovered in the NIEHS study have
subsequently been genotyped by investigators within the HapMap consortium using
samples obtained from the Coriel repository (2003). These individuals were originally
genotyped within 4 populations and subsequently genotyped for a percentage of the
SNPs within additional populations. The original populations genotyped are the CEU:
Utah residents with Northern and Western European ancestry from the CEPH
collection, CHB: Han Chinese in Beijing, China, CHD: Chinese in Metropolitan and
the YRI: Yoruban in Ibadan, Nigeria, The additional populations genotyped for only a
limited number of SNPs are the GIH: Gujarati Indians in Houston, Texas, JPT:
Japanese in Tokyo, Japan, LWK: Luhya in Webuye, Kenya, MEX: Mexican ancestry
in Los Angeles, California, MKK: Masai in Kinyawa, Kenya, TSI: Tuscan in
Italy,ASW: African ancestry in Southwest USA, Denver, Colorado. It was decided
that re-sequencing of these regions may reveal new genetic polymorphism in the
FMO1 promoter regions as DNA from only 90 individuals, of unknown origin, had

208
been sequenced by NIEHS. In addition, SNPs found at low frequency by the NIEHS
have not been genotyped by the HapMap consortium. The project described in this
thesis can confirm the existence of these polymorphisms and extend our knowledge
on FMO1 variation. The four populations with the most complete genotype data were
available to us to be re-sequenced for the P1 and P2 FMO1 promoter regions.
5.1 Experimental design: Number of individuals and regions to be sequenced Once genetic polymorphisms within the FMO1 promoter regions are identified they
subsequently need to be tested for functional consequences and for association with
drug response to FMO1 substrates. If FMO1 genetic polymorphism is to be used as
an indicator for drug response it is desirable that the polymorphisms are common. A
common polymorphism will have a frequency of more than 5% within the population.
This would be predicted to occur within 1 in 20 chromosomes. Individuals contain
two alleles of the gene. Therefore the genetic variation should be apparent on
average by sequencing 10 individuals.
The availability of individual DNA samples from the different populations is a limiting
factor. We had available to us only 11 individuals from the YRI population and 11
from each of the JPT and HAN populations. Therefore all available YRI, JPT and
HAN population DNA samples were chosen for sequencing. The JPT and HAN
populations were combined as the populations have shown similar haplotypes in
previous studies. There were many CEPH samples to choose from and these initially
were all sequenced in 40 individuals within one region of the FMO1 5′ flanking
sequence, +53 and -629. The number of samples was then reduced to 19 individuals
when subsequent regions of the upstream FMO1 gene were sequenced. The

209
regions to be analysed were the P0, P1 and P2 promoter regions. The human P0
promoter was defined as between -521_+50 upstream and downstream of the P0
transcriptional start site (Shephard et al., 2007) and P0 SNPs are throughout this
chapter SNPs and sequenced regions are defined from the P0 transcriptional start
site. The P1 and P2 promoter regions are located at -255_-128 and -858_-128 as
defined in chapter 2. In the case of the P1 and P2 promoters the sequence is
numbered from the „A‟ of the ATG translation initiation codon. For the P0 promoter,
primers were designed to encompass the -521 to +50 region, which would
encompass the currently known SNPs within this region (Fig.5.1A). The region of
sequence which encompassed the P1 and P2 promoter regions was too large to be
sequenced within one sequencing run. As a result primer pairs were designed for
two overlapping regions (Fig.5.1). The first region was between -629 and +53 and
the second region was between -1158 and -527 (see Fig.5.1B). The first region was
amplified to include the nucleotide at +53. This was to ensure the SNP -11T>C
would be genotyped. This SNP introduces a potential upstream ATG translation
initiation codon. The region between the P1 and P2 promoters was also sequenced
as this contains an exon, defined as exon 1, which contains the 5′UTR sequence of
the P1 transcript.

210
Figure 5.1 Location of primers used to amplify DNA from individuals for subsequent dideoxy sequence analysis (A) The P0 promoter region. The sequence in red defines exon 0. The primer locations are in bold and underlined. (B) The P1 and P2 promoter region. The sequence in red defines the exons 1 and 2. The black primers represent the primer pairs used to amplify the first region (-629_+53) for sequencing. The blue primers represent the primer pairs used to amplify the second region for sequencing (-1158_-527).

211
5.2 Identification of novel polymorphism within the FMO1 P1 and P2 promoter regions (Fig.5.2) Sequencing of the FMO1 P0, P1 and P2 promoters has revealed two novel
polymorphisms. A 2 base pair deletion was observed at the start of exon 1 (-338_-
337delCT.The two bases deleted were CT and are identified within Fig.5.5. This
SNP is situated at the start of transcription for the P1 transcript. It therefore could
affect the binding of the RNA polymerase at this site. The SNP was observed only
within the European population (CEU). It is not present within the YRI and JPT and
HAN populations. It was observed within 4 individuals in a heterozygote state. This
meant that the individuals had one copy of the deletion and one copy with no
deletion. The frequency of this variant within the European population is calculated to
be 5%. The chances of an individual being homozygous for the polymorphism are
0.0025 or 1/400. This is therefore defined by the original criteria as a common
polymorphism within the European population.
A second novel polymorphism was observed at position -497C>T and was observed
within one European individual. The SNP was observed in the heterozygote state.
The SNP allele frequency was 1.25%. The chances of an individual being
homozygote are 0.0001% or 1/6400. The -497C>T is therefore a low frequency
polymorphism.

212
5.3 Confirmation of the -515G>A and -503C>T SNPs and genotyping in CEU, YRI and JPT/HAN populations The HapMap project selectively genotyped SNPs within the FMO1 gene and
surrounding non-coding region. SNPs previously defined at low frequency by the
NIEHS were not chosen for genotyping. Therefore the SNP -515G>A was not
chosen for genotyping. Using HapMap samples, a second SNP -503C>T was
genotyped, within the CEU, JPT and HAN populations, by the Sanger Centre, UK.
The YRI population was not genotyped. The P1 and P2 sequence with the HapMap
genotyped SNPs are illustrated in Fig.5.3. The figure also shows the HapMap
frequencies of the SNPs genotyped within this study and their resulting haplotypes
within the three populations.
The polymorphism -515G>A had only previously been identified to be heterozygous
within 1 out of 90 individuals (180 haplotypes) sequenced. This individual was
identified from the NIEHS sequencing of 90 individuals with an unknown identity. The
SNP has not been genotyped by HapMap or any other gentoyping project. Within the
European population (CEU) the genotype frequency of the common G/G genotype
was 0.83 and the frequency of heterozygotes was 0.17 (Fig.5.2). This frequency is
higher than that of 0.01 previously observed from the NIEHS sequencing project.
Within the YRI population, the A allele has a much higher frequency than in
Europeans. The frequency of G/G homozygotes is 0.45 and the frequency of
heterozygotes was 0.55. There were no observed A/A homozygotes (Fig.5.2). This is
due likely to only 11 individuals being sequenced from within this population group.
Within the JPT and HAN populations the SNP is not polymorphic from the 19

213
samples sequenced. We have therefore shown that the -515G>A SNP is at a higher
frequency than previously observed and is common within the YRI population.
A SNP located at -503C>T, 12 base pairs downstream of -515G>A, is present within
the samples sequenced. This SNP has been observed within the samples
sequenced by the NIEHS project. The frequency of the C/C genotype is 0.644. The
heterozygote frequency is 0.267 and the T/T genotype frequency is 0.089. This SNP
is recorded as being genotyped within the Ensembl database (www.ensembl.org) in
individuals used within the HapMap project. The populations genotyped are CEPH
and JPT and HAN. No variation is observed within these individuals and all
individuals have the genotype C/C. This seems to be a reporting error. The C/C data
was obtained outside of the HapMap consortium by the Sanger Institute, UK. The
error may be due to the automated analysis of the sequence data. Within the CEPH
population, the genotype frequencies are 0.72 for the C/C genotype and 0.28 are
heterozygote for this SNP (Fig.5.2). There are no T/T homozygotes within the CEPH
individuals sequenced. In the YRI population the frequency of the C/C genotype is
0.18, the C/T genotype is 0.45, and the T/T genotype is 0.36 (Fig.5.2). This is very
different from the CEPH individual genotypes as the T allele is common in the YRI.
In the JPT and HAN populations sequenced, there was no variation at this locus and
all individuals had the C/C genotype.
The SNPs -809G>A, -513G>A, -312A>T and -11T>C were genotyped within this
study in the CEU, YRI and JPT/HAN populations. The frequencies obtained from this
study are given in Fig.5.2. Individuals from these populations have also been
genotyped by the HapMap consortium. The SNPs from the HapMap consortium

214
Figure 5.2 The frequency of alleles and genotypes within (A) the FMO1 P1 and P2 promoter and (B) the FMO1 P0 promoter From left to right: The first column shows the polymorphism (SNP) identifier which can be found within the dbSNP database (www.ncbi.nlm.nih.gov/projects/SNP/). The second column shows the position of the SNP relative to the A of the ATG translation initiation codon. The third column shows the base change for the polymorphism. The fourth column shows in order, the frequencies of the two alleles and subsequently the frequency of the genotypes within the CEU population. The fifth column shows the allele and genotype frequencies within the YRI population. The last column shows the allele and genotype frequencies within the HAN/JPT populations.

215
show similar allele and genotype frequencies (see figure 5.3C for HapMap SNP
frequencies) and therefore the frequencies are not discussed here.

216
Figure 5.3 Illustration of the HapMap consortium genotyped SNPs within the FMO1 P1 and P2 promoter region (A) The P1 and P2 promoter region with the HapMap genotyped SNPs highlighted in blue. The red blocks illustrate exon 1 and exon 2 of the FMO1 gene. (B) The haplotypes constructed by the HapMap consortium and their frequencies within the YRI (Yoruban), CEU (European) and CHB/JPT (Japanese and Han Chinese) populations. (C) The original frequencies of the alleles and genotypes are shown for each SNP in the order they appear along the gene.

217
5.4 Construction and analysis of FMO1 P1, P2 haplotypes in CEU, YRI and JPT/HAN populations Within the following section the terms linkage and linkage disequilibria will be used.
The term linkage is used to define loci that are present on the same chromosome.
The term linkage disequilibrium is used to define the non-random association of
alleles.
Haplotypes, which are how polymorphisms occur along the chromosome, give a
profile of how polymorphism is inherited and physically linked. This gives the
researcher an ability to study the effect of multiple SNPs and how they might act
together. As I have previously defined the FMO1 P1 and P2 promoters it would be
desirable to study the SNPs within this region as they appear within the individuals
sequenced as part of this project and by the sequence consortia. This analysis
allows us to identify the highest frequency haplotypes. These could then be tested
for their functional effect in downstream experiments. Studying haplotypes also gives
us the opportunity to identify the inherited genetic unit, and differences in this unit,
between different populations.
Sequencing data does not tell us on which of the two chromosomes the variation
occurs. Therefore to determine the phase of the haplotypes (which chromosome
they lie on) the genotypes have to be reconstructed. An alternative to haplotype
reconstruction is to phase haplotypes from family pedigrees. In this study phasing
haplotypes is achieved through haplotype reconstruction using statistical methods.
The haplotype reconstruction was undertaken using the software Phase (Stephens
and Donnelly, 2003). Phase software uses a Bayesian statistical method to

218
determine predicted haplotype frequencies and recombination rates. The method
identifies known haplotypes (homozygous loci) and uses the assumption that the
unknown haplotypes (due to heterozygosity) will be similar to the known haplotypes.
The predicted haplotype frequencies and their standard deviations within the
different populations are shown in Fig.5.4 and the most highly frequent haplotypes
and their standard deviations are shown within Fig.5.5. The haplotypes are written in
order of how the SNPs are observed along the chromosome (see Fig5.5 for
annotation). The first SNP will be the most 5′ and the last SNP the most 3′. Some
populations are not polymorphic for some of the SNPs. The locus will still be present
within the haplotype shown for ease of comparison.
The YRI population has a larger number of predicted haplotypes compared to the
other two populations. This is due to the larger variability seen between the
individuals within this population. For example for the SNPs, -809G>A and -513C>A,
the YRI population contain homozygote individuals for both alleles. This is not seen
in the other population groups. Therefore there is more variability within the YRI
population and as a result a larger number of predicted haplotypes is seen. The
CEPH haplotypes are more variable than the JPT and HAN population due to a
number of loci not being polymorphic within the JPT and HAN populations. The
SNPs that are not polymorphic within the JPT and HAN population are -515G>A, -
513G>A and -503C>T.
Examining the frequency of common haplotypes within the different populations
identifies large differences between the populations. The predominant haplotype
within the CEPH population is the GGGCC(CT)AT haplotype and occurs at a

219
predicted frequency of 53% within this population (Fig.5.5). Each SNP within the
haplotype string is identified within the sequence annotation in Fig.5.5. The second
most predominant haplotype is GGGCC(CT)AC and occurs at a frequency of 17%
(Fig.5.5). The rest of the predicted haplotypes are of very low frequency. Therefore
70% of individuals have the same first seven 5′ to 3′ polymorphisms within the FMO1
P1 and P2 promoter region (GGGCC(CT)A) and only the last SNP location is
polymorphic. This polymorphism is -11T>C. The polymorphism introduces a potential
second ATG initiation codon in those individuals with the T allele. The P1 and P2
polymorphisms upstream of this may have occurred on the background of this
polymorphism.
The highest frequency haplotype within the YRI population is the AGATC(CT)AC
haplotype which has a predicted frequency of 18% (Fig.5.5). The second most
frequent haplotype is GGGCC(CT)AC at a frequency of 10% (Fig.5.5). This
haplotype is also seen at a high frequency within the CEPH population. The most
frequent predicted haplotype within the YRI population contains 4 out of 9 variations
different from the two most frequent CEPH haplotypes. The high frequency YRI
haplotypes also do not contain the T allele of the polymorphism -11C>T.
The most highly frequent haplotypes seen within the JPT and HAN populations are
the GGGCC(CT)AT haplotype at a frequency of 67% and the GGGCC(CT)AC
haplotype at 29% (Fig.5.5). These two haplotypes are also the highest frequent
haplotypes within the European population.

220
Figure 5.4 Predicted haplotype frequencies of the FMO1 P1 and P2 promoter regions in different populations The haplotypes are made up of the 8 known SNPs and the novel SNP identified in this study. They are shown in order of how they appear from the 5′ to the 3′end of the gene (see Fig.5.5 for annotation). The location of the SNPs can be visualised in Fig.5.3. Haplotype frequencies are shown for the (A) YRI (Yoruban) (B) CEU (European) (C) JPT/HAN (Japanese and Han Chinese). The haplotypes highlighted in red have higher standard deviations than there predicted frequency. They are therefore likely to be inaccurate.

221
Figure 5.5 (A) Illustration of the polymorphisms that reside within the P1 and P2 promoter regions of FMO1 and (B) the high frequency haplotypes within the populations analysed (A) Exon 1 and exon 2 are highlighted in red. The SNPs are highlighted in blue. The novel SNP identified within this study is highlighted at the start of exon 1 (CT/DEL). (B) The predominant haplotypes and their frequencies and standard deviation are shown for the YRI (Yoruban), CEU (European) and JPT/HAN (Japanese and Han Chinese) populations. The eight base pair string of the haplotype corresponds to the 8 SNPs shown in (A) ordered from the 5′ to 3′ of the sequence.

222
5.5 Construction and analysis of FMO1 P0 haplotypes in CEU, YRI and JPT/HAN populations Sequencing of the P0 promoter has revealed no new novel variation. In total 3 SNPs
have been identified which are -452G>A, -188C>T and +58C>A (Fig.5.2). The
frequency of the SNPs can be observed in figure 5.2. The frequencies are similar to
those shown for these SNPs by HapMap. A further 2 SNPs previously identified
within the NIEHS project were not identified in the present study. These are
rs28384812 located at position -10C>T and rs17515666 located at +22T>C. The two
SNPs were identified within the NIEHS project and are at low frequency. The C allele
of the -10C>T SNP occurs at a frequency of 0.994 and the T allele 0.006. The T
allele of the +22T>C SNP occurs at a frequency of 0.994 and the C allele at a
frequency of 0.006. The two SNPs are low frequency polymorphism.
Haplotypes were constructed from the three genotyped SNPs using the phase
software. The CEPH and JPT/HAN populations show a higher number of haplotypes
than the YRI population (Fig.5.6). This is due to the -452G>A A allele being fixed
within the YRI population. In both the CEPH and JPT/HAN populations this is
polymorphic.
The most frequent haplotype within the YRI population is the ATC haplotype at a
frequency of 54% (Fig.5.6). The second most frequent haplotype is the ACC
haplotype at a frequency of 26% and the third is ATA at a frequency of 16%
(Fig.5.6). Within the CEU and JPT/HAN populations the highest frequency haplotype
is GCC at a frequency of 53% and 33% respectively (Fig.5.6). Therefore the most
frequent haplotype within these populations contains the G allele of the -452G>A

223
which is in contrast to the YRI individuals which contain the A allele. The second
most frequent haplotype within the CEU and JPT/HAN populations is the ATC
Figure 5.6 Predicted haplotype frequencies of the FMO1 P0 promoter region in different populations The predominant haplotypes and their frequencies and standard variation are shown for (A) the YRI (Yoruban), (B) CEU (European) and (C) JPT/HAN (Japanese and Han Chinese) populations. The three SNPs used in the haplotype string are -452G>A, -188C>T and +58C>A.

224
haplotype at a frequency of 23% and 24% respectively (Fig.5.6). The third most
frequent haplotype in the CEU is ACC at 11% and the third most frequent haplotype
within the JPT/HAN population is the ATA haplotype at a frequency of 20% (Fig.5.6).
This reflects the higher frequency of the A allele at the +58C>A locus.
Discussion
The identification of regulatory variation within human FMO1 gene is important as it
may be linked to the efficiency of drug metabolism. These SNPs could therefore act
as indicators of drug metabolism efficiency within individuals. Re-sequencing of the
defined promoter regions is therefore desirable in identifying SNPs within the wider
population. Upon discovery of SNPs, they can be tested functionally for their effects
on transcription or cis-acting regulatory binding.
Re-sequencing the FMO1 promoters has yielded two newly identified
polymorphisms. One of which occurs at a relatively high allele frequency of 5%. This
polymorphism, -337_338CTdel is a deletion that occurs at the start of exon 1. This is
the transcripitional start site for the P1 transcript. The P1 transcript, as shown in
chapter 1, is the predominant transcript in most extra-hepatic tissues. The
polymorphism could have an effect on transcription as it is a 2 base pair deletion
within the start region of transcription. This could affect the binding efficiency of RNA
polymerase II and therefore influence the amount of the P1 transcript produced. The
second identified SNP, -497A>T is predicted to occur in 1/6400 individuals. This is a
low frequency polymorphism and as such is not useful as a diagnostic of drug
metabolism.

225
Haplotype construction within the three different populations has revealed
differences in the abundance of haplotypes and revealed high frequency haplotypes
within each population for both the P0, P1 and P2 promoters. This haplotype
construction will be useful in further in-vitro analysis of promoter activity or protein
binding. Instead of testing each individual SNP for effects on transcription, the
haplotype can be tested. This will reduce the number of SNPs to analyse and also
the effects of SNPs will be studied as they appear on the chromosome.
Analysing haplotypes of the P1 and P2 promoter regions indicate the C and T allele
of the -11C>T variation have distinct haplotypes. Seventy-percent of the predicted
haplotypes for the CEU population and 95% for the JPT and HAN population only
vary at this polymorphism. The most frequent haplotype contains the T allele and the
second most frequent contains the C allele. Within the YRI population the -11C>T
allele has a more predictable haplotype than the other two populations. The two
most frequent haplotypes contain the C allele. The variation between the two most
common YRI haplotypes occur further upstream at the -809G>A and -513G>A. The
most frequent being the haplotype with the A alleles.
These data suggest the P1 and P2 promoter haplotypes containing the T allele of the
-11C>T variation originated within Africa and became more frequent as individuals
migrated out of Africa. This may be due to the haplotypes conferring an advantage to
those individuals. FMO1 is a drug-metabolising enzyme and it may have given the
individual an advantage in metabolising new compounds found outside of Africa.
Alternatively, the T allele may also be more frequent in other African populations and
the CEPH and JPT/HAN may have similar ancestry to these populations. It would

226
therefore be desirable to test the effect of the -11C>T SNP functionally as it may
confer a selective advantage.

227
Chapter 6
Optimisation and development of
capillary DNase I footprinting for the
detection of regulatory polymorphisms
that alter DNA-protein binding events

228
Chapter 6: Optimisation and development of capillary DNase I footprinting for the detection of regulatory polymorphisms that alter DNA-protein binding events
Introduction
This chapter describes the optimisation of a high-throughput DNase I footprinting
method for identifying the sequence of DNA bound to protein, and the affect of
genetic polymorphism/mutation on protein-DNA interactions.
Recent advances in the methodology of DNase I footprinting allow capillaries to be
used to analyze DNA fragments as opposed to the traditional method of using gel
electrophoresis (Wilson et al., 2001; Zianni et al., 2006). This makes the technique
safer and more reproducible as fragments to be analysed are labelled fluorescently,
compared to traditional DNase I footprinting where DNA is radio-labelled.
With the use of capillary technology the DNase I footprint can be used for high-
throughput applications as the DNA fragments are analyzed using the ABI prism
genetic analyzer 3730, which allows 96 samples to be analyzed in a single run as
opposed to a few samples traditionally analysed on a single polyacrylamide gel. The
machine can analyse a maximum of 12 plates simultaneously.
We chose to incorporate this new methodology for a novel application in which
human FMO1 promoter polymorphisms could be screened for their affect on DNA-
protein binding. As the FMO1 promoters are tissue-specific (see chapter 1) it is
desirable to analyse the influence of polymorphism in different tissues through the
use of extracts from different tissue types. As the method allows a large number of

229
samples to be analysed this would be possible. Any change in DNA-protein binding
observed is likely to change the amount of transcript produced and subsequently the
amount of protein. Genetic polymorphisms shown to change DNA-protein binding by
this method could then be used in association studies to determine polymorphisms
that are associated with drug response.
For the proposed method to be applicable to the screening of promoter
polymorphism it would have to identify DNA-protein binding events using an extract
of proteins which represented a situation within a cell line or tissue. It would also
have to be able to detect the affect of regulatory polymorphism on DNA-protein
binding.
6.1 Labelling and detection of DNA fragments for capillary DNase I footprinting The DNA to be analysed is labelled with a suitable fluorescent dye that can then be
detected within the capillaries during fragment analysis using the genetic analyzer
3730. DNA is labelled by PCR using a labelled oligonucleotide (see section 2.11 for
method). The DNA template for the PCR can either be plasmid or genomic DNA.
Screening a large number of genetic variations using a large number of individuals
would ideally be carried out by directly amplifying the desired region of an
individual‟s DNA. This would remove the need for cloning.
The dye that is incorporated on to the DNA during the PCR is quantified using the
ABI PRISM 3730 Genetic Analyzer. The dye chosen to label DNA fragments was
FAM. FAM is a fluorescein amidit, commonly used as 5′ fluorophore for qPCR
probes or as 5′ labelled primer for different DNA sequencing approaches on ABI

230
instruments. To analyse the FAM-labelled fragments we used a genotyping program
capable of analysing 5 separate dyes. This is known as the G5 dye set. The 5 dyes
are FAM/VIC/NED/PET/LIZ. It has been shown previously that the dye FAM gives
the strongest and most robust signal. As a small amount of DNA (50ng-200ng) is to
be used the FAM label is the most appropriate.
6.2 Footprinting analysis of the Simian Virus 40 promoter (SV40)
The SV40 promoter has previously been analysed using traditional DNase I
footprinting. The promoter is well characterised and the DNA sequences to which
various transcription factors bind are known (Dynan and Tjian, 1983). The SV40
promoter was therefore chosen as a positive control for the optimisation of DNase I
capillary footprinting.
The SV40 DNA was obtained in a linear form from the Promega corefootprinting kit.
To label the SV40 promoter DNA with FAM it was necessary to clone the promoter
into a TOPO vector (see section 2.13 for method). This was to ensure the template
could be produced in large quantities and used for future experiments. It also
allowed the promoter to be amplified upstream of the start of the SV40 promoter
allowing the full promoter sequence to be analysed for DNA-protein binding. To
ensure effective TA cloning the SV40 DNA was incubated at 72o C for 10 minutes
with dATP and Taq polymerase. The Taq polymerase adds adenine nucleotides to
the end of the linear DNA which is a requirement for TA cloning to be successful.
Once cloned, the vector could be transformed (see section 2.5) and DNA prepared in
a large quantity (see section 2.3).

231
The cloned SV40 DNA was then used as the template to produce a FAM-labelled
fragment for capillary electrophoresis. PCR was carried out with a 5′ FAM-labelled
forward primer located at the start of the SV40 promoter and an unlabelled 3′ reverse
primer located just downstream of the SV40 promoter in the TOPO vector (Figure
6.1). The PCR product was separated through an agarose gel by electrophoresis
(section 2.8). It is important that no DNA detection dye e.g. ethidium bromide or Sybr
green be included in the gel. The gel was viewed with a fluorescent imager at the
wavelength of FAM excitation and a single band representing the labelled promoter
was visible (Figure 6.1). The DNA ladder was visualised by mixing with Sybr green
prior to electrophoresis. The DNA was purified as described in section 2.9.1.

232
Figure 6.1 Annotation of the SV40 promoter sequence and PCR FAM labelling of the sequence (A) SV40 positive control DNA sequence. The primers used to amplify and label the SV40 promoter sequence are indicated in red. The 5′ primer is FAM labelled and the 3′ primer is unlabelled. The blue and yellow regions highlight the AP1 and SP1 transcription factor binding consensus sites respectively. (B) The image of the labelled PCR product in lane 2, using an excitation filter for reading FAM, is shown. Lane 1 contains the BioLine hyperladder marker 4.
233
6.2.1 Optimisation of the SV40 promoter nuclear protein binding reaction The labelled DNA is incubated with a nuclear protein extract to allow the proteins to
bind to the DNA. COS-7 (a cell line derived from African green monkey kidney
fibroblasts) nuclear extract was used as this has been shown to have endogenous
levels of the SP1 protein. The SV40 promoter contains several SP1 consensus
binding sites for (Figure 6.1). For the binding reaction conditions see method 2.30.2
The COS-7 nuclear protein was analysed by SDS-PAGE to check protein integrity.
This showed that the extracted proteins are intact and suitable for use in the
footprinting experiments.
6.2.2 DNase I digestion The DNA is digested using DNase I (Section 2.30.3 for method). The concentration
of the enzyme needs to be optimised so that each phosphodiester bond along the
length of the fragment is cleaved. However, the conditions should be such that each
fragment in the population of DNAs is ideally cleaved just once. As these cleavages
occur randomly, the population of DNA strands produced by enzymatic digestion
should represent all possible DNA lengths. If too much enzyme is used then a higher
percentage of DNA fragments will be shorter, likewise if too little enzyme is used a
higher percentage of fragments will be too long. To be able to analyse the whole
promoter sequence the enzyme needs to digest randomly and evenly along the
length of the fragment. Therefore a number of enzyme concentrations need to be
tested. The optimal range of DNase I concentration was shown to be large (Figure
6.2). 0.05U (A) and 0.005U (B) both give an acceptable size range of DNA
fragments. Footprints could be observed throughout the 350bp sequence. The
higher DNase I concentration (A) does show a slight skew towards smaller DNA

234
fragments. I therefore chose to use 0.005U for my subsequent experiments. The
result of this optimisation shows that the DNase I capillary technique could be
flexible in the amount of DNase I enzyme used and would not, in most
circumstances, require optimisation. This would make the technique more conducive
to screening a number of different promoters. This makes the technique more
applicable for high-throughput screening as a wider enzyme concentration range will
make it easier to analyse a number of different promoter fragments of different length
at the same time.
It was observed initially that when different nuclear protein concentrations were used
that DNase I digestion would happen at different efficiencies. It was concluded that
the reason for this was that as more nuclear protein was added the buffer conditions
were changing and that this affected the efficiency of the DNase I enzyme. This
problem was partially overcome by adding BSA to equalise the total protein content
in each reaction and increasing the volume of the digestion reaction (from 20 µL to
100 µL). The increase in volume would help to dilute any differences in buffer
conditions between samples. The DNA digestion reaction was terminated using 0.5
M EDTA which inhibits the enzyme reaction and heating to 75oC for 10 min to
denature the enzyme.
Before analysing the digested DNA, it is necessary to remove the bound protein.
Different methods were tested to extract the DNA from the protein. Initially the
method of phenol/chloroform extraction was used. When using columns which
contain a gel separating the phenol organic phase and the aqueous phase
containing the DNA, the DNA extraction was shown to be much more efficient. This

235
was subsequently compared to the use of ion-exchange columns. Both methods
were shown to work equally well, however more DNA was recovered using ion-
exchange columns (see method 2.9).

236
Figure 6.2 0.005U of DNase I is optimal to produce an evenly size-distributed set of DNA fragments The chromatic traces of the SV40 promoter above show the effect of different DNase I concentrations. The chromatograms show the DNase I digested fragments from the 5′ FAM labelled SV40 promoter after incubation with COS-7 nuclear protein extract. The fragments were separated through capillaries and each peak on the chromatogram represents cleavage at a phosphodiester bond by DNase 1. The x-axis represents the number of base pairs from the 5′ label and the y-axis is the intensity of the peak.

237
6.2.3 Increasing the binding competitor does not affect the DNA-protein binding profile of the promoter
The binding reaction was optimised by varying the components of the reaction. The
incubation buffer used had previously been optimised within the lab for use as a
general buffer which promotes binding of a high percentage of proteins to DNA (Dell
et al,. 1998). This buffer was also used in gel shift assays and binding was shown to
be efficient (see chapter 4.19).
The amount of non-specific nucleic acid competitor was also optimised. The non-
specific competitor used was Poly (deoxyinosinic-deoxycytidylic) acid sodium salt.
This is a double-stranded alternating copolymer consisting of a chain of
deoxyinosinic acid bound to a chain of deoxycytidylic acid. The competitor functions
by mopping up nuclear protein that binds non-specifically to DNA and thus removing
proteins that could interfere with proteins that bind specifically to the promoter region
being analysed. By increasing the competititor concentration we can identify if
proteins are binding non-specifically to the DNA being analysed. When the amount
of poly (dI-dC) was increased from 4 µg to 10 µg there was no difference in the
footprinting profile of the SV40 promoter when different amounts of COS-7 protein
were used (Figure 6.3). We therefore decided that 4µg of competitor was sufficient to
remove non-specific DNA-protein binding.
6.2.4 Increasing DNA amount increases the FAM signal and DNA-Protein binding is less specific
The total amount of DNA is varied to observe how much DNA is required to visualise
the labelled DNA and to test for a saturation effect which could occur if too much

238
DNA was added. Too much DNA may result in protein binding being undetected due
to too much unbound DNA being present. Increasing the DNA template
concentration from 50 ng to 200 ng resulted in the loss of DNA-protein binding
specificity. The SV40 binding region is footprinted using 50 ng of template. When
200ng DNA template is used the signal is reduced non-specifically along the whole
trace (Figure 6.4). A template concentration of 50ng was therefore chosen for future
experiments.
6.2.5 Confirmation of DNA-protein binding events
To further determine if the DNA-protein binding is specific, proteinase K was added
to the incubation samples after DNA-protein binding had been allowed to proceed to
completion. Proteinase K is a protease and thus digests proteins. The presence of
this enzyme eliminated DNA-protein binding (Figure 6.5). This shows that the DNA-
protein interactions observed are specific.

239
Figure 6.3 Increasing the amount of competitor DNA does not affect the DNase I footprinting trace of the SV40 promoter The chromatograms above show the DNase I digested fragments from the 5′FAM labelled SV40 promoter. The fragments are separated through capillaries and each peak represents a phosphodiester bond cleavage. The x-axis represents the number of base pairs from the 5′ FAM label and the y-axis represents the intensity of the peak. A to C binding reactions contained 10 µg of competitor DNA. D to F contained 4µg of competitor DNA. The total COS-7 nuclear protein is (A) 0 µg (B) 20 µg (C) 40 µg and (D) 0 µg (E) 20 µg (F) 40 µg. The traces shown adjacent to each other contain the same amount of nuclear protein.

240
Figure 6.4 Capillary DNase I footprinting of the SV40 promoter with increased amounts of SV40 DNA template The chromatograms above show the DNase I digested fragments from the 5′FAM labelled SV40 promoter after incubation with COS-7 nuclear protein extract. The fragments have been separated through capillaries and each peak represents a phosphodiester cleavage event. The x-axis represents the number of base pairs from the 5′ label and the y-axis is the intensity of the peak. A to C binding reactions contained 200ng of template DNA. D to F contained 50ng of template DNA. The total COS-7 nuclear protein is (A) 0 µg (B) 20 µg (C) 40 µg and (D) 0 µg (E) 20 µg (F) 40 µg. The traces shown adjacent to each other contain the same amount of nuclear protein.

241
Figure 6.5 Treatment of DNA-protein binding reaction with proteinase K removes DNase I footprints within the SV40 promoter
The chromatograms above show the DNase I digested fragments from the 5′FAM labelled SV40 promoter. The fragments are separated through capillaries and each peak represents a phosphodiester bond cleavage. The x-axis represents the number of base pairs from the 5′ FAM label and the y-axis represents the intensity of the peak. Proteinase K was added to A to C. D to F contained no Proteinase K. The total COS-7 nuclear protein is (A) 0 µg (B) 20 µg (C) 40 µg and (D) 0 µg (E) 20 µg (F) 40 µg. The traces shown adjacent to each other contain the same amount of nuclear protein.

242
6.2.6 The optimised conditions for capillary DNase I footprinting It was observed that the optimal DNA template concentration, competitor DNA
concentration, and DNase I concentration was 50 ng, 4 µg, and 0.0005 U
respectively. DNase I capillary footprinting using these conditions was carried out for
the complete SV40 promoter. The results are shown in figure 6.6. The first 1-200 bp
show significant loss of signal as more protein is added. The remaining sequence
shows minimal reduction in signal. The area with reduced signal corresponds to the
SV40 promoter where SP1, AP1 and AP2 transcription factors bind. The sequence
further downstream shows minimal signal reduction. The technique with these
optimised conditions therefore detects true DNA-protein binding events.
6.2.6 Analysis of digested DNA fragments
DNase I digested DNA was eluted was recovered in a total volume of 50 µL. From
this, 5µl was taken and loaded into a well of a 96-well plate. In addition samples
were also diluted ten-fold and placed on the same plate. This was to ensure that any
differences in protein concentration or buffer conditions would be minimal and so that
signal intensities would not be affected.
Subsequently 4.9 µL of HiDi Formamide (ABI Applied Biosystems) and 0.1 µL of LIZ
standard (ABI applied biosystems) were added to each sample. The LIZ standard
contains DNAs of known size and is used to align the sequence traces at the end of
the DNA separation. The standard contains a LIZ dye which can be detected using
the G5 dye set. The samples were separated using the G5 dye set genotyping
module and a voltage of 10kv using an Applied Biosystems genetic analyzer 3730.

243
Figure 6.6 The chromatograms above show the DNase I digested fragments from the 5′FAM labelled SV40 promoter after incubation with COS-7 nuclear protein extract The fragments have been separated through capillaries and each peak represents a phosphodiester bond cleavage. The x-axis gives the number of base pairs from the 5′ label and the y-axis is the intensity of the peak. From A to D the total COS-7 nuclear protein is increased: (A) 0 µg (B) 10 µg (C) 20 µg and (D) 40 µg. The traces were obtained using optimised conditions which were used for subsequent experiments.

244
6.3 Dye terminator sequencing reactions to determine location of DNA-protein binding
To identify the positioning of DNA-Protein interactions along the DNA fragment
analysed it is necessary to also sequence the DNA fragment. Therefore dye-
terminator sequencing reactions were carried out using a 5′ FAM labelled primer
(see section 2.30.1 for method). The dye-terminators are not labelled and therefore
the dye signal will come from the 5′ FAM label. The sequencing reactions were
carried out with the same 5′ FAM primer used to amplify the DNA sequence to be
footprinted. This is essential because this allows the sequence fragment traces to be
aligned (based on size) correctly with the DNase I footprint traces. The inclusion of
the LIZ standard ensures that the sequence and footprinting reactions can be
aligned. The software Genemapper was used to align the individual dye-terminator
sequencing reactions. A different colour was applied for each dye-terminator reaction
for ease of comparison (Figure 6.7B). The dye terminator sequence alignment was
subsequently aligned with the DNase I footprinting traces to identify the sequence
location of the DNase I footprints (Figure 6.7). This resulted in the identification of the
base pairs to which protein was bound.
6.4 Description of the SV40 DNA-protein binding profile As shown in Fig.6.6 clear footprints are detected in the SV40 promoter analysed by
the high throughput methodology. As a nuclear extract is used a large number of
footprints are visible in the SV40 promoter DNA. The promoter region (1-200bp) is
known to contain AP1, AP2 and SP1 binding consensus sites (Fig.6.1). This region
of the promoter shows intense DNase I hypersensitive regions either side of the

245
AP1, AP2 and SP1 consensus sites. Further downstream the trace shows no
footprinted regions. This area of sequence is known to contain no protein binding
sites. Therefore the results of the high throughput method confirm the DNA-protein
binding sites detected within the SV40 promoter by the traditional DNase I
footprinting method.

246
A SV40 FOOTPRINTED REGION B ALIGNED SEQUENCE REACTIONS
Figure 6.7 Illustration of a section of the SV40 footprinted promoter aligned with dye-terminated sequencing reactions (A) A section of the footprinted SV40 promoter. (B) Dye-terminator sequencing reactions. The two chromatic traces were aligned
using Genemapper software.

247
6.5 Normalisation of signal intensity to the LIZ marker Due to the differences in the signal intensity between samples when analyzed in the
genetic analyzer 3730, the samples were normalised to the LIZ standard intensity. In
a traditional footprint experiment using radioactivity and gel electrophoresis, the
problem with different signal intensities between samples is solved by normalising to
a region of the DNA which is predicted not to be footprinted. Using the capillary
method allows us to improve the normalisation method. This is because markers
which are independent of the FAM labelled DNA fragments are run within the same
sample.
To normalise the FAM signal between samples 5 LIZ marker signal values are taken
for all traces. For each trace an average is calculated of the 5 LIZ marker values.
The trace with the smallest LIZ marker average value is divided into each trace. The
value obtained is used to alter the intensity of each trace (FAM signal). The traces
improved greatly in their comparable intensities between different protein
concentrations.

248
6.6 Footprinting analysis of the novel FMO1 P1 and P2 promoters
The DNase I footprinting technique optimised using the SV40 promoter was next
transferred to analyse the FMO1 P1 and P2 promoters. The areas footprinted are the
P1 positive promoter region, and the P2 positive promoter region (see chapter 4 for
details). Both strands of the DNA were footprinted. One strand was labelled using
the 5′ FAM labelled primer as the forward primer in the PCR reaction. To footprint the
other strand a 3′ HEX labelled reverse primer was used with an unlabelled 5′ primer
to amplify the DNA. The use of this primer pair allows us to visualise footprints on
both DNA strands. The HEX and FAM dyes can each be read using the G5 dye set
reading on the Applied Biosystems genetic analyzer 3730.
6.6.1 P1 Promoter (Figure 6.8)
A large footprinted area between -858 and -758 was detected in the P1 promoter.
After alignment of the footprinting and sequencing termination reaction traces the
footprinted areas were examined. The footprinted sequence motifs were compared
to previous bioinformatic analysis used to predict the identity of transcription factors
(see chapter 4). The P1 footprinted region is within sequence that is predicted to
bind the CCAAT binding proteins. Having identified a footprinted region it is possible
then to analyse SNPs that might change DNA-protein binding.
In addition to analysing the regions to which proteins bind that might regulate FMO1;
the capillary footprinting method allows a high-throughput method for analysing the
consequences of a genetic polymorphism.

249
Figure 6.8 DNase I footprinting of the human FMO1 P1 promoter using COS-7 nuclear extract The chromatograms above show the DNase I digested fragments from the 5′ FAM labelled FMO1 P1 promoter. The fragments have been separated through capillaries and each peak represents a phosphodiester bond cleavage. The x-axis shows the number of base pairs from the 5′ label and the y-axis is the intensity of the peak. From A to D the total COS-7 nuclear protein is increased as shown. The chromatogram shows the 5′ region of the promoter contains „footprints‟ as shown in the boxed region of the figure. There are also a number of smaller footprints further downstream.

250
6.6.2 The FMO1 P2 promoter footprint analysis (Figure 6.9)
The P2 promoter shows two predominant foot-printed regions (Figure 6.9). One
footprint is within a GC box where the transcription factor SP1 is predicted to bind.
The first region of DNA-protein binding overlaps with the region predicted to bind a
hormone receptor between 65-100bp (see chapter 4). The second footprint is within
the GC box binding site between 45-65bp.
The GC box motif was subsequently mutated to disrupt the binding of a transcription
factor. This mutation was designed based on the consensus sequence for SP1
binding give sequence (Santa Cruz biotechnology manual). This mutation was
analysed for its effect on function in chapter 4.

251
Figure 6.9 DNase I footprinting of the human FMO1 P2 promoter using COS-7 nuclear extract The chromatograms above show the DNase I digested fragments from the 5′ FAM labelled FMO1 P1 promoter. The fragments have been separated through capillaries and each peak represents a phosphodiester bond cleavage. The x-axis shows the number of base pairs from the 5′ label and the y-axis is the intensity of the peak. From A to D the total COS-7 nuclear protein is increased as shown. The chromatogram shows the 5′ region of the promoter contains footprints.

252
6.7 Loss of protein binding at the P2 promoter was visualised by DNase I capillary footprinting and therefore validates this technique for screening regulatory polymorphism via this method
The wild type (-255_-128) and mutant (-255_-128)*sequences of the FMO1 P2
promoter were FAM labelled by PCR. These probes were then used in the DNase I
capillary footprinting method using the conditions optimised previously. Protein
concentrations used were 0 µg, 30 µg, and 60 µg. The chromatogram traces were
aligned using Genemapper software. The termination sequencing reactions for the
P2 promoter were carried out for each of the four DNA nucleotides. Each termination
reaction sequencing trace was aligned and the base pair co-ordinates were noted.
The co-ordinates for the FMO1 sequences were then located within the footprinted
regions of the wild-type and mutant P2 promoter sequences.
A footprint is present in the wild-type promoter and becomes more prominent as
increasing amounts of COS-7 nuclear protein are added to the binding reaction. In
contrast, the mutated form of the promoter shows no footprint and no loss of signal
when increasing amounts of COS-7 nuclear extract is added (figure 6.7). Therefore
the technique is able to identify polymorphism/ mutation that inhibit protein binding to
DNA.

253
Figure 6.10 Detection of the loss of DNA-protein binding within the FMO1 P2 promoter The chromatograms above show the DNase I digested fragments of the wild type (-255_-128) and mutant (-255_-128)* 5′ FAM labelled FMO1 P2 promoter. The fragments have been separated through capillaries and each peak represents a single base pair. The x-axis shows the number of base pairs from the 5′ label and the y-axis is the intensity of the peak. The amount of protein added to each reaction is given adjacent to the trace. The black box highlights the region that shows loss of protein binding in the mutant sequence.

254
Discussion
Identifying DNA regulatory regions and analysing the effects of genetic
variation within these regions is currently limited. Current molecular
techniques only allow us to „easily‟ identify DNA regulatory regions that are
proximal to the start of transcription. It is much harder to locate upstream and
downstream regulatory regions that act further away from the promoter. Some
DNA sequences have been shown to act tens of thousands of base pairs
upstream and downstream of the promoter.
The techniques currently applied to identify regulatory regions include reporter
gene assays to measure the DNA‟s ability to drive expression, as used
throughout my project. Other techniques such as the electrophoretic mobility
shift assay examine the binding of proteins to DNA and DNase I footprinting
assays localise the region of DNA-protein binding and, if used in conjunction
with DNA sequencing, identify the base sequence with which the protein
interacts. Genetic variations can then be introduced into DNA sequences and
the variants tested for their effect on gene expression or protein binding. The
main caveat of these techniques is that they cannot easily be used to screen
large regions of DNA.
The modification of the DNase I footprint method from polyacrylamide gels to
capillary footprinting, I believe, allows the production of a technique which can
be used to screen large regions of DNA. The novel application of this
technique that I have shown is to screen for variations which influence DNA-
protein binding. I now envisage the potential of this method to footprint tens

255
of thousands of base pairs upstream and downstream of a gene. Genetic
variation within the regions that influence protein binding could then be
analysed for their effects. Genetic variations which show a change in DNA-
protein binding could then be validated by use of a reporter assay. Therefore
the advantage of this approach is that important regulatory regions of DNA will
be much more easily discovered.
The technique has a few caveats. The technique is being carried out in vitro
and therefore the DNA-protein interactions observed may not be observed
those observed in vivo. In addition, protein binding might change in different
tissues or under different physiological conditions. The capillary footprint can
however be carried out in a high-throughput way making it possible to
examine DNA binding with different tissue tissues extracts and extracts
isolated under different physiological conditions. This would not be possible
using the traditional footprinting technique because of the labour-intensive
nature of this method and the limited sample numbers that can easily be
analysed.
The second caveat is that when amplifying from genomic DNA an individual
will need to be homozygote for a genetic variant. If the individual is
heterozygote the footprint signal will not be as strong and may be
undetectable. However as discussed later, with the increased number of
individuals now having their DNA sequenced it is likely that homozygotes will
be available for most SNPs. For drug prediction results (efficacy or adversity)

256
then common genetic variations within a population group have greater
predictive value for a health service.
The high-throughput technique will have greater application as the number of
genetic variations discovered within the human genome increases. The 1000
genome project, where 1000 individuals from around the globe will be
sequenced, will undoubtedly produce many new novel genetic variants. As
these individuals genotypes are identified individuals can be chosen which are
homozygous for an allele that one wishes to test. This would then remove the
need for the researcher to sequence the gene as I have done within this
project. Regions of DNA where SNPs occur can be selected and a minimal
number of individuals used to test these SNPs for DNA-protein binding.
The technique also has the potential to be further developed for an in vivo
system. The Hapmap consortium has produced cell-lines from individuals of
known genotype. This therefore allows for the possibility of in vivo DNase I
footprinting. By using a chemical reagent to digest the DNA and isolating the
DNA fragments, footprinting profiles could be determined for different
genotypes within in vivo conditions. This approach however is limited to the
cellular environment and expression profile of the cell lines.
Second-generation sequencing is currently a relatively new technology. I
envisage the combination of this sequencing technology with a Protein-DNA
binding assay in the same context as described here. This would then allow

257
whole genomes to be analysed for DNA-protein binding. Combining this with a
genome wide chromatin analysis would allow regulatory SNPs to be identified
which would be predicted to have a significant functional consequence on the
transcription of DNA.

258
Chapter 7
General discussion

259
Chapter 7: General Discussion
The aim of this thesis was to identify and give context to regulatory SNPs
within the FMO1 gene. This work was considered important due to the large
variation in expression seen between individuals in FMO1 expression.
Regulatory SNPs which account for the large inter-individual variation could
then be used in improving drug dosage for those drugs known to be
metabolized by FMO1.
Identification of regulatory SNPs, as described in chapter 1, requires a variety
of methods. The context with which the SNP influences gene expression
needs to be accounted for much more than for a coding polymorphism. This is
due to the plasticity of gene regulation. Genes are regulated in a tissue-, cell-,
and environmentally specific manner. Therefore in order to gauge the true
influence of a regulatory polymorphism these different contexts need to be
examined. To identify the nature and influence of regulatory polymorphism
researchers use a wide variety of techniques to show the influence of
regulatory polymorphism. The range of techniques used were discussed in
chapter 1.
Identification of regulatory polymorphism and its context is more difficult within
genes that are regulated in a complex manner. FMO1 is an example of a
gene regulated in a complex manner. It has multiple tissue-specific promoters
for transcription of the gene. It is therefore crucial, it is understood which
transcripts are produced in which tissues, in order to examine regulatory
polymorphism in the correct context. We therefore decided that usage of the

260
three FMO1 promoters, P0, P1 and P2 should be examined within a number
of different tissues (chapter 3). These tissues were liver, kidney, white and
brown fat, brain, muscle and lung. This would allow us to study regulatory
polymorphism within the correct context. It was decided a large number of
extra-hepatic tissues should be included due to the identification of an
endogenous role for FMO1 in energy homeostasis. The white and brown fat,
muscle and brain had not previously been quantified for FMO1 expression.
The endogenous role for FMO1 also influenced us to examine the regulation
of FMO1 during the differentiation of fat (chapter 3).
It was discovered in mice that FMO1 was expressed highly in white and
brown fat, comparable to levels in the kidney. The P1 transcript was much
higher in most of the extra-hepatic tissues than the other two promoters
outlining the importance of the P1 transcript. Examining the expression of the
FMO1 transcripts during differentiation we observed the upregulation of the
P1 and P2 transcripts during 3T3-L1 differentiation into adipocytes. This
observation allows the 3T3-L1 adipocyte model to further understand the
regulation of FMO1 within fat and further understand the endogenous role of
the enzyme.
Prior to this study, promoter regions had not been defined for the P1 and P2
transcripts. Promoters were defined in the context of different cell types to
account for the tissue-specificity of the promoters seen previously and during
this study (chapter 4). These promoter regions in addition to the previously
defined P0 promoter would therefore be candidate regions for regulatory

261
polymorphism. The chromatin state of the DNA was examined and the region
defining the P1 and P2 promoter region were shown to be an open
conformational state (chapter 4). Further upstream of the defined positive
regions, a negative region was defined using reporter gene assays. This
region was shown to be in a closed conformational state. It is therefore likely
this region does not factor in the regulation of FMO1.
Once defined, sequences within these regions were examined for
transcription factor binding. This was done by using a bioinformatics approach
coupled with publicly available genome-wide gene regulation analysis data
(chapter 4). This analysis showed that Chip-seq experiments undertaken
within HepG2 cells showed the binding of C/EBP-β and the insulating factor
lin1. The binding is predicted to occur within the defined positive promoter
region of P1. The transcription factor C/EBP-β upregulates genes during 3T3-
L1 differentiation. This factor could therefore be responsible for the
upregulation of FMO1 during 3T3-L1 differentiation.
Following the defining of the P1 and P2 promoters the regions were
sequenced within different populations (chapter 5). This revealed two novel
SNPs. The first within the start of exon 1 which was a CT deletion, and the
second downstream within the P1 promoter region. The frequency of the CT
deletion was only present within the CEU (European) population. The allele
frequency was 5%. This is frequent enough to be defined as a common
polymorphism. Due to its location this SNP may influence the binding of RNA
polymerase II. Further experiments using EMSA would confirm the changes in

262
DNA-protein binding within this region. Reporter gene assays would confirm
its effect on transcription.
The CT deletion as well as the polymorphism further upstream of the P1
promoter were introduced and attempts were made to test their effect on
reporter gene activity. The P1 promoter region reporter gene activity, when
examined for comparison for mutants, showed a severely decreased activity.
The reporter gene construct which contained the P1 and P2 promoter regions
was also severely reduced. We deduced that as two constructs containing the
same sequence had been severely down-regulated that something was now
causing the repression of the reporter gene.
Bioinformatic analysis predicts the binding of heat shock factor within this
region which may be affecting the reporter gene activity. The heat shock
factor is also predicted to bind with the insulating factor Lin1 shown by Chip-
seq to bind within the promoter region. Attempts were made to change the
conditions of the cell culture to allow for the activity of the heat shock factor.
Incubator and media conditions were varied and tested but the reporter gene
activity did not increase. Therefore mutant activities could not be reliably
examined due to the lack of a comparison.
During the defining of the FMO1 promoters, and subsequent sequencing of
these regions, a method was developed to allow the testing of regulatory
polymorphism on DNA-protein binding events within regulatory sequences. As
discussed in chapter 1, genome-wide methods are now common in analysing

263
regulatory regions. DNase I-seq can be used to a resolution that allows the
sequences of DNA-protein binding to be defined. These techniques allow
examination of gene regulatory sequences but do not allow regulatory SNPs
to be examined for their effect. This is due to the expense of examining a
large number of individuals for genome wide DNA-protein binding profiles.
Therefore the researcher relies on reporter gene assays and EMSAs to
examine the effect of regulatory polymorphism. These techniques can be
used in different contexts and are very useful at testing the effects of
regulatory SNPs. However, if the researcher wishes to test a large number of
regulatory polymorphism, for example, multiple SNPs within multiple
promoters, or multiple genes, then these techniques can be laborious.
Advances in EMSA technology, used within this thesis, allows Infra-red dyes
to be used for labelling increase ease of analysis, however gel technology is
still relied upon. It was therefore observed that a technique would be desirable
that could deal with the ever-growing information on regulatory regions at a
relatively lower cost. The technique proposed, and optimised within this
thesis, was developed to address this problem.
DNase I capillary footprinting has been shown to detect the presence of DNA-
protein-binding events when using purified protein and DNA labelled from a
vector. This thesis describes the development of DNase I capillary footprinting
with the use of whole nuclear protein extracts. This technique was further
developed to show differences in DNA-protein binding could be detected
using the method. A mutation created within the P2 promoter was shown
within this thesis to reduce reporter gene activity and remove DNA-protein

264
complexes. This mutation was tested within the newly optimised technique
and was able to detect the loss of protein binding within this region. The
technique functions with the use of capillaries and therefore can be high-
throughput. The technique is therefore validated and provides a technique for
the researcher that can screen regulatory polymorphism for a large number of
regulatory regions.
This technique was transferred to analyse two FMO1 P1 natural
polymorphisms. These polymorphisms were shown not to influence DNA-
protein binding. Further experiments would determine the influence of natural
variation within the P0, P1 and P2 promoters. Ideally these SNPs can be
verified within the reporter gene assay.
During the course of this thesis a SNP was observed, -11C>T that could
create a second upstream ATG translation initiation codon for those
individuals that have the T allele. SNPs have been shown for other genes to
influence translational efficiency by the introduction of a second ATG. The
translational efficiency of the two alleles were tested using reporter gene
assays. The FMO1 P2 leader sequence, containing either the T or C allele
was cloned upstream of the pSP-luc vector. Cloning was undertaken to
replace the ATG of the luciferase reporter gene with the FMO1 downstream
ATG. RNA was made from this vector in-vitro and transfected into COS-7
cells. The T allele was shown to produce more reporter gene protein than the
C allele. This suggests that those individuals that have the T allele produce
more FMO1 protein than individuals with the C allele. This SNP would be a

265
good candidate for association studies with patients with adverse drug
reactions for drugs metabolized by FMO1. It could also be used in association
studies with ALS patients or diseases resembling phenotypes observed within
the FMO1 knock-out mice.
In summary, this thesis has further increased our understanding of how the
FMO1 P0, P1 and P2 transcripts are used within mice and during 3T3-L1
differentiation. This has given context to polymorphisms found within
regulatory sequences for the P1 and P2 promoter. Novel promoter sequences
have been defined and characterised using different cell lines and regulatory
data. These regions have been sequenced and novel SNPs identified. A novel
approach and high-throughput method has been developed during this thesis
and is able to screen for regulatory polymorphism in regulatory regions by
detecting differences in DNA-protein binding. This approach was used to
examine two FMO1 promoter polymorphisms but no differences were
visualised. A regulatory SNP found -11C>T upstream of the known ATG
translation initiation codon has been shown to effect translation efficiency and
is a good candidate for future association studies.

266
References

267
(2003). The International HapMap Project. Nature 426, 789-796. Ae, K., Kobayashi, N., Sakuma, R., Ogata, T., Kuroda, H., Kawaguchi, N.,
Shinomiya, K., and Kitamura, Y. (2002). Chromatin remodeling factor encoded by ini1 induces G1 arrest and apoptosis in ini1-deficient cells. Oncogene 21, 3112-3120.
Afshar-Kharghan, V., Li, C.Q., Khoshnevis-Asl, M., and Lopez, J.A. (1999). Kozak sequence polymorphism of the glycoprotein (GP) Ibalpha gene is a major determinant of the plasma membrane levels of the platelet GP Ib-IX-V complex. Blood 94, 186-191.
Aklillu, E., Carrillo, J.A., Makonnen, E., Hellman, K., Pitarque, M., Bertilsson, L., and Ingelman-Sundberg, M. (2003). Genetic polymorphism of CYP1A2 in Ethiopians affecting induction and expression: characterization of novel haplotypes with single-nucleotide polymorphisms in intron 1. Mol Pharmacol 64, 659-669.
Akpinar, P., Kuwajima, S., Krutzfeldt, J., and Stoffel, M. (2005). Tmem27: a cleaved and shed plasma membrane protein that stimulates pancreatic beta cell proliferation. Cell Metab 2, 385-397.
Allorge, D., Chevalier, D., Lo-Guidice, J.M., Cauffiez, C., Suard, F., Baumann, P., Eap, C.B., and Broly, F. (2003). Identification of a novel splice-site mutation in the CYP1A2 gene. Br J Clin Pharmacol 56, 341-344.
Arai, H., Miyamoto, K., Taketani, Y., Yamamoto, H., Iemori, Y., Morita, K., Tonai, T., Nishisho, T., Mori, S., and Takeda, E. (1997). A vitamin D receptor gene polymorphism in the translation initiation codon: effect on protein activity and relation to bone mineral density in Japanese women. J Bone Miner Res 12, 915-921.
Attar, M., Dong, D., Ling, K.H., and Tang-Liu, D.D. (2003). Cytochrome P450 2C8 and flavin-containing monooxygenases are involved in the metabolism of tazarotenic acid in humans. Drug Metab Dispos 31, 476-481.
Baek, D., Davis, C., Ewing, B., Gordon, D., and Green, P. (2007). Characterization and predictive discovery of evolutionarily conserved mammalian alternative promoters. Genome Res 17, 145-155.
Battle, M.A., Konopka, G., Parviz, F., Gaggl, A.L., Yang, C., Sladek, F.M., and Duncan, S.A. (2006). Hepatocyte nuclear factor 4alpha orchestrates expression of cell adhesion proteins during the epithelial transformation of the developing liver. Proc Natl Acad Sci U S A 103, 8419-8424.
Beaty, N.B., and Ballou, D.P. (1980). Transient kinetic study of liver microsomal FAD-containing monooxygenase. J Biol Chem 255, 3817-3819.
Beaty, N.B., and Ballou, D.P. (1981). The oxidative half-reaction of liver microsomal FAD-containing monooxygenase. J Biol Chem 256, 4619-4625.
Bernlohr, D.A., Bolanowski, M.A., Kelly, T.J., Jr., and Lane, M.D. (1985). Evidence for an increase in transcription of specific mRNAs during differentiation of 3T3-L1 preadipocytes. J Biol Chem 260, 5563-5567.
Birney, E., Stamatoyannopoulos, J.A., Dutta, A., Guigo, R., Gingeras, T.R., Margulies, E.H., Weng, Z., Snyder, M., Dermitzakis, E.T., Thurman, R.E., et al. (2007). Identification and analysis of functional elements in 1% of the human genome by the ENCODE pilot project. Nature 447, 799-816.
Blake, B.L., Rose, R.L., Mailman, R.B., Levi, P.E., and Hodgson, E. (1995). Metabolism of thioridazine by microsomal monooxygenases: relative roles of P450 and flavin-containing monooxygenase. Xenobiotica 25, 377-393.

268
Cam, H., Griesmann, H., Beitzinger, M., Hofmann, L., Beinoraviciute-Kellner, R., Sauer, M., Huttinger-Kirchhof, N., Oswald, C., Friedl, P., Gattenlohner, S., et al. (2006). p53 family members in myogenic differentiation and rhabdomyosarcoma development. Cancer Cell 10, 281-293.
Cao, Y., Kumar, R.M., Penn, B.H., Berkes, C.A., Kooperberg, C., Boyer, L.A., Young, R.A., and Tapscott, S.J. (2006). Global and gene-specific analyses show distinct roles for Myod and Myog at a common set of promoters. EMBO J 25, 502-511.
Caramel, J., Medjkane, S., Quignon, F., and Delattre, O. (2008). The requirement for SNF5/INI1 in adipocyte differentiation highlights new features of malignant rhabdoid tumors. Oncogene 27, 2035-2044.
Carter, A.M., Sachchithananthan, M., Stasinopoulos, S., Maurer, F., and Medcalf, R.L. (2002). Prothrombin G20210A is a bifunctional gene polymorphism. Thromb Haemost 87, 846-853.
Cartharius, K., Frech, K., Grote, K., Klocke, B., Haltmeier, M., Klingenhoff, A., Frisch, M., Bayerlein, M., and Werner, T. (2005). MatInspector and beyond: promoter analysis based on transcription factor binding sites. Bioinformatics 21, 2933-2942.
Cashman, J.R. (2008). Role of flavin-containing monooxygenase in drug development. Expert Opin Drug Metab Toxicol 4, 1507-1521.
Cashman, J.R., Celestial, J.R., Leach, A., Newdoll, J., and Park, S.B. (1993). Tertiary amines related to brompheniramine: preferred conformations for N-oxygenation by the hog liver flavin-containing monooxygenase. Pharm Res 10, 1097-1105.
Cashman, J.R., Park, S.B., Berkman, C.E., and Cashman, L.E. (1995). Role of hepatic flavin-containing monooxygenase 3 in drug and chemical metabolism in adult humans. Chem Biol Interact 96, 33-46.
Cashman, J.R., Xiong, Y.N., Xu, L., and Janowsky, A. (1999). N-oxygenation of amphetamine and methamphetamine by the human flavin-containing monooxygenase (form 3): role in bioactivation and detoxication. J Pharmacol Exp Ther 288, 1251-1260.
Cashman, J.R., and Zhang, J. (2006). Human flavin-containing monooxygenases. Annu Rev Pharmacol Toxicol 46, 65-100.
Cashman, J.R., and Ziegler, D.M. (1986). Contribution of N-oxygenation to the metabolism of MPTP (1-methyl-4-phenyl-1,2,3,6-tetrahydropyridine) by various liver preparations. Mol Pharmacol 29, 163-167.
Cereda, C., Gabanti, E., Corato, M., de Silvestri, A., Alimonti, D., Cova, E., Malaspina, A., and Ceroni, M. (2006). Increased incidence of FMO1 gene single nucleotide polymorphisms in sporadic amyotrophic lateral sclerosis. Amyotroph Lateral Scler 7, 227-234.
Chen, I.H., Huber, M., Guan, T., Bubeck, A., and Gerace, L. (2006). Nuclear envelope transmembrane proteins (NETs) that are up-regulated during myogenesis. BMC Cell Biol 7, 38.
Cherrington, N.J., Cao, Y., Cherrington, J.W., Rose, R.L., and Hodgson, E. (1998a). Physiological factors affecting protein expression of flavin-containing monooxygenases 1, 3 and 5. Xenobiotica 28, 673-682.
Cherrington, N.J., Falls, J.G., Rose, R.L., Clements, K.M., Philpot, R.M., Levi, P.E., and Hodgson, E. (1998b). Molecular cloning, sequence, and expression of mouse flavin-containing monooxygenases 1 and 5 (FMO1 and FMO5). J Biochem Mol Toxicol 12, 205-212.

269
Cheung, K.J., Tzameli, I., Pissios, P., Rovira, I., Gavrilova, O., Ohtsubo, T., Chen, Z., Finkel, T., Flier, J.S., and Friedman, J.M. (2007). Xanthine oxidoreductase is a regulator of adipogenesis and PPARgamma activity. Cell Metab 5, 115-128.
Chiba, K., Horii, H., Kubota, E., Ishizaki, T., and Kato, Y. (1990). Effects of N-methylmercaptoimidazole on the disposition of MPTP and its metabolites in mice. Eur J Pharmacol 180, 59-67.
Chiba, K., Kubota, E., Miyakawa, T., Kato, Y., and Ishizaki, T. (1988). Characterization of hepatic microsomal metabolism as an in vivo detoxication pathway of 1-methyl-4-phenyl-1,2,3,6-tetrahydropyridine in mice. J Pharmacol Exp Ther 246, 1108-1115.
Chiu, K.C., Chuang, L.M., and Yoon, C. (2001). The vitamin D receptor polymorphism in the translation initiation codon is a risk factor for insulin resistance in glucose tolerant Caucasians. BMC Med Genet 2, 2.
Chung, W.G., Park, C.S., Roh, H.K., and Cha, Y.N. (1997). Induction of flavin-containing monooxygenase (FMO1) by a polycyclic aromatic hydrocarbon, 3-methylcholanthrene, in rat liver. Mol Cells 7, 738-741.
Chung, W.G., Park, C.S., Roh, H.K., Lee, W.K., and Cha, Y.N. (2000). Oxidation of ranitidine by isozymes of flavin-containing monooxygenase and cytochrome P450. Jpn J Pharmacol 84, 213-220.
Conne, B., Stutz, A., and Vassalli, J.D. (2000). The 3′ untranslated region of messenger RNA: A molecular 'hotspot' for pathology? Nat Med 6, 637-641.
Cooper, S.J., Trinklein, N.D., Anton, E.D., Nguyen, L., and Myers, R.M. (2006). Comprehensive analysis of transcriptional promoter structure and function in 1% of the human genome. Genome Res 16, 1-10.
Cornelius, P., MacDougald, O.A., and Lane, M.D. (1994). Regulation of adipocyte development. Annu Rev Nutr 14, 99-129.
Courtois, V., Chatelain, G., Han, Z.Y., Le Novere, N., Brun, G., and Lamonerie, T. (2003). New Otx2 mRNA isoforms expressed in the mouse brain. J Neurochem 84, 840-853.
Crunkhorn, S., Dearie, F., Mantzoros, C., Gami, H., da Silva, W.S., Espinoza, D., Faucette, R., Barry, K., Bianco, A.C., and Patti, M.E. (2007). Peroxisome proliferator activator receptor gamma coactivator-1 expression is reduced in obesity: potential pathogenic role of saturated fatty acids and p38 mitogen-activated protein kinase activation. J Biol Chem 282, 15439-15450.
Danielson, P.B. (2002). The cytochrome P450 superfamily: biochemistry, evolution and drug metabolism in humans. Curr Drug Metab 3, 561-597.
Davis, W., Jr., and Schultz, R.M. (2000). Developmental change in TATA-box utilization during preimplantation mouse development. Dev Biol 218, 275-283.
Devereux, T.R., Philpot, R.M., and Fouts, J.R. (1977). The effect of Hg2+ on rabbit hepatic and pulmonary solubilized, partially purified N,N-dimethylaniline N-oxidases. Chem Biol Interact 18, 277-287.
Di Padova, M., Caretti, G., Zhao, P., Hoffman, E.P., and Sartorelli, V. (2007). MyoD acetylation influences temporal patterns of skeletal muscle gene expression. J Biol Chem 282, 37650-37659.
Di Paola, R., Frittitta, L., Miscio, G., Bozzali, M., Baratta, R., Centra, M., Spampinato, D., Santagati, M.G., Ercolino, T., Cisternino, C., et al. (2002). A variation in 3′ UTR of hPTP1B increases specific gene expression and associates with insulin resistance. Am J Hum Genet 70, 806-812.
Dolphin, C., Shephard, E.A., Povey, S., Palmer, C.N., Ziegler, D.M., Ayesh, R., Smith, R.L., and Phillips, I.R. (1991). Cloning, primary sequence, and

270
chromosomal mapping of a human flavin-containing monooxygenase (FMO1). J Biol Chem 266, 12379-12385.
Dolphin, C.T., Beckett, D.J., Janmohamed, A., Cullingford, T.E., Smith, R.L., Shephard, E.A., and Phillips, I.R. (1998). The flavin-containing monooxygenase 2 gene (FMO2) of humans, but not of other primates, encodes a truncated, nonfunctional protein. J Biol Chem 273, 30599-30607.
Dolphin, C.T., Cullingford, T.E., Shephard, E.A., Smith, R.L., and Phillips, I.R. (1996). Differential developmental and tissue-specific regulation of expression of the genes encoding three members of the flavin-containing monooxygenase family of man, FMO1, FMO3 and FM04. Eur J Biochem 235, 683-689.
Dolphin, C.T., Shephard, E.A., Povey, S., Smith, R.L., and Phillips, I.R. (1992). Cloning, primary sequence and chromosomal localization of human FMO2, a new member of the flavin-containing mono-oxygenase family. Biochem J 287 ( Pt 1), 261-267.
Donoghue, N.A., Norris, D.B., and Trudgill, P.W. (1976). The purification and properties of cyclohexanone oxygenase from Nocardia globerula CL1 and Acinetobacter NCIB 9871. Eur J Biochem 63, 175-192.
Duan, Z.J., Fang, X., Rohde, A., Han, H., Stamatoyannopoulos, G., and Li, Q. (2002). Developmental specificity of recruitment of TBP to the TATA box of the human gamma-globin gene. Proc Natl Acad Sci U S A 99, 5509-5514.
Duescher, R.J., Lawton, M.P., Philpot, R.M., and Elfarra, A.A. (1994). Flavin-containing monooxygenase (FMO)-dependent metabolism of methionine and evidence for FMO3 being the major FMO involved in methionine sulfoxidation in rabbit liver and kidney microsomes. J Biol Chem 269, 17525-17530.
Duffel, M.W., Logan, D.J., and Ziegler, D.M. (1987). Cysteamine and cystamine. Methods Enzymol 143, 149-154.
Dynan, W.S., and Tjian, R. (1983). The promoter-specific transcription factor Sp1 binds to upstream sequences in the SV40 early promoter. Cell 35, 79-87.
Elfarra, A.A. (1995). Potential role of the flavin-containing monooxygenases in the metabolism of endogenous compounds. Chem Biol Interact 96, 47-55.
Ellard, S. (2000). Hepatocyte nuclear factor 1 alpha (HNF-1 alpha) mutations in maturity-onset diabetes of the young. Hum Mutat 16, 377-385.
Enattah, N.S., Sahi, T., Savilahti, E., Terwilliger, J.D., Peltonen, L., and Jarvela, I. (2002). Identification of a variant associated with adult-type hypolactasia. Nat Genet 30, 233-237.
Eswaramoorthy, S., Bonanno, J.B., Burley, S.K., and Swaminathan, S. (2006). Mechanism of action of a flavin-containing monooxygenase. Proc Natl Acad Sci U S A 103, 9832-9837.
Falls, J.G., Cherrington, N.J., Clements, K.M., Philpot, R.M., Levi, P.E., Rose, R.L., and Hodgson, E. (1997). Molecular cloning, sequencing, and expression in Escherichia coli of mouse flavin-containing monooxygenase 3 (FMO3): comparison with the human isoform. Arch Biochem Biophys 347, 9-18.
Fargetton, X., Galtier, P., and Delatour, P. (1986). Sulfoxidation of albendazole by a cytochrome P450-independent monooxygenase from rat liver microsomes. Vet Res Commun 10, 317-324.
Felgner, P.L., and Ringold, G.M. (1989). Cationic liposome-mediated transfection. Nature 337, 387-388.

271
Furnes, B., Feng, J., Sommer, S.S., and Schlenk, D. (2003). Identification of novel variants of the flavin-containing monooxygenase gene family in African Americans. Drug Metab Dispos 31, 187-193.
Furnes, B., and Schlenk, D. (2004). Evaluation of xenobiotic N- and S-oxidation by variant flavin-containing monooxygenase 1 (FMO1) enzymes. Toxicol Sci 78, 196-203.
Gaedigk, A., Ryder, D.L., Bradford, L.D., and Leeder, J.S. (2003). CYP2D6 poor metabolizer status can be ruled out by a single genotyping assay for the -1584G promoter polymorphism. Clin Chem 49, 1008-1011.
Gargiulo, G., Levy, S., Bucci, G., Romanenghi, M., Fornasari, L., Beeson, K.Y., Goldberg, S.M., Cesaroni, M., Ballarini, M., Santoro, F., et al. (2009). NA-Seq: a discovery tool for the analysis of chromatin structure and dynamics during differentiation. Dev Cell 16, 466-481.
Garrison, W.D., Battle, M.A., Yang, C., Kaestner, K.H., Sladek, F.M., and Duncan, S.A. (2006). Hepatocyte nuclear factor 4alpha is essential for embryonic development of the mouse colon. Gastroenterology 130, 1207-1220.
Gasser, R., Tynes, R.E., Lawton, M.P., Korsmeyer, K.K., Ziegler, D.M., and Philpot, R.M. (1990). The flavin-containing monooxygenase expressed in pig liver: primary sequence, distribution, and evidence for a single gene. Biochemistry 29, 119-124.
Gaulton, K.J., Nammo, T., Pasquali, L., Simon, J.M., Giresi, P.G., Fogarty, M.P., Panhuis, T.M., Mieczkowski, P., Secchi, A., Bosco, D., et al. (2010). A map of open chromatin in human pancreatic islets. Nat Genet 42, 255-259.
Gennari, L., Becherini, L., Mansani, R., Masi, L., Falchetti, A., Morelli, A., Colli, E., Gonnelli, S., Cepollaro, C., and Brandi, M.L. (1999). FokI polymorphism at translation initiation site of the vitamin D receptor gene predicts bone mineral density and vertebral fractures in postmenopausal Italian women. J Bone Miner Res 14, 1379-1386.
Giannoukakis, N., Deal, C., Paquette, J., Goodyer, C.G., and Polychronakos, C. (1993). Parental genomic imprinting of the human IGF2 gene. Nat Genet 4, 98-101.
Giresi, P.G., Kim, J., McDaniell, R.M., Iyer, V.R., and Lieb, J.D. (2007). FAIRE (Formaldehyde-Assisted Isolation of Regulatory Elements) isolates active regulatory elements from human chromatin. Genome Res 17, 877-885.
Gonzalez-Conejero, R., Corral, J., Roldan, V., Martinez, C., Marin, F., Rivera, J., Iniesta, J.A., Lozano, M.L., Marco, P., and Vicente, V. (2002). A common polymorphism in the annexin V Kozak sequence (-1C>T) increases translation efficiency and plasma levels of annexin V, and decreases the risk of myocardial infarction in young patients. Blood 100, 2081-2086.
Green, H., and Kehinde, O. (1979). Formation of normally differentiated subcutaneous fat pads by an established preadipose cell line. J Cell Physiol 101, 169-171.
Green, H., and Meuth, M. (1974). An established pre-adipose cell line and its differentiation in culture. Cell 3, 127-133.
Gregory, S.G., Schmidt, S., Seth, P., Oksenberg, J.R., Hart, J., Prokop, A., Caillier, S.J., Ban, M., Goris, A., Barcellos, L.F., et al. (2007). Interleukin 7 receptor alpha chain (IL7R) shows allelic and functional association with multiple sclerosis. Nat Genet 39, 1083-1091.
Hamman, M.A., Haehner-Daniels, B.D., Wrighton, S.A., Rettie, A.E., and Hall, S.D. (2000). Stereoselective sulfoxidation of sulindac sulfide by flavin-containing

272
monooxygenases. Comparison of human liver and kidney microsomes and mammalian enzymes. Biochem Pharmacol 60, 7-17.
Hecht, J., Seitz, V., Urban, M., Wagner, F., Robinson, P.N., Stiege, A., Dieterich, C., Kornak, U., Wilkening, U., Brieske, N., et al. (2007). Detection of novel skeletogenesis target genes by comprehensive analysis of a Runx2(-/-) mouse model. Gene Expr Patterns 7, 102-112.
Hernandez, D., Janmohamed, A., Chandan, P., Omar, B.A., Phillips, I.R., and Shephard, E.A. (2009). Deletion of the mouse Fmo1 gene results in enhanced pharmacological behavioural responses to imipramine. Pharmacogenet Genomics 19, 289-299.
Hernandez, D., Janmohamed, A., Chandan, P., Phillips, I.R., and Shephard, E.A. (2004). Organization and evolution of the flavin-containing monooxygenase genes of human and mouse: identification of novel gene and pseudogene clusters. Pharmacogenetics 14, 117-130.
Hesselberth, J.R., Chen, X., Zhang, Z., Sabo, P.J., Sandstrom, R., Reynolds, A.P., Thurman, R.E., Neph, S., Kuehn, M.S., Noble, W.S., et al. (2009). Global mapping of protein-DNA interactions in vivo by digital genomic footprinting. Nat Methods 6, 283-289.
Hines, R.N., Cashman, J.R., Philpot, R.M., Williams, D.E., and Ziegler, D.M. (1994). The mammalian flavin-containing monooxygenases: molecular characterization and regulation of expression. Toxicol Appl Pharmacol 125, 1-6.
Hines, R.N., Hopp, K.A., Franco, J., Saeian, K., and Begun, F.P. (2002). Alternative processing of the human FMO6 gene renders transcripts incapable of encoding a functional flavin-containing monooxygenase. Mol Pharmacol 62, 320-325.
Hines, R.N., Luo, Z., Hopp, K.A., Cabacungan, E.T., Koukouritaki, S.B., and McCarver, D.G. (2003). Genetic variability at the human FMO1 locus: significance of a basal promoter yin yang 1 element polymorphism (FMO1*6). J Pharmacol Exp Ther 306, 1210-1218.
Hodgson, E. (1999a). Induction and inhibition of pesticide-metabolizing enzymes: roles in synergism of pesticides and pesticide action. Toxicol Ind Health 15, 6-11.
Hodgson, E., N. J. Cherrington, R. M. Philpot and R. L. Rose (1999b). "Biochemical Aspects of Flavin-containing Monooxygenases (FMOs)". Molecular and applied aspects of oxidative drug metabolising enzymes, pp55-70 Ed., E. Arinc, J. B. Schenkman and E, Hodgson. Plenum publishers, New York.
Hodgson, E., Rose, R.L., Cao, Y., Dehal, S.S., and Kupfer, D. (2000). Flavin-containing monooxygenase isoform specificity for the N-oxidation of tamoxifen determined by product measurement and NADPH oxidation. J Biochem Mol Toxicol 14, 118-120.
Hoskins, J., Shenfield, G., Murray, M., and Gross, A. (2001). Characterization of moclobemide N-oxidation in human liver microsomes. Xenobiotica 31, 387-397.
Humbert, J.A., Hammond, K.B., and Hathaway, W.E. (1970). Trimethylaminuria: the fish-odour syndrome. Lancet 2, 770-771.
Inoue, E., Yamashita, A., Inoue, H., Sekiguchi, M., Shiratori, A., Yamamoto, Y., Tadokoro, T., Ishimi, Y., and Yamauchi, J. (2010). Identification of glucose transporter 4 knockdown-dependent transcriptional activation element on the retinol binding protein 4 gene promoter and requirement of the 20 S

273
proteasome subunit for transcriptional activity. J Biol Chem 285, 25545-25553.
IR Phillips, E.S. (1998). Cytochrome P450 protocols. Methods in molecular biology. Itagaki, K., Carver, G.T., and Philpot, R.M. (1996). Expression and characterization
of a modified flavin-containing monooxygenase 4 from humans. J Biol Chem 271, 20102-20107.
Itoh, K., Nakamura, K., Kimura, T., Itoh, S., and Kamataki, T. (1997). Molecular cloning of mouse liver flavin containing monooxygenase (FMO1) cDNA and characterization of the expression product: metabolism of the neurotoxin, 1,2,3,4-tetrahydroisoquinoline (TIQ). J Toxicol Sci 22, 45-56.
Jakobsson, S.V., and Cintig, D.L. (1973). Studies on the cytochrome P-450-containing mono-oxygenase system in human kidney cortex microsomes. J Pharmacol Exp Ther 185, 226-234.
Janmohamed, A., Hernandez, D., Phillips, I.R., and Shephard, E.A. (2004). Cell-, tissue-, sex- and developmental stage-specific expression of mouse flavin-containing monooxygenases (Fmos). Biochem Pharmacol 68, 73-83.
Johnson, A.D., Wang, D., and Sadee, W. (2005). Polymorphisms affecting gene regulation and mRNA processing: broad implications for pharmacogenetics. Pharmacol Ther 106, 19-38.
Jones, K.C., and Ballou, D.P. (1986). Reactions of the 4a-hydroperoxide of liver microsomal flavin-containing monooxygenase with nucleophilic and electrophilic substrates. J Biol Chem 261, 2553-2559.
Kagimoto, M., Heim, M., Kagimoto, K., Zeugin, T., and Meyer, U.A. (1990). Multiple mutations of the human cytochrome P450IID6 gene (CYP2D6) in poor metabolizers of debrisoquine. Study of the functional significance of individual mutations by expression of chimeric genes. J Biol Chem 265, 17209-17214.
Kajita, J., Inano, K., Fuse, E., Kuwabara, T., and Kobayashi, H. (2002). Effects of olopatadine, a new antiallergic agent, on human liver microsomal cytochrome P450 activities. Drug Metab Dispos 30, 1504-1511.
Karoly, E.D., and Rose, R.L. (2001). Sequencing, expression, and characterization of cDNA expressed flavin-containing monooxygenase 2 from mouse. J Biochem Mol Toxicol 15, 300-308.
Katchamart, S., Stresser, D.M., Dehal, S.S., Kupfer, D., and Williams, D.E. (2000). Concurrent flavin-containing monooxygenase down-regulation and cytochrome P-450 induction by dietary indoles in rat: implications for drug-drug interaction. Drug Metab Dispos 28, 930-936.
Katchamart, S., and Williams, D.E. (2001). Indole-3-carbinol modulation of hepatic monooxygenases CYP1A1, CYP1A2 and FMO1 in guinea pig, mouse and rabbit. Comp Biochem Physiol C Toxicol Pharmacol 129, 377-384.
Kedderis, G.L., and Rickert, D.E. (1985). Loss of rat liver microsomal cytochrome P-450 during methimazole metabolism. Role of flavin-containing monooxygenase. Drug Metab Dispos 13, 58-61.
Kent, W.J., Sugnet, C.W., Furey, T.S., Roskin, K.M., Pringle, T.H., Zahler, A.M., and Haussler, D. (2002). The human genome browser at UCSC. Genome Res 12, 996-1006.
Kim, S.J., Lee, K.H., Lee, Y.S., Mun, E.G., Kwon, D.Y., and Cha, Y.S. (2007). Transcriptome analysis and promoter sequence studies on early adipogenesis in 3T3-L1 cells. Nutr Res Pract 1, 19-28.

274
Kim, Y.H., Lim, D.S., Lee, J.H., Shim, W.J., Ro, Y.M., Park, G.H., Becker, K.G., Cho-Chung, Y.S., and Kim, M.K. (2003). Gene expression profiling of oxidative stress on atrial fibrillation in humans. Exp Mol Med 35, 336-349.
Kim, Y.M., and Ziegler, D.M. (2000). Size limits of thiocarbamides accepted as substrates by human flavin-containing monooxygenase 1. Drug Metab Dispos 28, 1003-1006.
Kimura, K., Wakamatsu, A., Suzuki, Y., Ota, T., Nishikawa, T., Yamashita, R., Yamamoto, J., Sekine, M., Tsuritani, K., Wakaguri, H., et al. (2006). Diversification of transcriptional modulation: large-scale identification and characterization of putative alternative promoters of human genes. Genome Res 16, 55-65.
Kimura, T., Kodama, M., and Nagata, C. (1983). Purification of mixed-function amine oxidase from rat liver microsomes. Biochem Biophys Res Commun 110, 640-645.
Knight, J.C., Keating, B.J., Rockett, K.A., and Kwiatkowski, D.P. (2003). In vivo characterization of regulatory polymorphisms by allele-specific quantification of RNA polymerase loading. Nat Genet 33, 469-475.
Koch, M., Vorwerk, S., Masur, C., Sharifi-Sirchi, G., Olivieri, N., and Schlaich, N.L. (2006). A role for a flavin-containing mono-oxygenase in resistance against microbial pathogens in Arabidopsis. Plant J 47, 629-639.
Koster, M.I., Kim, S., Huang, J., Williams, T., and Roop, D.R. (2006). TAp63alpha induces AP-2gamma as an early event in epidermal morphogenesis. Dev Biol 289, 253-261.
Koukouritaki, S.B., Simpson, P., Yeung, C.K., Rettie, A.E., and Hines, R.N. (2002). Human hepatic flavin-containing monooxygenases 1 (FMO1) and 3 (FMO3) developmental expression. Pediatr Res 51, 236-243.
Krause, R.J., Lash, L.H., and Elfarra, A.A. (2003). Human kidney flavin-containing monooxygenases and their potential roles in cysteine s-conjugate metabolism and nephrotoxicity. J Pharmacol Exp Ther 304, 185-191.
Krause, R.J., Ripp, S.L., Sausen, P.J., Overby, L.H., Philpot, R.M., and Elfarra, A.A. (1996). Characterization of the methionine S-oxidase activity of rat liver and kidney microsomes: immunochemical and kinetic evidence for FMO3 being the major catalyst. Arch Biochem Biophys 333, 109-116.
Krueger, S.K., and Williams, D.E. (2005). Mammalian flavin-containing monooxygenases: structure/function, genetic polymorphisms and role in drug metabolism. Pharmacol Ther 106, 357-387.
Kubo, A., Itoh, S., Itoh, K., and Kamataki, T. (1997). Determination of FAD-binding domain in flavin-containing monooxygenase 1 (FMO1). Arch Biochem Biophys 345, 271-277.
Landry, J.R., Mager, D.L., and Wilhelm, B.T. (2003). Complex controls: the role of alternative promoters in mammalian genomes. Trends Genet 19, 640-648.
Lane, M.D., Tang, Q.Q., and Jiang, M.S. (1999). Role of the CCAAT enhancer binding proteins (C/EBp) in adipocyte differentiation. Biochem Biophys Res Commun 266, 677-683.
Lang, D.H., and Rettie, A.E. (2000). In vitro evaluation of potential in vivo probes for human flavin-containing monooxygenase (FMO): metabolism of benzydamine and caffeine by FMO and P450 isoforms. Br J Clin Pharmacol 50, 311-314.
Lang, D.H., Yeung, C.K., Peter, R.M., Ibarra, C., Gasser, R., Itagaki, K., Philpot, R.M., and Rettie, A.E. (1998). Isoform specificity of trimethylamine N-

275
oxygenation by human flavin-containing monooxygenase (FMO) and P450 enzymes: selective catalysis by FMO3. Biochem Pharmacol 56, 1005-1012.
Langston, J.W., and Irwin, I. (1986). MPTP: current concepts and controversies. Clin Neuropharmacol 9, 485-507.
Lattard, V., Longin-Sauvageon, C., Lachuer, J., Delatour, P., and Benoit, E. (2002). Cloning, sequencing, and tissue-dependent expression of flavin-containing monooxygenase (FMO) 1 and FMO3 in the dog. Drug Metab Dispos 30, 119-128.
Lawton, M.P., Cashman, J.R., Cresteil, T., Dolphin, C.T., Elfarra, A.A., Hines, R.N., Hodgson, E., Kimura, T., Ozols, J., Phillips, I.R., et al. (1994). A nomenclature for the mammalian flavin-containing monooxygenase gene family based on amino acid sequence identities. Arch Biochem Biophys 308, 254-257.
Lawton, M.P., Gasser, R., Tynes, R.E., Hodgson, E., and Philpot, R.M. (1990). The flavin-containing monooxygenase enzymes expressed in rabbit liver and lung are products of related but distinctly different genes. J Biol Chem 265, 5855-5861.
Levanon, D., and Groner, Y. (2004). Structure and regulated expression of mammalian RUNX genes. Oncogene 23, 4211-4219.
Liang, H., and Ward, W.F. (2006). PGC-1alpha: a key regulator of energy metabolism. Adv Physiol Educ 30, 145-151.
Liu, F., Lei, W., O'Rourke, J.P., and Ness, S.A. (2006). Oncogenic mutations cause dramatic, qualitative changes in the transcriptional activity of c-Myb. Oncogene 25, 795-805.
Longin-Sauvageon, C., Lattard, V., Lilaz-Michel, C., Buronfosse, T., and Benoit, E. (1998). Expression of two different FMOs in sheep liver. Drug Metab Dispos 26, 284-287.
Lovlie, R., Daly, A.K., Matre, G.E., Molven, A., and Steen, V.M. (2001). Polymorphisms in CYP2D6 duplication-negative individuals with the ultrarapid metabolizer phenotype: a role for the CYP2D6*35 allele in ultrarapid metabolism? Pharmacogenetics 11, 45-55.
Luo, Z., and Hines, R.N. (2001). Regulation of flavin-containing monooxygenase 1 expression by ying yang 1 and hepatic nuclear factors 1 and 4. Mol Pharmacol 60, 1421-1430.
Malaspina, A., Kaushik, N., and de Belleroche, J. (2001). Differential expression of 14 genes in amyotrophic lateral sclerosis spinal cord detected using gridded cDNA arrays. J Neurochem 77, 132-145.
Mani, C., Hodgson, E., and Kupfer, D. (1993). Metabolism of the antimammary cancer antiestrogenic agent tamoxifen. II. Flavin-containing monooxygenase-mediated N-oxidation. Drug Metab Dispos 21, 657-661.
Marez, D., Sabbagh, N., Legrand, M., Lo-Guidice, J.M., Boone, P., and Broly, F. (1995). A novel CYP2D6 allele with an abolished splice recognition site associated with the poor metabolizer phenotype. Pharmacogenetics 5, 305-311.
McCombie, R.R., Dolphin, C.T., Povey, S., Phillips, I.R., and Shephard, E.A. (1996). Localization of human flavin-containing monooxygenase genes FMO2 and FMO5 to chromosome 1q. Genomics 34, 426-429.
McDanell, R., McLean, A.E., Hanley, A.B., Heaney, R.K., and Fenwick, G.R. (1988). Chemical and biological properties of indole glucosinolates (glucobrassicins): a review. Food Chem Toxicol 26, 59-70.

276
Messeguer, X., Escudero, R., Farre, D., Nunez, O., Martinez, J., and Alba, M.M. (2002). PROMO: detection of known transcription regulatory elements using species-tailored searches. Bioinformatics 18, 333-334.
Minamitani, K., Takahashi, Y., Minagawa, M., Yasuda, T., and Niimi, H. (1998). Difference in height associated with a translation start site polymorphism in the vitamin D receptor gene. Pediatr Res 44, 628-632.
Muchardt, C., and Yaniv, M. (1999). The mammalian SWI/SNF complex and the control of cell growth. Semin Cell Dev Biol 10, 189-195.
Mulcare, C.A., Weale, M.E., Jones, A.L., Connell, B., Zeitlyn, D., Tarekegn, A., Swallow, D.M., Bradman, N., and Thomas, M.G. (2004). The T allele of a single-nucleotide polymorphism 13.9 kb upstream of the lactase gene (LCT) (C-13.9kbT) does not predict or cause the lactase-persistence phenotype in Africans. Am J Hum Genet 74, 1102-1110.
Murray-Zmijewski, F., Lane, D.P., and Bourdon, J.C. (2006). p53/p63/p73 isoforms: an orchestra of isoforms to harmonise cell differentiation and response to stress. Cell Death Differ 13, 962-972.
Mushiroda, T., Ariyoshi, N., Yokoi, T., Takahara, E., Nagata, O., Kato, H., and Kamataki, T. (2001). Accumulation of the 1-methyl-4-phenylpyridinium ion in suncus (Suncus murinus) brain: implication for flavin-containing monooxygenase activity in brain microvessels. Chem Res Toxicol 14, 228-232.
Mushiroda, T., Douya, R., Takahara, E., and Nagata, O. (2000a). The involvement of flavin-containing monooxygenase but not CYP3A4 in metabolism of itopride hydrochloride, a gastroprokinetic agent: comparison with cisapride and mosapride citrate. Drug Metab Dispos 28, 1231-1237.
Mushiroda, T., Yokoi, T., Itoh, K., Nunoya, K., Nakagawa, T., Kubota, M., Takahara, E., Nagata, O., Kato, H., and Kamataki, T. (2000b). The house musk shrew (Suncus murinus): a unique animal with extremely low level of expression of mRNAs for CYP3A and flavin-containing monooxygenase. Comp Biochem Physiol C Toxicol Pharmacol 126, 225-234.
Musunuru, K., Strong, A., Frank-Kamenetsky, M., Lee, N.E., Ahfeldt, T., Sachs, K.V., Li, X., Li, H., Kuperwasser, N., Ruda, V.M., et al. (2010). From noncoding variant to phenotype via SORT1 at the 1p13 cholesterol locus. Nature 466, 714-719.
Nagata, T., Williams, D.E., and Ziegler, D.M. (1990). Substrate specificities of rabbit lung and porcine liver flavin-containing monooxygenases: differences due to substrate size. Chem Res Toxicol 3, 372-376.
Nakajima, M., Yokoi, T., Mizutani, M., Kinoshita, M., Funayama, M., and Kamataki, T. (1999). Genetic polymorphism in the 5′-flanking region of human CYP1A2 gene: effect on the CYP1A2 inducibility in humans. J Biochem 125, 803-808.
Narimatsu, S., Yamamoto, S., Kato, R., Masubuchi, Y., and Horie, T. (1999). Contribution of flavin-containing monooxygenase and cytochrome P450 to imipramine N-oxidation in rat hepatic microsomes. Biol Pharm Bull 22, 567-571.
Novikoff, A.B., Novikoff, P.M., Rosen, O.M., and Rubin, C.S. (1980). Organelle relationships in cultured 3T3-L1 preadipocytes. J Cell Biol 87, 180-196.
Ober, C., Aldrich, C.L., Chervoneva, I., Billstrand, C., Rahimov, F., Gray, H.L., and Hyslop, T. (2003). Variation in the HLA-G promoter region influences miscarriage rates. Am J Hum Genet 72, 1425-1435.

277
Ober, C., Billstrand, C., Kuldanek, S., and Tan, Z. (2006). The miscarriage-associated HLA-G -725G allele influences transcription rates in JEG-3 cells. Hum Reprod 21, 1743-1748.
Ohmi, N., Yoshida, H., Endo, H., Hasegawa, M., Akimoto, M., and Higuchi, S. (2003). S-oxidation of S-methyl-esonarimod by flavin-containing monooxygenases in human liver microsomes. Xenobiotica 33, 1221-1231.
Omar, B.A. (2009). Investigations into the physiological roles of the flavin-containing monooxygenases in development and homeostasis. PhD thesis.
T. Ota, Y. Suzuki, T. Nishikawa, T. Otsuki, T. Sugiyama, R. Irie, A. Wakamatsu, K. Hayashi, H. Sato, K. Nagai, K. Kimura, H. Makita, M. Sekine, M. Obayashi, T. Nishi, T. Shibahara, T. Tanaka, S. Ishii, J. Yamamoto, K. Saito, Y. Kawai, Y. Isono, Y. Nakamura, K. Nagahari, K. Murakami, T. Yasuda, T. Iwayanagi, M. Wagatsuma, A. Shiratori, H. Sudo, T. Hosoiri, Y. Kaku, H. Kodaira, H. Kondo, M. Sugawara, M. Takahashi, K. Kanda, T. Yokoi, T. Furuya, E. Kikkawa, Y. Omura, K. Abe, K. Kamihara, N. Katsuta, K. Sato, M. Tanikawa, M. Yamazaki, K. Ninomiya, T. Ishibashi, H. Yamashita, K. Murakawa, K. Fujimori, H. Tanai, M. Kimata, M. Watanabe, S. Hiraoka, Y. Chiba, S. Ishida, Y. Ono, S. Takiguchi, S. Watanabe, M. Yosida, T. Hotuta, J. Kusano, K. Kanehori, A. Takahashi-Fujii, H. Hara, T. O. Tanase, Y. Nomura, S. Togiya, F. Komai, R. Hara, K. Takeuchi, M. Arita, N. Imose, K. Musashino, H. Yuuki, A. Oshima, N. Sasaki, S. Aotsuka, Y. Yoshikawa, H. Matsunawa, T. Ichihara, N. Shiohata, S. Sano, S. Moriya, H. Momiyama, N. Satoh, S. Takami, Y. Terashima, O. Suzuki, S. Nakagawa, A. Senoh, H. Mizoguchi, Y. Goto, F. Shimizu, H. Wakebe, H. Hishigaki, T. Watanabe, A. Sugiyama, M. Takemoto, B. Kawakami, K. Watanabe, A. Kumagai, S. Itakura, Y. Fukuzumi, Y. Fujimori, M. Komiyama, H. Tashiro, A. Tanigami, T. Fujiwara, T. Ono, K. Yamada, Y. Fujii, K. Ozaki, M. Hirao, Y. Ohmori, A. Kawabata, T. Hikiji, N. Kobatake, H. Inagaki, Y. Ikema, S. Okamoto, R. Okitani, T. Kawakami, S. Noguchi, T. Itoh, K. Shigeta, T. Senba, K. Matsumura, Y. Nakajima, T. Mizuno, M. Morinaga, M. Sasaki, T. Togashi, M. Oyama, H. Hata, T. Komatsu, J. Mizushima-Sugano, T. Satoh, Y. Shirai, Y. Takahashi, K. Nakagawa, K. Okumura, T. Nagase, N. Nomura, H. Kikuchi, Y. Masuho, R. Yamashita, K. Nakai, T. Yada, O. Ohara, T. Isogai and S. Sugano. Complete sequencing and
characterization of 21,243 full-length human cDNAs. Nat Genet 36, 40-45. Overby, L.H., Buckpitt, A.R., Lawton, M.P., Atta-Asafo-Adjei, E., Schulze, J., and
Philpot, R.M. (1995). Characterization of flavin-containing monooxygenase 5 (FMO5) cloned from human and guinea pig: evidence that the unique catalytic properties of FMO5 are not confined to the rabbit ortholog. Arch Biochem Biophys 317, 275-284.
Pajares, M.J., Ezponda, T., Catena, R., Calvo, A., Pio, R., and Montuenga, L.M. (2007). Alternative splicing: an emerging topic in molecular and clinical oncology. Lancet Oncol 8, 349-357.
Park, C.S., Baek, H.M., Chung, W.G., Lee, K.H., Ryu, S.D., and Cha, Y.N. (1999). Suppression of flavin-containing monooxygenase by overproduced nitric oxide in rat liver. Mol Pharmacol 56, 507-514.
Park, S.B., Jacob, P., 3rd, Benowitz, N.L., and Cashman, J.R. (1993). Stereoselective metabolism of (S)-(-)-nicotine in humans: formation of trans-(S)-(-)-nicotine N-1'-oxide. Chem Res Toxicol 6, 880-888.
Parte, P., and Kupfer, D. (2005). Oxidation of tamoxifen by human flavin-containing monooxygenase (FMO) 1 and FMO3 to tamoxifen-N-oxide and its novel

278
reduction back to tamoxifen by human cytochromes P450 and hemoglobin. Drug Metab Dispos 33, 1446-1452.
Pastinen, T., and Hudson, T.J. (2004). Cis-acting regulatory variation in the human genome. Science 306, 647-650.
Pelkonen, O., Rautio, A., Raunio, H., and Pasanen, M. (2000). CYP2A6: a human coumarin 7-hydroxylase. Toxicology 144, 139-147.
Pettit, F.H., Orme-Johnson, W., and Ziegler, D.M. (1964). The requirement for flavin adenine dinucleotide by a liver microsmal oxygenase catalyzing the oxidation of alkylaryl amines. Biochem Biophys Res Commun 16, 444-448.
Phillips, I.R., Dolphin, C.T., Clair, P., Hadley, M.R., Hutt, A.J., McCombie, R.R., Smith, R.L., and Shephard, E.A. (1995). The molecular biology of the flavin-containing monooxygenases of man. Chem Biol Interact 96, 17-32.
Phillips, I.R., and Shephard, E.A. (2008). Flavin-containing monooxygenases: mutations, disease and drug response. Trends Pharmacol Sci 29, 294-301.
Phillips, J.E., and Corces, V.G. (2009). CTCF: master weaver of the genome. Cell 137, 1194-1211.
Pitarque, M., von Richter, O., Oke, B., Berkkan, H., Oscarson, M., and Ingelman-Sundberg, M. (2001). Identification of a single nucleotide polymorphism in the TATA box of the CYP2A6 gene: impairment of its promoter activity. Biochem Biophys Res Commun 284, 455-460.
Pitarque, M., von Richter, O., Rodriguez-Antona, C., Wang, J., Oscarson, M., and Ingelman-Sundberg, M. (2004). A nicotine C-oxidase gene (CYP2A6) polymorphism important for promoter activity. Hum Mutat 23, 258-266.
Poulsen, L.L., Hyslop, R.M., and Ziegler, D.M. (1979). S-Oxygenation of N-substituted thioureas catalyzed by the pig liver microsomal FAD-containing monooxygenase. Arch Biochem Biophys 198, 78-88.
Poulsen, L.L., Taylor, K., Williams, D.E., Masters, B.S., and Ziegler, D.M. (1986). Substrate specificity of the rabbit lung flavin-containing monooxygenase for amines: oxidation products of primary alkylamines. Mol Pharmacol 30, 680-685.
Poulter, M., Hollox, E., Harvey, C.B., Mulcare, C., Peuhkuri, K., Kajander, K., Sarner, M., Korpela, R., and Swallow, D.M. (2003). The causal element for the lactase persistence/non-persistence polymorphism is located in a 1 Mb region of linkage disequilibrium in Europeans. Ann Hum Genet 67, 298-311.
Pozner, A., Goldenberg, D., Negreanu, V., Le, S.Y., Elroy-Stein, O., Levanon, D., and Groner, Y. (2000). Transcription-coupled translation control of AML1/RUNX1 is mediated by cap- and internal ribosome entry site-dependent mechanisms. Mol Cell Biol 20, 2297-2307.
Puigserver, P. (2005). Tissue-specific regulation of metabolic pathways through the transcriptional coactivator PGC1-alpha. Int J Obes (Lond) 29 Suppl 1, S5-9.
Qian, L., and Ortiz de Montellano, P.R. (2006). Oxidative activation of thiacetazone by the Mycobacterium tuberculosis flavin monooxygenase EtaA and human FMO1 and FMO3. Chem Res Toxicol 19, 443-449.
Rahib, L., MacLennan, N.K., Horvath, S., Liao, J.C., and Dipple, K.M. (2007). Glycerol kinase deficiency alters expression of genes involved in lipid metabolism, carbohydrate metabolism, and insulin signaling. Eur J Hum Genet 15, 646-657.
Regina, M., Korhonen, V.P., Smith, T.K., Alakuijala, L., and Eloranta, T.O. (1993). Methionine toxicity in the rat in relation to hepatic accumulation of S-

279
adenosylmethionine: prevention by dietary stimulation of the hepatic transsulfuration pathway. Arch Biochem Biophys 300, 598-607.
Rhead, B., Karolchik, D., Kuhn, R.M., Hinrichs, A.S., Zweig, A.S., Fujita, P.A., Diekhans, M., Smith, K.E., Rosenbloom, K.R., Raney, B.J., et al. (2010). The UCSC Genome Browser database: update 2010. Nucleic Acids Res 38, D613-619.
Ring, B.J., Wrighton, S.A., Aldridge, S.L., Hansen, K., Haehner, B., and Shipley, L.A. (1999). Flavin-containing monooxygenase-mediated N-oxidation of the M(1)-muscarinic agonist xanomeline. Drug Metab Dispos 27, 1099-1103.
Roberts, J., Scott, A.C., Howard, M.R., Breen, G., Bubb, V.J., Klenova, E., and Quinn, J.P. (2007). Differential regulation of the serotonin transporter gene by lithium is mediated by transcription factors, CCCTC binding protein and Y-box binding protein 1, through the polymorphic intron 2 variable number tandem repeat. J Neurosci 27, 2793-2801.
Rodriguez, R.J., and Miranda, C.L. (2000). Isoform specificity of N-deacetyl ketoconazole by human and rabbit flavin-containing monooxygenases. Drug Metab Dispos 28, 1083-1086.
Rolland, V., Dugail, I., Le Liepvre, X., and Lavau, M. (1995). Evidence of increased glyceraldehyde-3-phosphate dehydrogenase and fatty acid synthetase promoter activities in transiently transfected adipocytes from genetically obese rats. J Biol Chem 270, 1102-1106.
Rolland, V., Liepvre, X.L., Jump, D.B., Lavau, M., and Dugail, I. (1996). A GC-rich region containing Sp1 and Sp1-like binding sites is a crucial regulatory motif for fatty acid synthase gene promoter activity in adipocytes. Implication In the overactivity of FAS promoter in obese Zucker rats. J Biol Chem 271, 21297-21302.
Ryerson, C.C., Ballou, D.P., and Walsh, C. (1982). Mechanistic studies on cyclohexanone oxygenase. Biochemistry 21, 2644-2655.
Sabourin, P.J., Smyser, B.P., and Hodgson, E. (1984). Purification of the flavin-containing monooxygenase from mouse and pig liver microsomes. Int J Biochem 16, 713-720.
Sachse, C., Brockmoller, J., Bauer, S., and Roots, I. (1999). Functional significance of a C-->A polymorphism in intron 1 of the cytochrome P450 CYP1A2 gene tested with caffeine. Br J Clin Pharmacol 47, 445-449.
Sasaki, H., Ishihara, K., and Kato, R. (2000). Mechanisms of Igf2/H19 imprinting: DNA methylation, chromatin and long-distance gene regulation. J Biochem 127, 711-715.
Schenkman, J.B., Arinc, E., Schenkman, J.B., and E, H. (1999). The fate of xenobiotics in the body. Molecular and applied aspects of oxidative drug metabolising enzymes, pp1-20.
Scott, R.E., Florine, D.L., Wille, J.J., Jr., and Yun, K. (1982). Coupling of growth arrest and differentiation at a distinct state in the G1 phase of the cell cycle: GD. Proc Natl Acad Sci U S A 79, 845-849.
Sheets, M.D., Ogg, S.C., and Wickens, M.P. (1990). Point mutations in AAUAAA and the poly (A) addition site: effects on the accuracy and efficiency of cleavage and polyadenylation in vitro. Nucleic Acids Res 18, 5799-5805.
Shendure, J., and Ji, H. (2008). Next-generation DNA sequencing. Nat Biotechnol 26, 1135-1145.
Shephard, E.A., Chandan, P., Stevanovic-Walker, M., Edwards, M., and Phillips, I.R. (2007). Alternative promoters and repetitive DNA elements define the

280
species-dependent tissue-specific expression of the FMO1 genes of human and mouse. Biochem J 406, 491-499.
Shephard, E.A., Dolphin, C.T., Fox, M.F., Povey, S., Smith, R., and Phillips, I.R. (1993). Localization of genes encoding three distinct flavin-containing monooxygenases to human chromosome 1q. Genomics 16, 85-89. Shephard, E.A., and Phillips, I.R. (2010). The potential of knockout mouse
lines in defining the role of flavin-containing monooxygenases in drug metabolism. Expert Opin Drug Metab Toxicol 6, 1083-1094.
Shimada, T., Yamazaki, H., Mimura, M., Inui, Y., and Guengerich, F.P. (1994). Interindividual variations in human liver cytochrome P-450 enzymes involved in the oxidation of drugs, carcinogens and toxic chemicals: studies with liver microsomes of 30 Japanese and 30 Caucasians. J Pharmacol Exp Ther 270, 414-423.
Singer-Sam, J., LeBon, J.M., Dai, A., and Riggs, A.D. (1992). A sensitive, quantitative assay for measurement of allele-specific transcripts differing by a single nucleotide. PCR Methods Appl 1, 160-163.
Singh, P., Han, L., Rivas, G.E., Lee, D.H., Nicholson, T.B., Larson, G.P., Chen, T., and Szabo, P.E. (2010). Allele-specific H3K79 Di- versus trimethylation distinguishes opposite parental alleles at imprinted regions. Mol Cell Biol 30, 2693-2707.
Siva, N. (2008). 1000 Genomes project. Nat Biotechnol 26, 256. Song, L., and Crawford, G.E. (2010). DNase-seq: a high-resolution technique for
mapping active gene regulatory elements across the genome from mammalian cells. Cold Spring Harb Protoc 2010, pdb prot5384.
Steinthorsdottir, V., Stefansson, H., Ghosh, S., Birgisdottir, B., Bjornsdottir, S., Fasquel, A.C., Olafsson, O., Stefansson, K., and Gulcher, J.R. (2004). Multiple novel transcription initiation sites for NRG1. Gene 342, 97-105.
Stephens, M., and Donnelly, P. (2003). A comparison of bayesian methods for haplotype reconstruction from population genotype data. Am J Hum Genet 73, 1162-1169.
Stephens, M., Smith, N.J., and Donnelly, P. (2001). A new statistical method for haplotype reconstruction from population data. Am J Hum Genet 68, 978-989.
Stevens, J.C., Melton, R.J., Zaya, M.J., and Engel, L.C. (2003). Expression and characterization of functional dog flavin-containing monooxygenase 1. Mol Pharmacol 63, 271-275.
Stormer, E., Roots, I., and Brockmoller, J. (2000). Benzydamine N-oxidation as an index reaction reflecting FMO activity in human liver microsomes and impact of FMO3 polymorphisms on enzyme activity. Br J Clin Pharmacol 50, 553-561.
Student, A.K., Hsu, R.Y., and Lane, M.D. (1980). Induction of fatty acid synthetase synthesis in differentiating 3T3-L1 preadipocytes. J Biol Chem 255, 4745-4750.
Su, A.I., Cooke, M.P., Ching, K.A., Hakak, Y., Walker, J.R., Wiltshire, T., Orth, A.P., Vega, R.G., Sapinoso, L.M., Moqrich, A., et al. (2002). Large-scale analysis of the human and mouse transcriptomes. Proc Natl Acad Sci U S A 99, 4465-4470.
Suh, J.K., Poulsen, L.L., Ziegler, D.M., and Robertus, J.D. (1999). Yeast flavin-containing monooxygenase generates oxidizing equivalents that control protein folding in the endoplasmic reticulum. Proc Natl Acad Sci U S A 96, 2687-2691.
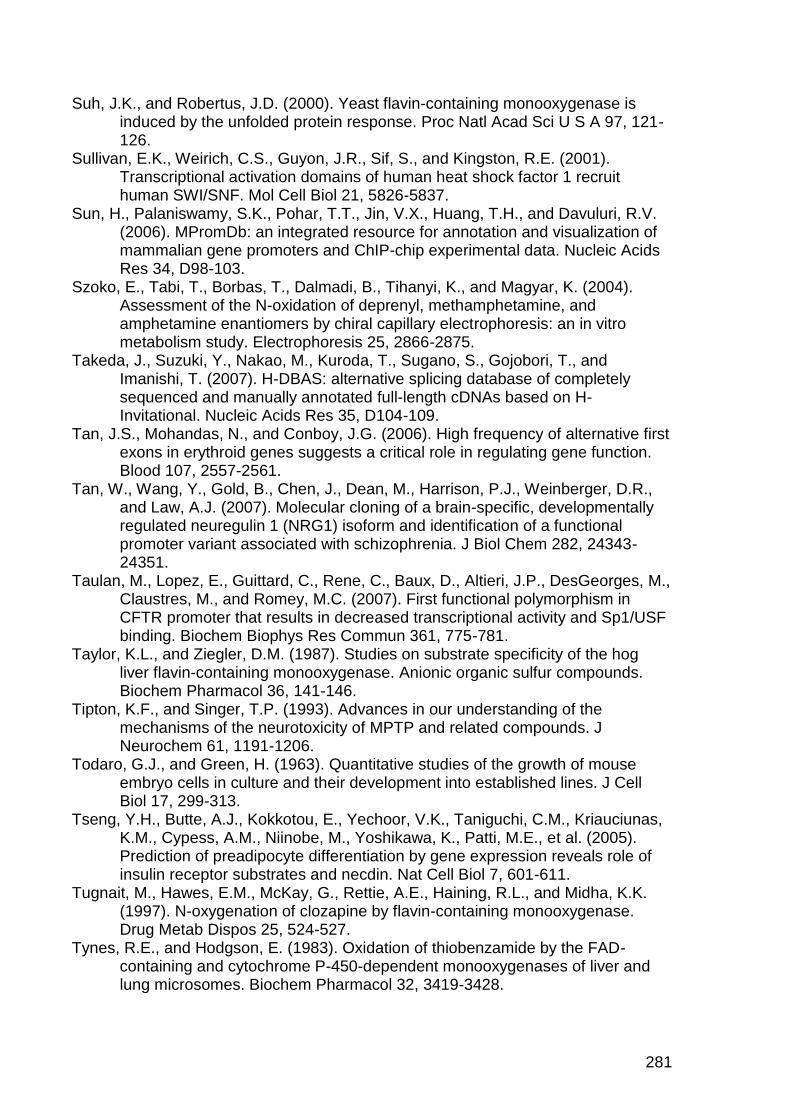
281
Suh, J.K., and Robertus, J.D. (2000). Yeast flavin-containing monooxygenase is induced by the unfolded protein response. Proc Natl Acad Sci U S A 97, 121-126.
Sullivan, E.K., Weirich, C.S., Guyon, J.R., Sif, S., and Kingston, R.E. (2001). Transcriptional activation domains of human heat shock factor 1 recruit human SWI/SNF. Mol Cell Biol 21, 5826-5837.
Sun, H., Palaniswamy, S.K., Pohar, T.T., Jin, V.X., Huang, T.H., and Davuluri, R.V. (2006). MPromDb: an integrated resource for annotation and visualization of mammalian gene promoters and ChIP-chip experimental data. Nucleic Acids Res 34, D98-103.
Szoko, E., Tabi, T., Borbas, T., Dalmadi, B., Tihanyi, K., and Magyar, K. (2004). Assessment of the N-oxidation of deprenyl, methamphetamine, and amphetamine enantiomers by chiral capillary electrophoresis: an in vitro metabolism study. Electrophoresis 25, 2866-2875.
Takeda, J., Suzuki, Y., Nakao, M., Kuroda, T., Sugano, S., Gojobori, T., and Imanishi, T. (2007). H-DBAS: alternative splicing database of completely sequenced and manually annotated full-length cDNAs based on H-Invitational. Nucleic Acids Res 35, D104-109.
Tan, J.S., Mohandas, N., and Conboy, J.G. (2006). High frequency of alternative first exons in erythroid genes suggests a critical role in regulating gene function. Blood 107, 2557-2561.
Tan, W., Wang, Y., Gold, B., Chen, J., Dean, M., Harrison, P.J., Weinberger, D.R., and Law, A.J. (2007). Molecular cloning of a brain-specific, developmentally regulated neuregulin 1 (NRG1) isoform and identification of a functional promoter variant associated with schizophrenia. J Biol Chem 282, 24343-24351.
Taulan, M., Lopez, E., Guittard, C., Rene, C., Baux, D., Altieri, J.P., DesGeorges, M., Claustres, M., and Romey, M.C. (2007). First functional polymorphism in CFTR promoter that results in decreased transcriptional activity and Sp1/USF binding. Biochem Biophys Res Commun 361, 775-781.
Taylor, K.L., and Ziegler, D.M. (1987). Studies on substrate specificity of the hog liver flavin-containing monooxygenase. Anionic organic sulfur compounds. Biochem Pharmacol 36, 141-146.
Tipton, K.F., and Singer, T.P. (1993). Advances in our understanding of the mechanisms of the neurotoxicity of MPTP and related compounds. J Neurochem 61, 1191-1206.
Todaro, G.J., and Green, H. (1963). Quantitative studies of the growth of mouse embryo cells in culture and their development into established lines. J Cell Biol 17, 299-313.
Tseng, Y.H., Butte, A.J., Kokkotou, E., Yechoor, V.K., Taniguchi, C.M., Kriauciunas, K.M., Cypess, A.M., Niinobe, M., Yoshikawa, K., Patti, M.E., et al. (2005). Prediction of preadipocyte differentiation by gene expression reveals role of insulin receptor substrates and necdin. Nat Cell Biol 7, 601-611.
Tugnait, M., Hawes, E.M., McKay, G., Rettie, A.E., Haining, R.L., and Midha, K.K. (1997). N-oxygenation of clozapine by flavin-containing monooxygenase. Drug Metab Dispos 25, 524-527.
Tynes, R.E., and Hodgson, E. (1983). Oxidation of thiobenzamide by the FAD-containing and cytochrome P-450-dependent monooxygenases of liver and lung microsomes. Biochem Pharmacol 32, 3419-3428.

282
Tynes, R.E., Sabourin, P.J., and Hodgson, E. (1985). Identification of distinct hepatic and pulmonary forms of microsomal flavin-containing monooxygenase in the mouse and rabbit. Biochem Biophys Res Commun 126, 1069-1075.
Uldry, M., Yang, W., St-Pierre, J., Lin, J., Seale, P., and Spiegelman, B.M. (2006). Complementary action of the PGC-1 coactivators in mitochondrial biogenesis and brown fat differentiation. Cell Metab 3, 333-341.
Vandesompele, J., De Preter, K., Pattyn, F., Poppe, B., Van Roy, N., De Paepe, A., and Speleman, F. (2002). Accurate normalization of real-time quantitative RT-PCR data by geometric averaging of multiple internal control genes. Genome Biol 3, RESEARCH0034.
Veeramah, K.R., Thomas, M.G., Weale, M.E., Zeitlyn, D., Tarekegn, A., Bekele, E., Mendell, N.R., Shephard, E.A., Bradman, N., and Phillips, I.R. (2008). The potentially deleterious functional variant flavin-containing monooxygenase 2*1 is at high frequency throughout sub-Saharan Africa. Pharmacogenet Genomics 18, 877-886.
Veeravalli, S., Omar, B., Housman, L., Hancock, M., S, G.M., A, J., I.R, P., and E.A, S. (2010). A novel role for a flavin-containing monooxygenase in energy homeostasis.
Veeravalli, S., Omar, B., Housman, L., Hancock, M., S, G.M., A, J., I.R, P., and E.A, S. (Unpublished). A novel role for a flavin-containing monooxygenase in energy homeostasis.
Venkatesh, K., Levi, P.E., and Hodgson, E. (1991). The effect of detergents on the purified flavin-containing monooxygenase of mouse liver, kidney and lungs. Gen Pharmacol 22, 549-552.
von Richter, O., Pitarque, M., Rodriguez-Antona, C., Testa, A., Mantovani, R., Oscarson, M., and Ingelman-Sundberg, M. (2004). Polymorphic NF-Y dependent regulation of human nicotine C-oxidase (CYP2A6). Pharmacogenetics 14, 369-379.
Washio, T., Kohsaka, K., Arisawa, H., Masunaga, H., Nagatsuka, S., and Satoh, Y. (2003). Pharmacokinetics and metabolism of radiolabelled SNI-2011, a novel muscarinic receptor agonist, in healthy volunteers. Comprehensive understanding of absorption, metabolism and excretion using radiolabelled SNI-2011. Arzneimittelforschung 53, 80-86.
Weissman, J., Trevor, A., Chiba, K., Peterson, L.A., Caldera, P., Castagnoli, N., Jr., and Baillie, T. (1985). Metabolism of the nigrostriatal toxin 1-methyl-4-phenyl-1,2,3,6-tetrahydropyridine by liver homogenate fractions. J Med Chem 28, 997-1001.
Wierenga, W. (1985). Antiviral and other bioactivities of pyrimidinones. Pharmacol Ther 30, 67-89.
Williams, D.E., Meyer, H.H., and Dutchuk, M.S. (1989). Distinct pulmonary and hepatic forms of flavin-containing monooxygenase in sheep. Comp Biochem Physiol B 93, 465-470.
Williams, D.E., Ziegler, D.M., Nordin, D.J., Hale, S.E., and Masters, B.S. (1984). Rabbit lung flavin-containing monooxygenase is immunochemically and catalytically distinct from the liver enzyme. Biochem Biophys Res Commun 125, 116-122.
Willing, M.C., Deschenes, S.P., Slayton, R.L., and Roberts, E.J. (1996). Premature chain termination is a unifying mechanism for COL1A1 null alleles in osteogenesis imperfecta type I cell strains. Am J Hum Genet 59, 799-809.
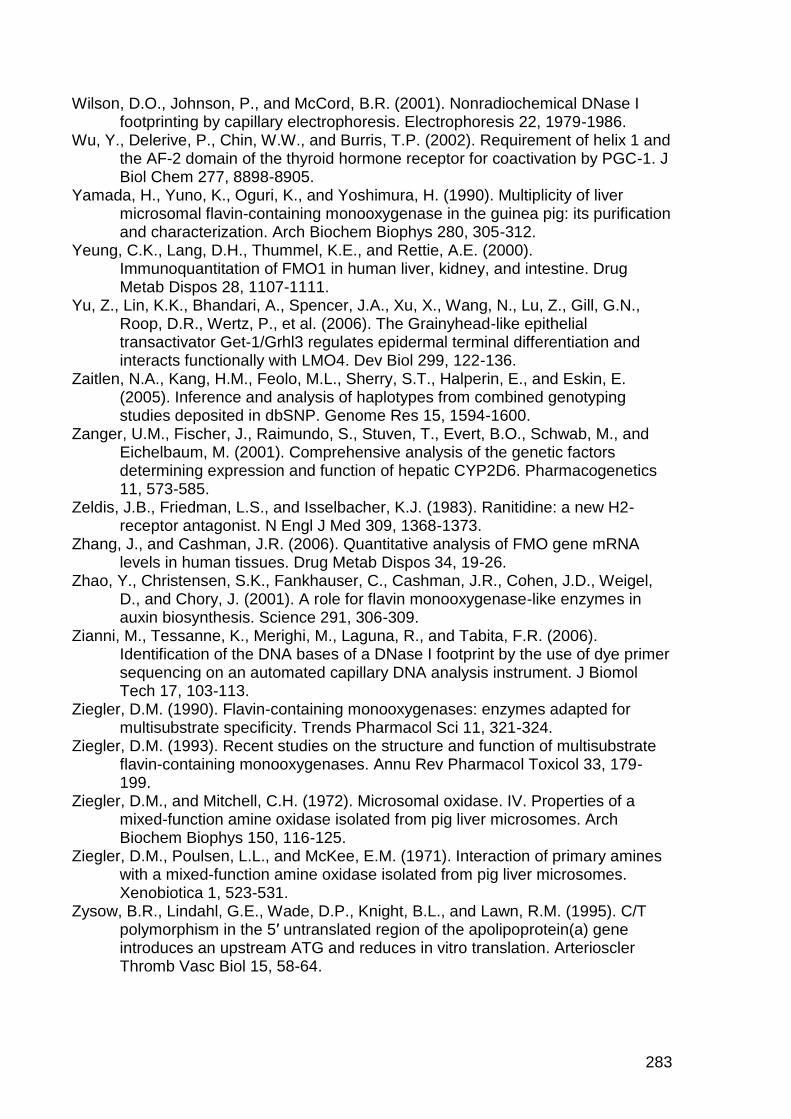
283
Wilson, D.O., Johnson, P., and McCord, B.R. (2001). Nonradiochemical DNase I footprinting by capillary electrophoresis. Electrophoresis 22, 1979-1986.
Wu, Y., Delerive, P., Chin, W.W., and Burris, T.P. (2002). Requirement of helix 1 and the AF-2 domain of the thyroid hormone receptor for coactivation by PGC-1. J Biol Chem 277, 8898-8905.
Yamada, H., Yuno, K., Oguri, K., and Yoshimura, H. (1990). Multiplicity of liver microsomal flavin-containing monooxygenase in the guinea pig: its purification and characterization. Arch Biochem Biophys 280, 305-312.
Yeung, C.K., Lang, D.H., Thummel, K.E., and Rettie, A.E. (2000). Immunoquantitation of FMO1 in human liver, kidney, and intestine. Drug Metab Dispos 28, 1107-1111.
Yu, Z., Lin, K.K., Bhandari, A., Spencer, J.A., Xu, X., Wang, N., Lu, Z., Gill, G.N., Roop, D.R., Wertz, P., et al. (2006). The Grainyhead-like epithelial transactivator Get-1/Grhl3 regulates epidermal terminal differentiation and interacts functionally with LMO4. Dev Biol 299, 122-136.
Zaitlen, N.A., Kang, H.M., Feolo, M.L., Sherry, S.T., Halperin, E., and Eskin, E. (2005). Inference and analysis of haplotypes from combined genotyping studies deposited in dbSNP. Genome Res 15, 1594-1600.
Zanger, U.M., Fischer, J., Raimundo, S., Stuven, T., Evert, B.O., Schwab, M., and Eichelbaum, M. (2001). Comprehensive analysis of the genetic factors determining expression and function of hepatic CYP2D6. Pharmacogenetics 11, 573-585.
Zeldis, J.B., Friedman, L.S., and Isselbacher, K.J. (1983). Ranitidine: a new H2-receptor antagonist. N Engl J Med 309, 1368-1373.
Zhang, J., and Cashman, J.R. (2006). Quantitative analysis of FMO gene mRNA levels in human tissues. Drug Metab Dispos 34, 19-26.
Zhao, Y., Christensen, S.K., Fankhauser, C., Cashman, J.R., Cohen, J.D., Weigel, D., and Chory, J. (2001). A role for flavin monooxygenase-like enzymes in auxin biosynthesis. Science 291, 306-309.
Zianni, M., Tessanne, K., Merighi, M., Laguna, R., and Tabita, F.R. (2006). Identification of the DNA bases of a DNase I footprint by the use of dye primer sequencing on an automated capillary DNA analysis instrument. J Biomol Tech 17, 103-113.
Ziegler, D.M. (1990). Flavin-containing monooxygenases: enzymes adapted for multisubstrate specificity. Trends Pharmacol Sci 11, 321-324.
Ziegler, D.M. (1993). Recent studies on the structure and function of multisubstrate flavin-containing monooxygenases. Annu Rev Pharmacol Toxicol 33, 179-199.
Ziegler, D.M., and Mitchell, C.H. (1972). Microsomal oxidase. IV. Properties of a mixed-function amine oxidase isolated from pig liver microsomes. Arch Biochem Biophys 150, 116-125.
Ziegler, D.M., Poulsen, L.L., and McKee, E.M. (1971). Interaction of primary amines with a mixed-function amine oxidase isolated from pig liver microsomes. Xenobiotica 1, 523-531.
Zysow, B.R., Lindahl, G.E., Wade, D.P., Knight, B.L., and Lawn, R.M. (1995). C/T polymorphism in the 5′ untranslated region of the apolipoprotein(a) gene introduces an upstream ATG and reduces in vitro translation. Arterioscler Thromb Vasc Biol 15, 58-64.

284