Embed Size (px)
Citation preview

Wright State University Wright State University
CORE Scholar CORE Scholar
Browse all Theses and Dissertations Theses and Dissertations
2017
Detection and Analysis of Polyurethane Biodegradation Due to Detection and Analysis of Polyurethane Biodegradation Due to
Cryptococcus Laurentii Cryptococcus Laurentii
Tyler Jacob Zicht Wright State University
Follow this and additional works at: https://corescholar.libraries.wright.edu/etd_all
Part of the Physics Commons
Repository Citation Repository Citation Zicht, Tyler Jacob, "Detection and Analysis of Polyurethane Biodegradation Due to Cryptococcus Laurentii" (2017). Browse all Theses and Dissertations. 1838. https://corescholar.libraries.wright.edu/etd_all/1838
This Thesis is brought to you for free and open access by the Theses and Dissertations at CORE Scholar. It has been accepted for inclusion in Browse all Theses and Dissertations by an authorized administrator of CORE Scholar. For more information, please contact [email protected].

DETECTION AND ANALYSIS OF POLYURETHANE BIODEGRADATION
DUE TO CRYPTOCOCCUS LAURENTII
A thesis submitted in partial fulfillment of the
Requirements for the degree of
Master of Science
By
TYLER JACOB ZICHT
B.S., University of Cincinnati, 2014
2017
Wright State University

WRIGHT STATE UNIVERSITY
GRADUATE SCHOOL
July 11, 2017
I HEREBY RECOMMEND THAT THE THESIS PREPARED UNDER
MY SUPERVISION BY Tyler Jacob Zicht ENTITLED
Detection and Analysis of Polyurethane Biodegradation
due to Cryptococcus laurentii BE ACCEPTED IN PARTIAL
FULFILLMENT OF THE REQUIREMENTS FOR
THE DEGREE OF Master of Science
Brent Foy, Ph.D.
Thesis Director
Jason Deibel, Ph.D.
Chair, Department of Physics
Committee on Final Examination
Brent Foy, Ph.D.
Chia-Suei Hung, Ph.D.
Wendy Goodson, Ph.D.
________________________________________
Robert E. W. Fyffe, Ph.D.
Vice President for Research and
Dean of the Graduate School

iii
ABSTRACT
Zicht, Tyler Jacob. M.S. Department of Physics, Wright State University, 2017.
Detection and Analysis of Polyurethane Biodegradation due to Cryptococcus laurentii
Current United States aircraft are equipped with a multitude of protective coatings on the
interior and exterior of the vehicle, ultimately enhancing their ability to ensure a safe and
effective mission. Aircraft, over the course of their lifetime, will experience impact,
corrosion, weathering, and microbial damage to its defensive structures, rendering it
vulnerable to attacks. Damaged coatings are then repaired on the aircraft once detected in
inspection or replaced in accordance to the lifecycle of the material on the aircraft.
However potentially harmful threats such as bacteria are not considered by the Air Force
to be dangerous. Therefore, the purpose of this study was to analyze the impact and
potential biodegradation properties of microbial colonies on polyurethane film. Using
Infrared Spectroscopy, the results of this research effort show chemical peak amplitude
corresponding to the polyurethane spectra significantly decreased when in the presence of
Cryptococcus laurentii after a week time trial. Similarly, changes in surface area and
volume measurements via laser confocal microscopy coincide with chemical peak loss
results, supporting spectroscopic analysis. Weight measurements of experimental samples
showed no significant linkage between chemical cleaving and mass loss underneath the
biofilm. Additionally, other modalities such as Ultrasound, Scanning Electron
Microscopy, and Thermography were used for potential microbial detection capabilities
as well as 3D structural analysis; the results do not reinforce previous spectroscopic data.
This research demonstrated that Infrared Spectroscopy could reliably detect regions of
localized polyurethane degradation, although the technique is laborious and time
consuming. Further evaluation of microbes using the aforementioned systems is needed
to determine and/or optimize suitable detection methods for field application and intra-
topographical structures underneath the sampled biofilm.
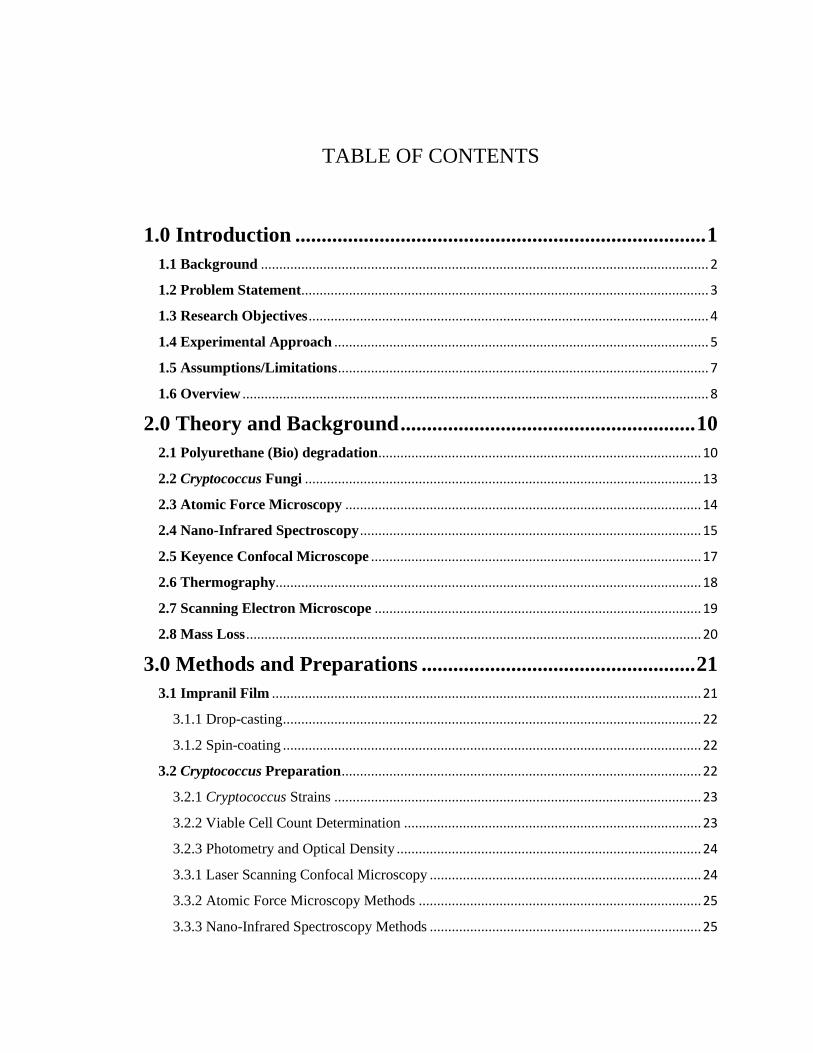
TABLE OF CONTENTS
1.0 Introduction .............................................................................. 1
1.1 Background .......................................................................................................................... 2
1.2 Problem Statement............................................................................................................... 3
1.3 Research Objectives ............................................................................................................. 4
1.4 Experimental Approach ...................................................................................................... 5
1.5 Assumptions/Limitations ..................................................................................................... 7
1.6 Overview ............................................................................................................................... 8
2.0 Theory and Background ........................................................ 10
2.1 Polyurethane (Bio) degradation ........................................................................................ 10
2.2 Cryptococcus Fungi ............................................................................................................ 13
2.3 Atomic Force Microscopy ................................................................................................. 14
2.4 Nano-Infrared Spectroscopy ............................................................................................. 15
2.5 Keyence Confocal Microscope .......................................................................................... 17
2.6 Thermography.................................................................................................................... 18
2.7 Scanning Electron Microscope ......................................................................................... 19
2.8 Mass Loss ............................................................................................................................ 20
3.0 Methods and Preparations .................................................... 21
3.1 Impranil Film ..................................................................................................................... 21
3.1.1 Drop-casting .................................................................................................................. 22
3.1.2 Spin-coating .................................................................................................................. 22
3.2 Cryptococcus Preparation .................................................................................................. 22
3.2.1 Cryptococcus Strains .................................................................................................... 23
3.2.2 Viable Cell Count Determination ................................................................................. 23
3.2.3 Photometry and Optical Density ................................................................................... 24
3.3.1 Laser Scanning Confocal Microscopy .......................................................................... 24
3.3.2 Atomic Force Microscopy Methods ............................................................................. 25
3.3.3 Nano-Infrared Spectroscopy Methods .......................................................................... 25

3.3.4 Ultrasound ..................................................................................................................... 26
3.3.5 Thermography ............................................................................................................... 26
3.3.6 Scanning Electron Microscopy ..................................................................................... 27
3.4 Impranil Peaks ................................................................................................................. 27
4.0 Results and Analytics ............................................................. 31
4.1 Impranil Film Thicknesses ................................................................................................ 31
4.2 Cryptococcus Colony Forming Units and Optical Density ............................................. 35
4.3 Polyurethane Degradation ................................................................................................ 37
4.3.1 Laser Confocal Microscopy .......................................................................................... 37
4.3.2 AFM/Nano IR ............................................................................................................... 45
4.3.4 Scanning Electron Microscopy ..................................................................................... 51
4.3.5 Ultrasound ..................................................................................................................... 54
4.3.6 Mass Loss...................................................................................................................... 57
4.3.7 Thermography ............................................................................................................... 61
5.0 Discussion & Conclusions ...................................................... 64
5.1 Impranil Deposition ........................................................................................................... 65
5.2 Cryptococcus CFU and Optical Density ........................................................................... 66
5.3 Keyence Confocal Microscopy .......................................................................................... 67
5.4 Thermography.................................................................................................................... 67
5.5 Nano-Infrared Spectroscopy ............................................................................................. 68
5.6 Final Thoughts & Future Directions ................................................................................ 69
BIBLIOGRAPHY………………………………………………………………………73
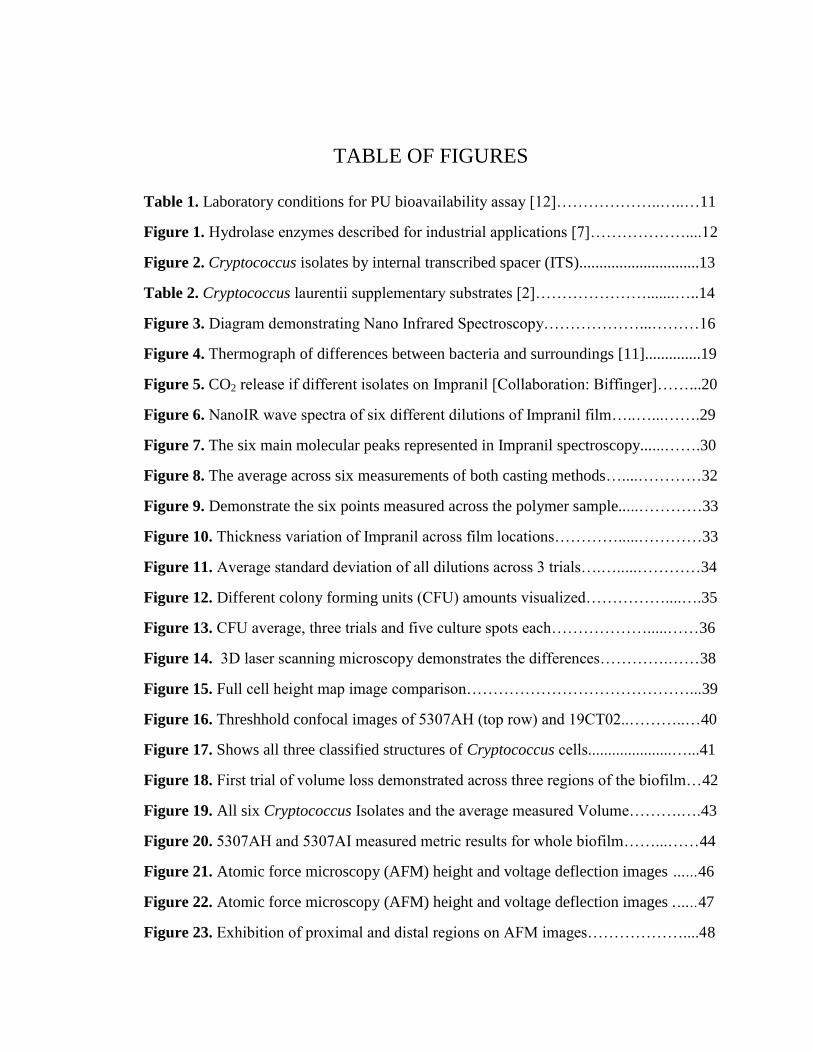
TABLE OF FIGURES
Table 1. Laboratory conditions for PU bioavailability assay [12]………………..…..…11
Figure 1. Hydrolase enzymes described for industrial applications [7]………………....12
Figure 2. Cryptococcus isolates by internal transcribed spacer (ITS)..............................13
Table 2. Cryptococcus laurentii supplementary substrates [2]………………….......…..14
Figure 3. Diagram demonstrating Nano Infrared Spectroscopy………………...………16
Figure 4. Thermograph of differences between bacteria and surroundings [11]..............19
Figure 5. CO2 release if different isolates on Impranil [Collaboration: Biffinger]……...20
Figure 6. NanoIR wave spectra of six different dilutions of Impranil film…..…...…….29
Figure 7. The six main molecular peaks represented in Impranil spectroscopy......…….30
Figure 8. The average across six measurements of both casting methods…....…………32
Figure 9. Demonstrate the six points measured across the polymer sample.....…………33
Figure 10. Thickness variation of Impranil across film locations………….....…………33
Figure 11. Average standard deviation of all dilutions across 3 trials….….....…………34
Figure 12. Different colony forming units (CFU) amounts visualized……………....….35
Figure 13. CFU average, three trials and five culture spots each……………….....……36
Figure 14. 3D laser scanning microscopy demonstrates the differences………….……38
Figure 15. Full cell height map image comparison……………………………………...39
Figure 16. Threshhold confocal images of 5307AH (top row) and 19CT02..………..…40
Figure 17. Shows all three classified structures of Cryptococcus cells.....................…...41
Figure 18. First trial of volume loss demonstrated across three regions of the biofilm…42
Figure 19. All six Cryptococcus Isolates and the average measured Volume……….….43
Figure 20. 5307AH and 5307AI measured metric results for whole biofilm……...……44
Figure 21. Atomic force microscopy (AFM) height and voltage deflection images …...46
Figure 22. Atomic force microscopy (AFM) height and voltage deflection images .…..47
Figure 23. Exhibition of proximal and distal regions on AFM images………………....48

Figure 24. 5307AH waveform of proximal and distal regions across a six day trial……48
Figure 25. Distal peak changes across both trials for 5307AH and 5307AI……………49
Figure 26. Proximal peak changes across both trials for 5307AH and 5307AI…….…..50
Figure 27. SEM images of Cryptococcus on Impranil. A). 5307AI (C. albidus),………52
Figure 28. 5307AH cells after the cell lysis process with 1% SDS……………..………53
Figure 29. Ultrasound images of Impranil film and 5307AH (C. laurentii)……….……55
Figure 30. Example of mass samples of 5307AH (C. laurentii) for two trials………….58
Figure 31. Mass change of the four strains and the control and the total mass……........59
Figure 32. Change in relative mass of the observed strains after the differences ………60
Figure 33. A). The initial IR image at hour (0) of trial 2 …………………………...…..62
Figure 34. Relative temperature of Cryptococcus strains over 64 hours………….…….63
Figure 35. Image from a Confocal Raman system demonstrating feature……….…..…70

Acknowledgments
I would like to thank my thesis advisor, Dr. Chia Hung, for his exceptional
guidance in this research, offering his decades of experience and wisdom to me along the
way. Dr. Hung shows insurmountable patience and character; he is an extraordinary
mentor during my research. I would also like to thank Dr. Wendy Goodson for allowing
me to use her facilities and equipment to conduct my research; without Dr. Goodson’s
allowance none of this would be possible. In addition, I would also like to thank Lloyd
Nadeau and Dr. Josh Kennedy of AFRL/RXAS as well as Dr. Adam Cooney, and Sean
Coghlan of AFRL/RXCA. This research was initiated in collaboration with researchers
across the Naval Research Laboratory, with main contributions from Dr. Daniel Barlow
and Dr. Justin Biffinger,
Thank you to Dr. Enrique Medina and UTC for allowing me to work on my thesis
under my contract and for your direction and encouragement.
Lastly, I would like to thank my council at WSU, Dr. Jason Deibel and Dr. Brent
Foy for their guidance.
Thank you everyone for your enduring patience and support.
Dedicated to Marlee and Hayes Curtner
1
1.0 Introduction
Polyethylene plastics are becoming increasingly common to manufacture for the
use of housing and storing products across the world. Unfortunately, the plastics that
have been made over the recent decades have found themselves in large bodies of water
and wildlife across the planet. Disposing of the plastics suitably in a landfill also has
negative consequences as the plastics do not degrade completely and are remaining to
consume space. Research into removing these polyethylene plastics owes itself to this
problem. This has become a growing problem and scientists have started to understand
how these polyethylene plastics can be broken down organically by the use of microbes.
Popular media designates biodegradation as a solution to this problem.
Polyurethane (PU) is a polymer often mentioned alongside polyethylene even
though it holds many distinct properties comparatively and shares no similar molecular
structure. Polyurethane is commonly used in industrial applications. However, the
biodegradation process is capable of affecting both types of polymers. Common
applications for polyurethane polymers, as mentioned in this paper, are protective
coatings on equipment and vehicles for military use. In this case, microbial degradation is
not a solution but a hindrance that can cause severe damage and cost in repairs to military
equipment. The purpose of the research described herein is to evaluate the damaged
proposed by the fungal organism Cryptococcus on polyurethane film.

2
1.1 Background
Current United States aircraft are outfitted with specialized coatings that serve
numerous beneficial purposes. Military and commercial aircrafts often have multiple
layers of protective undercoats below the final outer layer of paint. The underlying
specifically-designed defense coatings are maintained and reapplied in accordance to
their identified life cycles. Air Force preventative maintenance states that aircraft layers
must be reapplied minimally every few years regardless of any visible damage on the
aircraft. Multi-layer applications of different coatings provide the aircraft with
advantages such as stealth and corrosion prevention, protecting their airmen and the
aircraft from any sort of foreign contaminant or damage. Both the interior and exterior of
the air vehicle are susceptible to damage and therefore both require protection; different
locations on the aircraft can sustain degradation due to different factors dependent on
environmental conditions. Typically, all military air-vehicles have protective coatings on
critical parts such as the engines, navigation systems, and communication technologies
that prevent detection via adversarial equipment and material degradation; however,
some air vehicles require very strict defensive measures to ensure mission efficiency.
Over time coatings can wear down on the aircraft and become physically and
chemically weaker in comparison of their initial application. Main sources of physical,
abiotic damage are caused by ultraviolet exposure, erosion, and crack formation via
fabrication & installation processes. During the layer build-up procedure, particulate and

3
empty voids can be trapped between the layers, decreasing layer adhesion and therefore
the strength of the coatings. Physical impacts of debris during storage or active use can
also create cracks through multiple layers on the vehicle. Certain surface physical
degradation can be visually seen during inspections and routine maintenance, yet most
damage lies beneath the exterior layer and must be detected with other means.
The United States Air Force incorporates many inspection techniques to ensure
the safety and longevity of aircraft. Nondestructive evaluation (NDE) procedures such as
ultrasound, x-ray, eddy current and thermography are commonly used to detect
abnormalities in all layers without causing additional damage. The U.S. Air Force is
continuously looking for new innovative techniques to characterize and identify pre-
determined harmful substances to the aircraft. During inspections, airmen can come
across foreign substances on the coating that have to be evaluated by technicians on how
harmful it is to the aircraft. Foreign structures such as microbes have been found on in-
service air vehicles in the past, but without substantial evidence there has been little
correlation between biological degradation on aircraft to underlying damaged structures.
1.2 Problem Statement
Aircraft are constantly exposed to foreign contaminants or debris, and the
potential for these contaminants to cause damage to the vehicle needs to be evaluated.
Microbial colonies have been found on active aircraft in the past but maintenance
personnel have been cautious to relate this to any polymer degradation. Even if the
microorganisms and the deterioration are related, aircraft maintenance staff have

4
difficulty believing that the organism is able to survive the environmental extremes of the
active Air Force conditions. Aircraft environment conditions change geographically,
experiencing changes in biome while in flight, as well as great altitude and pressure
changes. Accordingly, the vehicle continuously transitions through largely varied
temperatures and humidity during a flight. It is understandable that it would be
tremendously difficult for microorganisms in the extreme changing environments with
limited nutrients to survive and then even grow and cause deterioration.
Air Force innovations in preventative maintenance and detection have allowed
infrared (IR) to become a part of a typical inspection process. With the tools already in
place, further investigation is needed to determine threat level of microbes on the air
vehicles. Furthermore, identified microorganisms must be shown to colonize and survive
on aircraft materials under active conditions as well as genetically, biochemically, and
physiologically be capable of facilitating bio-deterioration. By knowing the contributing
sources of damage on aircraft, early maintenance can be done as opposed to the
allowance of growth and sustainment of microorganisms. Ultimately if bio-deterioration
can be proven harmful and appropriately mitigated it will save repair cost and
maintenance hours that can be put to better production and innovation use.
1.3 Research Objectives
The objective of this dissertation is to evaluate the degradation of a model
polyester polyurethane, Impranil® DLN-SD (Impranil), due to the fungus Cryptococcus
laurentii by means of IR spectroscopy. Additionally, other quantitative and qualitative
5
modalities will further define and confirm results of the degradation process. Chemical
and physical data will be quantified in a temporal structure to determine the lifecycle of
Impranil. As a result, each modality can be evaluated on their effectiveness to detect and
quantify material conditions on material removed from in-service aircraft. Consequently,
the strains of Cryptococcus found on aircraft will be assessed for damage, potentially
deeming them a destructive contaminant on aircraft that requires immediate action.
1.4 Experimental Approach
The first step of this research was to create the PU film on top of a suitable
substrate. Different Impranil dilutions were tested by using multiple fabrication methods,
resulting in a variety of film thicknesses. Accordingly, suitable parameters such as:
fabrication method, dilution ratio, and film thickness were chosen to most efficiently
represent future measurements. In addition, the viable cell count and optical density of
the inoculum cell suspensions were determined and standardized for consistency
throughout the study. Once all preliminary parameters were determined, proper spectra
could be obtained.
The next step in the experiment was to deposit Cryptococcus onto the Impranil
film to form a biofilm on the polyurethane surface. Once the biofilms have formed
degradation detection measurements can begin. Physical alterations to the Impranil film
can be indication of polyurethane degradation. Laser scanning confocal microscopy was
utilized to observe the changes in surface height. Additionally, atomic force microscopy

6
was utilized for its ability to capture difference in surface height. Observations of surface
height lowering may indicate mass loss of the sample and therefore degradation.
Chemical degradation or molecular cleaving can also be direct evidence of
polyurethane degradation. To observe potential chemical degradation, nano-infrared
spectroscopy was employed. Infrared spectra were taken immediately after deposition of
the cells as well as after 1-7 days after inoculation. The time-dependent spectra were then
compared and analyzed to draw conclusions. If chemical degradation is occurring on the
film, spectroscopic peaks will lose amplitude. Due to the difficulties of using laser
scanning confocal microscopy and atomic force microscopy in the field, other modalities
were used that are better suited for active inspection use as well as reinforce previous
data.
Ultrasound measurements are part of the current inspection process for in-service
aircraft. Cryptococcus isolates on Impranil film were submerged in a bath of water to be
observed via ultrasound. Ultrasound’s advantage is being able to detect multiple layers of
a sample; if degradation is occurring, ultrasound will visualize degraded layers.
Thermography measurements were completed by using a climate chamber and an
infrared camera. Cryptococcus was placed into the chamber and observed to potentially
observe thermal release during microbial activity.

7
1.5 Assumptions/Limitations
There are a variety of polymers used on aircraft, each with its own very specific
purpose. The samples available for this research were somewhat limited but encompassed
a representation of damage that polymers could encounter. The polyurethane used in this
research was limited to mainly Impranil® DLN-SD, an aliphatic polyester polyurethane,
with some limited investigations performed on another polyester polyurethane film
known as Irogran. The assumption was made initially that all PU films, regardless of
thickness or dilution would produce similar results when in contact with the yeast
organism, later in the research this was proved incorrect. Additionally, the substrate to
which the PU film attaches also has a minor role in results.
Originally non-diluted Impranil was used in measurements over a course of
roughly fourteen days to monitor degradation. This proved to be too long of a trial period
because the polyurethane would degrade at a slower pace and posed additional restriction
on measurements moving forward. It was observed that diluted Impranil could result in
similar signs of degradation in the span of seven days, effectively cutting the observation
time by half. Observations of early stages of Impranil degradation were also reduced
from three days down to one. The Nano Infrared (nanoIR) spectrometry measurements
provided a wealth of critical information, but was limited by its slow speed of data
collection, and prevented its usage over an extended period of time. Parameter
optimization and data collection from a single location on the biofilm/polyurethane film
sample takes approximately an hour to complete. Data acquisition from multiple
locations on the same sample could be automated; however, it is time consuming and

8
periodic user intervention is required to initiate the data collection process. Furthermore,
due to the biofilm growth condition requirements, continuous measurement of
polyurethane degradation by nanoIR was not possible.
The limited knowledge of Impranil molecular structure also posed an additional
challenge. The chemical structure of Impranil is proprietary, making it difficult to deduce
the molecular formula and determine the enzymatic activity responsible for degradation.
There was no limitation or restriction on the amount of Impranil being used during the
research. Enzymatic and molecular degradation mechanisms were drawn from the
estimated structure of the Impranil as determined by Dr. Biffinger and colleagues [3].
Nano Infrared spectroscopy was the main modality used to conduct the
degradation research in this paper. Other modalities to help confirm IR results such as
scanning electron microscopy (SEM), thermography, atomic force microscopy (AFM)
and ultrasound were also used. The other instruments were implemented for validation
and were not fully optimized for detection of Impranil degradation. Therefore, maximum
potential of the instruments was not reached, only baseline measurements were taken.
1.6 Overview
The following chapters of this dissertation outline the theory, experimental setups,
data collection and analysis, and spectroscopy of degraded polyurethane Impranil due to
Cryptococcus laurentii. Chapter 2 begins by describing the theory for biodegradation and
the various modalities used to analyze the degradation in this research. The first section
describes biodegradation as a result of microbial populations and how they can degrade

9
polymers through enzymatic activity. The next section describes how the physical and
chemical degradation of polyurethane polymer by Cryptococcus can be detected through
different instruments, specifically infrared spectroscopy. Finally, the chapter concludes
with a reflection on maximizing parameters of the aforementioned systems and similar
research findings regarding biodegradation.
In chapter 3 the preparation of Cryptococcus cells and polymer substrates are
discussed. The first section discusses how the Impranil film was made and what impact
the different fabrication methods had on the results. The section that follows explores
how the specific fungal strains were chosen for measurements as well as the cell
quantification for consistency. All measurements for this study were performed on
Impranil films with Cryptococcus biofilm. Chapter 3 ends with the preliminary results
used as controls to properly observe substrate and cells together.
Chapter 4 describes the data collection, analysis, and results gathered during this
research. The function and setup processes of different modalities used to detect
degradation of the Impranil are discussed in this chapter. The first section details the
parameters used during operation of equipment and the analytical technique used to
manipulate the data afterwards. This is followed by an examination of each modality and
how the results confirm each other. Chapter 4 concludes with an argument to defend the
results shown in this paper.
The final chapter concludes and discusses the results outlined in the paper. This
chapter provides a summary of the research presented as well as relevant NRL & AFRL

10
data to support the findings. Discussions on the how the detection capabilities can be
integrated into inspection processes for the Air Force are also included in this chapter.
This chapter follows with possible prevention methods of growth, spreading and
attachment of harmful microbes on the aircraft. Chapter 5 concludes with final thoughts
and future work that can be applied to related work.
2.0 Theory and Background
2.1 Polyurethane (Bio) degradation
For the purpose of this research, biodegradation is defined as the weakening and
alteration of the chemical or physical structure to Impranil. Different methods will be
utilized to individually detect the potential physical or chemical weakening of the
substrate. It is expected that both of the weakening methods are not mutually exclusive;
samples should be observed to have both, if one degradation method is present.
Research into polyurethane biodegradation has been around since the mid-1960s [6], not
for evaluation of microbial damage but resistance. Strategies started to evolve on how to
measure the antimicrobial properties of polyurethane foam. First studies on polyurethane
showed little to no mass loss compared to other plastics. It is due to these high
resistances (in some forms) that are now contrarily causing research to be aimed toward
developing cleaner and faster methods to degrade polymers to clear landfills.

11
Polyurethane biodegradation in soil environments is known to be highly
dependent upon abiotic factors such as sunlight, oxygen levels, relative humidity, and soil
content. Abiotic factors are also known as environmental conditions, otherwise pertaining
to non-living chemical and physical parts of the surroundings. Previous environmental
studies consisted of burying the PU film in some soil local to the region of interest or
creating synthetic compost [12, 8]. In these situations, microbes in the experiment are
either limited to the natural soil or neglected. Laboratory based experiments rely upon
conditions that mimic outside factors as well as target and adjust different variables to
determine degradation dependencies [Table 1]. Amongst these factors, microbial activity
is sensitive to temperature. Temperatures above or below relative microbe thresholds one
will yield no activity. However, if the microbes do not have sufficient sources of
chemical nutrition, this will also discontinue activity. The carbon and nitrogen levels
seem to have less an impact on degradation relative to oxygen. Microbes have two
metabolic states, anaerobic, and aerobic, which are defined by their ability to grow in the
lack and presence of oxygen in the environment respectively. Microbe aerobic
decomposition of organic materials is known to form humus, heat, biomass, CO2, and
water [8]. Consequently, it is reported that oxygen is of critical for PU degradation.
Table 1. Laboratory conditions for PU bioavailability assay [12].
12
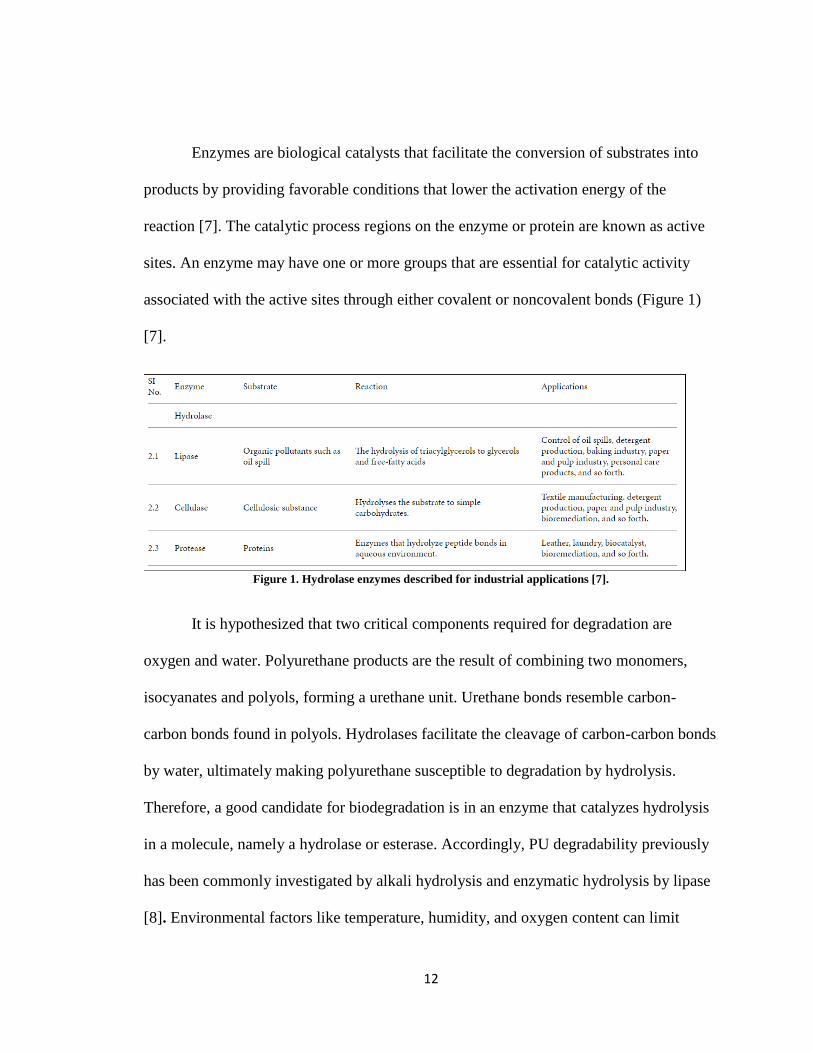
Enzymes are biological catalysts that facilitate the conversion of substrates into
products by providing favorable conditions that lower the activation energy of the
reaction [7]. The catalytic process regions on the enzyme or protein are known as active
sites. An enzyme may have one or more groups that are essential for catalytic activity
associated with the active sites through either covalent or noncovalent bonds (Figure 1)
[7].
Figure 1. Hydrolase enzymes described for industrial applications [7].
It is hypothesized that two critical components required for degradation are
oxygen and water. Polyurethane products are the result of combining two monomers,
isocyanates and polyols, forming a urethane unit. Urethane bonds resemble carbon-
carbon bonds found in polyols. Hydrolases facilitate the cleavage of carbon-carbon bonds
by water, ultimately making polyurethane susceptible to degradation by hydrolysis.
Therefore, a good candidate for biodegradation is in an enzyme that catalyzes hydrolysis
in a molecule, namely a hydrolase or esterase. Accordingly, PU degradability previously
has been commonly investigated by alkali hydrolysis and enzymatic hydrolysis by lipase
[8]. Environmental factors like temperature, humidity, and oxygen content can limit

13
metabolic processes in organisms; if key enablers of hydrolysis such as water are
disabled, there should be a direct correlation to minimal enzymatic activity. Later results
will indicate further suspicion for PU degradation by hydrolases.
2.2 Cryptococcus Fungi
The team behind this research (AFRL/RXAS) gained access to several in-service
C-130 aircraft and completed a microbial survey of 25 locations on each aircraft.
Different densities of microbial communities were found across the aircraft that survived
the operational aircraft environment. Amidst the C-130 isolates is a yeast organism called
Cryptococcus, previously reported to degrade polyurethane films and colloids. Past
experiments involving Cryptococcus show significant film deterioration in similar
environments compared to those on active aircraft [2,4], making it an ideal candidate
amongst the isolates for further experimentation.
Figure 2. Shows sorted Cryptococcus isolates as determined by sequencing regions on chromosomal DNA.
14
The extracellular enzyme system of the yeast Cryptococcus laurentii consists of a
constitutive enzyme with a molecular weight (MW) of 23 000 and a low MW cofactor
bound to it by non-covalent bonds [5]. The enzyme also has a broad pH optimum
between pH 7 and 11 and an isoelectric point of pH 7.3 [5]. It is also noted that
Cryptococcus metabolism has been recorded to go inactive at 42°C, which exceeds the
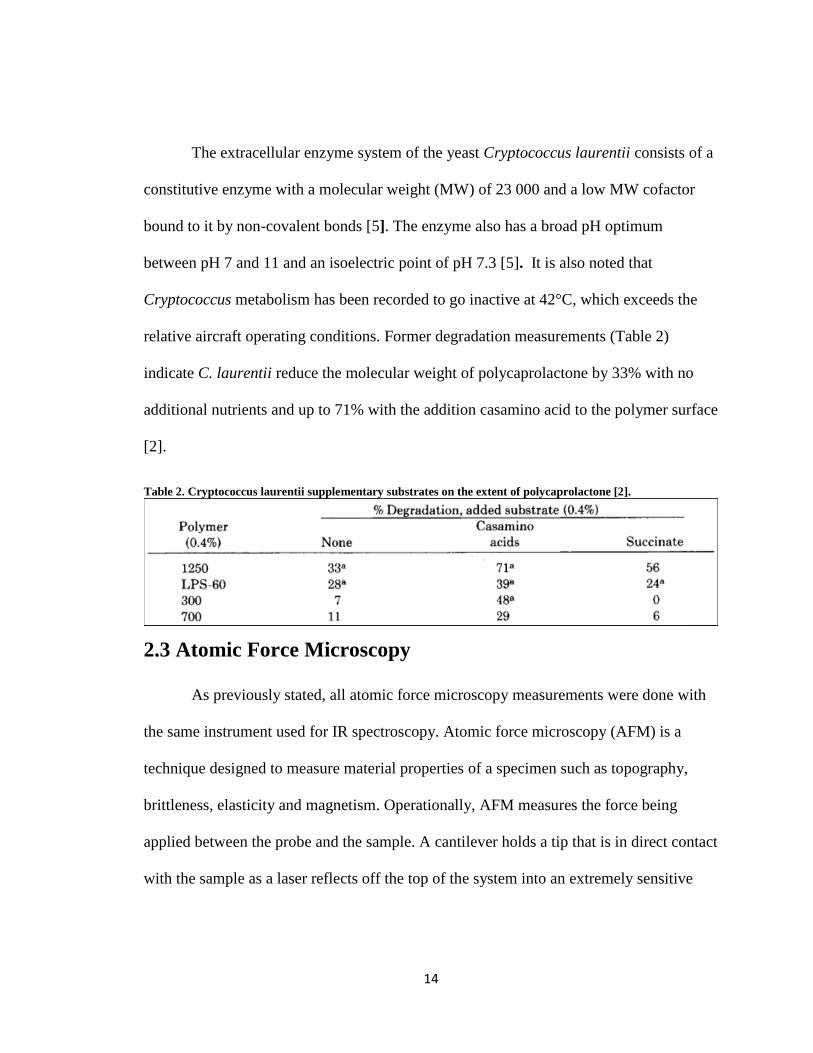
relative aircraft operating conditions. Former degradation measurements (Table 2)
indicate C. laurentii reduce the molecular weight of polycaprolactone by 33% with no
additional nutrients and up to 71% with the addition casamino acid to the polymer surface
[2].
Table 2. Cryptococcus laurentii supplementary substrates on the extent of polycaprolactone [2].
2.3 Atomic Force Microscopy
As previously stated, all atomic force microscopy measurements were done with
the same instrument used for IR spectroscopy. Atomic force microscopy (AFM) is a
technique designed to measure material properties of a specimen such as topography,
brittleness, elasticity and magnetism. Operationally, AFM measures the force being
applied between the probe and the sample. A cantilever holds a tip that is in direct contact
with the sample as a laser reflects off the top of the system into an extremely sensitive

15
position detector. As the tip moves across the sample, the deflection of the laser into the
detector results in parameters of the material.
For this paper, AFM was used to analyze the proximal area to the Cryptococcus
cells on the PU film. When the tip comes in contact over a degraded area the cantilever
lowers and the detector tracks the position. The surface can therefore be mapped
topographically using this method. If AFM topography shows lower surfaces relative to
the PU surface, it is an indication of either surface flattening, which may be indicative of
degradation.
2.4 Nano-Infrared Spectroscopy
A polymer is defined as a series of chains structurally consisting of identical
molecules. The chain of long polymers are made up of monomers. Monomers are
molecules that can be bonded to one another to form long polymer chains. Within the
polymer chains and individual molecules chemical degradation can occur. Chemical
degradation causes the molecules and representative chains to break apart, releasing
smaller molecules or atoms into the environment.
Nano Infrared (IR) spectra and AFM images were both acquired with an Anasys
nanoIR2 spectrometer. Nano-IR spectroscopy is based on the principle of standard IR
spectroscopy but with slight modification(Figure 3). A tunable IR source is emitted and
reflected off the sample directly underneath the AFM cantilever. The sample absorbs the
incoming radiation, heats up and causes thermal excitation of its molecules. As thermal
excitation occurs, oscillation occurs in the in-contact cantilever. The laser reflecting off

16
the cantilever monitors the oscillation and the relative ring down. Analyzing the ring
down via Fourier techniques yields amplitudes and frequencies of the cantilever’s
oscillations.
Figure 3. A diagram demonstrating Nano Infrared Spectroscopy (Anasys Instruments, NanoIR2 System)
Different molecules will oscillate at different frequencies when thermally excited.
Vibrations in all molecules detected in the sample are observed by the cantilever. Each
element in the periodic table has a unique Bohr structure that allows for unique orbits and
energy levels of the electrons. The vibrational energy levels of a molecule and the bonds
within are determined by the electron structure. Therefore, each element is associated
with a unique vibrational frequency and wavelength. Hence measured molecules via IR
spectroscopy exhibit a particular vibrational frequency and wavenumber or spatial
frequency.
As polyurethane biodegradation occurs, certain molecular chains are broken in the
structure of the polymer. The breaking of the molecular chains leaves atoms out of the
chain and directly affects the vibrational motion of the molecule itself. A more expressed

17
molecule in the chain will yield a higher peak amplitude due to the constructive signal
being received. If each molecule produces its own spatial frequency that is detectable, it
would be appropriate that over time of degradation, the intensities of the spatial
frequencies would dwindle as atoms are removed from the larger structure. Over time
spectra can be taken on the degraded polyurethane film and theoretically there will
significant peak loss. Analysis can be taken further by mapping peak loss to molecular
cleaving within film and then determining or predicting the type of enzyme activity that
can cause those breaks.
2.5 Keyence Confocal Microscope
One of the key instruments used in the validation of PU degradation in this
research is a 3D confocal laser scanning microscopy (CLSM). The specific CLSM
instrument used in this research is a Keyence VK-260 & VK-X250 controller, equipped
with a 408 nm violet semiconductor laser and a 0.5 nm display resolution. A laser pulse
is created and sent through a series of mirrors in the instrument. Two mirrors in particular
move so that the laser is able to scan in a raster fashion across the sample. After the laser
gets to the last location in its path, the intensity is lowered through a series of filters. The
incident light at different intensities then reflects back into the instrument and into a
photomultiplier. From here the reflected light can be analyzed with an attached computer
to determine the surface of the sample.
Similar to AFM, 3D CLSM was used to map the surface topography of
polyurethane films. Areas recessed from the surface indicate some alteration of the

18
Impranil surface and therefore degraded polyurethane. If the image resolution is known,
the actual area of the viewed sample can be determined. Therefore, surface area and
volume can be calculated of specific regions. If measurements are taken temporally,
changes in surface area and volume, in addition to difference in cell and community
structure can be tracked over the time course of experiments.
2.6 Thermography
Digital infrared thermal imaging (DITI), or thermography is a method to measure
infrared radiation of a target non-invasively. Infrared radiation is emitted by all living
organisms in the form of heat energy. A thermal camera is able to detect this energy and
create an image that can be used for data analysis and image processing. Cellular
temperatures of microorganisms are considered to be the same as the surrounding
environment they are placed in because the cellular volume is too small to maintain any
relative temperature difference [11]. However, some fungi and bacteria are known to
form biofilms across a surface, creating an isolated environment from outside conditions.
With the protection of a biofilm, it is feasible that microorganisms within the film are
able to maintain a cellular temperature different from the ambient temperature.

19
Figure 4. Thermograph example of thermal differences between Pseudomonas putida and an agar plate [11]. The
red arrows indicate detected microbial activity via thermography.
Any chemical reaction or metabolic process in a living system could create heat.
Moreover, different nutrients and environmental conditions influence the amount of
thermal energy exhausted from the system [11]. If degradation can occur on a
polyurethane film, the enzymatic process of the fungi could potentially release variable
heat into the air. A great challenge of monitoring these minute changes is obtaining a
thermal camera sensitive enough to detect the release.
2.7 Scanning Electron Microscope
A scanning electron microscope (SEM) is comparable to similar topographical
evaluation methods previously mentioned. An SEM uses a beam of electrons focused on
the surface of a sample to determine the contours of the specimen. Samples need to be
prepared in specific ways for optimization of imaging; this can include fixation and
sealing the sample off to reduce instrument contamination or maintain hydration within
the sample [10]. After the samples are prepared, they are placed into a vacuum chamber

20
where they can be observed. All microbial degradation will take place on the nano-scale
range, making SEM visualization ideal for detection. Due to the nature of the
degradation, cells on the PU film could be overlaying themselves on the possible
degradation areas, obscuring damaged surfaces. Therefore, it would be helpful to remove
the cells from the PU film to visualize areas beneath the biofilm cells.
2.8 Mass Loss
During metabolic processes, CO2 is a common byproduct released. Therefore
mass loss measurements can be aided with the help of monitoring the environment
around sample for gas fluctuations.
Figure 5. CO2 release if different isolates on Impranil PU versus a glass control [Collaboration: Biffinger]
Figure 5 demonstrates CO2 release of C. laurentii and C. albidus in reaction with
Impranil film, significantly higher CO2 levels are observed compared to the glass control.
The data presented in Figure 5 was obtained by NRL collaborators independently of
experiments described in this thesis. The samples examined were not the same as those
used for mass loss analysis. However due to similar PU film and isolate samples, it does

21
give good indication that chemical degradation is actually occurring and detectable via
gas chromatography.
3.0 Methods and Preparations
3.1 Impranil Film
Polyester polyurethane coatings are often used in layered structures to support
aircraft protection systems. To mimic degradation seen on active aircraft, a suitable PU
candidate must be chosen for lab-based experiments to closely represent real-world
polymer systems. Impranil was chosen due to its previously observed ability to be
qualitatively “cleared” by Pseudomonas bacteria [3]. Impranil was obtained in a liquid
solution and deposited onto standard 3 inch x 1 inch glass microscope slides as
supporting substrate. The liquid Impranil dries into a solid after deposition onto the
substrate. There were two main methods of deposition: drop-casting and spin-coating.
Along with the two deposition methods, six sterile water dilutions were measured for
thickness measurements (1:2, 1:5, 1:10, 1:20, 1:50, and 1:100). Different application
methods yielded different patterns and thickness variations in the sample. In some
circumstances, microscope slides would be cut to the size of 0.75 inch x 1 inch to better
physically fit diagnostic instrumentation. Accordingly, the volume deposited with either
method properly reflected the size of the supporting substrate to maintain consistent
thicknesses.

22
3.1.1 Drop-casting
Drop-casting is the process of spotting a solution onto a substrate to adhere to that
surface. Different solution properties such a viscosity, surface tension, and adhesion can
cause drop casted films to not lay completely flat. In some cases, the solution will recede
into itself causing variability in the surface thickness or lack of coverage. Therefore,
volume and dilution variations were optimized to obtain appropriate thickness for
degradation studies.
3.1.2 Spin-coating
Spin-coating is another technique used to create the Impranil film. A precision
spin coater uses a vacuum to adhere a glass substrate to a torsional platform. Glass
substrates were loaded with Impranil and placed on the machine. The instrument spins
the sample at 240 RPM for three minutes and distributes the PU evenly across the slide;
excess Impranil is spun off with centrifugal force. Spin-coating Impranil allows for even
distribution across the substrate, lending less variability within measurements.
3.2 Cryptococcus Preparation
The Cryptococcus isolates collected from the C-130 were temporarily stored at 4
°C on an agar plate. A streaking loop was used to gather the inoculum and deposit into
4.0 mL of high nutrient tryptic soy broth (TSB). The solution was incubated and at 27 °C
for 24 hours before retrieval.

23
After 24 hours, 2.0 mL of solution was centrifuged at 14,000 rpm for 4 minutes,
separating the grown cells from TSB. The remaining TSB was decanted and replaced
with sterile water. The cell cluster was pipetted up and down to dislodge and dispersed
into the fresh sterile water. The solution was once again centrifuged under the same
conditions. After the second centrifugation, the solution was decanted and replaced with
new sterile water. Cells are resuspended once more by pipetting. Cells used for all
experiments regardless of modality followed this preparation.
3.2.1 Cryptococcus Strains
Amongst the microbes found on the sampled aircraft were multiple species of
Cryptococcus. The isolates of the following species were examined in the research for
this thesis: C. laurentii, C. magnus, and C. albidus. These isolates were investigated and
compared against each other to assess differences in their ability to cause PU degradation.
3.2.2 Viable Cell Count Determination
A colony-forming unit (CFU) is a measure of viable fungal cells present in a
sample. To determine CFU, a microtiter plate dilution method was performed. A washed
Cryptococcus cell suspension was diluted 10-fold serially into sterile water. Five 10uL
drops of each cell dilution were deposited onto a TSB plate and allowed to grow for 24
hours in an incubator set at 27 °C at 99% relative humidity. If the cell count was too high,
colonies of cells merged together and became indistinguishable from one another. They
were therefore uncountable by normal means. As the cell suspensions were diluted, the
cell count dropped and cell numbers were able to be determined. The undiluted cell

24
suspension CFU was calculated by multiplying the average counted cell structures of the
lowest non-zero suspension by the inverse of the dilution ratio.
3.2.3 Photometry and Optical Density
Photometric measurements were acquired to keep cell numbers consistent
throughout the research. A 1:100 dilution of sterile water with washed cells was
measured for optical density (OD) and was used to back calculate the actual OD of the
cell suspension. Once actual OD was known, a new cell suspension was prepared for
experiment by diluting the cells with sterile water to an OD of 1.0. The viable cell count
was also determined according to the method described above (Sect. 3.2.2). The
calculated titer allows a relationship between total cell number and OD. As long as the
final OD of the inoculum suspension for experiments was equal to 1.0, the same number
of cells was spotted for each trial.
3.3.1 Laser Scanning Confocal Microscopy
Height maps created by confocal microscopy assign every pixel value. Three
measurements were taken by the LSCM instrument: volume, surface area, and cross
sectional (C.S.) area. Each measurement was taken from a reference of the Impranil film,
positioned at 0.00um. A depth value is associated with each pixel in the image. Every
value that is measured to be beneath the reference Impranil surface are summed together
to create area and volume totals. All measured volume, surface area, and c.s. area loss
measurements are obtained by the summation of the pixel values taken below the
reference point of Impranil. Smaller areas, particularly areas that might be hidden from
25
the view of the laser can hold inaccuracies. Therefore the software used to analyze
volume and area suggests and implements a rule that unique areas smaller than 10 pixels
are excluded from all numerical analysis.
3.3.2 Atomic Force Microscopy Methods
Before spectroscopy measurements can be taken, an AFM scan determines the
topography of the sample to increase nanoIR accuracy. Therefore all nanoIR
measurements were preceded with height and voltage deflection measurements via AFM.
To fit the AFM/nanoIR instrument, substrates and consequently the Impranil was cut into
fourths to better suit the equipment. Nine formal trials were performed, two out of nine
being formally completed and recorded. The remaining seven trials were unable to
complete due to topographical interference.
3.3.3 Nano-Infrared Spectroscopy Methods
Two Cryptococcus isolates were primarily used for nanoIR analysis: 5307AH
(C. laurentii) and 5307AI (C. albidus). First measurements included five isolates per trial,
but became too time consuming to manage. Nine trials were taken of each isolate, only
two trials completing the time trial of one week. Three measurements were completed in
each trial at the time intervals: Day 0, Day 3, and Day 6. Two regions, “Proximal” and
“Distal” were within each measurement. All recorded measurements were completed on a
glass substrate, however a Zinc Sulfide substrate substitute was considered.

26
To ensure maximum laser penetration into the sample, depth measurements were
completed. The dilutions previously mentioned during the Impranil fabrication process
were used due to the different thicknesses. Amplitude power differences occurred at
dilutions 1:20 and greater, suggesting that thicknesses support by smaller dilutions were
being penetrating thoroughly. Post-processing included smoothing of recorded data and
averaging of the three regional measurements per day. The average peak amplitude for
the six peaks in question were recorded over the six day trial.
3.3.4 Ultrasound
Ultrasound trials were completed by submerging 5307AH or 5307AI-colonized
Impranil film in water after allowing seven days for any degradation to occur. A 25MHz
ultrasound transducer was utilized to capture images at the resolution of about 30-50um,
within the range to observe a Cryptococcus biofilm structure. Four trials were completed
in total, only one of the trials allowed for data recording. The remaining three trials did
not have optimized parameters to result in sufficient resolution for images. Ultrasound
was reflected off the different layers of the polyurethane film; if caverns of degradation
are occurring, it should be detectable through Ultrasound measurements.
3.3.5 Thermography
Two thermography trials completed by acclimating a thermal chamber to growing
conditions and monitoring thermal signatures over seven days. The two Cryptococcus
isolated used in the two trials were 5307AH (C. laurentii) and 5307AI (C. albidus). After
growing conditions were met in the incubation chamber, two biofilms of each isolate

27
were placed into the chamber. An IR camera recorded all four biofilms over the course of
64 hours as well as a cleared Impranil spot for a negative control. The recorded pixel
intensities were then related to specific temperatures and plotted against each other. If
microbial activity was occurring, higher pixel intensity should be apparent for 5307AH.
3.3.6 Scanning Electron Microscopy
SEM images were captured by a trained technician to ensure use of appropriate
equipment parameters. Once more, the two isolates recording during SEM imaging were
5307AH (C. laurentii) and 5307AI (C. albidus). To remove cells from PU surface after
incubation for a period of time, samples were treated with sodium dodecyl sulfate (SDS).
Due to time constraints, only one trial of images was concluded.
3.4 Impranil Peaks
AFM and nanoIR are two techniques that allow for very precise quantitative
measurements. AFM can theoretically identify all the topographical peaks and valleys of
the cells and PU film with extraordinary detail. Likewise, the detail and spatial mapping
of the AFM instrument allow continued precision with nanoIR. Typical IR spectroscopy
equipment can determine wave patterns of a larger, homogenous sample, but rarely
differentiate between samples a few microns apart. Accordingly, due to the high spatial
resolution of the AFM measurement, the nanoIR experiment can determine chemical
peak differences between the Cryptococcus cells and the PU film.

28
Six identified peaks were monitored during the experiment. The peaks observed
in this experiment are represented by wavenumbers, representing a spatial frequency. Of
the six peaks, NRL and AFRL collaborators chose peak 1735 (ester + urethane) to hold
the highest amount of information. Peak 1735 is directly associated with the carbonate
(urethane) bonds of the PU film. If this peak loses amplitude, it correlates to urethane
hydrolysis destruction of bonds in the sample. In addition, if PU is being metabolized,
there should be a general amplitude decrease amongst all six monitored peaks, but the
primary focus is on the urethane peak of 1735.
Before any spectra can be acquired, a thickness correlation measurement must be
taken to ensure the system is penetrating the full sample and not the substrate underneath.
Six different dilutions of Impranil were fabricated and 500uL of each dilution was
deposited onto a glass substrate. Since the concentration of Impranil colloids differ in
different dilutions, the remaining colloids left behind after water evaporation creates
distinct film thicknesses in relation to dilution. Each dilution varies in thickness, allowing
for different thicknesses to be analyzed using spectroscopy. Each of the six dilutions is
measured using Nano-Infrared spectroscopy, recording molecule chain vibrations and
resonating frequencies.
29
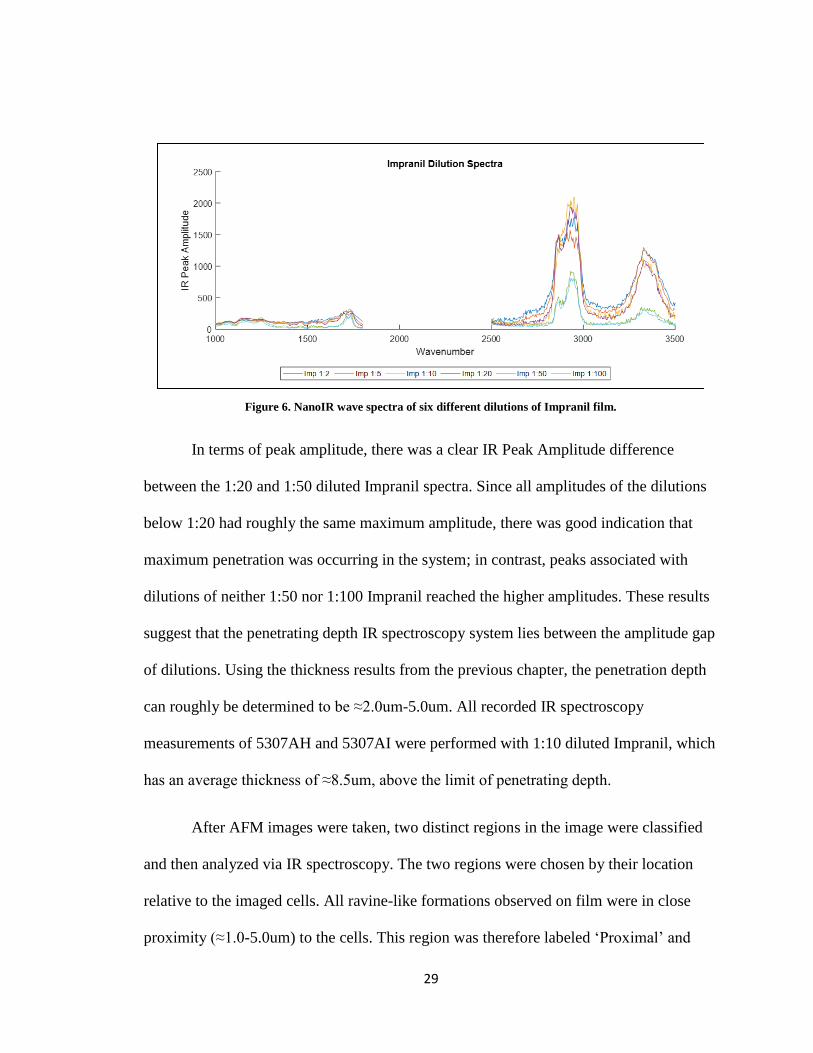
Figure 6. NanoIR wave spectra of six different dilutions of Impranil film.
In terms of peak amplitude, there was a clear IR Peak Amplitude difference
between the 1:20 and 1:50 diluted Impranil spectra. Since all amplitudes of the dilutions
below 1:20 had roughly the same maximum amplitude, there was good indication that
maximum penetration was occurring in the system; in contrast, peaks associated with
dilutions of neither 1:50 nor 1:100 Impranil reached the higher amplitudes. These results
suggest that the penetrating depth IR spectroscopy system lies between the amplitude gap
of dilutions. Using the thickness results from the previous chapter, the penetration depth
can roughly be determined to be ≈2.0um-5.0um. All recorded IR spectroscopy
measurements of 5307AH and 5307AI were performed with 1:10 diluted Impranil, which
has an average thickness of ≈8.5um, above the limit of penetrating depth.
After AFM images were taken, two distinct regions in the image were classified
and then analyzed via IR spectroscopy. The two regions were chosen by their location
relative to the imaged cells. All ravine-like formations observed on film were in close
proximity (≈1.0-5.0um) to the cells. This region was therefore labeled ‘Proximal’ and

30
was the main focus of chemical degradation measurements. Results obtained from
measuring the proximal region were compared to a region of Impranil far away from the
perimeter of the cells The ‘Distal’ region had no direct contact with any microbial
activity and consequently should have had no biotic degradation. Three measurements
were taken at each proximal and distal region for each day of the trial and their spectra
averaged.
Figure 7. The six main molecular peaks represented in Impranil spectroscopy.
The six peaks indicated in Figure 7 are noted to be signature peaks that
chemically represent Impranil. The representative wave numbers are averaged around 3
points on either side (1735±3) to ensure complete capture of peak amplitude. The main
peak focus of these measurements is 1735cm-1,
the significant urethane peak. If 1735 is
monitored to show significant decreases in amplitude that would be further evidence of
chemical degradation of PU film.
Nine different trials were started to capture wavenumber peak regression on the
exposed film, yet due to the lack of sensitivity of the equipment and the irregular
formations of the modified topography, only three trials were completed. The remaining
six trials ended prematurely due to the probe not being able to fluctuate the height ranges
needed to capture appropriate AFM images. To obtain a precise spectroscopic waveform,
an AFM image is needed to accurate guide the operator to different locations across the

31
sample. Without an AFM map, IR spectra can be acquired but it may be acquired from an
undesired location. To correct these issues and increase the validity of the measurement,
a three day experiment was attempted; the less modification the surface had the easier the
measurement was collect.
4.0 Results and Analytics
4.1 Impranil Film Thicknesses
The effectiveness of the instruments used in this research is dependent on PU film
thickness. Therefore the following experiments were designed to determine the
variability of film thickness across the substrate. Two different fabrication methods were
tested to determine how they contribute to substrate variability: drop-casting and spin-
coating. Different dilutions of Impranil were deposited onto glass substrates with
consistent volume to create the PU film and then measured. Subsequent profile
measurements were taken at six different locations across the substrate. A razor was used
to cut into the film to create trenches in various parts of the substrate. The film thickness
was determined by measuring the distance between the top of the cut film and the glass
substrate using a profilometer.

32
Figure 8. The average across six measurements of both casting methods.
The average thickness shown in Figure 8 was taken across the six positions on the
substrate. The dilution pattern appeared to be logarithmic rather than linear. Large,
homogenous clumps of the polymer substance, known as colloids, occur during the
deposition process. There were fewer Impranil colloids in the more diluted samples,
resulting in thinner films as the dilution increased. Drop-casting appeared to have slightly
higher average thickness for all dilutions in comparison. The data for both fabrication
methods of all individual dilutions was evaluated using a t-test resulted in a t-value and p-
value of 1.128 and .238, respectively. Typically p-values that are higher than .05 are not
reliable enough to determine if the data are significantly different. Therefore there is no
significant difference between the two fabrication methods; more data points in the set
will yield more accurate p-values. This difference in average thickness is most likely due
to the excess Impranil being flung off the slide during spin-coating. Average thickness
can then be coupled with thickness variability across the sample to determine which
technique is better suited for future experiments (Fig 8).

33
Figure 9. Demonstrates the six points measured across the polymer sample.
Figure 10. Thickness variation of Impranil across film locations, each color representing a different dilution.
Three measurements per fabrication method. A). Thickness measurements of the drop-casting method. B). Spin-
coating thickness measurements.
Figure 10 demonstrates the variation of film thickness across a film sample. The
six points were taking linearly across the sample, numbers 1 and 6 indicating the ends of
the sample (Fig 10). Neither method appeared to create a completely flat surface across
the substrate nor were there any relative patterns to the fabrication method across the
dilutions. It is expected that substrates made by the spin coat method would have a
lowered center and raised thickness on the outsides due to the spinning process. The
liquid in the middle of the substrate is forced to the edge during spinning, after the

34
spinning has stopped, some of the Impranil on the edge will slowly recede back into the
middle. When liquid Impranil was initially deposited onto the substrate it was smoothed
around by a pipette, so that the volume spread out evenly across the surface. It is possible
that the minute changes in initial spreading played a critical role in determining the
topographical structure of the film.
Figure 11. Average standard deviation of all dilutions across 3 trials, 6 measurements each.
Comparing the two methods, the standard deviations are the same or lower for the
spin-coating method in five out of the six dilutions. From the results, a 1:10 dilution of
Impranil created by spin casting 500uL, resulted in an average thickness of ~7.0um with
a corresponding standard deviation of ≈6.0um. Figure 11 also indicates the more diluted
an Impranil solution is, the smaller standard deviation across the PU film. Data suggests
that measurements using the spin-coating technique will yield slightly more consistent
results than its counterpart across the slides. However, the data also suggests that, both
techniques yield PU films of similar thicknesses

35
4.2 Cryptococcus Colony Forming Units and Optical Density
Further normalization tactics were executed to ensure validity and consistency
throughout the research. Optical density (OD) measurements were performed using a
spectrophotometer. Incident light emitted from the instrument gets absorbed or reflected
through a sample and the resulting incident light is calculated. The greater OD, the more
light is being obstructed during the measurement and therefore suggesting to a higher cell
density in the sample. During the incubation process, slight variances in incubation time
and nutrient resources occur; accordingly this causes for slight variance in the amount of
cell growth that has occurred over the time period. The amount of cells grown can be
indirectly measured by the use of the photospectrometer and OD measurements. If the
OD value is consistent, that means the amount of light passing through to the detector is
the same. The dilutions of the cuvettes of cells are adjusting in accordance to this value.
The OD of a batch of cells can then be related back to the colony forming unit (CFU);
hence if the cells are normalized to 1.0 OD, the CFU should stay constant per
Cryptococcus strain.
Figure 12. Different colony forming units (CFU) amounts visualized.

36
Different CFUs amount to different varying degrees of degradation. If the
coverage is too widespread, little to no degradation can occur within the structure. A low
CFU count will also yield minimal to no degradation due to the lack of coverage across
the film. The goldilocks zone in this case takes place around 1x10⁵
CFU per 10 uL spot;
where bridge-like structures create an inner web of connecting cells. This formation
maximizes the perimeter of the cells and the greatest amount of degradation can occur.
Figure 13. CFU average, three trials and five culture spots each.
Each Cryptococcus strain grows at different rates and thus will have different
CFU values after being grown for the same amount of time. The three C. laurentii strains
(5307AH, 5307AF, 5307AG) all have significantly higher CFU/ml than the C. laurentii
(19CT02) and the C. magnus (W124412) strains after 24 hours of growth. The 1.0 OD
dilution of C. laurentii strains also fall near the opportune zone of CFU levels (5.4x10⁵ -
5307AG
37
5.4x10⁴
CFU), having enough surface area to cause degradation. It is notable that the OD
& CFU relationship is not observed to be linear; any newly desired CFU/ml will need to
be measured through a corresponding OD.
4.3 Polyurethane Degradation
Over the course of a few months, different Cryptococcus strains were deposited
onto polyurethane films and observed for possible deterioration of Impranil. Both
quantitative and qualitative measurements were performed to ensure all aspects of
microbial activity were recorded and analyzed. All equipment and samples measured
used a 500uL volume of Impranil dried on a glass substrate unless specified otherwise.
Ten microliters of each Cryptococcus strains were dropped-cast onto Impranil films,
dried, and incubated at 27 °C and 99% relative humidity. Isolate preparation methods
were consistent across all experiments; however different isolates were used for different
modalities.
4.3.1 Laser Confocal Microscopy
CLSM uses laser pulses to generate a topographical map of a sample surface. The
result is a height map of the observed area relating color to depth. Each pixel can then be
correlated to height differences; summation of the observed pixels can be formulated into
surface area and volume measurements. In the following cases an Impranil standard was
determined during analysis and the height scale was measured comparatively. The higher
areas are noted in red in the images, contrarily the lower topographical structures are
generated in the blue and green hues.

38
Figure 14. 3D laser scanning microscopy demonstrates the differences between Day 1 (Left) and Day 7 (Right)
of 5307AH (C. laurentii) colonized Impranil film.
A 20x magnification aperture in the system captured the Impranil (red) and the
Cryptococcus cells highlighted in green on Day one (1). Day one in Figure 14 also shows
large, low tears through the Impranil film and cell communities represented by the dark
regions in the image. The dark regions are observable on the cells and continuing towards
the Impranil film. The comparison of the images shows clear indication of color change
between Day 1 and day 7, along with larger and deeper tears. Between Day 1 and Day 7
the minimum point observed in the image dropped by 3.89 um, suggesting activity from
the microbes or otherwise caused lowering of the Impranil. All crevasses increased in
depth and in width after the experimental period. Other C. laurentii isolates such as
5307AG and 5307AF showed similar visual evidence of degradation via partial confocal
height maps. After multiple partial images are captured, height maps are extended to full
cell droplets for further analysis.

39
Figure 15. Full cell height map image comparison between the start and end of the seven day trial. 5307AH is
pictured on the top row, Day 1 (A) and Day 7 (B). 5307AI is pictured on the bottom, Day 1 (C) and Day 7 (D).
Images of the completed inoculum were captured to fully visualize topographical
height differences in the seven day period as well as amongst different isolates. The full
5307AH Day 7 image looks drastically different from the starting Day 1 image. The
initial image shows above-Impranil zones highlighted in red where the cells had not yet
begun to sink into the film. Within the droplet ring, awkward undulations in the Impranil
substrate are visible due to the fabrication process. The image of cells after 7 days
incubation, shows the outside ring and the miniature cell structures which have sunk into
the Impranil film, most notably demonstrated by the large clump of cells that are deeper
40
than the Impranil surface. Large red clumps of cells and possible debris or foreign
microbes formed after the incubation period as evidence by the large red clumps in
Figure 15B.
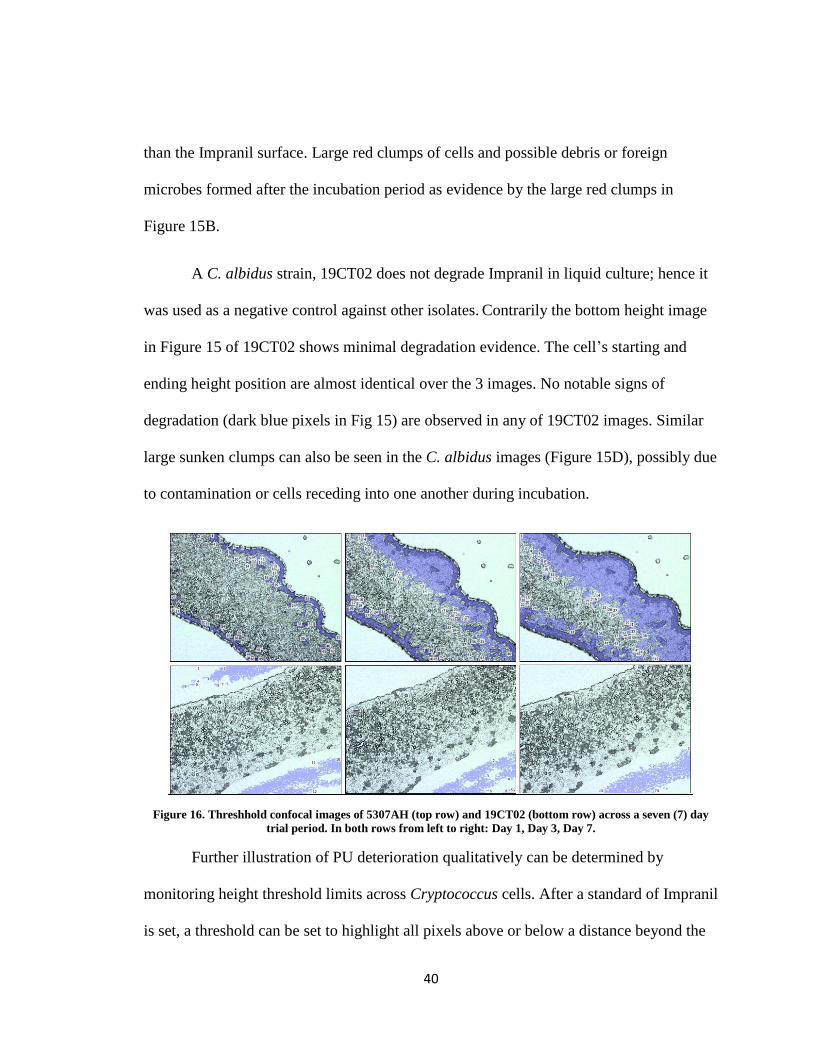
A C. albidus strain, 19CT02 does not degrade Impranil in liquid culture; hence it
was used as a negative control against other isolates. Contrarily the bottom height image
in Figure 15 of 19CT02 shows minimal degradation evidence. The cell’s starting and
ending height position are almost identical over the 3 images. No notable signs of
degradation (dark blue pixels in Fig 15) are observed in any of 19CT02 images. Similar
large sunken clumps can also be seen in the C. albidus images (Figure 15D), possibly due
to contamination or cells receding into one another during incubation.
Figure 16. Threshhold confocal images of 5307AH (top row) and 19CT02 (bottom row) across a seven (7) day
trial period. In both rows from left to right: Day 1, Day 3, Day 7.
Further illustration of PU deterioration qualitatively can be determined by
monitoring height threshold limits across Cryptococcus cells. After a standard of Impranil
is set, a threshold can be set to highlight all pixels above or below a distance beyond the

41
standard. The above images in Figure 16 are under a threshold of -1.0um compared the
Impranil which is taken to be at 0 um; all pixels with a value under -1.0um highlight
purple over the image. Over the course of the experiment it was observed that more
pixels fall under the set threshold for C. laurentii strains compared to C. albidus, in
concordance with previous height measurements. Initially the proximal area around the
cells fell below threshold; the cells themselves then followed suit. Figure 16 also
demonstrates 19CT02 (C. albidus); little change occurred once more. Measuring the
height differences over time can also lead to quantitative representation of degradation
due to the Cryptococcus isolates.
Figure 17. Shows all three classified structures of Cryptococcus cells (Perimeter, Bridge, and Island).
42
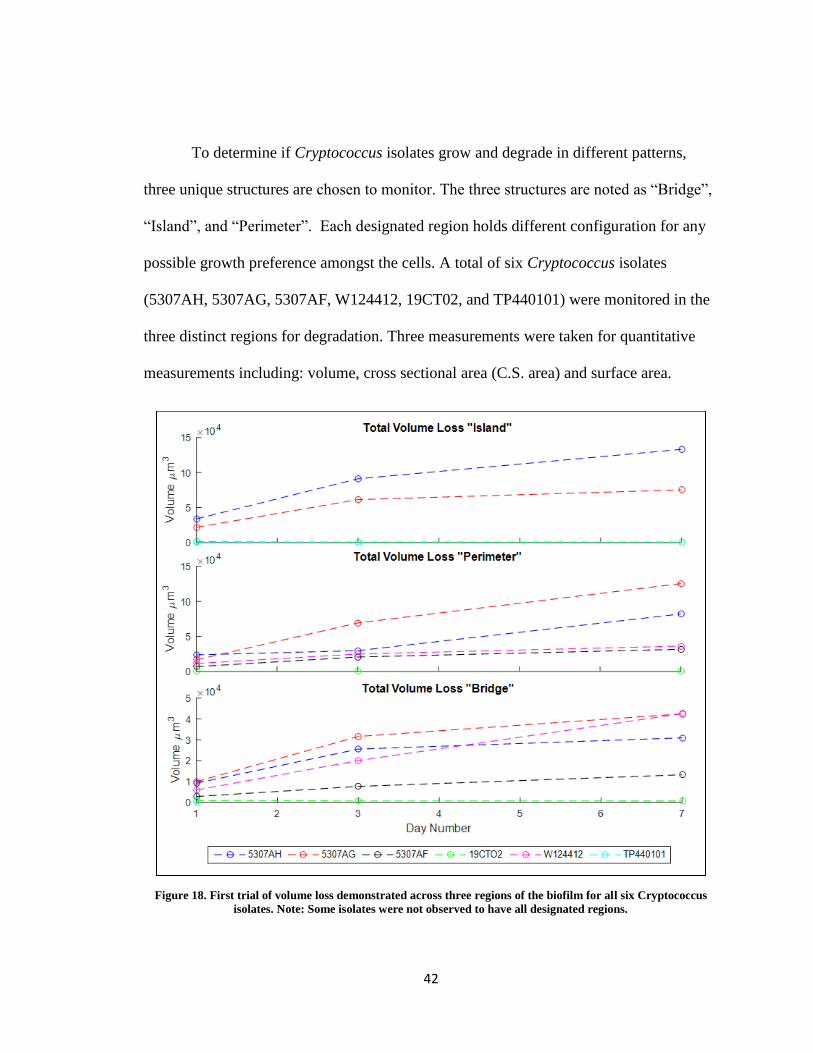
To determine if Cryptococcus isolates grow and degrade in different patterns,
three unique structures are chosen to monitor. The three structures are noted as “Bridge”,
“Island”, and “Perimeter”. Each designated region holds different configuration for any
possible growth preference amongst the cells. A total of six Cryptococcus isolates
(5307AH, 5307AG, 5307AF, W124412, 19CT02, and TP440101) were monitored in the
three distinct regions for degradation. Three measurements were taken for quantitative
measurements including: volume, cross sectional area (C.S. area) and surface area.
Figure 18. First trial of volume loss demonstrated across three regions of the biofilm for all six Cryptococcus
isolates. Note: Some isolates were not observed to have all designated regions.

43
In Figure 18, all strains other than 19CT02 and TP440101 showed an increase in
volume loss in comparison to the set threshold. The two C. laurentii samples of 5306AH
and 5307AG had the highest average volume loss regardless of region. The Island and
Perimeter regions were recorded to have a significantly larger volume loss than the
remaining Bridge zone; this is due to the difference in captured surface area of the cells.
The more cells that are captured in the initial image, the greater allowance for
degradation to take place on the sample and therefore potential volume loss. To correct
this, relative quantitative measures to the original images are calculated.
Figure 19. All six Cryptococcus Isolates and the average measured Volume, Cross Sectional Area, and Surface
Area across three (3) seven day trials.
All C. laurentii strains have a large (+200%) increase in all metrics. From the
single C. magnus measured, it would appear it is slightly less active than its C.laurentii
relatives. C. albidus not only has no observed degradation features but consistently show
negative development under the threshold, lending itself towards vertical growth above
the film. In four out of the five positively reviewed samples, there is a higher cross
44
sectional area increase compared to surface area. This means that more area growth
appeared laterally across the surface rather than within the tears of the Impranil.
It is noted that the recorded quantitative measurement of partial images of a
Cryptococcus biofilm are highly subjective to the initial framing of the cells in images.
Due to the subjective nature of the measurement, relative percentage fluctuations should
hold more weight than that of the actual increase. Further analysis can be conducted by
observing whole biofilm degradation; even then, comparative volume amounts would
need to be strictly monitored. Due to biofilm and time limitations, a single whole film
biofilm measurement was completed to assess viability of the measurement.
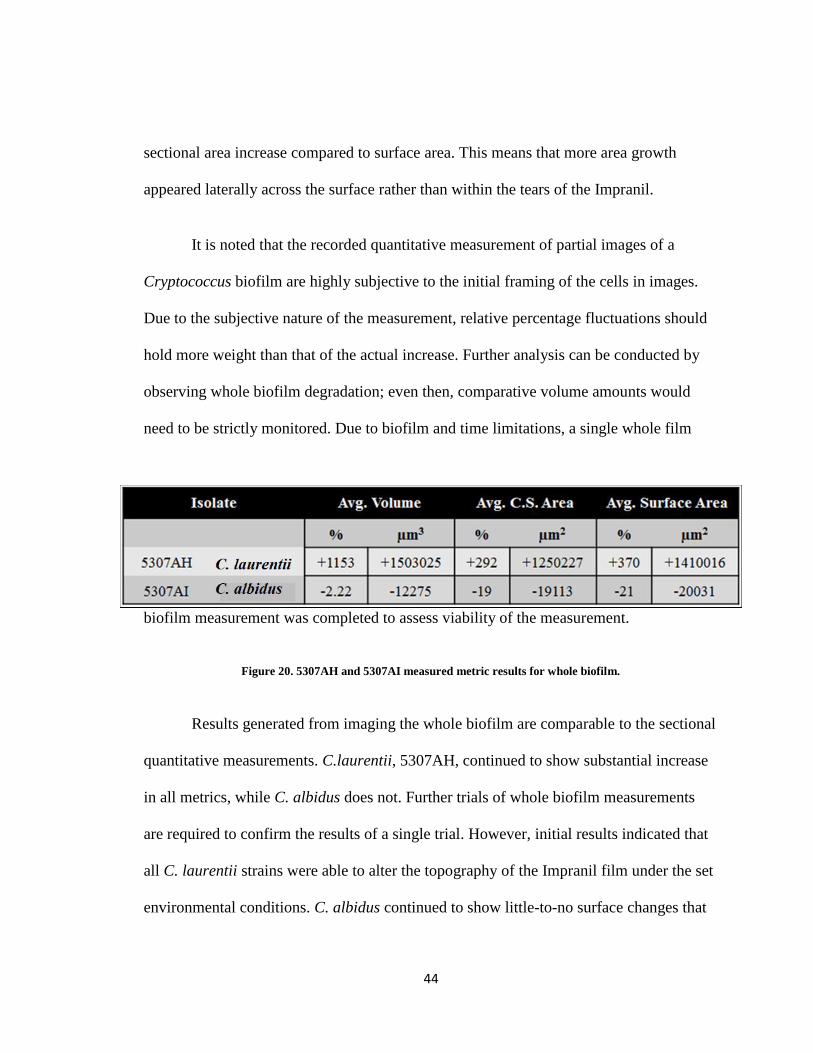
Figure 20. 5307AH and 5307AI measured metric results for whole biofilm.
Results generated from imaging the whole biofilm are comparable to the sectional
quantitative measurements. C.laurentii, 5307AH, continued to show substantial increase
in all metrics, while C. albidus does not. Further trials of whole biofilm measurements
are required to confirm the results of a single trial. However, initial results indicated that
all C. laurentii strains were able to alter the topography of the Impranil film under the set
environmental conditions. C. albidus continued to show little-to-no surface changes that

45
might indicate deterioration. However, in spite of physical results, it is possible that C.
albidus strains are able to chemically alter the host film.
4.3.2 AFM/Nano IR
During microbial enzymatic activity bonds in the nutrient resource that is being
consumed are molecularly broken, typically dividing larger molecules (polymers) into a
group of smaller molecules (monomers). This molecular division of molecules can be
quantized using spectroscopy techniques, by monitoring specific molecular peaks for
their increase or decay. Similar to the confocal microscopy measurements, glass
substrates were coated with 500uL of liquid Impranil and allowed adequate time to
completely dry. Ten microliter drops of the six Cryptococcus isolates (5307AH, 5307AG,
5307AF, W124412, 19CT02, and TP440101) were deposited onto the film and incubated
under the previous conditions. 5307AH (C. laurentii) has been shown previously to be
one of the more active strains while 5307AI (C. albidus) typically shows minimal to no
degradation in the same time frame. Therefore any polymer degradation should be readily
apparent on the C. laurentii samples, whereas 5307AI serves to be a negative control.

46
Figure 21. Atomic force microscopy (AFM) height and voltage deflection images of C. laurentii (5307AH)
from Day 0 (top) to Day 7 (bottom).
Figure 21 demonstrates height map and voltage deflection images. The height
map images are constructed by having the cantilever move across the sample and the
coupled laser moving as the cantilever moves up and down. Voltage deflection images
are created in a similar fashion; a corresponding unit of voltage is paired to the deflection
of the laser, that voltage is then recorded and plotted as the cantilever moves. Both
techniques are able to obtain valuable visual information. AFM images of 5307AH over
time show cell proximal depreciation, especially around days three and seven. The first
image in Figure 21 was captured at Day 0 due to the rapid change of Impranil when in
contact with C. laurentii. Looking carefully at the height images, the cells initially started
out above the PU film, emphasized by the Impranil being blue and the cells at a higher
red hue. As the experiment progressed the color schemes and heights switch between the
film and the cells. By Day 3 5307AH lowered into the Impranil and a series of ravines
appeared alongside. The deflection images illustrate the contour to the tear of the PU

47
film. Evidence of deep trenches alongside the microbes is embellished in the day 3
images where the proximal degradation area appears to smooth downward on a slope.
Figure 22. Atomic force microscopy (AFM) height and voltage deflection images of C. albidus (5307AI)
from Day 1 (top) to Day 7 (bottom).
At Day 0 5307AI closely resembles its C. laurentii relative. The cells are
topographically about 1.5um above the film. In contrast to C. laurentii, 5307AI did not
lower into the film nor did tears start to form. Further evidence of surface area reduction
is that the height map scale increased between the two structures; the cells in the
unfavorable outside position have moved towards the inner culture and therefore
increased the height difference. Even though Impranil inoculated with C. albidus showed
no sign of physical modification, the adjacent Impranil area may stay be undergoing
chemical degradation.

48
Figure 23. Exhibition of proximal and distal regions on AFM images.
Figure 24. 5307AH waveform of proximal and distal regions across a six day trial.
The latter half of this chapter will discuss “proximal” and “distal” regions on the
film. As seen in Figure 23, “proximal” refers to the area directly near the cells in the
AFM image; conversely, “distal” refers to the measurements taken far away from the
cells. Figure 24 shows IR spectroscopy trial 3 across a one week period, starting at day 0.
Day 0 showed a common pattern amongst all waveforms and isolates; the region
proximal to cells demonstrated higher average amplitude across all six peaks versus distal
regions. A possible explanation is that there wasn’t enough time between measurement
and deposition for any degradation to occur regardless of sample. Day 4 and Day 6 of
5307AH showed significant drops in six peak amplitudes in the proximal region, while
the distal region remained unchanged. Results suggest that Impranil was degraded in

49
regions proximal to cells. Degradation of the Impranil PU likely occurs via secreted
enzymes from the organism but could also be due to hydration and hydrolysis.
Furthermore, results indicate that any microbial activity appeared to not be able to expand
+15um away from the perimeter of the colony. Proximal tearing of Impranil film
expanded to distal regions, though the initial chemical degradation took place
immediately adjacent to cells.
Figure 25. Distal peak changes across both trials for 5307AH and 5307AI, difference taken between Day 0 and
Day 7.
Upon examination of the relative percentage change of all six peaks, it is clear
that increases or no change at all of the peaks were observed regardless of Cryptococcus
isolate. This follows predictions because the distal regions were presumably not within

50
enzymatic range of the cells, therefore it should not have shown any signs of decreasing
amplitude. Noise contribution is a possible factor in the increase of the peaks. It is
notable that the peak 2864 was irregular in all experiments conducted and among all
isolates. Peak 2864 shares a similar molecular assignment to its higher amplitude
neighbor peak 2938. The average amplitude difference between the two neighbors and
that peak 2864 lies on a steep shoulder and caused it to be widely inconsistent across
measurements.
Figure 26. Proximal peak changes across both trials for 5307AH and 5307AI.

51
Furthermore, measurements of the proximal regions near the isolates further
confirmed previous estimations. Peaks measured near 5307AH proximal regions showed
substantial decreases in peak amplitude in both trials. The decrease further supports
degradation of the bonds; the molecules being separated were not resonating together
anymore and therefore were not being detected during IR spectroscopy analysis.
Conversely, 5307AI in proximal regions demonstrated minimal degradation or changes
amongst peaks. This information supports that 5307AI may possess having possible PU
degradation activity, but it may manifest itself along a greater time trial than measured.
4.3.4 Scanning Electron Microscopy
Previous experiments performed by collaborators in AFRL showed SEM to be an
effective tool for capturing detailed images of cell structures in the biofilm and the
topography underneath the cells, making it a prime candidate for further exploration.
SEM has the disadvantage that it detects morphology within structures like x-ray
computed tomography or ultrasound; to use the high resolution equipment effectively, the
cells need to be removed from the sample to observe the potential degradation evidence
underneath. If degradation is occurring due to Cryptococcus, PU breakage should be
occurring underneath the cells, and removal of the cells via cell lysis should be an
effective method to observe the film under SEM.
Scanning electron microscopy can acquire higher resolution images of microbes
on PU films compared to 3D scanning laser microscopy and AFM described above. To
reveal the conditions of PU film due to Cryptococcus degradation, SEM images of the

52
samples were captured (Figure 27). A single 10 uL drop of 5307AH and 5307AI were
deposited onto Impranil film and allowed to incubate at previous environmental
conditions of 27 °C and 99% relative humidity for 48 hours. Both strains were observed
under a microscope and 5307AH was confirmed to have demonstrated Impranil tearing
and degradation around the cells; There was no indication of visual detections of any
Impranil deterioration or failure by SEM microscopy due to the presence of a 5307AI
biofilm.
Figure 27. SEM images of Cryptococcus on Impranil. A). 5307AI (C. albidus), showing minimal Impranil
lowering. B). 5307AH (C .laurentii) showing large tears across the polyurethane film.
Both images were taken with the same parameters except a minute difference in
magnification. The SEM images of 5307AI showed no PU tearing throughout the cell
structure in contrast to 5307AH. A familiar halo-structure formed around 5307AI.
Impranil in the halo was slightly lowered topographically relative to the surrounding film.
It is hypothesized that the halo effect is caused by the retreat of 5307AI across the film or
possible water evaporation around the cells. The differences in cell shading gives the
illusion of the C. laurentii cells protruding further than C. albidus, however the contrary
is true. Under confocal microscopy review, 5307AH is lower in comparison to 5307AI.

53
Degradation does not occur only on the surface of the film adjacent to cells.
Chemical and physical degradation can also occur underneath the cells, leaving voids
inside the PU. All imaging modalities employed so far only allow visualization of
surfaces, including the upper-most layer of cells. If the cells can be removed without
creating physical damage to the film, degradation patterns underneath the cells can be
further analyzed. Therefore, samples were treated with sodium dodecyl sulfate (SDS), a
detergent, to break the cell membrane or dislodge cells from the PU surface.
Figure 28. 5307AH cells after the cell lysis process with 1% SDS.
Although 1% SDS is sufficient to lyse Gram-negative bacteria, it appears to have
minimal effect on removing the 5307AH cells from the PU film. A different approach
other than cell lysis must be taken to completely disrupt the biofilm and capture the
Impranil formation underneath. It is possible that the adhesion between the cells and the
PU is too great for SDS to adequately disrupt them.

54
4.3.5 Ultrasound
Ultrasonic waves are often used to detect and analyze 3D microstructures inside
aircraft materials. This advantage is why the ultrasound modality is employed in this
research as a degradation detection method. If degradation is occurring within PU and
underneath the biofilm, ultrasound could be an optimal method of detection without
having to remove or destroy the cells in the process. Ultrasound also has the advantage of
already being a non-destructive evaluation technique for aircraft inspection. If ultrasound
can prove to be an efficient detection method, incorporating the process into technical
inspections would be minimal.
A 25MHz ultrasound transducer can generate a resolution of about 30-50um,
within the range to observe a Cryptococcus biofilm structure. For the ultrasound
transducer to generate the image, the Impranil film must be submerged in water. Housing
the film underwater causes the film to detach from the glass substrate and recede into
itself. Therefore, there is a very strict time limit on viable ultrasound measurements when
observing Impranil film; typically measurements need to be completed within an hour of
initial submersion.
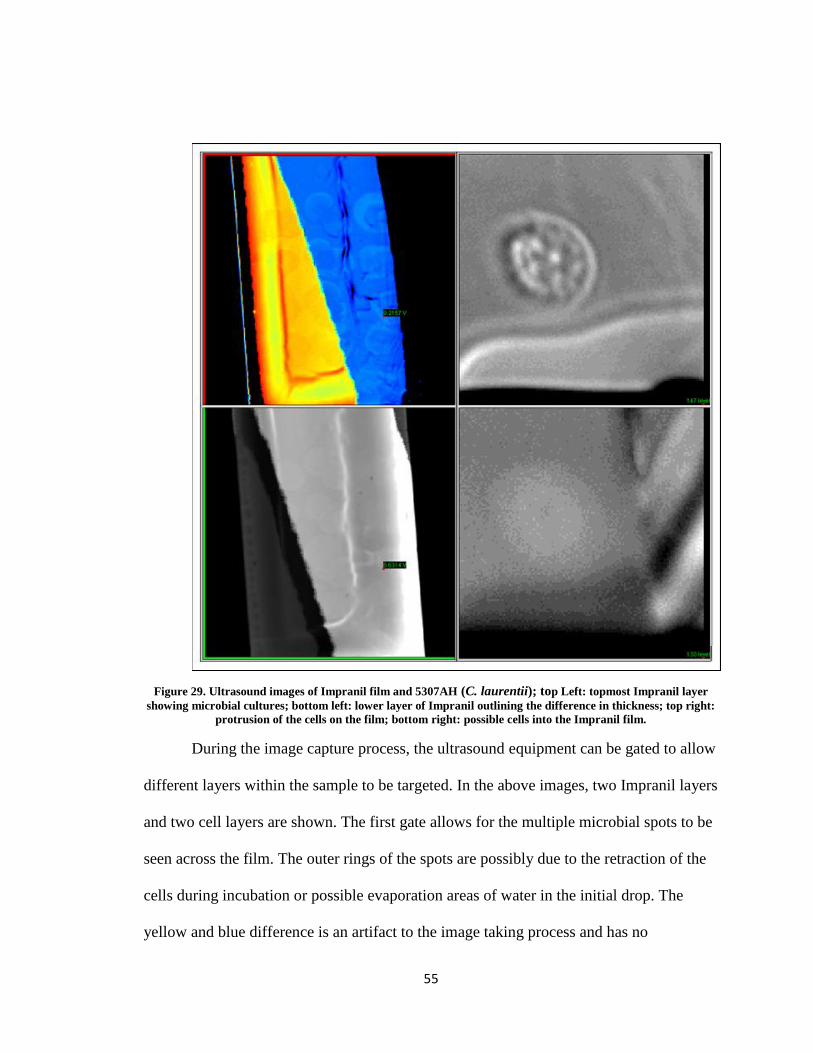
55
Figure 29. Ultrasound images of Impranil film and 5307AH (C. laurentii); top Left: topmost Impranil layer
showing microbial cultures; bottom left: lower layer of Impranil outlining the difference in thickness; top right:
protrusion of the cells on the film; bottom right: possible cells into the Impranil film.
During the image capture process, the ultrasound equipment can be gated to allow
different layers within the sample to be targeted. In the above images, two Impranil layers
and two cell layers are shown. The first gate allows for the multiple microbial spots to be
seen across the film. The outer rings of the spots are possibly due to the retraction of the
cells during incubation or possible evaporation areas of water in the initial drop. The
yellow and blue difference is an artifact to the image taking process and has no
56
meaningful value in the measurement. Both slide images observe an inner ring being
designated apart from the outer Impranil ring. The above slide was fabricated using the
drop cast method, lending the observed rings to be a possible topographical side-effect of
the used method.
The two images captured on the right in Figure 29 are of one of the biofilms
deposited on the Impranil film. The resolution of the cell isn’t as high as expected,
however the cell was visible. Within the biofilm, cell structures and large cell clumps
were observable. Unfortunately amongst the cells, any sort of degradation was not
detectable by means of ultrasound due to the resolution. The lower right image displays
concentric circles within the film below the cells. It is possible that this indicates large
degradation on a lower surface layer; however the lack of resolution makes this feature
inconclusive. If parameterized properly, ultrasound should be able to detect what is
occurring underneath the cells, but not of the detail presented by other modalities.
There were some difficulties being able to capture an image of the biofilm using
ultrasound that do not make it suitable for biodegradation detection. After submerging the
film in the water bath for ultrasound measurements, the film slowly started to separate
from the glass substrate. On average the film became completely detached from the
substrate after 40 minutes submerged. Metal clamps and adhesive tape were used to
restrain the film, extending the submerged time frame but ultimately were not effective
enough to permanently adhere the film to the surface. Different ultrasound equipment can
be utilized that do not require the sample to be underwater for accurate measurements.
The 25MHz transducer used in the experiment did not permit high enough resolution to

57
accurately image the biofilm and the detail within. Other 3D imaging techniques should
be employed to correctly capture the model of the film and organism.
The height irregularities in the degraded regions of the Impranil film caused the
AFM probe to stick or jump across the surface, resulting in smeared and faulty images.
Unfortunately the accuracy of the IR spectroscopy analysis is determined by the initial
AFM image, making some IR measurements inconclusive or impossible to measure. To
ensure validity and viability of the experiment, Impranil degradation measurements by
AFM-IR may be better performed perform better in early stages of film failure or with a
more durable system.
4.3.6 Mass Loss
PU film mass loss should be observable due to the conservation of mass. If
metabolic processes are taking place in the biofilm and the nutrients are not from the
surrounding gas environment, mass loss of the film is necessary. Detecting any negative
trend in mass for the film reinforces previous nanoIR and surface area & volume results.
If the film is being degraded by Cryptococcus, very minute changes in the overall mass of
the film should be detectable.
Glass microscope slides are cut into sections of 0.75 inch x 1 inch. Each piece
was coated with 125 uL of Impranil. Four Cryptococcus strains, 5307AH (C. laurentii),
5307AI (C. albidus), W124412 (C. magnus), and TP440101 (C. laurentii), are placed on
separate pieces and measured for mass loss over the course of a week. The first trial

58
included depositing a single 10 uL drop of 1.0 OD, the second trial tries to maximize the
number of cells available on the surface by increasing the numbers of inoculum spots.
Figure 30. Example of mass samples of 5307AH (C. laurentii) for two trials, varying in number of spots.
The first trial measured a single 10 uL drop of each Cryptococcus strain on a 1:10
diluted Impranil polyurethane film. First measurements were made of just the Impranil
without any microbes on the surface to determine if the placement had any detectable
impact on mass gain. Afterwards, each biological sample was weighed after the sample
had dried but not yet caused degradation. The final measurements were at three (3) and
seven (7) days after initial deposition on the slide, where each sample was incubated at 27
°C and 99% relative humidity.
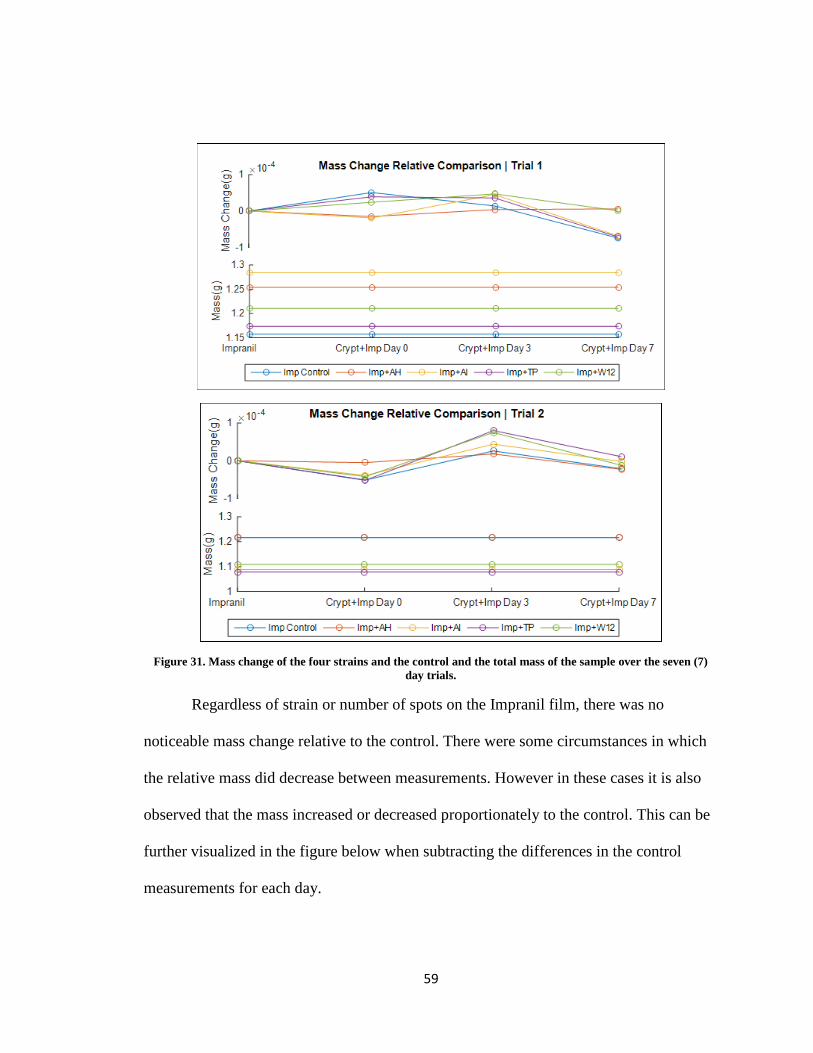
59
Figure 31. Mass change of the four strains and the control and the total mass of the sample over the seven (7)
day trials.
Regardless of strain or number of spots on the Impranil film, there was no
noticeable mass change relative to the control. There were some circumstances in which
the relative mass did decrease between measurements. However in these cases it is also
observed that the mass increased or decreased proportionately to the control. This can be
further visualized in the figure below when subtracting the differences in the control
measurements for each day.

60
Figure 32. Change in relative mass of the observed strains after the differences in the control sample were
subtracted out.
The only indication of any degradation through monitoring mass loss is in trial 2
when observing 5307AH between Day 0 and Day 3. 5307AH has the highest probability
of mass loss due to deterioration and during those three days had a significant decrease in
mass while all other strains did not change or increase. Unfortunately, the increase in
mass of 5307AH biofilms on Impranil by Day 7, invalidates the result. Visual inspection
by optical microscopy, demonstrated all strains other than 5307AI showed moderate to
severe signs of Impranil cracking and tearing.
This method of detection may not have worked due to the balance being used.
Changes in the mass, if Cryptococcus is metabolizing, would most likely occur on the
nanogram balance. This can be counteracted by increasing the number of droplets on a
slide significantly until the mass loss is closer to the range of the balance; increasing the

61
number of droplets to 8 had no observable effect. Alternatively there may have been no
mass loss occurring in the samples. It is possible that Cryptococcus is surviving and
degrading without changing the mass of the substrate film. This is the unlikely case as it
directly contradicts nanoIR and laser confocal results.
4.3.7 Thermography
Most metabolic processes in organisms release energy into their environment in
the form of heat. Previous IR results indicated there was chemical degradation occurring
in the sample film. Hence, Cryptococcus under the right environmental conditions should
release heat during metabolism. IR thermal cameras are suitably equipped with sensors
that can detect small changes of heat in the environment. If Cryptococcus is metabolizing
the PU film it sits on, an IR camera should be able to detect the heat exchange.
An incubator set at 27 °C and 99% relative humidity was allowed 24 hours to
acclimate to the conditions. A single large tub is filled with water to help increase the
humidity with the chamber. A small IR thermal camera was positioned in front of the
housing plate and substrate. The camera was then connected via micro-USB to a
computer running the software outside the chamber for visualization and data processing.
A separate logging device was placed in the incubator to correctly monitor the relative
temperature and humidity.
The first trial housed single 5307AH and 5307AI cultures to observe potential
degradation. Humidity for the first trial reached a maximum of 72% relative humidity,
often fluctuating between 60-70%. At these humidity levels, there were no signs of

62
Cryptococcus degradation. Under optical microscopy, no signs of microbial activity or
degradation were observed.
We next sought to increase the relative humidity within the chamber, to increase
the likelihood of degradation. Additional petri dishes full of water were placed into the
chamber and the humidity was monitored. Increases the amount of water content in the
chamber should cause a large increase in relative humidity. The incubator was allowed 24
hours to adapt to the new environment. A second humidity tracker was placed into the
system for reassurance.
Between the two humidity logging devices, the maximum RH level reached was
92% with the increased water content. At the time of observation, humidity level was
observed at 85%, suggesting continuing fluctuations in humidity once more.
Cryptococcus is known to degrade optimally at the set parameters of 99% RH and 27 °C,
so the chamber was still 7% away from optimal environmental conditions. Another
experiment was set up to determine if 92% RH is enough to allow for enzymatic activity.
Figure 33. A). The initial IR image at hour (0) of trial 2, the large circular object is the petri dish holding the
rectangular object (substrate) in place. B). The observed pixel boxes of the glass substrate to determine relative
temperature.

63
Trial two used four total Cryptococcus inocula. Two 5307AH (C. laurentii) and
two 5307AI (C. albidus) spots on the substrate were monitored for change in relative
temperature and thermal exhaustion. The incubator was allowed 24 hours to acclimate to
the set parameters once again. 5307AI degradation was not confirmed via optical
microscopy during this experiment, hence it was used as a negative control. Pixel
intensity captured on the IR thermal camera has a relationship to temperature. When the
pixel intensity increases compared to control pixels, the temperature is rising in that area.
Figure 34. Relative temperature of Cryptococcus strains over 64 hours.
The temperature of the glass substrate control fluctuates in a similar fashion
compared to all four monitored Cryptococcus strains. Upon further analysis, 5307AH did
have minimal degradation occur after the 64 hour trial period, whereas 5307AI did not.
Previous observations of 5307AH under the same conditions have yielded moderate
degradative activity within the first 48 hours.
Due to the minor degradation occurring at the end of the 64 hour trial period for
5307AH (C. laurentii), thermal exhaustion should be taking place. It is possible that the

64
degradation occurred over such a long time span that the release of heat was too small to
be detected. Another possibility is that the hardware inside the camera does not run at a
high enough resolution to detect micron sized changes in heat. In addition, the climate
chamber used was not able to consistently maintain a constant temperature/humidity nor
produce reliable degradation of the PU. A non-fluctuating climate chamber and a
detection method that is better suited for microbial monitoring would be needed to get
definitive results of thermal release.
5.0 Discussion & Conclusions
The first question looked at in this research was which assembly method was
more consistent for Impranil thickness. Both methods resulted in similar average
thicknesses for each of the six dilutions, along with similar variations across the film. The
spin-coat method has a slightly lower standard deviation for the 1:10 diluted Impranil,
making it the fabrication method of choice. Preventative measures such as measuring the
thickness of the film in the spectroscopy area of interest would be of great benefit.
Topographical measurements were utilized to see if degradation evidence can be
observed through measuring volume and surface area of the biofilm. AFM and LSCM
both demonstrated Impranil alteration via their respective techniques. Physical tearing
and lowering of the film was determined to be physical signs of degradation and under
LSCM results in significant volume and surface area loss underneath the Impranil point
of reference. Changes in the chemical bonds of the Impranil film were monitored through
IR spectroscopy. Significant peak loss of 5307AH (C. laurentii) compared to the control

65
of 5307AI (C. albidus) is strong evidence towards molecular cleaving of the film. Further
evidence of cell biodegradation is the comparison between the proximal and distal
regions. The proximal region near the cells shows significantly more peak loss than its
distal counterpart away from the cells.
Other modalities were used in this research to indicate whether or not they have
the ability to detect biodegradation and to see if it’s possible to incorporate the technique
into active-runway inspections. LSCM, SEM and AFM are too sensitive of instruments
that are dependent upon having a stable environment to accurately measure the biofilm.
Accordingly, LSCM, SEM, and AFM instruments are not able to be integrated into the
inspection process at their current state. Infrared and Ultrasound techniques are
incorporated in active inspections already and both have shown positive evidence
towards detecting biodegradation. Thermography uses similar Infrared techniques to
visualize IR radiation. Although thermography measurements were not positively
reinforced in this paper, handheld IR equipment have been shown to detect
microorganisms via IR. Since similar IR techniques are already in the inspection process,
incorporating thermography into the inspection routine would be minimal effort.
5.1 Impranil Deposition
Additionally, all profile thickness measurements taken in this paper were done in
the lateral center of the substrate. No data were collected from near-edge locations on the
substrate; area measurements across the entire substrate would help improve the
topographical irregularity problem. Drop casting and spin casting were not consistent

66
enough across glass substrates for reliability in measurements. Spreading of the liquid
across the substrate for either method seemed to largely dictate the final pattern. A new
fabrication technique or slight changes to previous methods would help produce
dependable results without having to double check before each test. Different spin
instrument parameters such as RPM and spin time were changed to determine optimal
coating, yet thickness inconsistencies were still present.
5.2 Cryptococcus CFU and Optical Density
Originally, optical density calculations were resulting in OD values of about 75%
of the predicted value. After further analysis it was determined that test dilutions of cell
cultures below 1:50 were being read inaccurately by the spectrophotometer. Higher
dilutions of cell cultures were needed to accurately calculate the volumetric ratio of 1.0
OD sample. Additionally, non-sterile vials also attributed to minor inaccuracies in early
measurements, but have been resolved since. As previously stated, the relationship
between viable CFU titer to optical density does not appear to be a linear relationship;
any newly desired OD can be calculated in a similar fashion to the technique used in this
research.
In the stated research, a consistent CFU value was kept through all experiments.
Too high of a CFU value resulted in mostly single Cryptococcus cells on Impranil films
and therefore make it difficult to determine small scale degradation. The CFU value used
in the research was kept similar by keeping a constant deposited volume of Cryptococcus
isolate; supplementary data is needed to observe a quantitative or qualitative relationship

67
between CFU and volume deposited. Further investigation to see if CFU has a linear
relationship with volumetric deterioration could result in helpful metrics moving forward.
Similarly, future measurements should include single cell degradation to determine if a
large cell culture biofilm is required for enzymatic activity.
5.3 Keyence Confocal Microscopy
Disabling the rule will cause all numbers to rise; however, the ratios of increases
and decreases are roughly the same. Moreover, measurements that encompass the entire
biofilm would greatly help to determine the growth and degradation patterns of a given
isolate. If the surface area of a partial and full biofilm image is known, a rough estimation
of surface area to degradation could be determined per isolate.
5.4 Thermography
The observed pixel intensity of the four Cryptococcus inocula showed no great
difference in temperature compared to the control over a 64 hour trial period. A possible
explanation is that the incubator used could not maintain a constant humidity and the
maximum only reaching 92%. These conditions may only be able to provide the minimal
water requirement needed for metabolic activity. Alternatively, the sensitivity of IR
camera could be a contributing factor. The camera used in the experiment is designed
primarily to monitor temperature changes in metal and composite samples. No
experiment was performed to determine the detection limit of the machine. The camera’s
parameters state the accuracy of the camera is to one-hundredth of a degree Celsius,
temperature fluctuations occurring within this range should be detectable, unless the

68
resolution of the camera wasn’t great enough to capture the size of the temperature
difference. Accordingly, future research should consider cameras that have higher
resolution or an instrument better equipped to handle the task.
Instead of using an IR thermal camera and incubator for thermography
measurements, an isothermal micro-calorimeter (IMC) is more commonly used. An IMC
monitors heat production specifically by microorganisms and metabolic activity. IMC
instrumentation has the additional benefit of being paired with appropriate software and
analytical techniques. Future fungi thermography measurements should include an IMC
system due to the sensitivity of the equipment and the wealth of experimental literature
available.
5.5 Nano-Infrared Spectroscopy
The results from the nanoIR experiment reveal chemical signatures of PU
degradation through specific peak loss mapped to bonds within the film. Due to the
technical difficulties with the AFM instrument it was mechanically difficult to replicate
the results. As long as the Impranil thickness stays consistent between measurements,
replication of the data through measurement is feasible. NRL collaborators found the
three peaks observed to have the greatest peak loss over of the trials are 1174cm-1
,
1244cm-1
, and 1735cm-1
. Each of these peaks were determined to be the spatial
frequencies of the urethane chains. If polyurethane is being degraded, the evidence would
be in the amplitude of the three urethane peaks. The remaining three peaks (2864 cm-1
,

69
2938 cm-1
, 3341 cm-1
) are significant but not as much of an indication to chemical
weakening.
5.6 Final Thoughts & Future Directions
The original goal of this project was to observe quantitatively how different
Cryptococcus isolates behave under temperature and humidity variance studies. The
lifecycle of an aircraft undergoes large fluctuations in pressure, humidity, and
temperature; yet the microbes discovered on aircraft under these conditions are thriving
in a nutrient limited environment. If data from aircraft systems that monitor outside
environmental conditions could be gathered, climate systems could be designed to house
biological cultures in the exact conditions for observation. Taking the environmental
conditions a step further could allow for wind and turbulent measurements of airflow
across materials and observe how the microbes react; these measurements can lead to
physical parameters of stress and adhesion related to microbes found on the exterior of
the aircraft. Furthermore, temperature and humidity cycling to match the interior
environment of an active aircraft will further help with the understanding of microbial
growth and survivability. By simulating actual in-service aircraft environment, it will
lead to greater understanding of how the microbes are growing and damaging the aircraft.
Unfortunately due to time and instrument restraints, the variability measurements could
not be performed and thus the scope of the research changed.

70
Figure 35. Image from a Confocal Raman system demonstrating feature spectroscopic differences.
[Collaborator: Barlow]
Other techniques can be used to determine molecular structure via spectroscopic
waveforms. Confocal Raman Spectroscopy (CRS) aims to distinguish between features
of interest and the ambient background by comparable means to NanoIR. Raman has a
distinct advantage of being able to create a 3D map of the sample structure, allowing
greater visualization and possible volume quantization of the biofilm sample. NRL
collaborators have demonstrated the benefits of the technique with similar PU film and
isolate samples used in the NanoIR trials. Future measurements should consider confocal
Raman spectroscopy as a substitute if consistent AFM/NanoIR measurements cam not be
achieved.
Future measurements of mass loss could be experimentally paired with
monitoring CO2 levels. If the same samples were used in both experiments and the results
were in agreement, a relationship between mass loss to CO2 levels can be defined for
each isolate.

71
The future of the research outlined is quite expansive; the AFRL-NRL
collaboration team in charge covers three organizations. Almost every aspect of
biodeterioration are currently being investigated, from initial biofilm formation, cell
motility, kinetics and mechanisms of degradation, and beyond to protein and enzyme
analysis. Collaboration efforts are currently focused on the yeast organism Cryptococcus,
though over 80 isolates were found to degrade PU by our research group. It is possible
that there are hundreds more unique bacteria and fungi across different aircraft that may
cause more severe damage than demonstrated.
A topic of personal interest that was not investigated is how to prevent microbial
growth on aircraft. Preventative measures are equally as vital to the survivability of
aircraft as detection and reaction capabilities. Aircraft materials could be washed or
coated with a variety of substances known to destroy biological material on metals and
coatings. The same bacteria and fungi originally found on the C-130 could then be
deposited onto the films and monitored for their reaction to the prevention method. This
research would potentially allow inspectors to get ahead of attached colonies before any
damage could be done; thus leaving minimal unexpected coating failures during aircraft
examination.
Finally, demonstrated in this paper is great potential to start awareness of how
microbial contaminants on aircraft can lead to coating and possibly aircraft failure. Under
the right environmental conditions, certain biological samples can eat away at the
protective coatings of aircraft, disabling their purpose and causing mechanical
weaknesses in the system. The different modalities expressed in this research are not new

72
to the inspection process; however, further research can indicate which procedure is the
most efficient to detect and analyze microbial biofilm structures. Specifically, infrared
spectroscopy has shown great promise at identifying chemical depreciation. If microbial
degradation can become a part of the scheduled inspection process it has the potential to
save the United States Air Force a substantial amount of labor hours and money.

73
BIBLIOGRAPHY
[1].Barlow, D. E., Biffinger, J. C., Cockrell-Zugell, A. L., Lo, M., Kjoller, K., Cook, D.,
et al. (2016). The importance of correcting for variable probe–sample interactions in
AFM-IR spectroscopy: AFM-IR of dried bacteria on a polyurethane film. The Analyst.
Royal Society of Chemistry (RSC). https://doi.org/10.1039/c6an00940a
[2].Benedict, V. Christine, Cameron, J.A., Huang, J. Samuel; Polycaprolactone
Degradation by Mixed and Pure Cultures of Bacteria and a Yeast. Microbiology Section,
The University of Connecticut. Journal of Applied Polymer Science, Vol. 28,335-
342(1983).
[3].Biffinger, J. C., Barlow, D. E., Pirlo, R. K., Babson, D. M., Fitzgerald, L. A.,
Zingarelli, S., et al. (2014, November). A direct quantitative agar-plate based assay for
analysis of Pseudomonas protegens Pf-5 degradation of polyurethane films. International
Biodeterioration & Biodegradation. Elsevier BV.
https://doi.org/10.1016/j.ibiod.2014.09.005
[4].Cameron, J.A., Albert S. Chracterization of an Extracelluar Polyester Depolymerase
of Cryptococcus Laurentii. Department of Molecular and Cell Biology, The University of
Connecticut. Biodeterioration Research (1987).
[5].Cameron, J.A., Bunch C.L., Huang S.J., et al. (1988) Microbial Degradation of
Synthetic Polyemers. Department of molecular and Cell Biology and Department of
Chemistry, The University of Connecticut, Storrs, Connecticut 06268, USA
[6].Cregut, M., Bedas, M., Durand, M.-J., & Thouand, G. (2013, December). New
insights into polyurethane biodegradation and realistic prospects for the development of
a sustainable waste recycling process. Biotechnology Advances. Elsevier BV.
https://doi.org/10.1016/j.biotechadv.2013.08.011
[7].Karigar, C. S., & Rao, S. S. (2011). Role of Microbial Enzymes in the Bioremediation
of Pollutants: A Review. Enzyme Research. Hindawi Publishing Corporation.
https://doi.org/10.4061/2011/805187
[8].Kim, Y. D., & Kim, S. C. (1998, November). Effect of chemical structure on the
biodegradation of polyurethanes under composting conditions. Polymer Degradation and
Stability. Elsevier BV. https://doi.org/10.1016/s0141-3910(98)00017-2
[9].Kodama, Y., Masaki, K., Kondo, H., Suzuki, M., Tsuda, S., Nagura, T., et al. (2009,
November 15). Crystal structure and enhanced activity of a cutinase-like enzyme
fromCryptococcussp. strain S-2. Proteins: Structure, Function, and Bioinformatics.
Wiley-Blackwell. https://doi.org/10.1002/prot.22484

74
[10].Mumtaz, T., Khan, M. R., & Hassan, M. A. (2010, July). Study of environmental
biodegradation of LDPE films in soil using optical and scanning electron microscopy.
Micron. Elsevier BV. https://doi.org/10.1016/j.micron.2010.02.008
[11].Tabata, K., Hida, F., Kiriyama, T., Ishizaki, N., Kamachi, T., & Okura, I. (2013).
Measurement of soil bacterial colony temperatures and isolation of a high heat-producing
bacterium. BMC Microbiology. Springer Nature. https://doi.org/10.1186/1471-2180-13-
56
[12].Urgun-Demirtas, M., Singh, D., & Pagilla, K. (2007, August). Laboratory
investigation of biodegradability of a polyurethane foam under anaerobic conditions.
Polymer Degradation and Stability. Elsevier BV.
https://doi.org/10.1016/j.polymdegradstab.2007.04.013

![7. Microbial biodegradation of polyurethane changing and varying the polyhydroxyl and polyfunctional nitrogen compounds, different PU can be synthesized [6]. ... Examples of the raw](https://img.pdfslide.us/doc/110x75/5b0c5ac37f8b9af65e8bec7a/7-microbial-biodegradation-of-polyurethane-changing-and-varying-the-polyhydroxyl.jpg)


![7. Microbial biodegradation of polyurethanepolymer chain mobility. In the medical field PU show resistance to macromolecular oxidation, hydrolysis and calcification [12]. Polyurethane](https://img.pdfslide.us/doc/110x75/5f1fcd38218744489a5fff65/7-microbial-biodegradation-of-polymer-chain-mobility-in-the-medical-field-pu-show.jpg)