Embed Size (px)
Citation preview
Procedia Earth and Planetary Science 12 ( 2015 ) 84 – 92
1878-5220 © 2015 The Authors. Published by Elsevier B.V. This is an open access article under the CC BY-NC-ND license (http://creativecommons.org/licenses/by-nc-nd/4.0/).Peer-review under responsibility of the Scientific Committee of ISEDM 2013doi: 10.1016/j.proeps.2015.03.042
Available online at www.sciencedirect.com
ScienceDirect
ISEDM 2013
3rd International Symposium on Earthquake and Disaster Mitigation
Detecting Surface Structures after Large Eruption of Mt. Merapi in 2010 using ALOS/PALSAR Data
Asep Saepuloha*, Nurnaning Aisyahb, Minoru Uraic aFaculty of Earth Sciences and Technology, ITB
bVolcano Investigation and Technological Development Center (BPPTKG), CVGHM cGeological Survey of Japan, AIST
Abstract
Mt. Merapi located in central Java is one of the most active volcanoes in Indonesia. Its activity is characterized by small eruptions with periodicities ranging from one to five years. Eruptions of the last century were characterized by effusive lava dome growth and collapse to produce “Merapi type” pyroclastic flows. However, the characteristics of Merapi eruptions have changed in November 2010. The eruptions are more explosive (VEI 4), involving exceptionally rapid dome growth and collapse that produced extensive pyroclastic flows and heavy ash fall. Following the extra-ordinary eruption, we evaluated the changes of surface structures by quantifying the Linear Features Density (LFD) related to the geological structures before and after eruption using dual observation of ALOS PALSAR data. An automatic extraction of linear feature density from Synthetic Aperture Radar (lifedSAR) was applied to quantify the LFD. Statistically, the LFD increased to about 85% after the eruption with the location of maximum density at Southern flank. The high fractured zones were located at NW and NE from the summit. The zones could be served as fluid path of meteoric water infiltration to the subsurface. Therefore, the path may connect the water to the hot materials beneath the surface. © 2012 The Authors. Published by Elsevier Ltd. Selection and/or peer-review under responsibility of the Organizing Committee.
Keywords: Mt. Merapi, ALOS/PALSAR, Linear Features Density (LFD), geological structures.
* Corresponding author. Tel.: +81-22-2514990. E-mail address: [email protected]
© 2015 The Authors. Published by Elsevier B.V. This is an open access article under the CC BY-NC-ND license (http://creativecommons.org/licenses/by-nc-nd/4.0/).Peer-review under responsibility of the Scientific Committee of ISEDM 2013
85 Asep Saepuloh et al. / Procedia Earth and Planetary Science 12 ( 2015 ) 84 – 92
1. Introduction
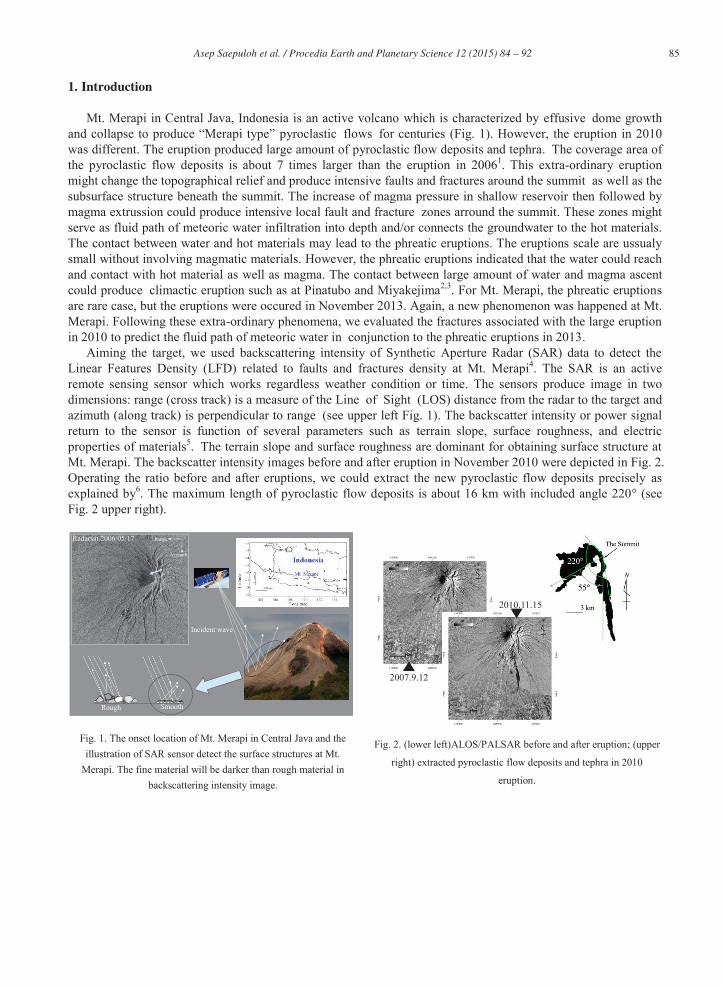
Mt. Merapi in Central Java, Indonesia is an active volcano which is characterized by effusive dome growth and collapse to produce “Merapi type” pyroclastic flows for centuries (Fig. 1). However, the eruption in 2010 was different. The eruption produced large amount of pyroclastic flow deposits and tephra. The coverage area of the pyroclastic flow deposits is about 7 times larger than the eruption in 20061. This extra-ordinary eruption might change the topographical relief and produce intensive faults and fractures around the summit as well as the subsurface structure beneath the summit. The increase of magma pressure in shallow reservoir then followed by magma extrussion could produce intensive local fault and fracture zones arround the summit. These zones might serve as fluid path of meteoric water infiltration into depth and/or connects the groundwater to the hot materials. The contact between water and hot materials may lead to the phreatic eruptions. The eruptions scale are ussualy small without involving magmatic materials. However, the phreatic eruptions indicated that the water could reach and contact with hot material as well as magma. The contact between large amount of water and magma ascent could produce climactic eruption such as at Pinatubo and Miyakejima2,3. For Mt. Merapi, the phreatic eruptions are rare case, but the eruptions were occured in November 2013. Again, a new phenomenon was happened at Mt. Merapi. Following these extra-ordinary phenomena, we evaluated the fractures associated with the large eruption in 2010 to predict the fluid path of meteoric water in conjunction to the phreatic eruptions in 2013.
Aiming the target, we used backscattering intensity of Synthetic Aperture Radar (SAR) data to detect the Linear Features Density (LFD) related to faults and fractures density at Mt. Merapi4. The SAR is an active remote sensing sensor which works regardless weather condition or time. The sensors produce image in two dimensions: range (cross track) is a measure of the Line of Sight (LOS) distance from the radar to the target and azimuth (along track) is perpendicular to range (see upper left Fig. 1). The backscatter intensity or power signal return to the sensor is function of several parameters such as terrain slope, surface roughness, and electricproperties of materials5. The terrain slope and surface roughness are dominant for obtaining surface structure at Mt. Merapi. The backscatter intensity images before and after eruption in November 2010 were depicted in Fig. 2. Operating the ratio before and after eruptions, we could extract the new pyroclastic flow deposits precisely as explained by6. The maximum length of pyroclastic flow deposits is about 16 km with included angle 220° (see Fig. 2 upper right).
Radarsat 2006/05/17 Range
Azimuth
Rough Smooth
Incident wave
Fig. 1. The onset location of Mt. Merapi in Central Java and the illustration of SAR sensor detect the surface structures at Mt.
Merapi. The fine material will be darker than rough material in backscattering intensity image.
2007.9.12
2010.11.15
Fig. 2. (lower left)ALOS/PALSAR before and after eruption; (upper
right) extracted pyroclastic flow deposits and tephra in 2010
eruption.
86 Asep Saepuloh et al. / Procedia Earth and Planetary Science 12 ( 2015 ) 84 – 92
2. Detecting Fractures Change Accompanied 2010 Eruption
2.1. Data Processing
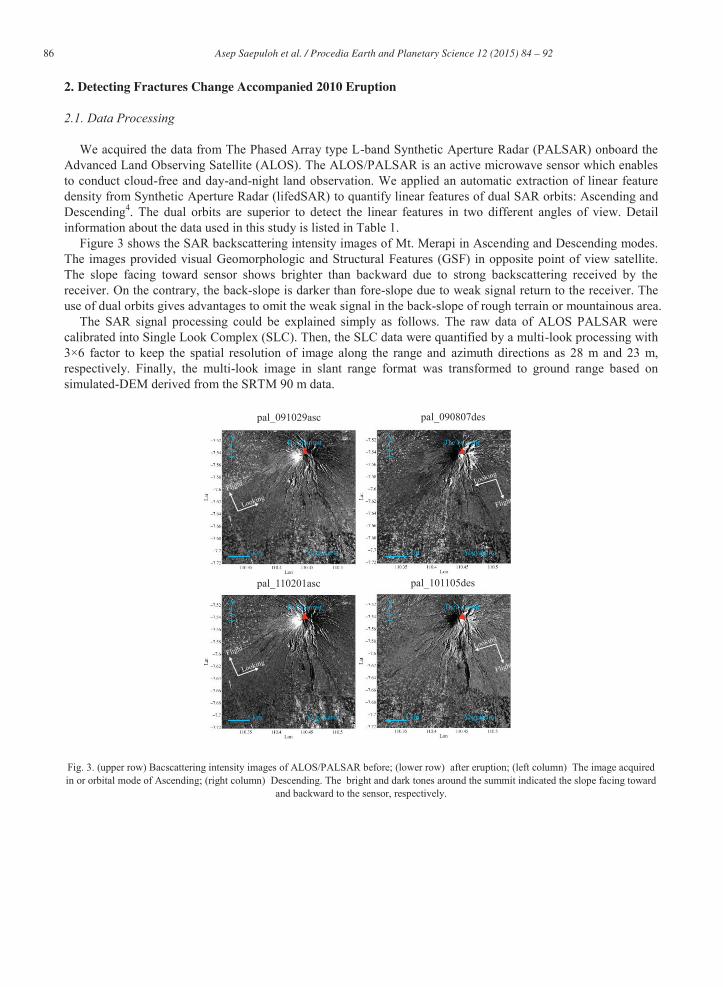
We acquired the data from The Phased Array type L-band Synthetic Aperture Radar (PALSAR) onboard the Advanced Land Observing Satellite (ALOS). The ALOS/PALSAR is an active microwave sensor which enables to conduct cloud-free and day-and-night land observation. We applied an automatic extraction of linear feature density from Synthetic Aperture Radar (lifedSAR) to quantify linear features of dual SAR orbits: Ascending and Descending4. The dual orbits are superior to detect the linear features in two different angles of view. Detail information about the data used in this study is listed in Table 1.
Figure 3 shows the SAR backscattering intensity images of Mt. Merapi in Ascending and Descending modes. The images provided visual Geomorphologic and Structural Features (GSF) in opposite point of view satellite. The slope facing toward sensor shows brighter than backward due to strong backscattering received by the receiver. On the contrary, the back-slope is darker than fore-slope due to weak signal return to the receiver. The use of dual orbits gives advantages to omit the weak signal in the back-slope of rough terrain or mountainous area.
The SAR signal processing could be explained simply as follows. The raw data of ALOS PALSAR were calibrated into Single Look Complex (SLC). Then, the SLC data were quantified by a multi-look processing with 3×6 factor to keep the spatial resolution of image along the range and azimuth directions as 28 m and 23 m, respectively. Finally, the multi-look image in slant range format was transformed to ground range based on simulated-DEM derived from the SRTM 90 m data.
The Summit
Yogyakarta5 km
NThe Summit
Yogyakarta5 km
N
pal_091029asc pal_090807des
The Summit
Yogyakarta5 km
NThe Summit
Yogyakarta5 km
N
pal_110201asc pal_101105des
Fig. 3. (upper row) Bacscattering intensity images of ALOS/PALSAR before; (lower row) after eruption; (left column) The image acquired in or orbital mode of Ascending; (right column) Descending. The bright and dark tones around the summit indicated the slope facing toward
and backward to the sensor, respectively.
87 Asep Saepuloh et al. / Procedia Earth and Planetary Science 12 ( 2015 ) 84 – 92
The lifedSAR program incorporates an edge detection process in the SAR images. This process delineated discontinuity pixel brightness. The pixels at which image brightness changes sharply are organized into a curved line segments. Normally, one structure is presented by one linear feature in the image. However, at the rough surface with high gradient topography structure will produce double linear features due to double edges in the SAR images. These double edges originated from back- and fore-slope effects. Therefore, selecting only the fore- or back-slope is sufficient to avoid double detection at same object.
Table 1. Satellite data used in this study.
Acquisition Date Resolution Orbit Mode
Before Eruption October 29, 2009 28×23 m Ascending August 7, 2009 28×23 m Descending
After Eruption February 1, 2011 28×23 m Ascending November 5, 2010 28×23 m Descending
2.2. Quantifying Linear Features Density (LFD)
The data input for lifedSAR is a multi-look of backscattering intensity image. Firstly, to quantify the backscattering intensity and enhance the contrast, we calculated the backscattering coefficient σ° in a logarithmic scale as follows:
(1)
where DN is digital number or pixel value of backscattering intensity image and CF is correction factor (= -83;7).
Then, the lifedSAR adopted the Laplacian of Gaussian (LoG) filter to detect the edge of GSF in the image. This filter is superior to minimize loss information and decrease processing time8. The LoG kernel filter 2 was applied to the σ° image as follows:
(2)
where x and y are pixel coordinates, φ=-((x2+y2 ))/(2γ2 ), and γ (=0.5) is a selected constant of the gaussian standard deviation. The binarization process followed this filtering step. Finally, the LFD image, δ, could be calculated from the binary image at 10×10 window size as follows:
(3)
where w is windows size, A is pixel area belong to the linear features (= row × column), Q75 is a selected threshold using the 3rd quartile of the histogram produced by eq. [2], and Δp is pixel resolution. The Matlab programming software was used to write the lifedSAR script.
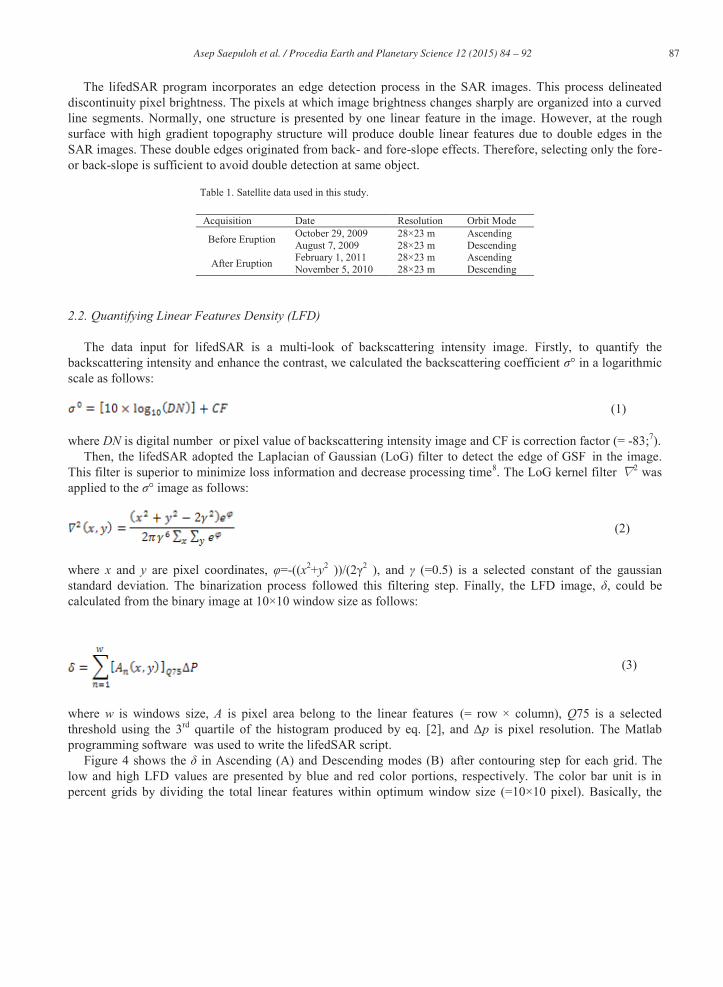
Figure 4 shows the δ in Ascending (A) and Descending modes (B) after contouring step for each grid. The low and high LFD values are presented by blue and red color portions, respectively. The color bar unit is in percent grids by dividing the total linear features within optimum window size (=10×10 pixel). Basically, the
88 Asep Saepuloh et al. / Procedia Earth and Planetary Science 12 ( 2015 ) 84 – 92
value will be 100% when a window size is filled fully by linear features. However, we obtained only 0.5% in maximum for the δ in Ascending and Descending modes
The Summit
Yogyakarta5 km
NThe Summit
Yogyakarta5 km
N
pal_091029asc pal_090807des
The Summit
Yogyakarta5 km
NThe Summit
Yogyakarta5 km
N
pal_110201asc pal_101105des
Fig. 4. Extracted Linear Features Density (LFD) for backscattering intensity images of ALOS/PALSAR as shown by Fig. 3. The white triangle is the summit of Mt. Merapi.
For δ image in Ascending mode, The maximum LFD values are located generally at Western part near the
summit. It might be caused by mixing between detected linear features and the effect of LOS from the West to the rough terrain. In addition, the high LFD values are concentrated at W and SE from the summit. The high LFD values at W might be correlated with linear features from the Mt. Merapi volcanic products such as pyroclastics and tephra deposits. In addition, high values at SE probably originated from urban area such as farm land and/or man-made constructions.
On the contrary, the maximum LFD values in the Descending mode are located generally at eastern flank from the summit. We interpreted that the mixing between linear features and the effect of LOS from the East especially around the summit caused maximum LFD values. In addition, the high LFD values are concentrated at E and continued to S from the summit. We interpreted that this continuation related to new developed surface structure and new volcanic product after 2010 eruption. Moreover, at the S from the summit the high LFD values might mix with urban area.
2.3. Result
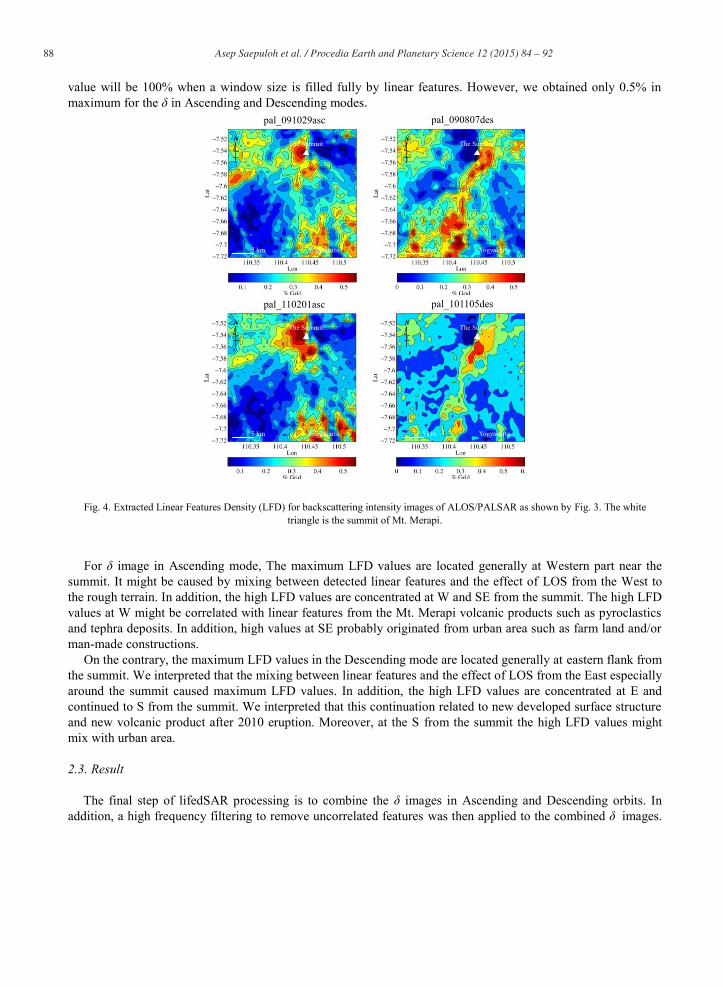
The final step of lifedSAR processing is to combine the δ images in Ascending and Descending orbits. In addition, a high frequency filtering to remove uncorrelated features was then applied to the combined δ images.
89 Asep Saepuloh et al. / Procedia Earth and Planetary Science 12 ( 2015 ) 84 – 92
The lifedSAR results are depicted in Figure 5. Simply, the LFD values less than 0.4% and higher than 0.5% are classified as low and high density, respectively. For LFD before eruption, the maximum density more than 0.7% is located at southern flank from the summit. The oval shape of high density elongates from southern flank to the SW and S, but the pattern discontinues to the NW. For LFD after eruption, the maximum densities increased about 85% in total. The maximum density at southern flank enlarges toward almost all directions in general. The high density pattern continues from the summit to the NW, but discontinues to the S.
A B
The Summit
Yogyakarta5 km
NThe Summit
Yogyakarta5 km
N
Fig. 5. (a) The contour map of total LFD before eruption; (b) after eruption in November 2010. The density supposed to be related with faults and fractures increased near the summit as shown by massive red portion on the right figure. White dashed lines are interpreted local faults
based on GPS measurements9.
3. Discussion
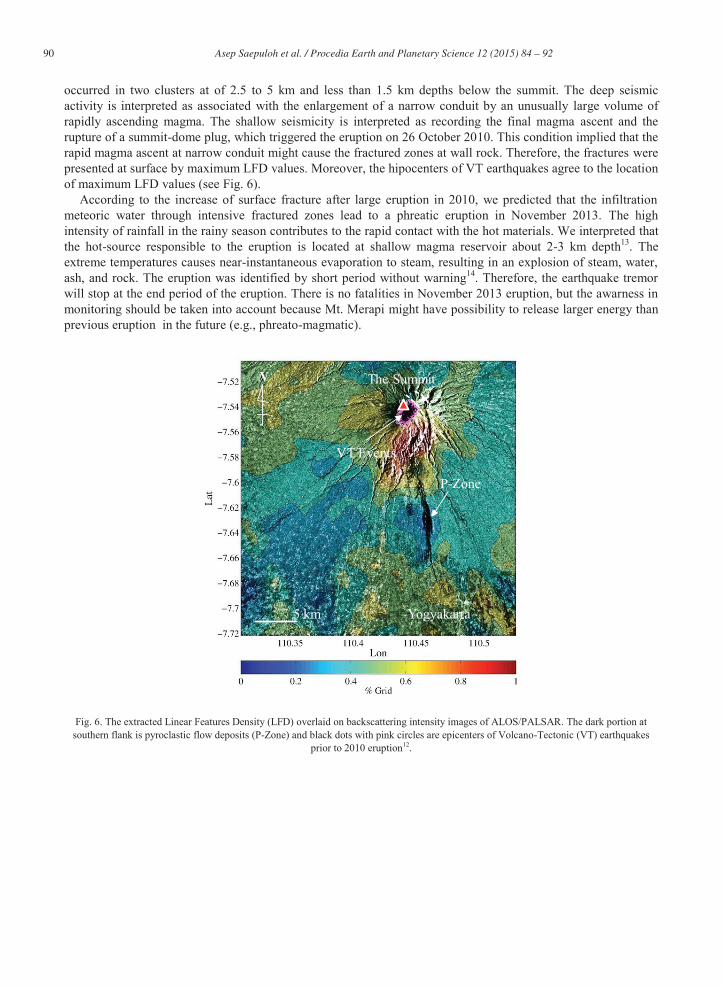
The extra-ordinary of Mt. Merapi eruptions in 2010 was began by an explosive eruption that produced a new summit crater on 26 October 2013. This initial phase eruption was accompanied by ash column and pyroclastic flow deposits about 8 km from the summit9. A great magmatic eruption in 4–5 November (VEI 4) then destroyed the new lava dome and enlarged the new summit crater. The turbullent flows with large amount of fragmented matrial at a narrow valley caused “bottleneck” effect near the summit11. Then, the flows continued toward South and filled Gendol drainage.The eruption produced extensive pyroclastic flows (to ~16 km radial distance in the Gendol drainage) and surges. The paroxysmal eruption was followed by a rapid dome growth on 6 November 2010 10. The high magma pressure with twice lava dome growth in a short period is interpreted as the cause of fracturing zone around the summit. Moreover, the “bottleneck” effect at the pyroclastic flows path agrees with the maximum LFD zone at Southern flank (see Fig. 6). The both phenomena might be contributed significantly to the increase of fractureed zones at surface.
According to the subsurface condition prior to the eruptions,12 explained that shorter-term and more continuous precursory seismic activity was started about 6 weeks before the initial explosion on 26 October 2010. During this period, the rate of seismicity increased almost constantly yielding a cumulative seismic energy release for volcano-tectonic (VT) and multiphase events (MP). This value is 3 times larger than maximum energy release preceding previous effusive eruptions of Mt. Merapi. The hypocenters of VT events in 2010 were
90 Asep Saepuloh et al. / Procedia Earth and Planetary Science 12 ( 2015 ) 84 – 92
occurred in two clusters at of 2.5 to 5 km and less than 1.5 km depths below the summit. The deep seismic activity is interpreted as associated with the enlargement of a narrow conduit by an unusually large volume of rapidly ascending magma. The shallow seismicity is interpreted as recording the final magma ascent and the rupture of a summit-dome plug, which triggered the eruption on 26 October 2010. This condition implied that the rapid magma ascent at narrow conduit might cause the fractured zones at wall rock. Therefore, the fractures were presented at surface by maximum LFD values. Moreover, the hipocenters of VT earthquakes agree to the location of maximum LFD values (see Fig. 6).
According to the increase of surface fracture after large eruption in 2010, we predicted that the infiltration meteoric water through intensive fractured zones lead to a phreatic eruption in November 2013. The high intensity of rainfall in the rainy season contributes to the rapid contact with the hot materials. We interpreted that the hot-source responsible to the eruption is located at shallow magma reservoir about 2-3 km depth13. The extreme temperatures causes near-instantaneous evaporation to steam, resulting in an explosion of steam, water, ash, and rock. The eruption was identified by short period without warning14. Therefore, the earthquake tremor will stop at the end period of the eruption. There is no fatalities in November 2013 eruption, but the awarness in monitoring should be taken into account because Mt. Merapi might have possibility to release larger energy than previous eruption in the future (e.g., phreato-magmatic).
The Summit
Yogyakarta5 km
N
VT Events
P-Zone
Fig. 6. The extracted Linear Features Density (LFD) overlaid on backscattering intensity images of ALOS/PALSAR. The dark portion at southern flank is pyroclastic flow deposits (P-Zone) and black dots with pink circles are epicenters of Volcano-Tectonic (VT) earthquakes
prior to 2010 eruption12.
91 Asep Saepuloh et al. / Procedia Earth and Planetary Science 12 ( 2015 ) 84 – 92
4. Conclusion
The SAR backscattering intensity data proved effective to quantify structural features at ground surface. The geometric distortion problem and/or limitation of waveband in the SAR imagery can be minimized by combining two different satellite orbits termed as Ascending and Descending. The two orbits provided useful information to obtain Geomorphologic and structural features (GSF) at different point of view satellite. According to the Linear Features Density (LFD) before eruption, the maximum density more than 0.7% was located at southern flank from the summit. The oval shape of high density elongates from southern flank to the SW and S, but the pattern discontinues to the NW. The maximum densities increased about 85% in total after eruptions. The maximum density at southern flank enlarges toward almost all directions in general. The high density pattern continues from the summit to the NW, but discontinues to the S. Therefore, the LFD contour pattern of high density has changed from summit – SW – S to summit – SW – NW. The pattern followed the strike of local faults at Mt. Merapi.
The large eruptions of Mt. Merapi in 2010 involved exceptionally rapid dome growth and collapse that produced extensive pyroclastic flows and heavy ash fall. The high magma pressure in a narrow conduit with twice lava dome growth in a short period caused fracturing zone around the summit. The zones of “bottleneck” effect at the pyroclastic flows path and epicenter of VT earthquakes agreed with the maximum LFD zone at Southern flank. The fracture zones might serve as the fluid path infiltration of meteoric water. The contact between water and hot materials at shallow depth caused a phreatic eruption such as in November 2013. The high intensity of rainfall in the rainy season also contributed to the eruption.
Acknowledgements
The ALOS/PALSAR data used in this study were provided by GeoGRID database system of National Institute of Advanced Industrial Science and Technology (AIST) under collaborative research work.
References
1. Saepuloh A., & Urai M. (2012), Characterizing pyroclastic flow deposits of a large eruption of Mt. Merapi in 2010 using ALOS/PALSAR and ASTER data, Proceeding of the 1st workshop of Asia-Pacific Region Global Earthquake and Volcanic Eruption Risk Management (G-EVER1), GSJ-AIST, Tsukuba, Japan, 105-108.
2. Rosi, M., Paladio-Melosantos, M., Di Muro, A., Leoni, R., Bacolcol, T. (2001), Fall vs flow activity during the 1991 climactic eruption of Pinatubo Volcano (Philippines), Bulletin of Volcanology, 62(8), 549-566
3. Geshi, N., Oikawa, T. (2008), Phreatomagmatic eruptions associated with the caldera collapse during the Miyakejima 2000 eruption, Japan, Journal of Volcanology and Geothermal Research, 176, 457–468.
4. Saepuloh, A., Urai, M., Meilano, I., & Sumintadireja, P. (2013b), Automatic extraction and validation of linear features density from ALOS PALSAR data for active faults and volcanoes, proceeding of the International Symposium on Remote Sensing, Chiba, Japan.
5. Barrick, D.E., & Peak, W.H. (1968), A review of scattering from surfaces with different roughness scales, Radio Science, 3, 865–868. 6. Saepuloh A., Koike K., Omura M., Iguchi M., Setiawan A. (2010), SAR- and gravity change-based characterization of the distribution
pattern of pyroclastic flow deposits at Mt. Merapi during the past ten years, Bulletin of Volcanology, 72, 221-232. 7. Shimada, M., Isoguchi, O., Tadono, T., Higuchi, R., and Isono, K. (2007), PALSAR CALVAL Summary (JAXA-PI193), paper
presented at The First Joint PI Symposium of ALOS Data Nodes for ALOS Science Program, Kyoto, Japan. 8. Sotak, G.E., & Boyer, K.L. (1989), The Laplacian-of-Gaussian kernel: a formal analysis and design procedure for fast, accurate
convolution and full-frame output, Computer Vision, Graphics, and Image Processing, 48, 147-189. 9. Subandriyo, Sayudi D.S., Nurnusanto, I., and Muzani, M. (2006), Erupsi G. Merapi Tahun 2006, Bulletin Berkala Merapi, 3(2), 1-14. 10. Pallister, J.S., Schneider, D.J., Griswold, J.P., Keeler, R.H., Burton, W.C., Noyles, C., Newhall, C.G., & Ratdomopurbo, A. (2013),
Merapi 2010 eruption—Chronology and extrusion rates monitored with satellite radar and used in eruption forecasting, Journal of Volcanology and Geothermal Research, 261, 144–152.

92 Asep Saepuloh et al. / Procedia Earth and Planetary Science 12 ( 2015 ) 84 – 92
11. Walter, T.R., Ratdomopurbo, A., Subandriyo, Aisyah, N., Brotopuspito, K.S., Salzer, J., & Lühr, B. (2013), Dome growth and coulée spreading controlled by surface morphology, as determined by pixel offsets in photographs of the 2006 Merapi eruption, Journal of Volcanology and Geothermal Research, 261, 121–129.
12. Budi-Santoso, A., Lesage, P., Dwiyono, S., Sumarti, S., Subandriyo, Surono, Jousset, P., & Metaxian, J-P. (2013), Analysis of the seismic activity associated with the 2010 eruption of Merapi Volcano, Java, Journal of Volcanology and Geothermal Research, 261, 153–170.
13. Saepuloh A., Urai M., Aisyah N., Sunarta, Widiwijayanti C., Subandriyo, & Jousset P. (2013a), Interpretation of ground surface changes prior to the 2010 large eruption of Merapi volcano using ALOS/PALSAR, ASTER TIR and gas emission data, Journal of Volcanology and Geothermal Research, 261, 130-143.
14. Christenson, B.W., Reyes, A.G., Young, R., Moebis, A., Sherburn, S., Cole-Baker, J., & Britten, K.(2010), Cyclic processes and factors leading to phreatic eruption events: Insights from the 25 September 2007 eruption through Ruapehu Crater Lake, New Zealand, Journal of Volcanology and Geothermal Research, 191, 15-32.


![untitled [] · Web viewof Mount Pinatubo is shown in the figure below. This pyroclastic flow formed during the 1991 eruption of Mount Pinatubo, in the Philippines. Section 1 ReviewNSESES](https://img.pdfslide.us/doc/110x75/5fef8ed3ee36566af96ec39e/untitled-web-view-of-mount-pinatubo-is-shown-in-the-figure-below-this-pyroclastic.jpg)