Embed Size (px)
Citation preview

1
Detecting Social Interaction of Elderly in a Nursing Home Environment
Datong Chen, Jie Yang, Robert Malkin, and Howard D. Wactlar Computer Science Department & Human-Computer Interaction Institute School of Computer Science Carnegie Mellon University
_______________________________________________________________________ Social interaction plays an important role in our daily lives. It is one of the most important indicators of physical or mental changes in aging patients. In this paper, we investigate the problem of detecting social interaction patterns of patients in a skilled nursing facility. Our studies consist of both a “wizard of Oz” study and an experimental study of various sensors and detection models for detecting and summarizing social interactions among aging patients and caregivers. We first simulate plausible sensors using human labeling on top of audio and visual data collected from a skilled nursing facility. The most useful sensors and robust detection models are determined using the simulated sensors. We then present the implementation of some real sensors based on video and audio analysis techniques and evaluate the performance of these implementations in detecting interaction. We conclude the paper with discussions and future work. Categories and Subject Descriptors J.3 life and medical science; H3 information storage and retrieval; I.6 simulation and modeling Keywords Social interaction, human activity, medical care, health care, stochastic modeling, sensor _______________________________________________________________________
1. INTRODUCTION
As the elderly population continues to grow, clinicians and geriatric professionals need
advanced technologies to support them in monitoring and managing patients’ quality of
life in nursing homes. This research is part of an NSF project, CareMedia1, which aims to
create a meaningful, manageable information resource that enables more complete and
accurate assessment, diagnosis, treatment, and evaluation of behavioral problems for
geriatric patients by capturing a continuous audiovisual record of daily activity in
common areas in nursing home settings, and automatically extracting relevant
information from it. In this paper, we investigate the problem of automatically detecting
social interaction patterns in nursing home settings. Social interaction plays an important
role in our daily lives. We interact with others in various ways that influence our status
and roles in social communities. The ways in which people respond to each other are
1 A System of Video Information Capture, Indexing and Retrieval for Interpreting Human Activity, Wactlar,
H., Bharucha, A., Stevens, S., Hauptmann, A., Christel, M., Proceedings IEEE International Symposium on
2
referred to as social interaction patterns, which, to some extent, are independent of any
particular individual. A study showed that humans spend more than 80% of their waking
time in the company of other people [12]. We are interested in detecting social
interactions of geriatric patients for several reasons:
1. Interaction with others is generally considered a positive and necessary part of life in
the elderly.
2. Changes in interaction patterns can reflect changes in the mental or physical status of
a patient. Naturally, the level of social interaction of a person depends on a wide
range of factors, such as his/her health condition, personal preference, and aptitude
for social interaction. Physical disability is not necessarily socially disabling. As we
have observed from our recorded data, many of the most severely disabled patients
had daily social interactions. Clinical studies indicate that an elderly patient with
dementia may exhibit agitated behaviors that reflect increased confusion, delusion,
and other psychiatric disturbances [39][48]. Most of these agitated behaviors are
observable during interactions between the patients and their caregivers.
3. Most social interactions in a public place are observable. This makes it possible to
detect them automatically.
4. The detection of social interaction patterns is a very challenging problem that
requires many basic technologies, which are applicable to individual
behavior/activity analysis tasks in a nursing home. Existing research mainly focuses
on analyzing individual human activities and pays little attention to analyzing social
interaction patterns of people, which consists of multiple individual activities
occurring together. Through investigating social interaction pattern detection, we are
able to advance the current technologies to deal with multiple people and complex
events.
The worldwide population over age 65 is expected to more than double from 357 million
in 1990 to 761 million in 2025 [23]. At present, five percent of Americans over age 65
reside in nursing homes, with up to 50 percent of those over the age of 85 likely to be
placed in a nursing home at some point in their lives [17][45]. Among these nursing
home residents, about 80% of them are believed to suffer from a psychiatric disorder, and
Image and Signal Processing and Analysis (ISPA'03), Special Session on System Perspectives in Information
Retrieval, Rome, Italy, September 18-20, 2003 <first published paper to discuss CareMedia concepts>

3
90% of patients with Alzheimer’s disease experience behavioral complications leading to
increased functional disability, medical morbidity, mortality, and premature
institutionalization [51][49]. In many nursing homes, physicians might visit their patients
for only a short period of time once per week. Assessment of a patient’s progress is thus
based mainly on reports from staff (nurses and nurse assistants). The reports may be
incomplete or even biased, due to schedule shift and the fact that each staff person has to
care for many patients. This may result in insufficient observation for monitoring either
progressive change, or brief and infrequent occurrences of aberrant activity that might
lead to diagnosis of some diseases. For example, dementia is very common among
residents in nursing facilities. One characteristic of dementia is a sustained decline in
cognitive function and memory [34]. As mentioned before, studies indicate that elderly
patients suffering from dementia may exhibit observable agitated behaviors that reflect
increased confusion, delusion, and other psychiatric disturbances [39][48]. In the early
stage, these agitated behaviors occur occasionally and only last a very short period of
time. Long-term observation and care thus becomes increasingly important for tracking
the disease progress of geriatric patients with dementia in nursing homes [13]. Although
no widely accepted measure exists for dementia care environments [8], quantitative
measures of daily activities of these patients can be very useful for dementia assessments.
Figure 1 Examples of interaction patterns in a nursing home
Previous research has focused on analyzing individual activities of the elderly in
individual homes [59][60]. Our study focuses on detecting interactions in multi-person
activities in real data recorded from public areas in a nursing facility. A social interaction
is a mutual or reciprocal action that involves two or more people and produces various

4
characteristic visual/audio patterns. To simplify the problem, in this paper, we only
analyze social interactions between two people. Figure 1 illustrates some examples of
interaction patterns from the data. Automatically interpreting interactions of the elderly
according to medical needs may require very detailed information about the event, which
is beyond the capabilities of existing technologies. For example, a physician may want to
know if a patient cannot understand a conversation with his/her caregiver, which is not
discernible with the current state of speech recognition technology. The gaps between
medical needs and technological capabilities can introduce bridge concepts, such as,
“conversation” in the above example. Conversation detection is a much easier problem
and can be implemented using current technology. Instead of telling the physician the
answer to his/her original concern, “does patient A understand his caregiver?”, an
automatic system can provide the physician a set of detected conversation recordings of
the patient and allow the physician to make his/her own informed decision. The research
problems we are investigating are how to find these bridge concepts and how well we
can implement sensors to detect them.
This paper addresses the first problem by studying a general event “interaction”. We
select the most common interaction-related events required by physicians and explore
their importance in predicting an interaction, assuming that they can be detected by
(simulated) sensors. Since we at least must detect “interaction” events to provide
rudimentary information to the physicians, we give higher priority to the events that have
greater importance in detecting an “interaction” event. To address the second problem,
we first build detection models using various machine learning methods on the basis of
simulated sensors. This tells us how well we can detect some general events in an ideal
case in which all the sensors are available. We then implement some real sensors using
video and audio analysis techniques and validate the detection performance using only
the real sensors.
Due to the fact that human beings infer interaction activities mainly from audio and
visual cues, our study is performed on the basis of a long-term digital audio and video
recording of a nursing home environment. We simulate potential useful sensors by
applying the knowledge of human experts on the audio and visual channels. Both
physical and algorithmic sensors are considered in detecting social interactions. For
example, we can use an RF (Radio Frequency) sensor to track the location of each
5
patient, or a speech detector algorithm from the audio signals. This simulation allows us
to study various combinations of sensors and multiple detection models without the
development and deployment of physical and algorithmic sensors. The real
implementations are only focused on the sensors with high importance. We will discuss
implementation of these sensors and evaluate their performance.
In the next section, we will view related work on sensing human behavior, which
grounds our choice of sensors in existing or emerging technologies. The details of this
study are presented in the following sections: Section 3 introduces data collection and
sensor selection and simulation. Section 4 provides a study of the strengths of detecting
social interactions with individual sensors. Section 5 presents a study of detection models
of interaction events using simulated sensors. Section 6 proposes the implementation of
some important sensors using video and audio analysis. The validations of the proposed
implementations are presented in Section 7. We then summarize feasibility and the
possibility of detecting social interaction and discuss the limitations of the current CHI
technology in this field.
2. RELATED WORK
Social interaction consists of both individual human activity and relations between
multiple people. Therefore, the work presented in this paper is closely related with
location awareness and human activity analysis, which have been addressed by many
researchers in different areas such as multimedia processing, pervasive computing, and
computer vision.
2.1. Wearable Sensors
Various wearable sensors have been developed in recent years to address person tracking
and activity analysis in the ubiquitous computing area. A GPS (Global Position System)-
based system can compute the location of a radar reflection using the difference in time-
of-flight between 3 precisely synchronized satellites [34]. The Active Bat Location
system [19] obtains the location of a mobile tag using ultrasound sensors mounted on the
ceiling of a room. PlusOn time-modulated ultra-wideband technology [52] provides
location measurements to centimeter precision. Some wearable sensors have been applied
to health monitoring [33], group interaction analysis [20], and memory augmentation

6
[46]. These indoor and outdoor localization systems provide quite precise location
information but require a user to wear a special receiver or a tag, which may present
operational difficulties at a nursing facility.
2.2. Simple Non-contact Sensors
Elderly individuals are frequently unwilling to adapt to even small changes in their
environment, including wearable sensors in their clothing. Some non-contact sensors are
considered more practical in our task. Power line network [7] and Ogawa’s monitoring
system use switches and motion detectors to track human activities indoors. In these
systems, the tracking is extended from a person’s body to his environment, for example,
the water level in the bath. The data provided by switches and motion sensors are reliable
and very easy to process. However, they cannot provide detailed information. For
example, a motion sensor can only tell that there is a person in the monitored area but
cannot tell the exact location.
2.3. Algorithmic Sensors for People Tracking
A vision-based system can provide location information while overcoming some of the
limitations of the above-mentioned systems. Many computer vision algorithms have been
developed for not only recovering the 3D location of a person, but also for providing
detailed appearance information about the person and his/her activities.
Koile et. al. [30] at MIT proposed a computer vision system to monitor the indoor
location of a person and his/her moving trajectory. The Living Laboratory [29] was
designed by Kidd, et. al. for monitoring the actions and activities of the elderly.
Aggarwal, et. al. [1] has reviewed different methods for human motion tracking and
recognition. Various schemes, including single or multiple cameras, and 2D and 3D
approaches have been broadly discussed in this review.
2.4. Algorithmic Sensors for Activity Analysis
A large number of algorithmic sensors have been proposed to detect activities from audio
and visual signals, including gait recognition [6], hand gesture analysis [15], facial
expression understanding [14], sitting, standing and walking analyses [33] and speech
detection [36]. Hudson et. al examined the feasibility of using sensors and statistical
models to estimate human interruptibility in an office environment [24]. These sensors
are, for the most part, still research challenges today but can be potentially applicable in

7
the future. The combinations of these sensors for analyzing human behaviors have been
applied in some constrained environments, such as offices [40], meeting rooms [56], and
sports fields [25][28].
2.5. Activity Analysis Models
Earlier human activity recognition research focused on analyzing individual human
behaviors and actions. Apart from the work introduced in the last paragraph, Kojima and
Tamura [31] proposed an individual human action recognition method using a case
framework, which is widely used in natural language processing. Case frames are defined
to be action rules organized in a hierarchical structure. Badler [4] proposed a hierarchical
framework based on a set of motion verbs. A motion verb is actually a human behavior,
which is modeled using state machines on the basis of rules predefined on static images.
The system can be extended theoretically for resolving complex events existing in human
activities. However, the system was only tested in an artificial environment. Other rule-
based methods [2][22] have also shown their merits in action analysis. Rule-based
systems may have difficulties in defining precise rules for every behavior because some
behaviors may consist of fuzzy concepts.
Statistical approaches, from template models and linear models to graphic models, have
been used in human activity analysis. Davis and Bobick [11] proposed a template model-
based method for tracking human movement. They constructed temporal templates using
motion energy and motion history. Yacoob and Black [55] used linear models to track
cyclic human motion. The model consists of the eigenvectors extracted using principal
component analysis from the observations. Intille and Bobick [25] interpret actions
(agents) using a Bayesian network among multiple agents. The Bayesian network can
combine uncertain temporal information and compute the likelihood for the trajectory of
a set of objects to be a multi-agent action. This work proposed that group actions could
be “compiled down” into collections of visual features and temporally coordinated
(individual) activities. Jebara and Pentland [27] employed conditional expectation
maximization to model and predict the actions. Their system could synthesize a reaction
based on the predicted action. Hidden Markov models [38], layered hidden Markov
models [40][37], or coupled hidden Markov models [42] have been used for recognizing
actions and activities, and have demonstrated their advantages in modeling temporal
relationships between visual-audio events. However, huge training data is usually
8
required to obtain good models of various actions in the spatiotemporal domain [54].
Ivanov [26] proposed a stochastic, context-free grammar to interpret an activity by
recursively searching for a complete tree in a non-deterministic probabilistic expansion
of context-free grammar.
3. SENSOR SIMULATION
3.1. Data Collection
To avoid privacy concerns, we collected data from public areas instead of private rooms
in a nursing home. Cameras and audio collectors were carefully placed in two hallways.
Each video and its corresponding audio channels were digitized and encoded into
MPEG-2 streams in real time and recorded onto hard disks through a PC. The video data
was captured and recorded in 24-bit color with a resolution of 640x480 pixels at 30
frames per second. The audio data was recorded at 44.1KHz with 16-bit samples.
Recording was performed from 9am to 5 PM for 10 days. Overall, 80 hours per camera
were recorded from the nursing facility.
3.2. Sensor selection
A sensor is usually defined as a device that receives a signal or stimulus and responds to
it in a distinctive manner. As we mentioned in introduction, we consider both physical
and algorithmic sensors in this study. Each sensor should be associated with observable
events in the video and audio channel so that it can be simulated with the video and audio
data.
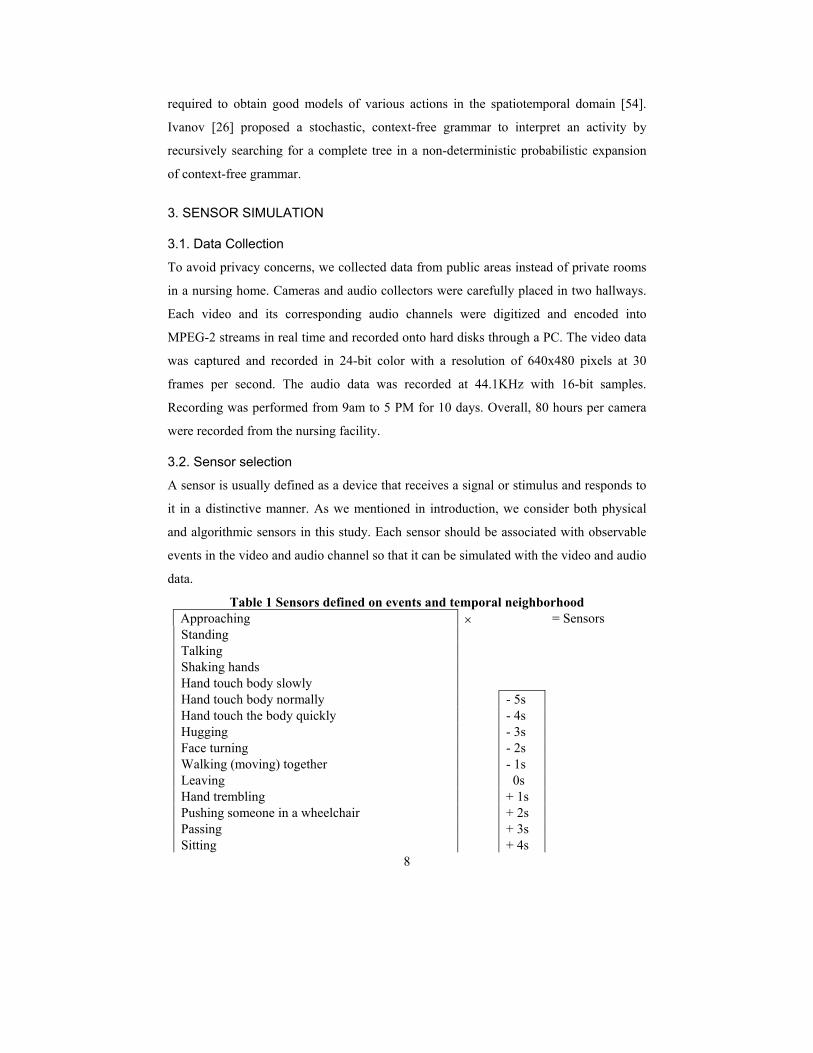
Table 1 Sensors defined on events and temporal neighborhood Approaching Standing Talking Shaking hands Hand touch body slowly Hand touch body normally - 5s Hand touch the body quickly - 4s Hugging - 3s Face turning - 2s Walking (moving) together - 1s Leaving 0s Hand trembling + 1s Pushing someone in a wheelchair + 2s Passing + 3s Sitting
×
+ 4s
= Sensors

9
Walking + 5s Hand in hand Kiss Kick Sitting down Temporal interaction reference
We select candidate sensors related to social interactions observed from the clinical
research results [58] while considering the limitations of our data collection and the
possibilities of implementation with current technologies. For example, we did not select
a sensor to detect whether or not a patient can brush his teeth because the data in the
bathroom is not available. We omitted the sensor to detect that a patient is verbally
assaulting others or a patient appears depressed because the current speech recognition
and facial expression understanding cannot provide such information. We selected 21
events listed in Table 1 and their occurrences in temporal neighborhoods as simulated
sensors. One abstract event is included in our list, called “temporal interaction reference”
to investigate the temporal referencing probability of detecting an interaction if we can
make a decision in its neighborhood.
We asked human experts (not clinical experts, just people in our research group) to watch
each video and label it second by second by selecting sensors in the Table 1. The range
of the temporal neighborhood is chosen from 5 seconds ahead to 5 seconds behind the
current frame. Overall, we obtained 230 (21×11-1) simulated sensors including 21 events
multiplied by 11 temporal neighbors, excluding the “temporal interaction reference (T-
reference)” in the current interval, which is not considered a sensor. All the sensors are
labeled as binary events since there is no ambiguity in the human experts’ judgments
during the labeling. A 1-second recording may contain more than one direct or derived
event detected by the simulated sensors.
4. STUDY OF INDIVIDUAL SENSORS
To know which sensors would be most useful, we first analyze the effectiveness of
individual sensors in detecting social interactions.
The first measure that we use to study individual sensors is information gain [47].
Information gain indicates the potential power of each sensor to predict an interaction.
We omit the details of this technique in this paper. Table 2 lists the top 42 sensors
selected by the information gain technique.

10
Table 2 Top 42 sensors selected by information gain technique 1 T-reference-1 15 Talking-2 29 Walk together+1 2 T-reference+1 16 Walking+2 30 Hand in hand 0 3 T-reference-2 17 Talking-3 31 Walk together-1 4 T-reference+2 18 Talking+2 32 Approaching+2 5 T-reference-3 19 Approaching 0 33 Hand in hand+1 6 T-reference+3 20 Walking-2 34 Walking-3 7 T-reference-4 21 Talking-4 35 Walk together+2 8 Walking 0 22 Approaching+1 36 Walk together-2 9 T-reference-5 23 Walk together 0 37 Hand in hand-1 10 T-reference+4 24 Walking+3 38 Leaving+1 11 Walking+1 25 Talking-5 39 Talking+4 12 Walking-1 26 Approaching-1 40 Leaving-1 13 T-reference+5 27 Talking+3 41 Walking+4 14 Talking+1 28 Leaving 0 42 Approaching+3
The table shows that the T-reference of an interaction has obvious temporal consistency.
Most interactions take longer than one second, and this consistency information is so
important that it occupies the top 7 ranks with respect to the information gain scores.
Besides the temporal consistency, it also shows that “walking” and “talking” are very
important cues associated with individual persons and relative location, such as
approaching, leaving, and walking together, and hand gestures are important between
two persons. These sensors are clearly important even within our daily experience.
However, some sensors, such as “hand normal” and “pushing”, which are also obvious
evidence of an interaction, have very low ranks in information gain. They either co-occur
with some high rank sensors or are omitted by the information gain technique due to a
small number of samples.
Information gain takes an empirical risk to rank the sensors, which can be biased when
training samples are redundant in some interaction patterns. For example, a long
sequence of standing conversation in the training set will tend to give “talking” and
“standing” higher ranks than a short sequence. To avoid this kind of bias, we also
analyze the power of each sensor using the structural risk based support vector machine
(SVM) method [5]. This method trains an SVM using a subset of the training set from all
sensors, and then eliminates sensors with low weight in representing the decision hyper-
plane. Because the decision hyper-plane is trained to maximize the margin between the
closest positive support vectors and negative support vectors, repeated patterns in the

11
training set do not affect the result. Therefore, it is robust to the training set which
contains a biased number of training examples for different sensors.
Table 3 lists the top 42 sensors selected by the SVM method. These 42 sensors cover 19
events in our total of 21 events. Only “sitting” and “passing” are not included. This
selection is more reasonable since the high rank sensors, such as “walk together”, “hand
touch body normally”, “talking”, “pushing”, and “hand in hand”, are obvious evidence of
an interaction.
Table 3 Top 42 sensors selected by SVM 1 T-reference+1 15 Pushing-3 29 Sit down+5 2 T-reference-1 16 Walking+2 30 Standing-1 3 Walk together 0 17 Face turning+1 31 Standing 0 4 Hand normal 0 18 Approaching 0 32 Hand in hand+1 5 Talking 0 19 Pushing-4 33 Hand in hand+3 6 Pushing 0 20 Hand normal+3 34 Pushing+2 7 Talking+1 21 Walk together+4 35 Shaking hand+2 8 Pushing+4 22 Face turning 0 36 Leaving+1 9 Hand in hand 0 23 Walk together 0 37 Walk together-5 10 Kick 0 24 Shaking hand+5 38 Face turn-1 11 Hand slow 0 25 Pushing+3 39 Approaching+5 12 Hand-trem 0 26 Hug+2 40 Standing+5 13 T-reference-2 27 Standing+2 41 Shaking hand+4 14 Leaving 0 28 T-reference+2 42 Sit down+4
The sensors with the top 2 ranks are still “judgment of an interaction” in the closest
neighborhoods. This indicates that the 1-second interval is small and precise enough for
analyzing social interactions in a nursing home environment.
In comparison with the information gain results, the sensor “talking” is a common
important sensor selected by both methods. The “walking” sensor is replaced by “walk
together” and “pushing”. They all overlap the sensor “walking”, but provide more
specific information. Hand related sensors are also ranked higher, which indicates that
social interaction may benefit from developing better hand analysis sensors.
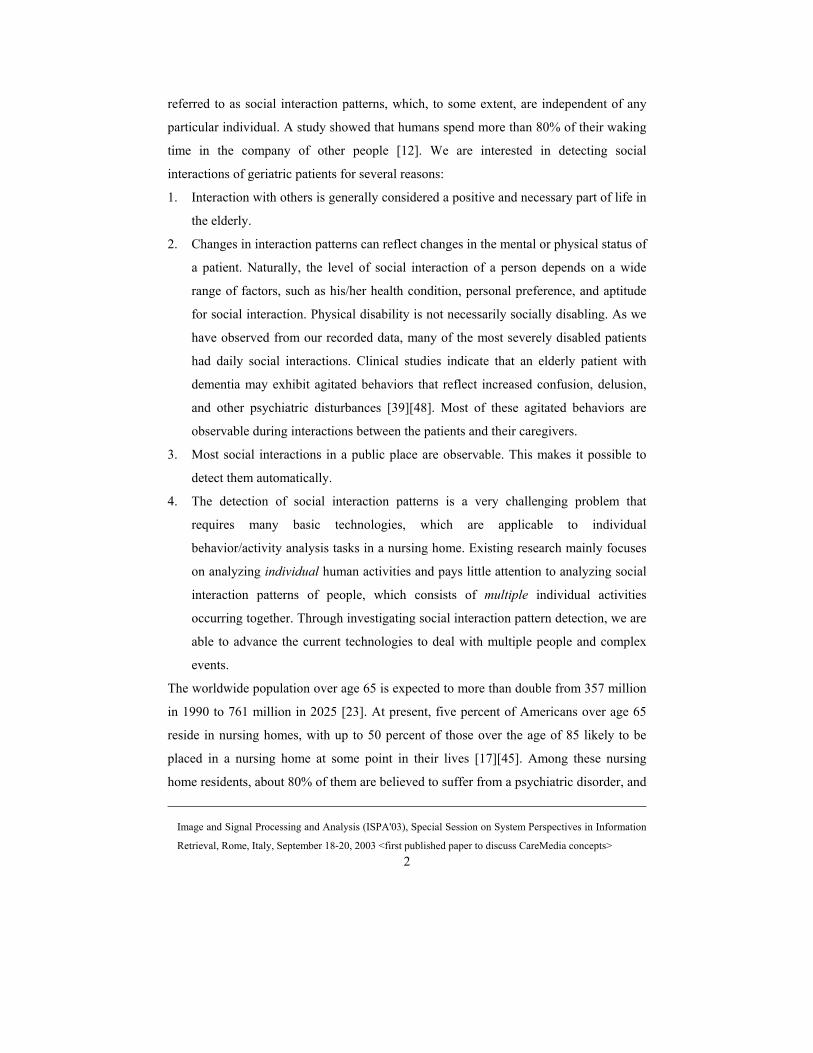
Temporal information is included in our simulated sensors. We evaluated the
effectiveness of temporal orders by averaging the two selection results together and
computing the histogram of temporal orders. Figure 2 illustrates the effectiveness of
temporal order in detecting social interactions.

12
00.05
0.10.15
0.20.25
0.3
-5 -4 -3 -2 -1 0 1 2 3 4 5Temporal order
Freq
uenc
y
top 20top 30top 40
Figure 2 Effectiveness of temporal order. Frequencies are computed by choosing the top 20, 30 and 40 sensors ranked by information gain and SVM
The effectiveness of temporal order drops quickly as the time interval between the
current event and future or past events increases. The effect of events more than 3
seconds away from the current one is very limited and provides very little useful
information for analyzing social interactions. The sensor selection only analyzes the
effectiveness of individual sensors. In the next section we will investigate the power of
combining sensors using statistical models.
5. STUDY OF DETECTION MODELS
It should be noted that there are some overlaps among simulated sensors, e.g., “walking
together” implies “walking”. The first goal of this section is to explore proper statistical
models to detect social interactions. We consider the detection of the social interaction as
a binary classification problem: interaction vs. non-interaction. The other goal of this
section is to further investigate the associations between different sensors. This will
enable us to replace some impractical sensors with combinations of sensors that can be
more easily developed.
5.1. Statistical models
Since we have considered including temporal information in the simulated sensors, the
interaction detection problem can be simplified as a problem of classifying the sensor
outputs of each 1-second interval into two classes indicating interaction and non-
interaction, respectively.
To find a proper model for classifying interactions, we evaluated various machine
learning algorithms: decision trees [43], naive Bayes classifiers [32], Bayes networks

13
[23], logistic regression [18], support vector machines [53], adaboost [35] and logitboost
[16]. We will not describe the details of these algorithms in this paper. Interested readers
can find these details in the references.
Table 4 Performances of interaction detection using different models under the ideal condition.
Model Precision Recall F-measure Decision tree 99.5% 99.2% 99.3% Naive Bayesian 98.4% 92.9% 95.6% Bayes network 98.4% 93.0% 95.6% Logistic regression 99.6% 98.7% 99.2% SVM 99.5% 99.5% 99.5% adaboost 99.7% 99.1% 99.4% logitboost 99.7% 99.1% 99.4%
The evaluations are shown in Table 4. We use equal size training and testing data. We
use a standard 5-fold cross-validation approach to find optimal parameters for each
model. We then evaluated the resulting optimal models on the testing set to report the
numbers in Table 4. Performance is reported in terms of precision, recall, and F-measure.
There are four possible test results for each event in the test set: true positive (TP), false
positive (FP), true negative (TN) and false negative (FN). Let us denote TP, FP, TN and
FN as the number of the corresponding results produced by detection. The precision is
defined as: ( )P TP TP FP= + . The recall is defined as: ( )R TP TP FN= + . The F-measure
is widely used to measure the precision and recall together, which is defined as:
2 * ( )F measure P R P R− = + .
We can see that under the ideal condition (all sensors output correct result without any
ambiguity), all these models obtain good detection results. To our surprise, the simplest
method, decision tree, employs only four kinds of sensors: “T-reference”, “talking”,
“walking” and “leaving”, but achieves very good performance. None of these sensors
except “T-reference” requires complex visual and audio analysis in comparison to the
sensors such as “face turning” and “hand in hand”. It seems there is a possibility that
social interaction can be detected by just developing good “talking”, ”walking” and
“leaving” sensors. It is true if the “T-reference” sensor can be successfully derived from
these three kinds of sensors.
To remove the effect of the temporal information of the derived sensor “T-reference”, we
assume that the “T-reference” sensor is not available to its neighbors. We remove all “T-

14
reference” sensor outputs from feature vectors and evaluate the above methods. The
results are listed in Table 5.
Table 5 Performances of interaction detection using different models under the condition of no “T-reference” sensor.
Model Precision Recall F-measure Decision tree 97.1% 96.4% 96.8% Naive Bayesian 96.3% 90.1% 93.1% Bayes network 96.3% 90.4% 93.3% Logistic regression 96.5% 94.5% 95.5% SVM 98.0% 95.1% 96.5 adaboost 95.4% 93.9% 94.6% logitboost 96.0% 95.6% 95.8%
After removing the “T-reference” sensor, the performance drop about 3-5%, which
indicates that we can achieve around 90% accuracy in detecting current interaction with
the temporal information of interaction decisions in neighborhoods. As we assume
outputs of other sensors are under the ideal condition, the real accuracy of the current “T-
reference” sensor output is expected to be about 90% of the average accuracy of all the
other sensors’ outputs.
The decision tree still achieved the best performance even without the “T-reference”
sensors. However, the resulting decision tree includes all kinds of sensors. The top 10
sensors are:
Rank Sensor Rank Sensor 1 Talking 6 Hand in hand 2 Walk together 7 Standing 3 Walking 8 Leaving 4 Pushing 9 Approaching 5 Hand normal 10 Passing
A drawback of the decision tree is that it is sensitive to noise in sensor outputs. In
practice, outputs of sensors might be ambiguous or even incorrect. Some of the sensor
outputs have to be represented by probabilities, e.g., 60% “talking” or 30% “hand in
hand”. The uncertainties of sensor outputs can only be determined from real experiments.
What we can do in a simulation is to manually add noise into outputs of sensors. Table 6
shows the result of adding 20% noise to the data without “T-reference” sensors.
Table 6 Performances of interaction detection using different models with 20% noises.
Model Precision Recall F-measure Decision tree 90.0% 90.4% 90.2% Naive Bayesian 88.6% 75.3% 81.4%

15
Bayes network 88.1% 77.6% 82.5% Logistic regression 90.1% 93.5% 91.8% SVM 91.4% 95.3% 93.3% adaboost 89.6% 93.8% 91.6% logitboost 90.1% 95.6% 92.8%
The performance of the decision tree decreases from 96.8% (F-measure) to 90.2%, or
loses 6.6% accuracy. At the same time, the performance of the SVM model decreases
from 96.5% to 93.3%, or only loses 3.2% accuracy. Notably, the recall of the SVM only
decreases 0.5% with 20% noise. The logitboost model is also shown to be robust to noisy
data. The recall of the logitboost model remains the same after adding noise. The F-
measure loses only 3% accuracy. This indicates that SVM model is potentially more
robust than the decision tree model in real applications.
Table 7 Detection of the interaction pattern “standing conversation”. Model Precision Recall F-measure Decision tree 86.0% 95.0% 90.0% Bayes network 81.4% 86.0% 83.7% SVM 87.4% 98.3% 92.8% logitboost 87.1% 98.6% 92.8%
Table 8 Detection of the interaction pattern “walking assistance”. Model Precision Recall F-measure Decision tree 95.2% 85.9% 91.0% Bayes network 85.7% 80.1% 82.9% SVM 96.0% 89.4% 92.7% logitboost 96.4% 90.1% 93.2%
Let us further define some interaction patterns in simple combinations of the sensors and
evaluate the detection models on them. We define the first interaction pattern called
“standing conversation”, which must consist of “talking” and “standing” at the same
time. The second interaction is called “walking assistance”, which contains either a
“walk together” or a “pushing”.
It should be noted that the noise level of 20% is an empirical assumption. Real sensors
will have different accuracies. To give an idea of the performance of the real sensors, we
discuss our efforts in implementing some sensors using video analysis in the next
sections.

16
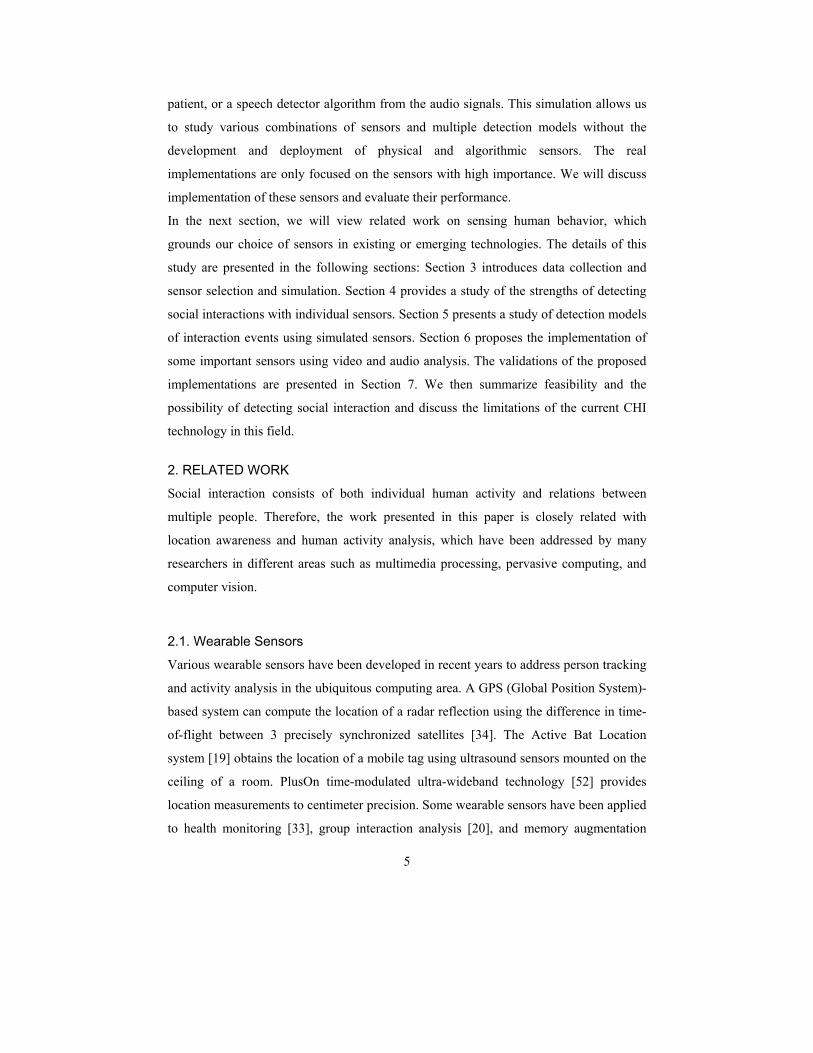
Figure 3 Sensor implementations using coarse-to-fine interaction events detection.
6. SENSOR IMPLEMENTATIONS USING VIDEO ANALYSIS
Since many geriatric patients are very sensitive to changes in their environment, we
focus on implementing sensors by automatically detecting functionally equivalent events
in video data. However, due to the low resolution of the video, we cannot detect all the
important sensors. The sensors that detect small interactions between people, such as
“hand-in-hand” and “hand normal”, cannot presently be automatically detected and will
be left to future work. Since the video contains a large amount of data, we propose a
coarse-to-fine framework (Figure 3), in which we first quickly scan the audio and video
data to detect the candidate shots that may contain any of the target events with potential
high negative false alarms, then refine the detection results and further analyze the
category of each event.
6.1. Coarse event detection
Since we only focus on multi-person activities, we developed a preprocessing algorithm
to segment audio/video streams into shots, and classify the shots into three classes: non-
activity, individual activity and multi-person activity, using audio and video event
detection techniques.
6.1.1. Video events detection
For the video channel, we use a background subtraction algorithm to detect frames that
contain human activities. To speed up this detection process, video from only one camera
Coarse event detection
Video Audio
Fine interaction events detection
Interaction events
17
in the network is used. The background of a frame is obtained by the adaptive
background method [50]. We employ a threshold to extract pixels that have high
differences between the current frame and its background. To remove noise, we group
extracted pixels into regions and only keep those regions that contain more than 15
pixels. We consider the frame f to contain a visual interaction event Vf=1 if any of the
following rules is satisfied; otherwise Vf=0:
1. There are two or more regions in the frame.
2. There is region that does not touch the bottom the frame, whose width to height
ratio is more than 0.7.
We chose these thresholds to detect as many interactions as possible without inducing
excess false alarms.
The output of the detection is reported every second. For 1 second of NTSC video, we
output the percentage of visual cues in its 30 frames as:
∑=
=30
1301
ffv vC
6.1.2. Audio event detection
To detect events using an audio stream, we use a very simple power-based method
similar to the one proposed by Clarkson and Pentland in [9][10]. This method adaptively
normalizes signal power to zero mean and unity variance using a finite-length window;
segments where the normalized power exceeds some threshold are designated “events.”
[9] and [10] describe an ambulatory system which could be exposed to arbitrary acoustic
environments; adaptive normalization allows such a system to compensate for unusually
loud or quiet environments and still detect events reliably. Our task differs from that
system in that we have a stationary system where changes in power level really do
indicate events and not just changes of venue. As such, instead of adaptive
normalization, we use global normalization. That is, a single mean and variance is
calculated for each two-hour recording and the globally-normalized power is thresholded
to detect events af.
In this implementation, we extracted 16-bit mono audio from the audio-video stream, and
used analysis windows 200ms in length with a 50% overlap. This window length results
in a frame rate of 10 frames per second, which is more than adequate to detect events

18
using the power-based approach. After signal power is calculated and normalized, it is
passed through a simple 3-frame averaging filter for smoothing. We then apply the
power threshold; any segment which exceeds the threshold is designated an event. We
also stipulate a minimum event time of 1 second in order to filter out isolated auditory
transients. The confidence of audio event per second is defined as:
∑=
=10
1101
ffa aC
6.1.3. Fusing video and audio events detection
We linearly combine the video event confidence and audio event confidence together for
final event detection:
avd CCC )1( αα −+=
We consider a 1 second frame to contain an interaction if its confidence Cd is higher
than 0.5.
To evaluate the preprocessing algorithm, we labeled 10 hours of video/audio data. Using
only video detection, we extract 33.3% of the entire video as candidate interaction shots,
which is listed in Table 9. In order to not miss any interactions, we only filter out the
one-second-long video segments with zero confidence.
Table 9 Results of event detection from video Total Event Time (second) Event Time as % of Total Signal No activity 13711 38.1% Individual 6700 18.6% Multi-person 15589 33.3%
Using only audio detection with varying thresholds, we obtained the results listed in
Table 10. The table shows the total event time and percentage of data in the recordings
using three thresholds.
Table 10 Results of event detection from audio Threshold Total Event Time (second) Event Time as % of Total Signal
1.1 6705 18.6% 1.6 5582 15.5% 2.1 4327 12.0%
By fusing the audio (threshold 1.6) and video results, we extracted total 9435 seconds
from the entire 10 hour data. In this way, 85 our of 91 interactions in the ground truth are

19
covered by the candidate shots, which obtain reasonable recall and precision in terms of
event time as listed in Table 11. The audio has a lower recall due to the presence of silent
interactions such as walking assistance of a wheelchair-bound patient. The audio
precision is actually higher in general than is reported here. The hallway environment is a
poor representative of audio precision, as many events that are audible in the hallway are
off-camera and not in the ground-truth labels; thus audio event detection generates many
false alarms. Even so, our results show that by fusing audio and video results, we can
achieve more than 90% recall and 20% precision. We project even better precision when
we test our fused system over the entire set of the data.
Table 11 Coarse detection results Recall Precision Process speed Video 98% 13% real time Audio 71% 28% 10% real time Multimodal 92% 21%
6.2. Fine event detection
In this step, we not only refine the coarse detection result, but also associate the detected
events with target sensors. The audio events detected in the coarse detection step are
simply associated with the “talking” sensor outputs. The fine detection focuses on only
the video data. Our simulations show that the interaction related sensors are very
dependent on each other. Detailed study shows that there are three dependencies:
1. Some interaction events rely on events associated with individual persons. 2. Different events may share the same features in the detection. 3. Some features can only be extracted from the interaction between two people and
therefore also depend on the events that only associated with these two individual persons.

20
Figure 4 Context hierarchy of interaction event detection in a nursing home
To take advantage of these dependencies, we have come up with a four-level context
hierarchy for representing daily activities of patients, staff, and visitors. From bottom to
top, the four levels are conceptual element (CE), individual person activity event (IE),
group activity feature and event (GE), and social interaction (SI), which are illustrated in
Figure 4.
The conceptual elements consist of entities that are objects of interest to us, and some
features of entities. The entities of a nursing home concerning us are doors, people, and
faces. The attributes are features for measuring motions and visual appearances of an
entity. We use five visual features: location, moving direction, speed, color, and shape, as
explained in Table 12. We will discuss the implementation details of entity detection and
feature extraction in the next section.
Table 12 Features of individual entity in a nursing home Attributes Definition Location (E) Describing the physical location of the entity “E”. Moving direction (E) Describing the moving direction of the entity “E”. Speed (E) Describing the moving speed of the entity “E”. Color (E) The entity “E” has skin color. Front face (person) Front face has been detected for the person. Shape (E) Shape information of the entity “E”
An individual person activity event (IE) is defined as a combination of a person entity
and a sequence of attributes. For example, the IE “Walking (A)” indicates person A with
Standing conversation Passing
Walking assistance
Distance Relative speed Relative moving
direction
Walking Standing Talking Sitting
Location Moving direction Speed Shape Color
…
…
Conceptual elements
Individual activity event
Groupactivity features
Interaction Events

21
a sequence of changing locations. Table 13 has listed some IEs in a hallway of a nursing
home. Most of the IEs can be associated with the sensors we need to implement.
Table 13 Some common individual activity events (IEs) in a nursing home. Individual people activity events Definition Walking (person) Associates to a sensor Sitting (person) Associates to a sensor Standing (person) Associates to a sensor Door used (door) Some entities are passing the door. Face turning (person) Associates to a sensor
Group activity features (GFs) are combinations of IEs that involve two individual person
entities as listed in Table 14. GFs are features of relative motions of two IEs. These
features that measure relative distance or walking directions between two people, for
example, the “distance (A, B)” measures the distance between person A and person B.
Table 14 A list of group activity features and events (GEs) Group activity features and events (GEs)
Definition
Distance (person A, person B) Distance between A and B, which can be deduced to three categories: approaching, distance close, and leaving.
Relative direction (person A, person B)
Relative moving direction between A and B.
Lower speed (person A, person B) A reduces his/her speed for B.
A group interaction event (GE) is a segment of a story (a meaningful sequence of
video/audio) of human activities consisting of a group of individual activity events and
group activity features. For example, a story of a typical conversation in the hallway can
be partitioned into three segments:
1. Person A and person B approach to each other;
2. A and B are talking.
3. A and B walk out of the hallway together or separately.
Theoretically, if the observation time and the number of people involved are not limited,
the number of possible interactions can be quite large. In this paper, we are only
interested with five events as listed in Table 14.
22
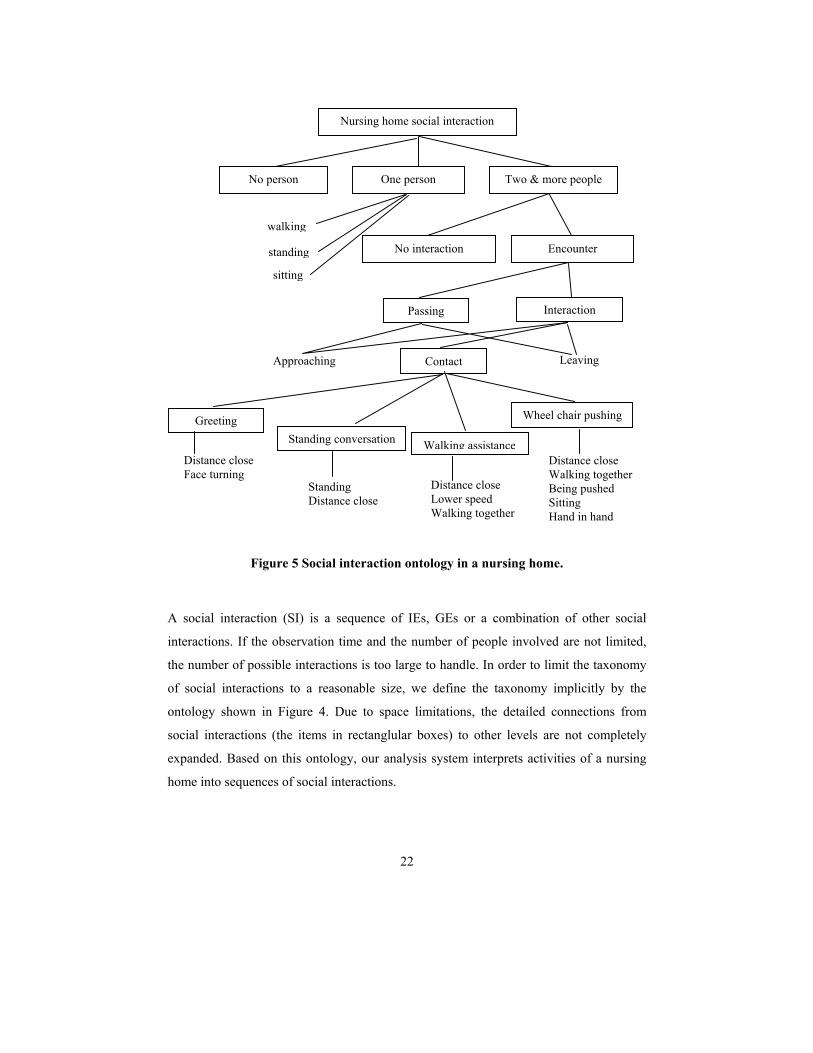
Figure 5 Social interaction ontology in a nursing home.
A social interaction (SI) is a sequence of IEs, GEs or a combination of other social
interactions. If the observation time and the number of people involved are not limited,
the number of possible interactions is too large to handle. In order to limit the taxonomy
of social interactions to a reasonable size, we define the taxonomy implicitly by the
ontology shown in Figure 4. Due to space limitations, the detailed connections from
social interactions (the items in rectanglular boxes) to other levels are not completely
expanded. Based on this ontology, our analysis system interprets activities of a nursing
home into sequences of social interactions.
Nursing home social interaction
No interaction
Passing Interaction
Approaching Leaving
No person One person Two & more people
walking
standing
sitting
Encounter
Contact
Standing conversationGreeting Wheel chair pushing
Walking assistanceDistance close Face turning
Standing Distance close
Distance close Lower speed Walking together
Distance close Walking together Being pushed Sitting Hand in hand

23
6.2.1. Entity Detection
We manually labeled the position of all the doors and entrances of the hallway. An entity
that appears close to one of these doors and entrances for the first time is initialized and
tracked in the hallway. We consider a region extracted in the pre-segmentation step as an
entity if it contains skin color pixels in the top 30% of the whole region. The skin color is
modeled as a Gaussian mixture [56]. The location and moving direction features can be
extracted directly from the tracking results. The appearance features, color and shape, are
extracted from key-frames.
Figure 6 3D tracking with a camera network.
6.2.2. Entity tracking and related feature extraction
Since occlusions happen frequently in the narrow hallway, we use a particle filtering
base, multiple cameras framework to track human movement. This framework uses one
or more cameras to cover the target area. The location of a person in 3D space is obtained
by integrating tracking confidence in the images grabbed from the cameras. Instead of
using a traditional stereo algorithm, this 3D location recovery task uses a new tracking
algorithm, which can robustly compensate tracking cues from different numbers of
cameras.
A camera network consists of multiple cameras covering the interesting areas in the
nursing home as illustrated in Figure 6. A simple pinhole model is used for all the
cameras. We calibrate the cameras off-line and we don’t move them once they are
calibrated. After calibrating the intrinsic and extrinsic parameters, we can map a spatial
point L(X,Y,Z) in 3D world coordinates to its corresponding point li(x,y) in the image
L (X,Y,Z)
l1 (x,y)
O1 O2
O3
3D path
2D
path
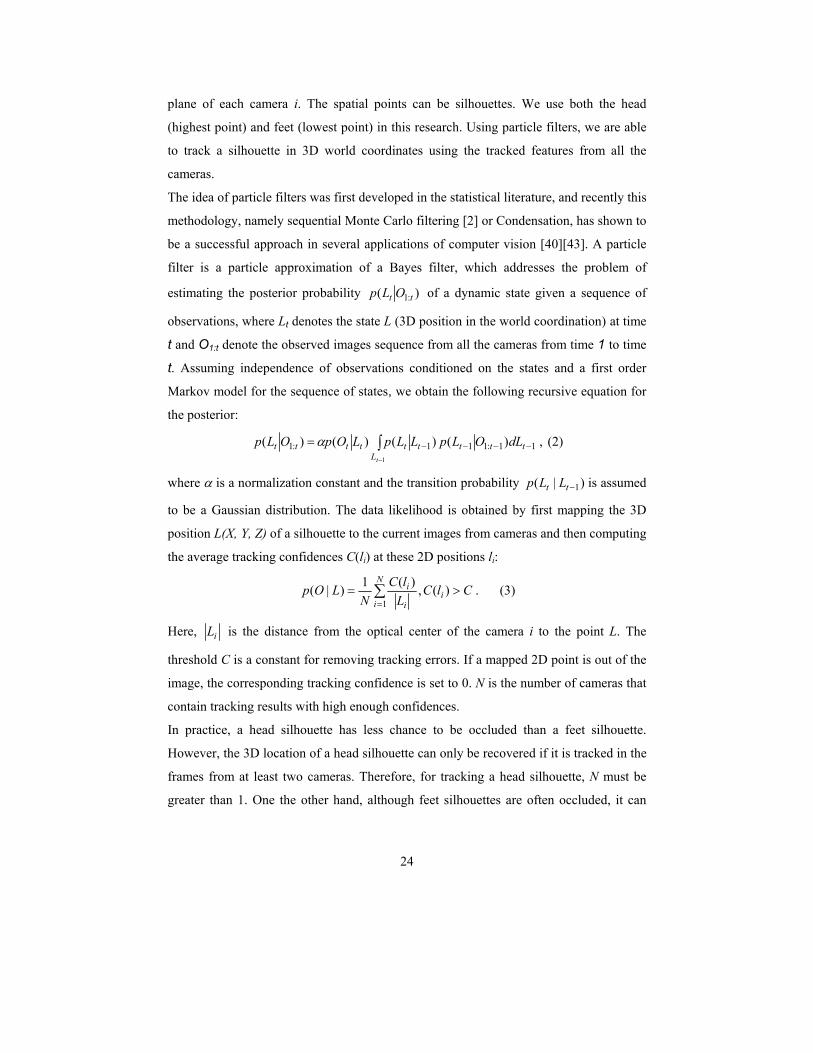
24
plane of each camera i. The spatial points can be silhouettes. We use both the head
(highest point) and feet (lowest point) in this research. Using particle filters, we are able
to track a silhouette in 3D world coordinates using the tracked features from all the
cameras.
The idea of particle filters was first developed in the statistical literature, and recently this
methodology, namely sequential Monte Carlo filtering [2] or Condensation, has shown to
be a successful approach in several applications of computer vision [40][43]. A particle
filter is a particle approximation of a Bayes filter, which addresses the problem of
estimating the posterior probability )( :1 tt OLp of a dynamic state given a sequence of
observations, where Lt denotes the state L (3D position in the world coordination) at time
t and O1:t denote the observed images sequence from all the cameras from time 1 to time
t. Assuming independence of observations conditioned on the states and a first order
Markov model for the sequence of states, we obtain the following recursive equation for
the posterior:
∫−
−−−−=1
11:111:1 )()()()(tL
ttttttttt dLOLpLLpLOpOLp α , (2)
where α is a normalization constant and the transition probability )|( 1−tt LLp is assumed
to be a Gaussian distribution. The data likelihood is obtained by first mapping the 3D
position L(X, Y, Z) of a silhouette to the current images from cameras and then computing
the average tracking confidences C(li) at these 2D positions li:
∑=
>=N
ii
i
i ClCLlC
NLOp
1)(,)(1)|( . (3)
Here, iL is the distance from the optical center of the camera i to the point L. The
threshold C is a constant for removing tracking errors. If a mapped 2D point is out of the
image, the corresponding tracking confidence is set to 0. N is the number of cameras that
contain tracking results with high enough confidences.
In practice, a head silhouette has less chance to be occluded than a feet silhouette.
However, the 3D location of a head silhouette can only be recovered if it is tracked in the
frames from at least two cameras. Therefore, for tracking a head silhouette, N must be
greater than 1. One the other hand, although feet silhouettes are often occluded, it can
25
recover its 3D location of a person from one camera. This is very important in the case
that a person is only visible in only one camera.
Following the idea of a particle filter, the posterior )( :1 tt OLp is approximated by a set of
weighted samples of locations L. The weight of a location is defined as its data
likelihood. The initial weighted sample set contains only one state L0, which is obtained
by performing a full search around the 3D position near the entrance where the person is
initialized. Then, for each frame 100 new samples are generated and their confidences
are computed. To keep the size of the weighted sample set, among these 100 new
samples, the first 50 samples with the highest confidence are then treated as the new
weighted sample set for the next frame. The final current tracked position is set to be the
value of the sample (3D location) with the highest confidence.
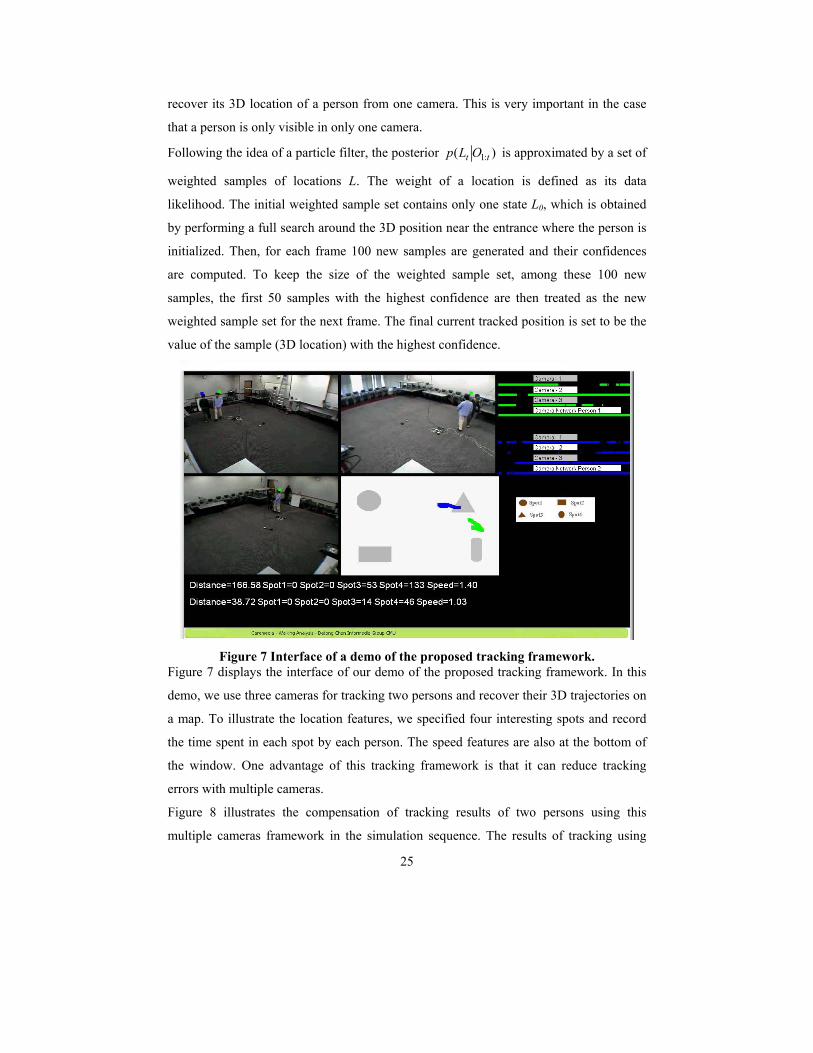
Figure 7 Interface of a demo of the proposed tracking framework.
Figure 7 displays the interface of our demo of the proposed tracking framework. In this
demo, we use three cameras for tracking two persons and recover their 3D trajectories on
a map. To illustrate the location features, we specified four interesting spots and record
the time spent in each spot by each person. The speed features are also at the bottom of
the window. One advantage of this tracking framework is that it can reduce tracking
errors with multiple cameras.
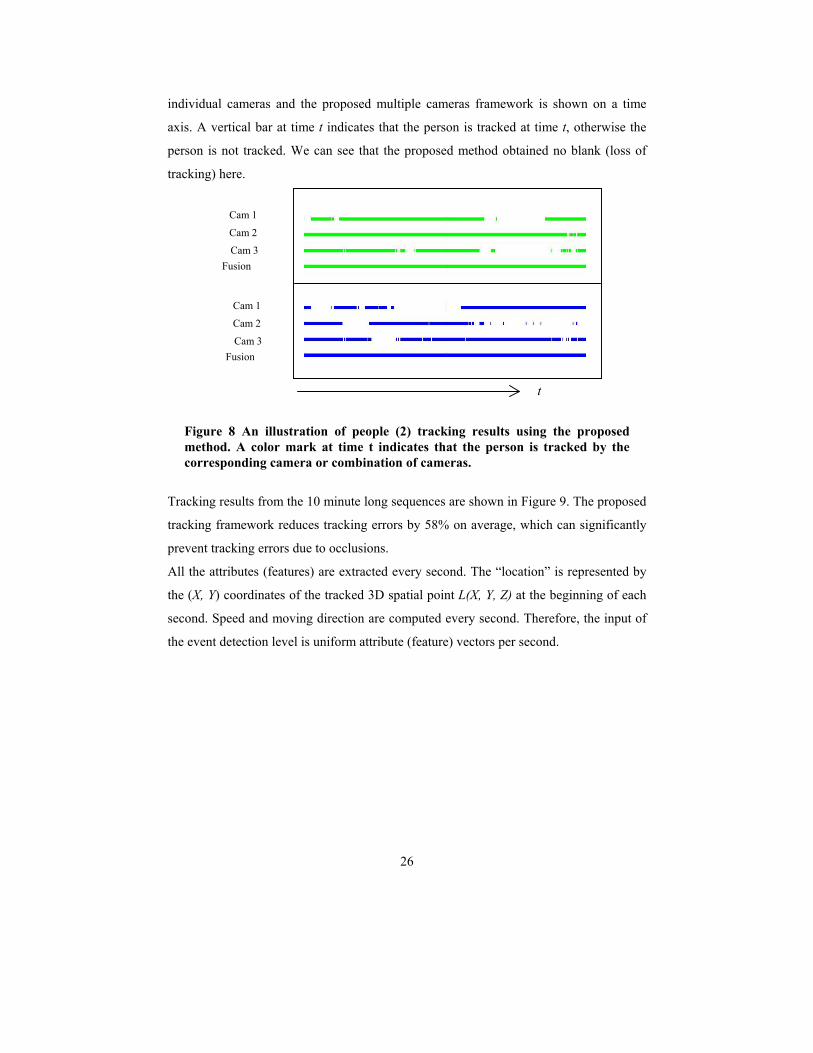
Figure 8 illustrates the compensation of tracking results of two persons using this
multiple cameras framework in the simulation sequence. The results of tracking using
26
individual cameras and the proposed multiple cameras framework is shown on a time
axis. A vertical bar at time t indicates that the person is tracked at time t, otherwise the
person is not tracked. We can see that the proposed method obtained no blank (loss of
tracking) here.
Figure 8 An illustration of people (2) tracking results using the proposed method. A color mark at time t indicates that the person is tracked by the corresponding camera or combination of cameras.
Tracking results from the 10 minute long sequences are shown in Figure 9. The proposed
tracking framework reduces tracking errors by 58% on average, which can significantly
prevent tracking errors due to occlusions.
All the attributes (features) are extracted every second. The “location” is represented by
the (X, Y) coordinates of the tracked 3D spatial point L(X, Y, Z) at the beginning of each
second. Speed and moving direction are computed every second. Therefore, the input of
the event detection level is uniform attribute (feature) vectors per second.
Cam 1
Cam 2
Cam 3 Fusion
Cam 1
Cam 2
Cam 3 Fusion
t
27
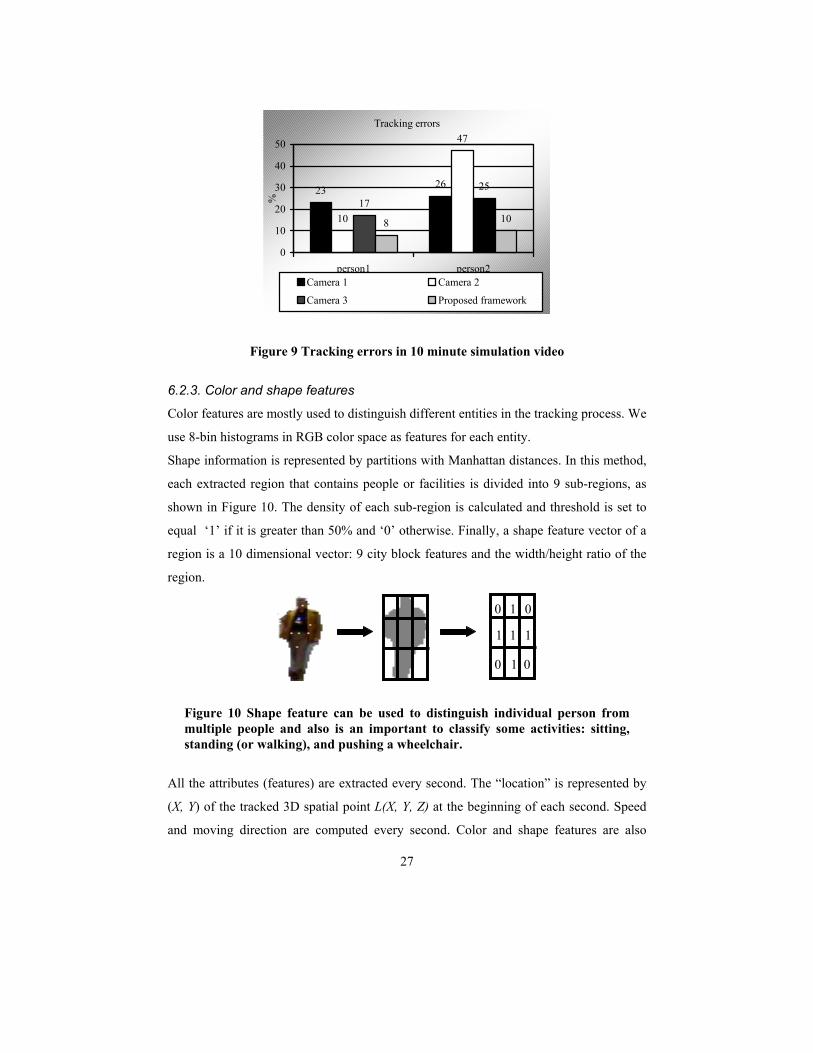
Figure 9 Tracking errors in 10 minute simulation video
6.2.3. Color and shape features
Color features are mostly used to distinguish different entities in the tracking process. We
use 8-bin histograms in RGB color space as features for each entity.
Shape information is represented by partitions with Manhattan distances. In this method,
each extracted region that contains people or facilities is divided into 9 sub-regions, as
shown in Figure 10. The density of each sub-region is calculated and threshold is set to
equal ‘1’ if it is greater than 50% and ‘0’ otherwise. Finally, a shape feature vector of a
region is a 10 dimensional vector: 9 city block features and the width/height ratio of the
region.
Figure 10 Shape feature can be used to distinguish individual person from multiple people and also is an important to classify some activities: sitting, standing (or walking), and pushing a wheelchair.
All the attributes (features) are extracted every second. The “location” is represented by
(X, Y) of the tracked 3D spatial point L(X, Y, Z) at the beginning of each second. Speed
and moving direction are computed every second. Color and shape features are also
1
11 1
1
00
0 0
Tracking errors
23 26
10
47
1725
8 10
0
10
20
30
40
50
person1 person2%
Camera 1 Camera 2
Camera 3 Proposed framework

28
extracted from the first frame of each second. Therefore, the input of the event detection
level is uniform attribute (feature) vectors per second.
6.2.4. IE and GE Detection
Each IE is modeled individually using Gaussian mixture models (GMMs). The training
can be done using the standard EM algorithm [20]. A special case is that the event “being
pushed” is considered to be an IE due to the difficulty of segmenting the wheelchair and
the person who is pushing the wheelchair. A similar concept is also reused at the higher
level but conditioned by other events or interactions. In order to train good models using
limited training data, we perform feature selection using 2χ for each event for reducing
the feature space.
Some GEs require temporal information and are modeled by hidden Markov models
(HMMs) based on individual event detection and raw features, such as “approaching”,
“leaving”, and “lower speed”. Others are modeled using GMMs directly based on
features. When raw features are used, the input of a social event detector is two feature
vector sequences from different persons.
7. EXPERIMENTAL RESULTS WITH THE IMPLEMENTED SENSORS
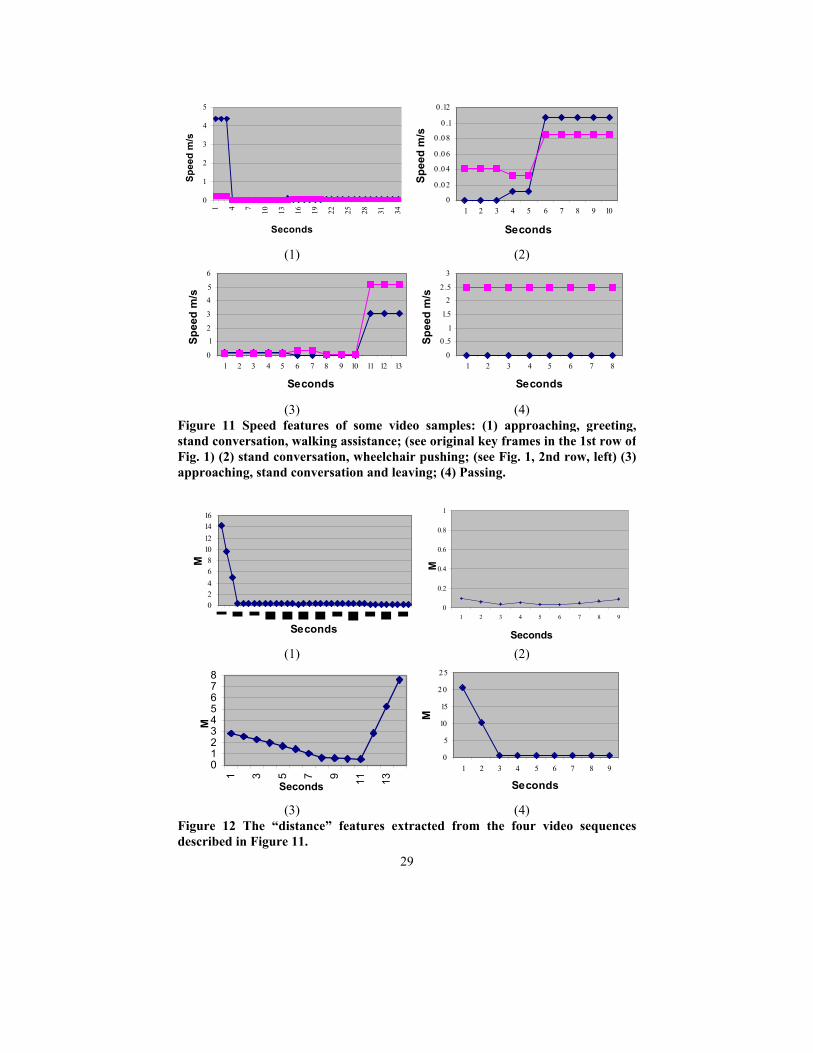
To evaluate the proposed framework, we first show some examples of the features we
extracted from video. Figure 11 shows the speed features extracted from four video
shots. Different scales are used for the Y axis in the figures in order to show the results in
as much detail as possible. Each video shot contains interactions between two people.
Video (1) shows that a person A meets a person B in the hallway. They hug each other
and then stand and talk to each other for a while. Finally, the person B accompanies the
person A walking towards the entrance. Using the concepts defined in our ontology,
video (1) can be simply represented as: “approaching(A, B) - hugging(A, B) - stand
conversation(A, B) - walking assistance(B, A)”. Concisely, we can omit the subjects
(persons) and interpret the video (2-4) as: (2) standing conversation - wheelchair
pushing; (3) approaching - standing conversation - leaving; (4) passing includes
approaching - distance close - leaving.
29
0
1
2
3
4
5
1 4 7 10 13 16 19 22 25 28 31 34
Seconds
Spee
d m
/s0
0 .0 2
0 .0 4
0 .0 6
0 .0 8
0 .1
0 .12
1 2 3 4 5 6 7 8 9 10
Seconds
Spee
d m
/s
(1) (2)
0
12
3
45
6
1 2 3 4 5 6 7 8 9 10 11 12 13
Seconds
Spee
d m
/s
0
0 .51
1.5
22 .5
3
1 2 3 4 5 6 7 8
Seconds
Spee
d m
/s
(3) (4)
Figure 11 Speed features of some video samples: (1) approaching, greeting,stand conversation, walking assistance; (see original key frames in the 1st row ofFig. 1) (2) stand conversation, wheelchair pushing; (see Fig. 1, 2nd row, left) (3)approaching, stand conversation and leaving; (4) Passing.
02468
10121416
Seconds
M
0
0.2
0.4
0.6
0.8
1
1 2 3 4 5 6 7 8 9
Seconds
M
(1) (2)
012345678
1 3 5 7 9 11 13Seconds
M
0
5
10
15
2 0
25
1 2 3 4 5 6 7 8 9
Seconds
M
(3) (4)
Figure 12 The “distance” features extracted from the four video sequencesdescribed in Figure 11.

30
Figure 12 and Figure 13 illustrate the “distance”, and “relative direction” features of the
four video shots. We can observe there are some errors in the figures, for example the
relative moving direction of the first video has an obvious noise point in Figure 13. The
errors are caused by precision of the tracking algorithm and the calibration of the camera
network. Fortunately, the errors can be controlled within a small range.
Relative direction
00.5
11.5
22.5
33.5
1 4 7 10 13 16 19 22 25 28 31 34
time - seconds
angl
e 1
2
3
4
Figure 13 The “relative moving direction” features extracted from the fourvideo sequences described in Figure 11
Table 15 Results of sensor implementation using the proposed video and audio event detections
Sensor Precision Recall F-measure Talking 60% 72% 66% Walk together 89% 91% 90% Walking 99% 99% 99% Pushing 52% 75% 64% Leaving 99% 68% 84% Approaching 99% 63% 81% Passing 38% 84% 61%
The events are detected based on the features in our database and then associated with
the sensors. Table 15 lists the performance of some sensors implemented by our video
and audio event detections in terms of 1-second intervals. Three sensors obtain high
precision: “walking”, “leaving” and “approaching”, which benefit from our tracking
algorithm. The recall of “leaving” and “approaching” are relatively low because there is
no sensor associated with the “distance close” event and all the detected “distance close”
events are randomly classified into the “leaving” and the “approaching” sensor outputs.
This also leads a low precision of the “passing” sensor since the HMM for the “passing”
event only models the temporal information between two consecutive intervals. Most of
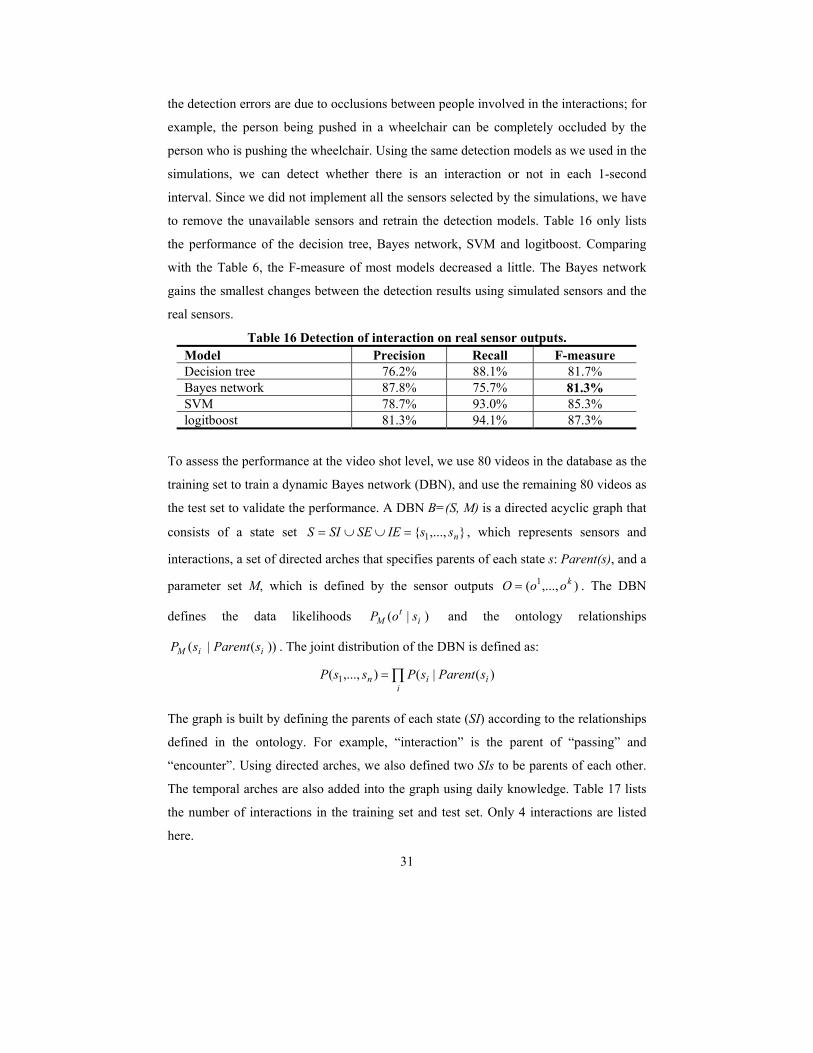
31
the detection errors are due to occlusions between people involved in the interactions; for
example, the person being pushed in a wheelchair can be completely occluded by the
person who is pushing the wheelchair. Using the same detection models as we used in the
simulations, we can detect whether there is an interaction or not in each 1-second
interval. Since we did not implement all the sensors selected by the simulations, we have
to remove the unavailable sensors and retrain the detection models. Table 16 only lists
the performance of the decision tree, Bayes network, SVM and logitboost. Comparing
with the Table 6, the F-measure of most models decreased a little. The Bayes network
gains the smallest changes between the detection results using simulated sensors and the
real sensors.
Table 16 Detection of interaction on real sensor outputs. Model Precision Recall F-measure Decision tree 76.2% 88.1% 81.7% Bayes network 87.8% 75.7% 81.3% SVM 78.7% 93.0% 85.3% logitboost 81.3% 94.1% 87.3%
To assess the performance at the video shot level, we use 80 videos in the database as the
training set to train a dynamic Bayes network (DBN), and use the remaining 80 videos as
the test set to validate the performance. A DBN B=(S, M) is a directed acyclic graph that
consists of a state set },...,{ 1 nssIESESIS =∪∪= , which represents sensors and
interactions, a set of directed arches that specifies parents of each state s: Parent(s), and a
parameter set M, which is defined by the sensor outputs ),...,( 1 kooO = . The DBN
defines the data likelihoods )|( it
M soP and the ontology relationships
))(|( iiM sParentsP . The joint distribution of the DBN is defined as:
∏=i
iin sParentsPssP )(|(),...,( 1
The graph is built by defining the parents of each state (SI) according to the relationships
defined in the ontology. For example, “interaction” is the parent of “passing” and
“encounter”. Using directed arches, we also defined two SIs to be parents of each other.
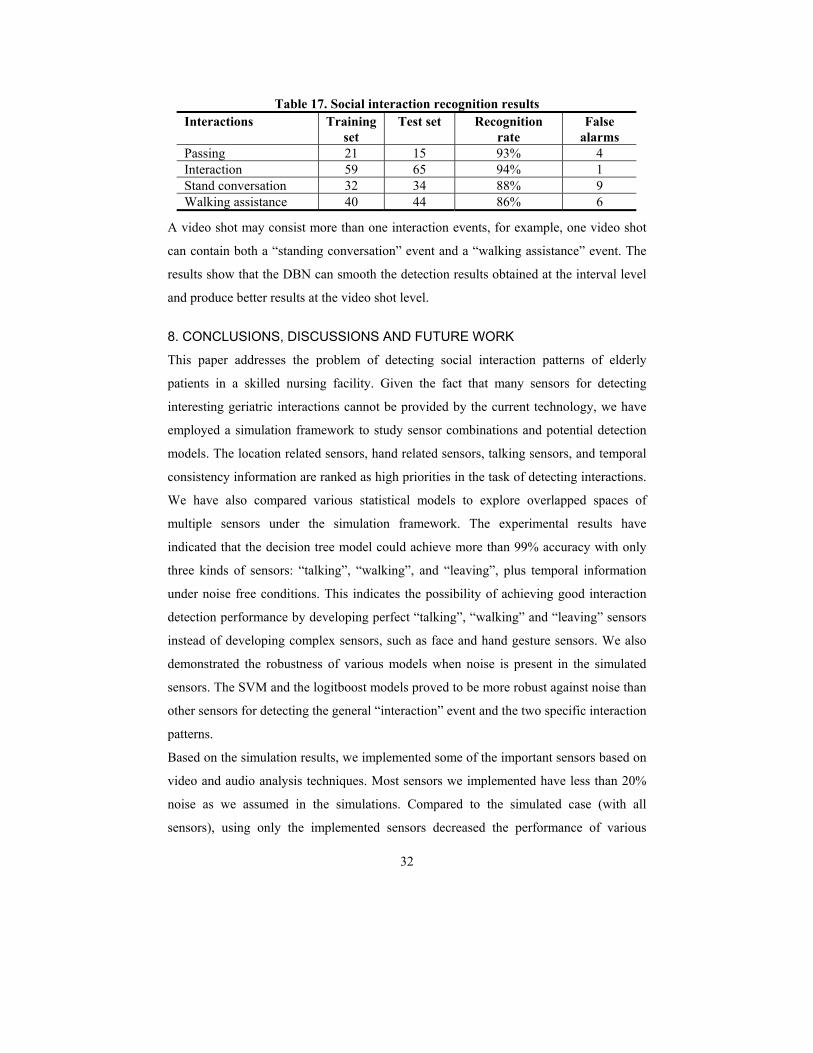
The temporal arches are also added into the graph using daily knowledge. Table 17 lists
the number of interactions in the training set and test set. Only 4 interactions are listed
here.
32
Table 17. Social interaction recognition results Interactions Training
set Test set Recognition
rate False
alarms Passing 21 15 93% 4 Interaction 59 65 94% 1 Stand conversation 32 34 88% 9 Walking assistance 40 44 86% 6
A video shot may consist more than one interaction events, for example, one video shot
can contain both a “standing conversation” event and a “walking assistance” event. The
results show that the DBN can smooth the detection results obtained at the interval level
and produce better results at the video shot level.
8. CONCLUSIONS, DISCUSSIONS AND FUTURE WORK
This paper addresses the problem of detecting social interaction patterns of elderly
patients in a skilled nursing facility. Given the fact that many sensors for detecting
interesting geriatric interactions cannot be provided by the current technology, we have
employed a simulation framework to study sensor combinations and potential detection
models. The location related sensors, hand related sensors, talking sensors, and temporal
consistency information are ranked as high priorities in the task of detecting interactions.
We have also compared various statistical models to explore overlapped spaces of
multiple sensors under the simulation framework. The experimental results have
indicated that the decision tree model could achieve more than 99% accuracy with only
three kinds of sensors: “talking”, “walking”, and “leaving”, plus temporal information
under noise free conditions. This indicates the possibility of achieving good interaction
detection performance by developing perfect “talking”, “walking” and “leaving” sensors
instead of developing complex sensors, such as face and hand gesture sensors. We also
demonstrated the robustness of various models when noise is present in the simulated
sensors. The SVM and the logitboost models proved to be more robust against noise than
other sensors for detecting the general “interaction” event and the two specific interaction
patterns.
Based on the simulation results, we implemented some of the important sensors based on
video and audio analysis techniques. Most sensors we implemented have less than 20%
noise as we assumed in the simulations. Compared to the simulated case (with all
sensors), using only the implemented sensors decreased the performance of various

33
detection models but still achieved more than 80% accuracy. We have also shown that by
using high level temporal smoothing, the detection performance can be improved at the
video shot level.
Many sensors could not be implemented in the work described in this paper, due to low
resolution of the video and occlusions; for example, the hand gesture sensors. A camera
network that consists of a combination of far view and close view cameras may offer a
solution to low resolution in the future. Occlusion is still a big challenge. The “talking”
detection results are noisy when people speak in the rooms connected to the hallway. A
microphone array may filter out the voices from other locations and provide better audio
channels. However, how much information can be provided by speech recognition is still
in question. Besides the sensors from video and audio channels, an accurate motion
sensor could also be able to detect small hand motions. Head gesture analysis for moving
people in a distance is also a research effort in the future.
ACKNOWLEDGEMENTS
This research is supported by the National Science Foundation (NSF) under Grant No.
IIS-0205219. The authors would like to thank their colleagues in the Informedia for their
valuable discussions and support.
9. REFERENCES
[1] Aggarwal, J. K., Cai, Q. Human Motion Analysis: A Review. Computer Vision and Image Understanding, Vol. 73, pp. 428-440, 1999.
[2] Ahrens, K., Chung, S. F., and Huang, C. “Conceptual Metaphors: Ontology-based Representation and Corpora Driven Mapping Principles”. In Proceedings of the ACL Workshop on the Lexicon and Figurative Language.
[3] Ayers, D., Shah, M. Monitoring Human Behavior from Video Taken in an Office Environment. Image and Vision Computing, Vol. 19, pp. 833-846, 2001.
[4] Badler, N. Temporal Scene Analysis: Conceptual Description of Object Movements. University of Toronto Technical Report No. 80, 1975.
[5] Brank, J., Grobelnik, M., Milic-Frayling, N. and Mladenic, D. Feature selection using linear support vector machines. MSR-TR-2002-63, Microsoft research 2002.
[6] Bregler, C. Learning and Recognizing Human Dynamics in Video Sequences. In CVPR, pages 568-574, 1997.
[7] Brumitt, B., Krumm, J., Meyers, B. and Shafer, S. Ubiquitous computing and the role of geometry. In Special Issue on Smart Spaces and Environments, volume 7-5, pages 41-43. IEEE Personal Communications, October 2000.
[8] Carp, F. Assessing the environment. Annul review of gerontology and geriatrics, 14, pages: 302-314, 1994.
34
[9] Clarkson, B. and Pentland, A. Framing Through Peripheral Perception. Proc. of ICIP, Vancouver, September 2000.
[10] Clarkson, B. and Pentland, A. Unsupervised Clustering of Ambulatory Audio and Video. Proc. of the ICASSP, Phoenix, 1998.
[11] Davis, J. W. and Bobick, A. F. The Representation and Recognition of Human Movement Using Temporal Templates. In Proc. of CVPR, pp. 928-934, 1997.
[12] Emler N., Gossip, reputation, and social adaptation. In R.F.Goodman and A. Ben-Ze'ev (Eds.) Good Gossip, pages.117-138. Wichita, Kansas, USA: University Press of Kansas 1994
[13] Eppig, F. J. and Poisal, J. A. Mental health of medicare beneficiaries: 1995. Health Care Financing Review, 15, pages: 207-210, 1995.
[14] Essa, I. and Pentland, A. Facial expression recognition using a dynamic model and motion energy. In Proc. 5th Intl. Conf. on Computer Vision, pages 360--367, 1995.
[15] Freeman, W. T. and Roth, M. Orientation histograms for hand gesture recognition. In International Workshop on Automatic Face and Gesture Recognition, pages 296-301, June 1995.
[16] Friedman, J., Hastie, T. and Tibshirani, R. Additive logistic regression: a statistical view of boosting. Annals of Statistics, 28:307--337, 2000.
[17] German, P.S., Rovner, B.W., Burton, L.C., Brant, L.J. and Clark, R. The role of mental morbidity in the nursing home experience. Gerontologist, 32(2): 152-158, 1992.
[18] Hastie, T. and Tibshirani, R. Nonpararmetric logistic and proportional odds regression. Applied statistics 36:260-276, 1987.
[19] Harter, A., Hopper, A., Steggles, P., Ward, A. and Webster, P. The anatomy of a context-aware application. In Proceedings of the 5th Annual ACM/IEEE International Conference on Mobile Computing and Networking, pages 59-68, Seattle, WA, August 1999.
[20] Hartley, H. “Maximum likelihood estimation from incomplete data”. Bio-metrics, 14:174–194, 1958.
[21] Holmquist, L., Falk, J. and Wigstrm, J. Supporting group collaboration with interpersonal awareness devices. Personal Technologies, 3:13–21, 1999.
[22] Hongeng, S., Nevatia, R. Multi-Agent Event Recognition. International Conference on Computer Vision, pp. 84-91, 2001.
[23] Hooyman, N.R. and Kiyak, H.A. Social Gerontology: A Multidisciplinary Perspective. 6th ed., Allyn and Bacon 2002.
[24] Hudson, S., Fogarty, J., Atkeson, C., Avrahami, D., Forlizzi, J., Kiesler, S., Lee, J. and Yang, J. Predicting Human Interruptibility with Sensors: A Wizard of Oz Feasibility Study. In Proc. of the SIGCHI Conference on Human Factors in Computing Systems, pages 257-264 2003.
[25] Intille, S. and Bobick, A. Recognizing planned, multi-person action. Computer Vision and Image Understanding, vol. 81, no. 3, pp. 414-445, March 2001
[26] Ivanov, Y. A. and Bobick, A. F. Recognition of Visual Activities and Interactions by Stochastic Parsing. IEEE Transactions of Pattern Analysis and Machine Intelligence, Vol. 22, pp. 852-872, 2000.
[27] Jebara, T., Pentland, A. Action Reaction Learning: Analysis and Synthesis of Human Behavior. IEEE Workshop on the Interpretation of Visual Motion, 1998.

35
[28] Jug, M., Pers, J., Dezman, B. and Kovacic, S. Trajectory based assessment of coordinated human activity. In ICVS 2003, pages 534–543, 2003.
[29] Kidd, C. D., Orr, R., Abowd, G. D., Atkeson, C. G., Essa, I. A., Macintyre, B., Mynatt, E. and Starner, T. E. and Newstetter, W. The Aware Home: A Living Laboratory for Ubiquitous Computing Research. Proc. of CoBuild '99, pp.191-198, 1999.
[30] Koile, K., Tollmar, K., Demirdjian, D., Shrobe, H. E., Darrell, T. Activity Zones for Context-Aware Computing. Ubicomp 2003, pp. 90-106, 2003.
[31] Kojima, A., Tamura, T. Natural Language Description of Human Activities from Video Images Based on Concept Hierarchy Actions. International Journal of Computer Vision, Vol. 50, pp. 171-184, 2001.
[32] Kononenko I., Semi-naive bayesian classifier. In Proceedings of sixth European Working Session on Learning, pages 206-219. Springer-Verlag, 1991.
[33] Lee, S. and Mase, K. Activity and location recognition using wearable sensors. In 1st IEEE International Conference on Pervasive Computing and Communications, pages 24–32, 2002.
[34] Lubinski, R. Dementia and communication. Philadelphia: B. C. Decker, 1991. [35] Margineantu, D. D. and Dietterich, T. G. Pruning adaptive boosting. In 14th Int.
Conf. on Machine Learning, pages 211-218. Morgan Kaufmann, 1997. [36] Martin, A., Karrray, L. and Gilloire, A. High Order Statistics for Robust
Speech/Non-Speech Detection. In Eusipco, Tampere, Finland, Sept. 2000, pp. 469--472.
[37] McCowan, I., Gatica-Perez, D., Bengio, S., Lathoud, G., Barnard, M. and Zhang, D. Automatic Analysis of Multi-modal Group Actions in Meetings. IEEE Transactions on PAMI, 2004.
[38] Moore, D. J., Essa, I. A., Hayes, M. H. Exploiting Human Actions and Object Context for Recognition Tasks. Proc. of ICCV, Vol. 1, pp. 80-86, 1999.
[39] Nelson, J. The influence of environmental factors in incidents of disruptive behavior. Journal of Gerontological Nursing 21(5):19-24, 1995.
[40] Nummiaro, K., Koller-Meier, E., and Van Gool, L. Object tracking with an adaptive color-based particle filter. In Proc. Symposium for Pattern Recognition of the DAGM, Sep. 2000.
[41] Oliver, N., Garg, A., Horvitz, E. Layered Representation for Learning and Inferring Office Activity from Multiple Sensory Channels. Fourth IEEE Conference on Multimodal Interfaces, pages 3-8, 2002.
[42] Oliver, N. M., Rosario, B., Pentland, A. P. A Bayesian Computer Vision System for Modeling Human Interactions. IEEE Trans. of PAMI Vol. 22, pages 831-843, 2000.
[43] Perez, P., Blake, A. and Gangnet, M. Jetstream: Probabilistic contour extraction with particles. Proc. of ICCV, pages 424–531, Vancouver, July 2001.
[44] Quinlan, J. R. C4.5: programs for machine learning. Morgan Kaufmann 1993. [45] Reichman, W. E., Coyne, A. C., Borson, S., Rovner, B. and Sa-kauye, K. Psychiatric
Consultation in the Nursing Home. American Journal of Geriatric Psychiatry, 6(4): pages 320-327, 1998.
[46] Rhodes, B. The wearable remembrance agent: A system for augmented memory. In Proceedings of the 1st International Symposium on Wearable Computers, pages 123–128, 1997.

36
[47] Schraudolph, N. and Sejnowski, T. J. Unsupervised discrimination of clustered data via optimization of binary information gain. In Stephen Jose Hanson, Jack D. Cowan, and C. Lee Giles, editors, Advances in Neural Information Processing Systems, volume 5, pages 499-506. Morgan Kaufmann, San Mateo, 1993.
[48] Sloane, P. D., Mitchell, C. M., Long, K. and Lynn, M. TESS 2+ Instrument B: Unit observation checklist – physical environment: A report on the psychometric properties of individual items, and initial recommendations on scaling. University of North Carolina 1995.
[49] Steele, C., Rovner, B. W., Chase, G. A. and Folstein, M. Psychiatric symptoms and nursing home placement in Alzheimer's disease. American Journal of Psychiatry, 147(8): pp.1049-1051, 1990.
[50] Stauffer, C. and Grimson, W. E. L. Adaptive background mixture models for real-time tracking. Proc. of CVPR 1999.
[51] Teri, L., Rabins, P., Whitehouse, P., Berg, L., Reisberg, B., Sunderland, T., Eichelman, B. and Phelps, C. Management of Behavior Disturbance in Alzheimer's disease; Current Knowledge and Future Directions. Alzheimer's Disease Assoc. Disord, 6(2): pages 677-688, 1992
[52] Time Domain Corporation, 7057 Old Madison Pike, Huntsville, AL 35806. PulsON Technology: Time Modulated Ultra Wideband Overview, 2001.
[53] Vapnik, V.N. The nature of statistical learning theory. Springer Verlag, New York, 1995.
[54] Wilson, A. D., Bobick, A. F. Realtime Online Adaptive Gesture Recognition. International Workshop on Recognition, Analysis, and Tracking of Faces and Gestures in Real-Time Systems, pp. 111-117, 1999.
[55] Yacoob, Y., Black, M. J. Parameterized Modeling and Recognition of Activities. ICCV, Vol. 73, pages 232-247, 1998.
[56] Yang, J., Lu, W., and Waibel, A. “Skin-color modeling and adaptation”. In Proc. of ACCV, vol. II, pp. 687-694, 1998.
[57] Zhang, D., Li, S. Z., Gatica-Perez, D. Real-Time Face Detection Using Boosting Learning in Hierarchical Feature Spaces. 17th International Conference on Pattern Recognition 2004.
[58] Burns, A., Lawlor, B., and Craig, S. Assessment Scales in Old Age Psychiatry. Martin Dunitz Press.
[59] Consolvo, S., Roessler, P., Shelton, B. E., LaMarca, A., Schilit, B. Technology for Care Networks of Elders. IEEE Pervasive Computing: Mobile and Ubiquitous Systems, Vol (3):2, pp: 22-29 2004.
[60] Forlizzi, J., DiSalvo, C., and Gemperle, F. Assistive Robotics and an Ecology of Elders Living Independently in Their Homes. Journal of HCI Special Issue on Human-Robot Interaction, Vol (19):1, 2004.