Embed Size (px)
Citation preview
Western Kentucky UniversityTopSCHOLAR®
Masters Theses & Specialist Projects Graduate School
8-2007
Detecting Malingering on the MMPI-2: AnExamination of the Utility of Combining theValidity Scales in a Non-Compensatory ModelThomas James BurkeWestern Kentucky University, [email protected]
Follow this and additional works at: http://digitalcommons.wku.edu/theses
Part of the Industrial and Organizational Psychology Commons
This Thesis is brought to you for free and open access by TopSCHOLAR®. It has been accepted for inclusion in Masters Theses & Specialist Projects byan authorized administrator of TopSCHOLAR®. For more information, please contact [email protected].
Recommended CitationBurke, Thomas James, "Detecting Malingering on the MMPI-2: An Examination of the Utility of Combining the Validity Scales in aNon-Compensatory Model" (2007). Masters Theses & Specialist Projects. Paper 27.http://digitalcommons.wku.edu/theses/27
DETECTING MALINGERING ON THE MMPI-2: AN EXAMINATION OF THE UTILITY OF COMBINING THE VALIDITY SCALES IN A NON-COMPENSATORY
MODEL
A Thesis Presented to
The Faculty of the Department of Psychology Western Kentucky University
Bowling Green, Kentucky
In Partial Fulfillment Of the Requirements for the Degree
Master of Industrial Organization Psychology
By Thomas James Burke
August 2007
DETECTING MALINGERING ON THE MMPI-2: AN EXAMINATION OF THE
UTILITY OF COMBINING THE VALIDITY SCALES IN A NON-COMPENSATORY MODEL
Date Recommended_____________________
_____________________________________ Director of Thesis
_____________________________________
_____________________________________
___________________________________________________ Dean of Graduate Studies and Research Date
Table of Contents
Literature Review.………………………………………………………………… 1 MMPI History.…………………………………………………………….. 2 Validity Scales…………………………………………………………….. 8 Malingering Research…………………………………………………….. 14 The Present Study………………………………………………………… 23
Method…………………………………………………………………………… 27 Scale Scoring……………………………………………………………… 27 Participants………………………………………………………………… 30 Materials……………….………………………………………………….. 32 Procedure…………………………………………………………………... 33 Results ……………………………………………………………………………... 34 Discussion………………………………………………………………………….. 38 References………………………………………………………………………….. 45 Appendix A………………………………………………………………………… 49
iii
DETECTING MALINGERING ON THE MMPI-2: AN EXAMINATION OF THE UTILITY OF COMBINING THE VALIDITY SCALES IN A NON-COMPENSATORY
MODEL
Thomas Burke August 2007 51 pages
Directed by: Reagan Brown, Ph.D., Elizabeth Shoenfelt, Ph.D., and Kathi Miner-Rubino,
Ph.D.
Department of Psychology Western Kentucky University
The MMPI-2 is the most commonly used self-report measure for the assessment
of psychopathology in forensic and psychiatric disability assessments (Bacchiochi &
Bagby, 2006; Bagby, Marshall, & Bacchiochi, 2005). The MMPI-2 includes a variety of
validity scales designed to detect content responsive faking (e.g., faking good or faking
bad) as well as content nonresponsivity (randomly responding). The present study was
conducted to determine whether a combination of validity scales to detect malingering of
a psychotic disorder in a non-compensatory model would be more or less effective than
using only a select few of the validity scales in a compensatory model. The results
supported the use of the specified validity scales (F, Fb, Fp, F – K, and FBS) in a non-
compensatory model to identify correctly whether test takers faked their profiles. The
results also supported the use of a smaller subset of the validity scales (Fp, F – K, and
FBS) in a non-compensatory model to identify correctly whether test takers faked their
profiles. The results, limitations of the current study, and future research considerations
are then discussed.
iv
Introduction
The Minnesota Multiphasic Personality Inventory-2 (MMPI-2) has been
acknowledged as the most commonly used instrument for the assessment of
psychopathology in forensic and psychiatric disability assessments (Bacchiochi & Bagby,
2006). The MMPI-2 is a self-report personality measure with a true/false response
format. The usefulness of the MMPI-2 is due, in part, to the inclusion of a number of
standardized validity scales that are able to detect the various response styles employed
by respondents (Archer, Handel, Greene, Baer, & Elkins, 2001; Bacchiochi & Bagby,
2006; Storm & Graham, 2000). Nichols, Greene, and Schmolck (1989) described two
common types of problematic response styles to which self-report measures are
vulnerable, namely content responsive faking and content nonresponsivity. Content
responsive faking, also known as dissimulation, is characterized by the respondent’s
tendency to exaggerate or minimize their psychological problems (e.g., fake bad or fake
good) when responding to test items. Content nonresponsivity, also known as stimulus
avoidance, is characterized by the respondent’s inability or refusal to respond to the
content of the test items, and usually results from a respondent marking answers
randomly without reading the items. There have been several studies examining the
efficacy of the MMPI-2 validity scales at the detection of faking good, faking bad, as
well as random responding. However, several of these studies, especially those
examining malingering (or faking bad) have compared and contrasted the merits of only a
few of the available validity scales. The current study is concerned with the validity
scales designed to detect malingering. Specifically, we will examine the utility of using
all available validity scales to detect the malingering of a psychotic disorder in a non-
1
2
compensatory model. In a non-compensatory model, failure on any one validity scale is
interpreted as malingering. Previous MMPI-2 research has compared and contrasted the
merits of the available validity scales used to detect malingering in a compensatory
model, in which the impact of an elevated score on one validity scale can be attenuated
by a lower score on another validity scale.
MMPI History
In 1943, Hathaway and McKinley developed the Minnesota Multiphasic
Personality Inventory (MMPI). Both were working at the University of Minnesota
Hospitals and expected the MMPI to be useful for routine diagnostic assessments. During
the 1930s and 1940s, psychologists and psychiatrists often performed interviews, mental
status examinations, and other forms of psychological testing to arrive at an appropriate
psychodiagnostic label for each individual patient. It was believed that a group-
administered paper-and-pencil personality inventory would be a more efficient and
reliable tool for the identification of the proper psychodiagnostic label (Graham, 1993).
The MMPI was unique in that it was developed using an empirical keying
approach as opposed to a rational keying approach, the popular method for the
development of personality inventories at the time. With a rational keying approach, test
items are selected intuitively according to face validity and the responses to those items
are keyed in a subjective manner by the test author. In essence, the test author keys the
responses to the items in the direction he thinks best fit the attribute being measured
(Graham, 1993). With an empirical keying approach, test items are selected according to
how well they correlate with an external criterion variable. The direction of that
correlation also determines how that item response is keyed. Crucial to the success of the
3
empirical keying approach is the selection of a well measured criterion variable. If the
criterion variable is poorly measured, it can lead the test developer to retain poor items or
discard or miscode good items. The criterion for the MMPI was whether the test taker
was identified as suffering from a specific psychological disorder. A good item for the
MMPI was one that was endorsed at different rates by each group (suffering from a
disorder vs. not suffering from a disorder). A bad item was one endorsed at roughly the
same rate by both groups. Each good item was then scored by determining which group
endorsed the item at a higher rate. If the group identified as suffering from a specific
psychological disorder endorsed an item more often than the normal group, test takers
were awarded a point for a true response. However, if the disorder group endorsed an
item less often than the normal group, test takers were awarded one point for a false
response.
Hathaway and McKinley (1943) compiled a pool of over 1,000 potential
inventory items by writing personality statements based upon psychological and
psychiatric case histories, reports, textbooks, and other current scales of personal and
social attitudes. From this initial pool, they selected 504 items that they believed to be
generally independent of one another. The next step was the selection of the criterion
variable, for which the MMPI was the clinical diagnosis of the test taker. One group was
called the Minnesota normals, because they were not suffering from any psychological
disorders. This group was comprised of relatives and visitors of patients at the University
of Minnesota Hospitals, as well as high school students and non-clinically diagnosed
medical patients. The second group was comprised of psychiatric patients at the
University of Minnesota Hospitals that represented all the major psychiatric categories in
4
clinical psychology use during the development of the test. These patients were divided
into subgroups based upon their psychodiagnostic label. The subgroups formed by the
clinical patients were hypochondriasis, depression, hysteria, psychopathic deviate,
paranoia, psychasthenia, schizophrenia, and hypomania. At a later time, masculinity-
femininity and social introversion scales were constructed and added to the MMPI. In
addition to these 10 clinical scales, the authors constructed four validity scales. They
called these scales the Cannot Say scale, the L scale, the F scale, and the K scale. These
scales were designed to detect responses that were incongruent with open, honest test-
taking behavior (Graham, 1993).
Each scale on the MMPI, excluding the Cannot Say scale, is scored by converting
the raw score to a normalized T score. Normalized T scores are used to standardize each
scale because no scale has the same number of items. After converting to T scores, each
scale has a mean of 50 and a standard deviation of 10. Thus, a T score of 50 indicates that
a test-taker’s score is equal to the average or mean score for the normative sample. T
scores above 50 or below 50 indicate scores higher or lower than the average for the
normative sample, respectively. It is possible to gain some information by interpreting a
test-taker’s T score on a single scale in isolation; however, this practice is not
encouraged.
After a decade of use, it became apparent that the MMPI was not functioning as
originally intended, that is to validly psychodiagnose new patients. It became clear that
the clinical scales were intercorrelated; for example, psychiatric patients suffering
depression were likely to score high on the depression scale and on some other clinical
scales. Many normal subjects were also obtaining high scores on one or more of the
5
clinical scales. Thus, to use an elevated T score on one scale to diagnose a patient was not
advisable and often times not possible (due to multiple elevated scale scores). Therefore,
clinicians began using a modified approach for the interpretation of MMPI scores.
Because reliable differences in clinical scale scores were found among individuals that
were known to differ in other important ways, it was assumed that the clinical scales were
measuring something other than error variance. “The modified approach to the MMPI
treated each of its scales as an unknown and, through clinical experience and empirical
research, the correlates of each scale were identified” (Graham, 1993, p.7). The modified
approach also replaced the clinical scale labels with numbers to reduce the likelihood of
any meaning being drawn from the scale name during a diagnosis. Using this approach,
when a test-taker obtained a certain score on a particular scale or a pattern of scores on
various scales, the clinician would consult past experience and research to determine a
diagnosis. The most common MMPI interpretative methods are high-points, two-point
code types, and three-point code types. A code type is a simple way of classifying the
MMPI or MMPI-2 profile by identifying the scale or scales on which the test-taker scored
the highest. The high-point code type simply indicates the scale on which the respondent
scored the highest. Two-point code types indicate the two scales, and three point code
types indicate the three scales on which the respondent scored the highest (e.g., 1-3 and
2-3-1, respectively). Of these methods, the two-point code type is the most common.
Often times the two scales indicated are interchangeable (e.g., 13/31), and the
interpretations for these profiles is the same. The interpretations are based, as previously
stated, on clinical experience and past research of former respondents that had the same
profile (Graham).
6
MMPI-2
In 1989, the MMPI was revised and restandardized by Butcher, Dahlstrom,
Graham, Tellegen, and Kaemmer, thus becoming the MMPI-2. Until this time, the MMPI
had not been modified since its 1943 publication. The reasons for the revision included
concerns about the original normal or standardization sample, concerns about the content
of some items, and concerns about the adequacy of the item pool for assessing clinical
issues that had arisen since the development of the test. From the beginning of the
restandardization process, it was determined that every effort would be made to ensure
that the original and revised versions of the MMPI would be as similar as possible. This
would allow the large research base around the original MMPI to remain relevant
(Graham, 1993).
The first step of the revision was to update some of the terminology, which had
been determined to be outdated, sexist, offensive, or grammatically incorrect. Of the 550
items from the original MMPI, 15 were rephrased and 82 were adjusted to eliminate
gender references. Other items were changed by supplanting modern terminology to
replace outdated or offensive language. All grammatical errors were corrected during the
revision as well. Most changes were minor and made with the intent of preserving the
original items but making them more understandable by modernizing and correcting their
grammar (Graham, 1993).
The next step involved the creation of new items that would address clinical
problems that were not prevalent at the time of the original MMPI development. The new
items addressed previously neglected areas, such as suicide, drug and alcohol addiction,
marital adjustment, and Type A behavior, to name a few. The revision committee also
7
decided to remove 100 items that were not included in any of the clinical or validity
scales. They then replaced these 100 items with 154 new items, most of which dealt with
the neglected areas noted above. An additional 37 items were deleted because they were
thought to be objectionable based on previous research. These items dealt with religious
beliefs, sexual preferences, and bowel and bladder functions (Graham, 1993).
The final and most important step was the collection of a new normal or
standardization sample. The original normal sample (the Minnesota normals) consisted of
hospital visitors from the surrounding area of Minneapolis, Minnesota. As a sample of
convenience, many clinicians were concerned that it was not representative of the current
U.S. population. To remedy this problem, the finalized MMPI-2 was administered to a
sample of approximately 2,900 community participants from seven geographically
distinct areas of the United States. The sample was selected to be more representative of
the U.S. population based upon the results of the 1980 census (Graham, 1993).
The current version of the MMPI-2 is 567 items long, has 10 clinical scales and
seven validity scales (the original four validity scales plus three new scales). The clinical
scales are Scale 1 Hypochondriasis (Hs), Scale 2 Depression (D), Scale 3 Hysteria (Hy),
Scale 4 Psychopathic Deviate (Pd), Scale 5 Masculinity-Femininity (Mf), Scale 6
Paranoia (Pa), Scale 7 Psychasthenia (Pt), Scale 8 Schizophrenia (Sc), Scale 9
Hypomania (Ma), and Scale 0 Social Introversion (Si). The validity scales are the Cannot
Say Scale (?), the L Scale, the F Scale, the K Scale, the Back-Page Infrequency Scale
(Fb), the Variable Response Inconsistency Scale or VRIN, and the True Response
Inconsistency Scale or TRIN (Graham, 1993).
8
Validity Scales
As noted earlier, a problem often encountered with self-report measures is the
respondent’s potential to fake good, fake bad, or respond randomly. Reasons for faking
good might include an overly defensive attitude or motivation to present an overly
positive image in order to gain employment, admission into college, or child custody in a
divorce case. Reasons for randomly responding might include a general lack of interest,
illiteracy, or unwillingness to cooperate. Reasons for faking bad, or malingering, might
include attempts to avoid criminal prosecution or military service, to claim disability in
worker’s compensation, Social Security, and personal injury contexts, or to gain entrance
into a rehabilitation clinic (Bagby, Buis, & Nicholson, 1995; Graham, 1993; Leckart,
1994; Lees-Haley, 1992; Lees-Haley, English, & Glenn, 1991; Rogers, Bagby, &
Chakraborty, 1993; Storm & Graham, 2000). Regardless of the reason, faking is clearly
an issue with which clinicians, employers, military personnel, human resources
personnel, lawyers, and other professionals should be concerned. It is because of faking
that many personality measures, such as the MMPI, have built in validity scales. The
original MMPI had four such scales (?, L, F, and K) used to detect responses that were
incongruent from honest and open test-taking behavior. The MMPI-2 added three new
validity scales (Fb, VRIN, and TRIN) used for similar purposes (Graham).
The Cannot Say (?) scale is simply a count of all the items to which the test-taker
failed to respond. There are many reasons for not answering certain items, from
carelessness to an unwillingness to admit fault. The MMPI-2 manual (Butcher et al.,
1989) suggests using caution when interpreting profiles with 30 unanswered items.
9
Graham (1993) suggested using caution interpreting profiles with more than 10
unanswered items and not interpreting any profile with more than 30 unanswered items.
The L scale was designed to detect a test-taker’s attempts to portray themselves
in an overly positive fashion. The items were designed to portray minor flaws and
weaknesses that most people would have no problems admitting to (i.e., “I do not like
everyone I know.”). Test-takers that are unable to admit even minor character flaws may
be employing a defensive test-taking attitude. T scores between 55 and 65 on this scale
indicate defensiveness. T scores above 65 on the L scale imply dishonest test taking or
extreme defensiveness. It is recommended that the protocol not be interpreted. T scores
below 50 on the L scale imply frank and honest test taking. Test-takers with scores below
50 are believed to be perceptive and self-confident enough to admit minor flaws
(Graham, 1993).
The F scale was developed to detect deviant and atypical response patterns. The
items selected for the F scale were those answered in the scored direction by fewer than
ten percent of the normal sample. Because such a small number of normals endorsed the
items in the nonstandard direction, any item scored in that direction indicates an
abnormal response. An MMPI-2 profile with a large number of such abnormal responses
calls into question whether the test-taker followed the test instructions. T scores on the F
scale over 100 indicate a potential true or false response bias, malingering, or a serious
psychological problem. A true or false response bias can be defined as a test-taker
oversubscribing either true or false answers. High amounts of items answered either true
or false call into question whether the test taker actually read the items as opposed to
simply deciding to answer most items either true or false. T scores between 80 and 99
10
might also indicate malingering or a possible plea for help. T scores below 50 might
imply a fake good attempt although they generally indicate that the test-taker answered
items as most normal people do. To determine whether a high F scale score is due to
malingering as opposed to random responding or a severe mental disturbance, one must
examine a few of the other validity scales and clinical scales. The profiles of malingerers
will usually have high scores on the F, Fb, and Fp (to be described later) validity scales
accompanied by high scores on some clinical scores (particularly the paranoia and
schizophrenia scales) and low scores on the VRIN scale (Graham, 1993; Wetter, Baer,
Berry, Smith, & Larsen, 1992).
The K scale was designed to be a more subtle scale than the L scale and to detect
test-takers denying psychopathology or exaggerating psychopathology. In other words, it
was designed to detect both fake good and fake bad attempts. High T scores on the K
scale (T > 65) most likely indicate a defensive test taking attitude or faking good;
however, if accompanied by a high TRIN score (T > 80), it may imply a false response
bias or random responding with no regard for item content. Low T scores on the K scale
(T < 40) might indicate malingering, but if accompanied by a high TRIN score, may
imply a true response set. Moderately elevated K scores may indicate high self-
confidence as opposed to defensiveness. For that reason, there is a K correction equation;
however, the K correction has received little empirical support (Graham, 1993).
The 40-item Infrequency-Back (Fb) scale was designed to function as an F scale
for the 154 new items on the MMPI-2. Scores on the Fb scale are interpreted the same
way as scores on the F scale (T scores over 80 could indicate malingering, random
responding, or severe psychopathology). As with the F scale, interpretation of the Fb
11
scale should be done with the support of other key validity scales such as the F, Fp, and
VRIN (Graham, 1993).
The Variable Response Inconsistency (VRIN), and the True Response
Inconsistency (TRIN) scales were not designed to detect fake good or fake bad response
distortions. They were designed to detect content nonresponsivity as discussed above.
The VRIN scale detects random responding in an inconsistent pattern, while the TRIN
scale indicates response sets of either true (acquiescence) or false (nonaquiescence).
While these scales do not directly detect malingering or faking good, they can be used in
tandem with other validity scales to determine whether test-takers refused to answer the
questions honestly (Graham, 1993; Nichols et al., 1989). The MMPI-2 manual suggests
that VRIN T scores greater than 96 for men and greater than 98 for women indicate a
random response set; it also states that TRIN T scores greater than 80 (in either the True
or False direction) indicate a response bias (Butcher et al., 1989). In short, the VRIN and
TRIN scales can be used to eliminate the possibility of content nonresponsive faking
before an examination of the other validity scales for content responsive faking.
In addition to these seven validity scales, researchers have developed many other
validity scales and indices based on the MMPI-2’s item pool. The F minus K (F – K)
index was developed by Gough (1947, 1950) to detect malingering on the MMPI. It is
computed by subtracting the raw K scale score from the raw F scale score. Gough
suggested this index because he believed that informed malingers (those with some
knowledge of psychiatric disorders) would not be able to simulate psychosis fully
(typified by a break from reality). Thus, their elevated F scale scores would indicate
possible malingering. Further, he believed that due to their inability to simulate a break
12
from reality, they would be aware of their condition (the faked profile) and answer in
accordance, which would result in slightly elevated K scale scores. By subtracting the
raw K score from the raw F score, one could determine whether a test-taker was
malingering. Gough suggested that malingering was a possibility any time the raw score
on the F scale is greater than the raw score on the K scale (1950).
Gough (1954) also developed the Dissimulation scale (Ds) to detect malingering
on the MMPI. He selected items that professional as well as nonprofessional observers
commonly mistook to be associated with neuroticism or maladjustment. Malingering was
indicated when a high number of these items were endorsed. Gough revised the Ds in
1957 by limiting it to the 40 items found to be the most effective at discriminating
between faked profiles and bona fide clinical profiles, and renamed the scale Dsr. The
MMPI-2 retained a good percentage of both scales and thus offers both the Ds2 and Dsr2
(Rogers, Sewell, & Salekin, 1994).
In 1948, Weiner developed the subtle and obvious scales by rationally dividing
some of the items on five of the clinical scales into two groups. The obvious items were
those that were clearly linked to a psychological or emotional problem, whereas the
subtle items were those that were not clearly linked to a psychological or emotional
problem. Greene (1980) suggested that subtle items would be more difficult to fake and
developed the obvious minus subtle (O – S) index to detect malingering. If a test-taker
endorsed a significantly higher number of obvious items than subtle items, malingering
was a possible explanation.
Lees-Haley et al. (1991) developed the Fake Bad Scale (FBS) to detect
malingering, especially in personal injury claims. The 43-item scale was developed on a
13
rational basis by reviewing the MMPI-2 profiles of individuals who were found to have
been feigning personal injury claims and comparing their profiles to individuals that were
determined not to have been feigning. High raw scores on the FBS indicate malingering,
as opposed to low scores, which indicate honest responding.
In 1995, Arbisi and Ben-Porath developed the Infrequency-Psychopathology
Scale (Fp), which can be used to detect malingering. The scale consists of 27 MMPI-2
items that are endorsed very infrequently (less than 20%) by both individuals from the
normal sample as well as individuals from the psychiatric samples. These 27 items were
retained during the revision because the main goal of the revision was to alter the MMPI
as little as possible so that the MMPI-2 would be as consistent as possible with the large
research base concerning the MMPI. These items, despite their infrequent endorsement,
were not considered offensive or grammatically incorrect. The Fp items also represent a
number of clinical scales (specifically Scales 7 and 8) as well as other validity scales
(specifically the L scale). These items generally reflect severe psychotic symptoms, very
unusual habits, highly amoral attitudes, and identity confusion. Thus, high Fp scores
indicate a response pattern that is distinct from the normal sample as well as the
psychiatric sample and is likely due to malingering. Low Fp scores most likely indicate
honest responding. The Fp scale was developed to contrast both the F and Fb scales. As
stated above the F and Fb scales are based on items that are infrequently endorsed (less
than 10%) by the normative sample alone. The Fp scale takes into consideration items
that are infrequently endorsed (less than 20%) by both the normative and psychiatric
samples, which allows the scale to differentiate between malingered profiles and the
profiles of individuals actually suffering from serious psychopathology. As mentioned
14
earlier, elevated scores on the F and Fb scales could be due to malingering, random
responding, or serious mental disturbances. To determine definitively which reason is
correct, one must examine the VRIN scale score, as well as scores on some of the clinical
scales. Thus, the Fp scale has a clear advantage over both the F and Fb scales in that
scores on the Fp can be interpreted without the need to examine other MMPI-2 scales
simultaneously.
As evidenced from the previous section, several validity scales designed to detect
malingering are available. Many of these scales have been used in previous research to
determine their efficacy at detecting malingered profiles as opposed to normal profiles
and true clinical profiles. However, only one study has compared the use of multiple
validity scales in a non-compensatory model, and the results of that study were limited by
the use of the short version of the MMPI-2 (Brown & Minton, 2006). Specifically, the
VRIN and TRIN scales were not available for analysis by the researchers to detect
random responding or response sets especially when participants had elevated scores on
the F and Fb scales. The present study will use the full length version of the MMPI-2 and
thus be able to use the VRIN and TRIN scales to determine whether participants were
actually malingering or merely responding at random or using a response set.
Malingering Research
This section will review the past research examining the effectiveness of the
various validity scales at detecting malingering a psychotic disorder (or faking bad) on
the MMPI and MMPI-2. It will begin by reviewing studies that used no coaching or
merely asked participants to feign a psychotic disorder. Next, it will examine studies that
provided coaching to their participants, namely symptom coaching or validity scale
15
coaching. Symptom coaching can be defined as providing the participants with specific
examples of the symptoms of the to-be-feigned disorder. Validity scale coaching can be
defined as making the participants somehow aware of the validity scales and their
purpose. This can range from simply stating that the MMPI has scales built in to detect
faking to actually giving participants a copy of certain validity scale items to study prior
to test administration.
Non-coaching Research. Graham, Watts, and Timbrook (1991) had participants
complete the MMPI-2 twice. They counterbalanced the conditions of taking the test
under standard instructions to answer each item openly and honestly and under
malingering instructions to give the impression that they were suffering from serious
psychological or emotional problems. Their results indicated that the F scale was the
most effective validity scale for detecting fake bad profiles when using traditional cutoff
scores. They found that the F – K index was as successful as the F scale at detecting
malingering for women and slightly less successful than the F scale for men. They
recommended raw cutoff scores of 12 and 17 respectively. Graham et al. also found the
Fb scale to be highly effective at detecting fake bad profiles while misclassifying few
honest profiles. However, they found a gender difference with this scale as well, and
recommended raw cutoff scores of 19 for men and 22 for women.
In 1992, Cassisi and Workman used a shortened form of the MMPI-2, which
consisted of the items from the L, F, and K validity scales to assess the effectiveness of
those scales at distinguishing among honest, fake good and fake bad profiles. They found
that the F scale correctly classified 95% of respondents instructed to fake bad. As they
used both the F and K scales, they computed the F – K index and found that 55% of their
16
participants in the honest condition were incorrectly classified as “faking good” or
“faking bad.” This high false positive rate led them to state that this index was of limited
value.
Wetter et al. (1992) studied the effects of both random responding and
malingering on the F scale, Fb scale, VRIN scale, F – K index, and Ds2 scale of the
MMPI-2. They conducted the study using four groups of participants. One group
completed the answer sheet randomly, a second group was instructed to malinger a
moderate psychological problem, a third group was instructed to malinger a severe
psychological disturbance, and the final group was given the standard instructions. The
major finding was that both random responding as well as malingering resulted in
elevated scores on both the F and Fb scales. However, VRIN was only elevated in cases
of random responding. Thus, the authors suggested that elevated scores on both F and Fb
can be clarified by looking at scores on VRIN. If scores on the F, Fb, and VRIN scales
are elevated, this would strongly suggest random responding. If scores on the F and Fb
scales are elevated but scores on the VRIN scale are low, the elevated F and Fb scores
may be due to either malingering or serious psychopathology. They also found that scores
on the F – K index and the Ds2 scale increased significantly as the degree of simulated
psychological disturbance worsened or increased.
Lees-Haley (1992) analyzed the MMPI-2 malingering scale scores of 119
personal injury claimants to determine the capacity of the validity scales to identify
pseudo-PTSD patients who scored high on MMPI-2 post-traumatic stress disorder
subscales. Of the 119 respondents, 55 were determined to be faking PTSD symptoms and
64 were determined to be actually suffering from post-traumatic stress disorder. The
17
findings indicated that the F scale, using a T score cutoff of 62, was the most effective
validity scale for detecting malingering in personal injury claims. This was closely
followed by O – S index, using a cutoff score of 90, which was followed again by the O –
S index, using a cutoff score of 100. The F – K index came next with a cutoff score of -4.
Finally, the FBS correctly identified 75% of the malingerers and 96% of the honest test
takers amongst men using a raw cutoff score of 24 and 74% of the malingerers and 92%
of the honest test-takers amongst women using a raw cutoff score of 26.
Timbrook, Graham, Keiller, and Watts (1993) examined the effectiveness of the
Wiener-Harmon Subtle-Obvious scales at detecting honest, fake good, and fake bad
MMPI-2 profiles. They asked their participants to take the test once normally and then
again with the goal of giving the impression that they were suffering serious
psychological problems. Their results suggested that S-O scales, particularly the O – S
index, were able to classify a high percentage of profiles correctly. However, these scales
added no information to that produced by the L and F scales in classifying fake good,
fake bad, and honest profiles. The results also indicated that the F scale had the largest
effect size for detecting malingered profiles. Thus, the authors concluded that the
standard validity scales were more useful than the S-O scales for detecting faked profiles
and recommended that the L and F scales be used, rather than the O – S index, for this
purpose.
In a meta-analysis, Rogers et al. (1994) were able to calculate the effect sizes (d)
for various malingering scales and indices on the strength of 15 MMPI-2 studies. The
malingering scales and indices they examined were F, Fb, F – K, Dsr2, and O – S. Of
these, one scale (F) and two indices (O – S and F – K) had the strongest effect sizes,
18
which were calculated for normal controls and psychiatric comparison groups. Fb and
Dsr2 also yielded strong effect sizes. Rogers et al. also calculated mean cutoff scores for
all the validity scales in raw scores and T scores when applicable. The average cutoff
scores (r = raw, T = T score) for each scale and the corresponding hit rates or correct
classifications were F (r23, T81, 87%), Fb (r16, T99, 81%), F – K (r10, 85%), Dsr2 (r19,
74%), and O – S (T133, 83%).
Bagby et al. (1995) allowed participants to choose the MMPI-2 testing condition
of the study in which they wanted to participate (fake good or fake bad). Those taking the
MMPI-2 under standard instructions were part of another study. The authors felt that by
letting the participants choose their condition they would be more motivated to do a good
job faking. Participants were informed that the study was concerned with the test’s ability
to detect people attempting either to fake good or fake bad. Using a hierarchical
regression analysis, the authors found that the F scale was the most effective scale at the
detection of malingering. The predictive power was minimally improved by adding either
O – S or Dsr2. Although the O – S index and Dsr2 scale were significant predictors when
used alone, the addition of F significantly increased the predictive power. Based on their
results, the authors recommended the use of the F scale alone for the detection of
malingering.
Lim and Butcher (1996) asked participants to take the MMPI-2 twice, once under
the standard instructions and once under instructions to fake bad, deny psychological
problems, or claim extreme virtue (admit no or few flaws). Their fake bad results were
consistent with previous research. The F scale was the most effective for detecting
malingering, followed closely by the Fb scale and the F – K index. A raw cutoff score of
19
17 on the F scale correctly classified 100% of the profiles under the fake bad and
standard conditions for both men and women. A cutoff score of 12 on the F – K index
correctly classified 92% and 100% of faked profiles for men and women, respectively,
and 100% for standard profiles for both men and women. A cutoff score of 18 on the Fb
scale correctly classified 100% and 96% of faked profiles for men and women,
respectively, and 100% for standard profiles for both men and women.
Bagby, Rogers, Buis, et al. (1997) asked their participants to respond honestly to
the MMPI-2 or to feign either schizophrenia or depression. Their overall results indicated
that the validity scales were more effective at detecting feigned schizophrenia as opposed
to feigned depression. These results suggest that feigned depression may be harder to
detect than feigned schizophrenia. The results also indicated that the F and Fb scales
discriminated best between feigned depression and bona fide depression and F, Fb, and
Fp discriminated best between feigned schizophrenia and bona fide schizophrenia.
Archer et al. (2001) compared the MMPI-2 profiles of a group of psychiatric
inpatients to a group of normal men and women instructed to feign a severe psychiatric
disorder. Their goal was to examine the effectiveness of the Fp scale at discriminating
between malingered profiles and the profiles of psychiatric patients. Their results
indicated that the Fp scale performed well in discriminating between feigned and genuine
profiles. They found that the Fp scale may have an advantage over the F and Fb scales in
terms of positive predictive power, which is to say that the Fp scale had a higher hit rate
than the F or Fb scales at correctly classifying feigned and genuine profiles. They were
unable to say definitively that Fp had a clear advantage over the F scale; however, they
did state that it had such an advantage over the Fb scale. Archer et al. also reported
20
optimal cutoff scores on the Fp scale as being a T score greater than 90 for men and a T
score greater than 80 for women.
Another meta-analysis concerning the MMPI-2 and malingering was performed
by Rogers, Sewell, Martin, and Vitacco (2003). Their analysis included 73 studies
examining the effectiveness of various MMPI-2 validity scales at detecting malingering.
Their results were somewhat consistent with the results of the previous meta-analysis.
The F scale had the largest effect size followed by F – K, Fp, Fb, Ds2, O – S, Dsr2, and
FBS. The authors noted that Fb seems to be prone to result in the misclassification of
genuine patients. This meta-analysis also calculated average cutoff scores for many of the
validity scales. The optimal cutoff scores (r = raw, T = T score) for each scale and the
corresponding hit rates or correct classifications were F (r20, T105, 86%), Fb (r18, T117,
82%), F – K (r12, 84%), Fp (r7, T98, 84%), Ds2 (r35, T91, 76%), Dsr2 (r19, T95, 79%),
and O – S (T256, 85%).
As evidenced by the previous studies, the F scale seems to be the most effective
validity scale for detecting malingering, especially when participants are not coached.
However, as indicated by the meta-analyses many of the other validity scales F – K, Fp,
Fb, Ds2, O – S, Dsr2, and FBS are also quite effective at detecting malingerers.
Furthermore, due to the tendency of the F and Fb scales to confuse malingering and
serious psychopathology the use of F and Fb alone to detect malingering is problematic.
Coaching Research. The following section will review the research that has
employed the use of symptom coaching, validity scale coaching, or both. Bagby,
Nicholson, et al. (1997) conducted a study to determine if clinical training would allow a
person to feign schizophrenia on the MMPI-2 without detection. They asked three groups
21
of participants, clinical psychology graduate students, psychiatric residents and fellows,
and undergraduate psychology students, to respond to the MMPI-2 as if they were
suffering from a chronic schizophrenic illness that was temporarily in remission, or
controlled by medication. Their results indicate that, despite their varying levels of
clinical training, each group of participants tended to overendorse symptoms associated
with schizophrenia when asked to feign that disorder. They also found that F, F – K, O –
S, and the sum of Obvious items produced the largest effect sizes for detecting
malingering. In addition, they found that across malingering groups, the Fp scale
produced a larger effect size than the Fb scale, but not as large as the F scale and F – K
index.
Rogers et al. (1993) assigned their participants to one of four different groups,
those coached on schizophrenic symptoms, those coached on strategies to avoid detection
by the validity scales, those coached on both symptoms and strategies, and uncoached
participants. Participant profiles were compared to the profiles of schizophrenia patients.
Rogers et al. found that coaching on strategies alone allowed many participants to avoid
detection. Coaching on symptoms of schizophrenia did not really help many participants
avoid detection. Coaching on both strategies and symptoms was not as effective as
coaching on strategies alone. Uncoached participants were detected with rather high
frequency. Surprisingly, the Dsr2 and O – S validity indices were superior to all other
scales at detecting malingering by catching nearly two thirds of those coached on
strategies alone and about 80% of all other conditions.
Storm and Graham (2000) assigned participants to one of three conditions,
validity scale coached malingerers, uncoached malingers, and hospitalized psychiatric
22
patients. The F scale was effective for correctly classifying the uncoached malingerers
but not as effective as Fp or Dsr2 at detecting the validity scale coached malingerers. This
finding offers further evidence that malingerers coached on how the validity scales
function are better able to elude detection by the standard MMPI-2 validity scales.
Bachiochi and Bagby (2006) developed the Malingering Discriminant Function
Index (M-DFI) for the MMPI-2. They argued that general malingering scales were
compromised when test-takers were coached on the validity scale content. Due to this
compromise they decided to develop the M-DFI by performing a discriminant function
analysis (DFA) comparing the archival protocols of 590 psychiatric patients and 534
validity-coached feigning research participants. Their sample was divided into derivation
and validation groups before the analysis began. Bachiochi and Bagby used a total of 39
MMPI-2 clinical, content, and content component scales as predictor variables. They
selected scales that assessed only symptoms of psychopathology. The results of the DFA
included 17 weighted clinical, content, and content component scales that comprise the
M-DFI. The ability of the M-DFI to detect malingering was comparable to that of the F
scales, although its effect size was marginally smaller than F and Fp. However, the
authors’ main concern was the reduced effectiveness of the validity scales when
respondents had been coached in methods to avoid detection. Therefore, the authors
collected a new sample to compare the predictive capacity of the M-DFI and family of F
scales in an experimental context in which the participants were either coached or
uncoached on the validity scales and instructed to fake psychopathology. Participants
were given the Fp scale for memorization. The results of this analysis indicated less
attenuation in effect size estimates for the M-DFI as compared to the F scale across
23
coached and uncoached participants. They also found that the M-DFI added incremental
validity to the F scales and vice versa. It should also be noted that although the F scales
produced small effect sizes, the M-DFI produced only medium effect sizes.
The coaching research indicates that the strong research support of the F scale
may be somewhat inflated, especially when one considers that a person determined to
fake would most likely seek out information to enhance their chances for success. Based
on the above research it appears that the Fp, Dsr2, and the F – K index are at least as, if
not more, effective than the F scale for detecting malingering.
The Present Study
Previous MMPI-2 research has compared and contrasted the merits of the
available validity scales used to detect malingering either in isolation or in a
compensatory model, in which the impact of an elevated score on one validity scale can
be attenuated by a lower score on another validity scale. Only one MMPI-2 study has
been conducted that uses the validity scales to detect malingering in a non-compensatory
model (Brown & Minton, 2006). In a non-compensatory model, failure on any one
validity scale is interpreted as malingering. Brown and Minton used the short form of the
MMPI-2 and thus were limited to the use of fewer validity scales than the current study.
They asked one group of participants to answer honestly and another group to feign
schizophrenia. Additionally, in an attempt to induce faking in a manner more consistent
with real faking behavior, they informed the feigning group of the existence of the
validity scales and instructed them to do their best to elude detection. The results, using
all available validity scales for the short form MMPI-2 (F, Fp, Dsr2 and F – K), identified
100% of the participants in the feigning group and misclassified only three participants
24
from the honest group as malingering. Many of the previous MMPI studies also asked
participants to fake a psychological disorder or disturbance without any mention of the
validity scales. Failing to mention the validity scales may artificially inflate effect sizes.
The present study examines the utility of combining the malingering-oriented validity
scales (F, Fb, Fp, F – K, and FBS) in a non-compensatory model. These scales were
selected based on their relative effectiveness in past studies (Rogers et al., 2003) as well
as the fact that they are scored by Pearson Assessments. The Ds2, Dsr2, and O – S scales
were not utilized because of their poor performance in past research, and a
recommendation from Brown and Minton to streamline the procedure and see how few
validity scales are needed to yield the most predictive power. Also, these scales are not
scored by Pearson Assessments and must be scored by hand. Additionally, the current
researcher believes that most clinicians generally rely on the standard validity scales
scored by Pearson Assessments because it makes their jobs more efficient.
Critical to the interpretation of the validity scales are the cutoff scores used to
identify malingering. Past research concerning the cutoff scores for the MMPI-2 validity
scales for detecting malingering has been diverse (Rogers et al., 2003). Rogers et al.
reported finding extreme variations across studies using the same scales (e.g., raw cutoff
scores for the F scale ranged from 8 to 30). Finding the optimal cutoff score for each
validity scale will maximize true positives (number of correct classifications) and
minimize false positives (profiles classified as faking that were not actually faking and
vice versa). For this reason, I propose the use of less stringent cutoff scores (so that fewer
people will appear to be malingering on any given scale) in order to reduce the number of
false positives. It is believed that the use of a non-compensatory model for the
25
combination of the validity scales will allow for accurate identification of faking test
takers even with the relaxed cutoff scores for each individual scale. The relaxed cutoff
scores were obtained by an examination of meta-analytic MMPI malingering research, as
opposed to fitting the cutoff scores to our individual sample.
If using the above validity scales in a non-compensatory model proves to be
effective for detecting malingering of a psychotic disorder, the model may be of use to
clinicians, employers, military personnel, human resources personnel, lawyers, or any
other professional that has a reason to be concerned about malingering. Although the M-
DFI (Bachiochi & Bagby, 2006) has been shown to be slightly more effective for
detecting malingering among coached feigners, it has been compared only to the family
of F scales (F, Fb, and Fp). Furthermore, as with any multiple regression equation, the
weights derived may have been overfit to their sample and are in need of cross-
validation. The present study utilizes more validity scales than the F family and set cutoff
scores based mainly on meta-analytic MMPI malingering research.
The present study examines the utility of combining the malingering-oriented
validity scales in a non-compensatory model. To reiterate, in a non-compensatory model,
failure on any one validity scale is interpreted as malingering. Previous MMPI-2 research
has compared and contrasted the merits of the available validity scales used to detect
malingering in a compensatory model, in which the impact of an elevated score on one
validity scale can be attenuated by a lower score on another validity scale. Hypothesis 1
is that the simultaneous use of the validity scales (F, Fb, Fp, F – K, and FBS) will
accurately identify which subjects are malingering.
26
Finally, the present study also examines the use of just the Fp, F-K, and FBS
scales in a non-compensatory model. This exclusion of F and Fb is proposed because
elevated scores on the F and Fb scales can be confounded with severe mental disturbance
(Graham, 1993). One must simultaneously examine scores on other validity and clinical
scales to determine the reason for elevated scores on the F and Fb scales (Graham). If, by
omitting these scales from the analysis, similar or better results can be obtained, the
detection of malingering would be easier for clinicians and other professionals.
Hypothesis 2 is that the simultaneous use of the Fp, F – K, and FBS scales will accurately
identify which subjects are malingering.
Method
The independent variable in this study is the testing instruction (honest or feigned
schizophrenia) given to the participant. The dependent variable is whether the participant
is detected as malingering by at least one validity scale.
Scale Scoring
All items were scored by Pearson Assessments. The researcher examined each
participant’s scale scores in order to determine whether he or she (a) responded
randomly, (b) answered in a manner consistent with schizophrenia, and (c) faked his or
her responses. The following cutoff scores were chosen based mainly on meta-analytic
MMPI-2 malingering research, as well as the MMPI-2 test manual and other independent
malingering research. It should be noted that there are often gender differences for raw
cutoff scores, however when converted to normalized T-scores, the cutoff score is often
the same for both genders. Graham (1993) explained that gender differences are to be
expected, but generally are not substantial enough to warrant concern. The following
section reviews the rationale for choosing the cutoff scores.
T-scores greater than or equal to 75 on the Schizophrenia scale were classified as
having a schizophrenic profile. The MMPI-2 manual states that a T score greater than or
equal to 75 is appropriate for diagnosing a profile as schizophrenic. In his book, Graham
(1993) also stated that T scores greater than or equal to 75 on this scale strongly suggest
the possibility of a psychotic disorder. Both sources noted that a person whose profile
results in a T score of 75 or higher will likely display many of the symptoms of
schizophrenia, such as confused and disorganized thinking, hallucinations or delusions,
impaired contact with reality, and poor judgment.
27
28
Raw scores greater than 20 on the Cannot Say (?) scale were omitted from the
analyses based again on the MMPI-2 manual (Butcher et al., 1989) and Graham’s (1993)
book on MMPI-2 assessment. The MMPI-2 manual suggests using caution when
interpreting profiles with 30 unanswered items. Graham suggested using caution
interpreting profiles with more than 10 unanswered items and not interpreting any profile
with more than 30 unanswered items. Based on these two sources the researcher decided
to use 20 as a compromise cutoff score for the Cannot Say (?) scale.
Raw scores of 16 or greater (T scores of 90 or greater) on the VRIN scale were
interpreted as random responding and omitted from the analyses. The MMPI-2 manual
(Butcher et al., 1989) suggests that raw cutoff scores of 13 or greater (T scores of 80 or
greater) most likely indicate inconsistent responding and invalidate the resulting protocol.
Graham suggested examining the VRIN scale score along with the F scale score and
stated that high scores on both suggest random responding, whereas a high F scale score
accompanied by a low VRIN scale score would suggest either a truly disturbed individual
or a malingering individual. Graham also suggested that T scores of 80 or greater should
be used with caution. Because individuals attempting to fake bad or individuals that are
genuinely disturbed often produce elevated VRIN scores, I chose T cutoff scores of 90 or
greater.
Raw scores greater than 16 (T > 90 in the true direction) or less than 3 (T > 90 in
the false direction) on the TRIN scale were interpreted as the use of either a true or false
response set and omitted from the analyses. These cutoff scores were based solely on the
MMPI-2 manual (Butcher et al., 1989), which states that a T score of 80 or greater as a
cutoff score, although only rough guidelines are indicative of indiscriminate responding
29
that invalidates the protocol. Graham (1993) suggested using caution when interpreting
TRIN scale scores due to a lack of data and research. Again, because individuals
attempting to fake bad or individuals that are genuinely disturbed often produce elevated
TRIN scores, I chose T cutoff scores of 90 or greater.
Raw scores of 22 or greater for men and 20 or greater for women (T scores of 105
or greater for both men and women) on the F scale were classified as faking. These cutoff
scores were chosen based on the meta-analysis by Rogers et al. (2003). This meta-
analysis included 73 studies examining the effectiveness of various MMPI-2 validity
scales at detecting malingering. Their results were somewhat consistent with the results
of a previous meta-analysis by Rogers et al. (1994). The 1994 meta-analysis reviewed 15
malingering studies, all of which employed both subjects responding honestly and
subjects instructed to feign. The results of the 1994 meta-analysis concluded that the
optimum cutoff score for the F-scale is 16. The 2003 meta-analysis included many more
studies under the same inclusion criteria and was therefore given preference by the
current researcher. Based on the newer research, raw scores of 18 or greater for men and
19 or greater for women (T scores of 117 or greater for both men and women) on the Fb
scale were classified as faking.
Raw scores of seven or greater for men and nine or greater for women (T scores
of 98 or greater for both men and women) on the Fp scale were classified as faking.
These cutoff scores were chosen based on the Rogers et al. (2003) meta-analysis.
Raw scores greater than 12 on the F – K scale were classified as faking. This
cutoff score was chosen based on the meta-analysis by Rogers et al. (2003). Lim and
30
Butcher (1996) also determined that a raw cutoff score of 12 was optimal, detecting 92%
of the faked male profiles and 100% of the faked female profiles.
Raw scores greater than 24 for men and 26 for women (T scores greater than 80)
on the FBS were classified as faking. Lees-Haley (1992) suggested these as optimal
cutoff scores based on an independent study. High raw scores on the FBS indicate
malingering, as opposed to low scores, which indicate honest responding.
Participants
Participants included 98 students enrolled in undergraduate psychology courses at
a medium sized Southeastern university. Of the 98 participants, 44 were male and 54
were female. Participants were recruited using the Psychology Study Board, which is an
internet tool used by the university that allows undergraduate students to review
descriptions of and sign up for various studies in exchange for class credit or extra credit.
Participation was voluntary and anonymous. Students were offered class credit or extra
credit in their psychology courses in exchange for their participation and were allowed to
discontinue their participation at any point during the study without penalty. Forty-nine
students served as the control condition and completed the MMPI-2 under standard
instructions. The other 49 students served as the experimental condition and were asked
to feign schizophrenia in the same manner as Brown and Minton (2006). Ninety-six of
the 98 participants also reported age and race information via the Psychology Study
Board; however, these data were not collected on the MMPI-2 answer sheets to ensure
anonymity and to ensure that the test administrators would not be able to match any
resulting profiles with any of the participants’ demographic data. Of those reporting
further demographic data, 57 were between the ages of 18 and 19, 29 were between the
31
ages of 20 and 21, and 10 were between the ages of 22 and 27. Eighty-one participants
were Caucasian, six participants were African-American, five participants were Asian,
one participant was Hispanic, and three participants were of Multiple Origin.
None of the participants’ protocols exceeded the raw cutoff score of 20 on the
Cannot Say (?) scale. Five participants’ protocols were invalidated due to high scores on
the VRIN scale (T > 90), which suggested random responding. These five protocols were
removed from further analysis. Four of the five protocols removed were from the
malingering group, leaving 48 participants in the honest group and 45 participants in the
faking group for a total of 93 valid protocols. Of the remaining 93 participants with valid
profiles, 43 were men and 50 were women.
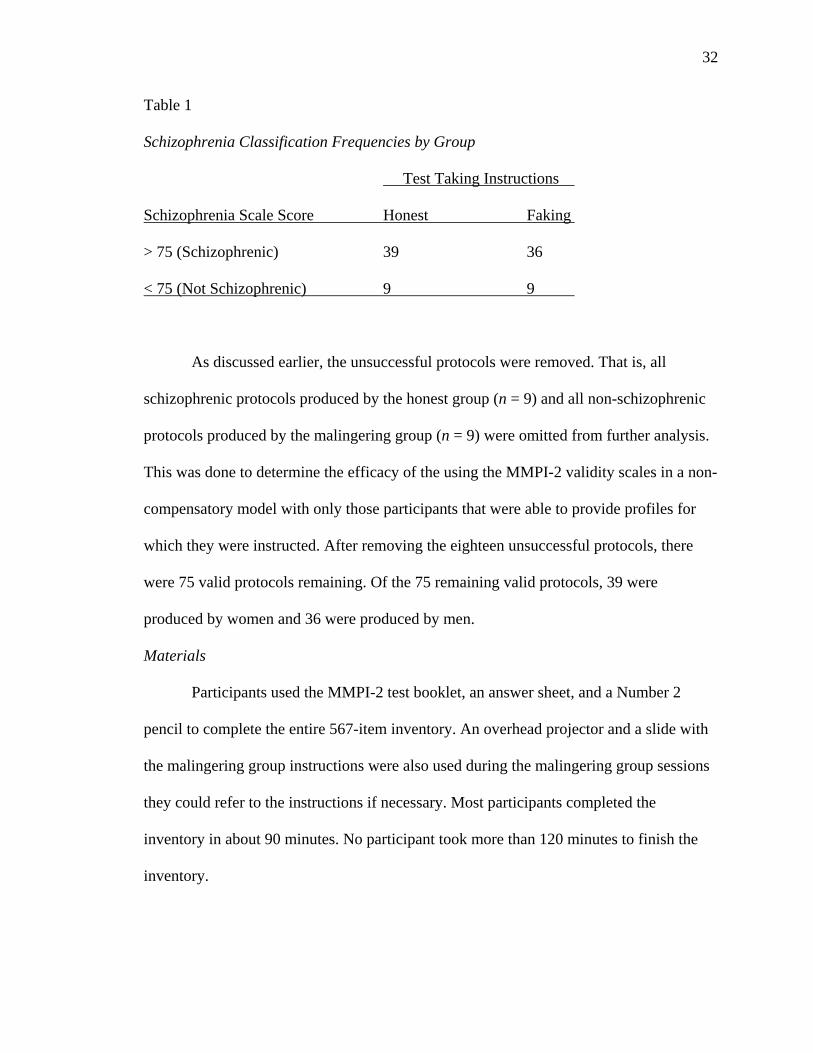
Next, the protocols were examined by group to determine whether the participants
produced schizophrenic profiles or non-schizophrenic profiles. Thirty-six of the forty-five
participants in the malingering group produced schizophrenic profiles whereas nine
participants were unsuccessful at producing a schizophrenic profile. Thirty-nine of the
forty-eight participants in the honest group produced non-schizophrenic profiles;
however, nine participants from the honest group were classified as schizophrenic (see
Table 1 for results).
32
Table 1
Schizophrenia Classification Frequencies by Group
Test Taking Instructions
Schizophrenia Scale Score Honest Faking
> 75 (Schizophrenic) 39 36
< 75 (Not Schizophrenic) 9 9
As discussed earlier, the unsuccessful protocols were removed. That is, all
schizophrenic protocols produced by the honest group (n = 9) and all non-schizophrenic
protocols produced by the malingering group (n = 9) were omitted from further analysis.
This was done to determine the efficacy of the using the MMPI-2 validity scales in a non-
compensatory model with only those participants that were able to provide profiles for
which they were instructed. After removing the eighteen unsuccessful protocols, there
were 75 valid protocols remaining. Of the 75 remaining valid protocols, 39 were
produced by women and 36 were produced by men.
Materials
Participants used the MMPI-2 test booklet, an answer sheet, and a Number 2
pencil to complete the entire 567-item inventory. An overhead projector and a slide with
the malingering group instructions were also used during the malingering group sessions
they could refer to the instructions if necessary. Most participants completed the
inventory in about 90 minutes. No participant took more than 120 minutes to finish the
inventory.
33
Procedure
A classroom was reserved for participants to complete the study. Up to twenty
participants completed the MMPI-2 during each session. The maximum of twenty
participants was chosen because only twenty MMPI-2 test booklets were available. Upon
arrival the participants were given an explanation of the study and asked to sign consent
forms. Participants were randomly assigned to either the honest or the malingering
groups. Participants in the honest group received the standard MMPI-2 instructions to
answer each item openly and honestly. Participants in the malingering group were read a
brief description of schizophrenia (symptom coaching) and given instructions to pretend
that they were suffering from schizophrenia while they completed the MMPI-2.
Additionally, they were told about the validity scales designed to detect faking (validity
scale coaching). They were given the goal to complete the test so that they appeared to be
suffering from schizophrenia without being detected as malingering by the validity
scales. A copy of the experimental script can be found in Appendix A.
Results
As noted, all responses were scored by Pearson Assessments. The scale scores for
each test taker were coded and dichotomized by the researcher in order to determine
whether each subject (a) responded randomly, (b) answered in a manner consistent with
schizophrenia, and (c) faked his or her responses. First, the researcher removed all
participants that failed the Cannot Say (?) scale (n = 0). Then, the researcher removed all
participants that failed either the VRIN or TRIN scales (n = 5), which are designed to
identify either random responding or the use of a response set. Next, the researcher
removed all participants in the honest group that had profiles indicating schizophrenia (n
= 9). Finally, the researcher removed all participants in the malingering group that had
profiles that did not indicate schizophrenia (n = 9). Seventy-five participants remained in
the study after removal of cases (n = 23) due to the three reasons mentioned above. The
data for the participants that failed to produce results consistent with their group
assignment were examined for coding errors. No errors were found, leaving three
possible conclusions for the resulting data. For the participants in the malingering group
that failed to produce a schizophrenic profile, it is assumed that they were confused with
the instructions to fake without getting caught and therefore took the test honestly.
Alternately, they may have been too careful in their attempts to avoid being caught. For
the participants in the honest group that did produce schizophrenic profiles, there are two
possible explanations: (a) nine of the forty-eight participants in the honest sample (i.e.,
close to 20% of the honest group) were actually suffering from schizophrenia at the time
they completed the MMPI-2 or (b) nine test takers in the honest group were confused
with the instructions or were not answering in a systematic, honest fashion. The first
34
35
explanation being highly unlikely allows one to conclude that the latter explanation was
the case. The responses from remaining participants were analyzed as described below.
Hypothesis 1 stated that the simultaneous use of the validity scales (F, Fb, Fp, F –
K, and FBS) will accurately identify malingering. Hypothesis 1 was first tested by using a
2 (malingering vs. honest instructions) x 2 (malingering detected vs. malingering not
detected) chi-square test of association performed to assess whether the participants were
correctly identified by the MMPI-2 (i.e., the participants asked to fake bad failed at least
one validity scale and the participants asked to answer honestly were able to pass all
validity scales). When scored in a non-compensatory manner the validity scales for
Hypothesis 1 (F, Fb, Fp, F – K, and FBS) were able to correctly identify whether test
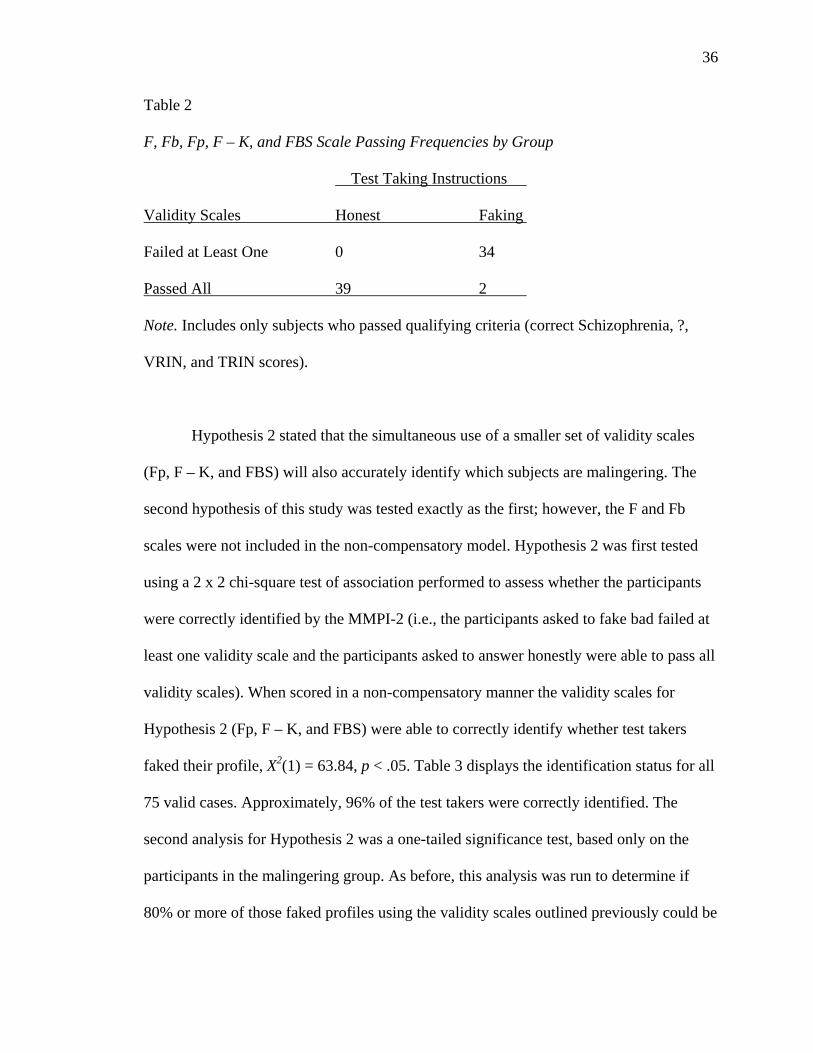
takers faked their profile, X2(1) = 67.38, p < .05. Table 2 displays the identification status
for all 75 valid cases. Approximately 97% of the test takers were correctly identified.
Second, the malingering group was examined in isolation. The percentage of malingerers
that failed at least one validity scale was examined. Although I hoped to identify 100% of
the malingerers, the sample was analyzed using a one-tailed significance test against a
population value of 80% (due to the limits of significance testing) to determine whether
the faking scales are effective enough to suggest that their effectiveness in the population
is at least 80%. Thirty-four of the thirty-six participants (94%) in the malingering group
were identified as faking by at least one validity scale, a significant result, z = 2.37, p <
.05, one-tailed.
36
Table 2
F, Fb, Fp, F – K, and FBS Scale Passing Frequencies by Group
Test Taking Instructions
Validity Scales Honest Faking
Failed at Least One 0 34
Passed All 39 2
Note. Includes only subjects who passed qualifying criteria (correct Schizophrenia, ?,
VRIN, and TRIN scores).
Hypothesis 2 stated that the simultaneous use of a smaller set of validity scales
(Fp, F – K, and FBS) will also accurately identify which subjects are malingering. The
second hypothesis of this study was tested exactly as the first; however, the F and Fb
scales were not included in the non-compensatory model. Hypothesis 2 was first tested
using a 2 x 2 chi-square test of association performed to assess whether the participants
were correctly identified by the MMPI-2 (i.e., the participants asked to fake bad failed at
least one validity scale and the participants asked to answer honestly were able to pass all
validity scales). When scored in a non-compensatory manner the validity scales for
Hypothesis 2 (Fp, F – K, and FBS) were able to correctly identify whether test takers
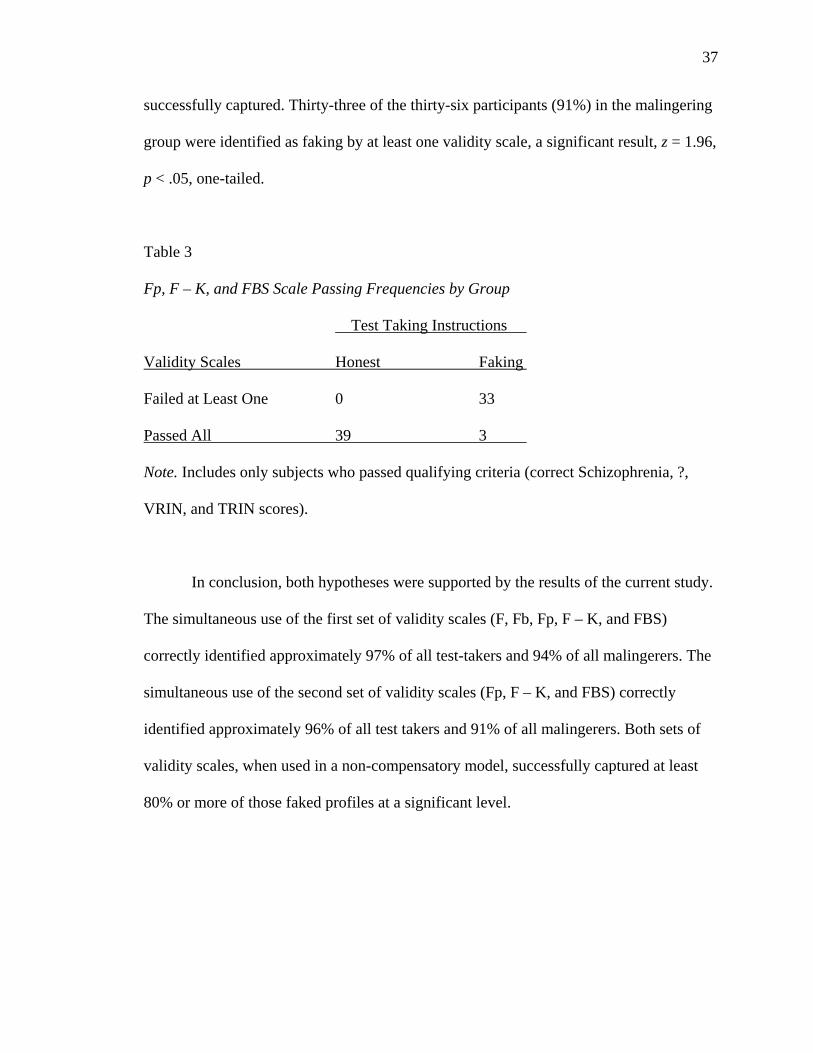
faked their profile, X2(1) = 63.84, p < .05. Table 3 displays the identification status for all
75 valid cases. Approximately, 96% of the test takers were correctly identified. The
second analysis for Hypothesis 2 was a one-tailed significance test, based only on the
participants in the malingering group. As before, this analysis was run to determine if
80% or more of those faked profiles using the validity scales outlined previously could be
37
successfully captured. Thirty-three of the thirty-six participants (91%) in the malingering
group were identified as faking by at least one validity scale, a significant result, z = 1.96,
p < .05, one-tailed.
Table 3
Fp, F – K, and FBS Scale Passing Frequencies by Group
Test Taking Instructions
Validity Scales Honest Faking
Failed at Least One 0 33
Passed All 39 3
Note. Includes only subjects who passed qualifying criteria (correct Schizophrenia, ?,
VRIN, and TRIN scores).
In conclusion, both hypotheses were supported by the results of the current study.
The simultaneous use of the first set of validity scales (F, Fb, Fp, F – K, and FBS)
correctly identified approximately 97% of all test-takers and 94% of all malingerers. The
simultaneous use of the second set of validity scales (Fp, F – K, and FBS) correctly
identified approximately 96% of all test takers and 91% of all malingerers. Both sets of
validity scales, when used in a non-compensatory model, successfully captured at least
80% or more of those faked profiles at a significant level.
Discussion
The purpose of the current study was to determine the effectiveness of the
simultaneous use of the MMPI-2 validity scales for the detection of malingering of a
psychotic disorder in a non-compensatory model. Remember that in a non-compensatory
model, failure on any one validity scale is considered faking. In a compensatory model
the impact of an elevated score on one validity scale can be attenuated by a lower score
on another validity scale.
The results of this study suggest that the use of the specified validity scales (F, Fb,
Fp, F – K, and FBS) in a non-compensatory model are successful at detecting feigned
schizophrenia among participants who are given basic information regarding the
symptoms of the disorder as well as information concerning the presence of the validity
scales. Hypothesis 1, which included scales F, Fb, Fp, F – K, and FBS, successfully
classified 97% of the participants overall and 94% of the participants in the faking group..
Hypothesis 2, which included only the Fp, F – K, and FBS scales, successfully classified
96% of the participants and 91% of the people in the faking group.
These findings, when compared to previous MMPI-2 research, suggest that the
use of the validity scales in a non-compensatory model may increase the accuracy of
correctly identifying malingering test-takers. In the meta-analysis by Rogers et al. (2003)
the average percent of correctly classified malingers when using only one scale in
isolation was: F scale 86%, Fb scale 82%, F – K scale 84%, and the Fp scale 84% (FBS
was not included in this meta-analysis). Lees-Haley (1992) found that the FBS in
isolation correctly identified 75% of the malingerers amongst men and 74% of the
malingerers amongst women. The use of the above validity scales (in a non-
38
39
compensatory model) in the current study correctly classified 94% of malingerers.
Furthermore, the subset of validity scales (Fp, F – K, and FBS) used in the second
hypothesis correctly classified 91% of malingerers. Both of these findings suggest that
using the validity scales in a non-compensatory model will increase the accuracy of
correctly identifying malingered profiles.
Furthermore, the results of the current study did not misclassify any honest test-
takers as malingering (correctly classifying 100% of the honest group profiles). When
compared to pervious MMPI research, this finding should be interpreted cautiously as a
success. Lim and Butcher (1996) reported correctly classifying 100% of test takers from
their honest group when using the F scale in isolation. Other studies have reported
various levels of accuracy for correctly classifying genuine MMPI profiles using various
validity scales ranging from approximately 83% to 96% (Cassisi & Workman, 1992;
Lees-Haley, 1992; Wetter et al., 1992; and Brown & Minton, 2006). This finding
suggests that using the validity scales in a non-compensatory model may also increase the
accuracy of correctly identifying genuine profiles.
Limitations
One troubling aspect of the current study was the high number of individuals that
failed to produce profiles consistent with their group assignments. The nine individuals in
the malingering group that failed to produce schizophrenic profiles were not nearly as
troubling as the nine individuals in the honest group that did produce schizophrenic
profiles. Interestingly, five of these nine individuals were not detected as malingering by
any of the validity scales used in the current study. As stated earlier in the results section,
this could be because they were actually suffering from schizophrenia during the test
40
administration or that they were confused with the instructions and did not answer
honestly. Given the fact that individuals in the honest group were never exposed to the
malingering group instructions and vice versa, it is puzzling how the instructions could be
unclear. One possible source of confusion may have been the informed consent form
signed by the participants before completing the study. Under the heading, “Nature and
Purpose of the Study” was the sentence, “This study will attempt to determine whether
people can successfully fake on a personality test.” Other than this information, to the
best knowledge of the researcher, no participant was aware of the malingering group
instructions. Perhaps these individuals lacked sufficient motivation to answer carefully,
which may have also been the case for the nine individuals in the malingering group that
failed to produce schizophrenic profiles.
Motivation was a general concern for the overall study, but perhaps more so for
the malingering group. The nine participants that failed to produce schizophrenic profiles
may have lacked sufficient extrinsic motivation to produce a schizophrenic profile.
Furthermore, those that did produce schizophrenic profiles may have lacked the
motivation to fake successfully (i.e., not be detected by the validity scales).
Another limitation to this study, as with many studies, was the limited sample.
After removing all invalid protocols, the sample size for the current study was 75. As
with any study, larger samples sizes result in better estimates of population parameters.
The population from which these 75 participants were drawn is another limitation to the
current study. The participants were drawn from a population of undergraduate students
enrolled in psychology courses at a medium sized Southeastern university. The fact that
41
the sample was not drawn from a more representative population may limit the
generalizability of the results.
A final limitation to the current study was the fact that a true clinical population
was not used. It would be interesting to randomly sample from a population of clinically
diagnosed schizophrenics and replicate the current study to determine the true efficacy of
the validity scales. That is, would a group of true schizophrenic patients be identified as
faking when they answered honestly?
Future Research
The participants in the malingering group were given basic information regarding
the symptoms of schizophrenia (symptom coaching) because it is believed that
individuals motivated to malinger any disorder on a personality test would at the
minimum attempt to gain the basic information concerning the disorder. However, it was
also believed that individuals given just the basic disorder information might over
endorse those items associated with the disorder, which is why individuals in the
malingering group were also supplied with information about the validity scales (validity
scale coaching). Further research may want to compare the success of the validity scales
at detecting malingering with groups that receive no coaching, symptom coaching only,
validity scale coaching only, and both forms of coaching. Furthermore, I only made
mention of the presence and function of the validity scales (to detect malingers); further
research may want to examine the success of the validity scales when participants are
given actual copies of the validity scale items. A 2006 study by Bachiochi and Bagby,
supplied participants with validity scale items to study. However, they only made the
items for one scale (Fp) available and did not mention whether they also provided
42
participants with any information regarding how the items were scored to detect
malingering.
In the current study, two participants from the malingering group produced
schizophrenic profiles and successfully passed all the validity scales. An additional
participant produced schizophrenic profiles and passed the three validity scales (Fp, F –
K, and FBS) analyzed in the second hypothesis.
As noted earlier, the sample for the current study was drawn from a population of
undergraduate students from a medium sized Southeastern university. It is unknown
whether participants drawn from non-student populations would be more or less
successful in feigning schizophrenia than the student sample used in this study. It is also
unknown whether age or education correlates with the ability to feign schizophrenia
successfully.
The data for the current study were analyzed using a non-compensatory model, in
which failure on any one of the validity scales was interpreted as malingering. The results
indicated that the validity scales were very effective for the detection of malingering.
However, upon closer examination of the results it was noted that the Fake Bad Scale
(FBS) successfully detected only eight of the thirty-six participants in the malingering
group as faking. This indicates that this particular scale might not be very effective for
detecting feigned schizophrenia. This did not come as a huge surprise given that the FBS
was originally developed to detect the malingering of Post Traumatic Stress Disorder
(Lees-Haley et al., 1991). It is suggested that this scale be omitted from future studies that
are similar in nature to the present study (detecting feigning of a psychotic disorder). In
terms of the individual success of the other validity scales, the F scale successfully
43
detected thirty-four of thirty-six malingerers, the Fp and F – K scales successfully
detected thirty-three of thirty-six malingerers, and the Fb scale successfully detected
thirty of thirty-six malingerers. In an attempt to streamline the procedure, the current
study did not employ the use of any hand scored validity scales. The original study that
examined the use of the validity scales in a non-compensatory model (Brown & Minton,
2006), employed the use of one hand scored validity scale (Ds-r2) and also successfully
detected 100% of the faked profiles in the malingering group. It is suggested that perhaps
the Ds-r2 be used instead of the FBS in future studies. In fact, it may be beneficial to
examine more closely some of the hand scored validity scores in order to determine
whether they could increase the effectiveness of malingering detection.
None of the validity scales used in the current study incorrectly identified an
honest test taker as malingering. This is an improvement in regards to the original study,
which did identify three participants in the honest group (who did not have elevated
schizophrenia scores) as malingering. The original study and the current study did utilize
some common validity scales; however, the cutoff scores for the current study were more
relaxed due to the fact that they were based on a more recent meta-analysis. Given this
knowledge, future research may want to explore the use of cutoff scores that fall in
between those used for the current study and those of the original study.
Conclusion
In conclusion, the MMPI-2 has a number of validity scales designed for the
detection of malingering, which when combined in a non-compensatory model are highly
effective at accurately identifying participants feigning schizophrenia. The study of using
the validity scales in a non-compensatory model should be extended to examine
44
individuals feigning other disorders (e.g., depression) to determine the effectiveness of
this method for detecting such malingering. The results of the current study suggest that
clinicians and other professionals concerned with malingering on the MMPI-2 may find it
beneficial to use a combination of validity scales in a non-compensatory model in order
to more accurately detect malingered protocols.
References
Arbisi, P.A. & Ben-Porath, Y. S. (1995). An MMPI-2 infrequent response scale for use
with psychopathological populations: The infrequency-psychopathology scale,
F(p). Psychological Assessment, 7, 424-431.
Archer, R. P., Handel, R. W., Greene, R. L., Baer, R. A., & Elkins, D. E. (2001). An
evaluation of the usefulness of the MMPI-2 F(p) scale. Journal of Personality
Assessment, 76, 282-295.
Bacchiochi, J. R., & Bagby, R.M. (2006). Development and validation of the malingering
discriminant function index for the MMPI-2. Journal of Personality Assessment,
87, 51-61.
Bagby, R. M., Buis, T., & Nicholson, R.A. (1995). Relative effectiveness of the standard
validity scales in detecting fake-bad and fake-good responding: Replication and
extension. Psychological Assessment, 7, 84-92.
Bagby, R. M., Rogers, R., Buis, T., Nicholson, R. A., Cameron, S. L., Rector, N. A.,
Schuller, D. R., & Seeman, M. V. (1997). Detecting feigned depression and
schizophrenia on the MMPI-2. Journal of Personality Assessment, 68, 650-664.
Bagby, R. M., Rogers, R., Nicholson, R., Buis, T., Seeman, M. V., & Rector, N. (1997).
Does clinical training facilitate feigning schizophrenia on the MMPI-2?
Psychological Assessment, 9, 106-112.
Brown, R. D. & Minton, A. (2006). Detecting intentional, realistic response distortion on
the MMPI-2 using multiple validity scales. Unpublished manuscript, Western
Kentucky University, Bowling Green, Kentucky.
Butcher, J. N., Dahlstrom, W. G., Graham, J. R., Tellegen, A., & Kaemmer, B. (1989).
45
46
Minnesota Multiphasic Personality Inventory-2: Manual for administration and
scoring. Minneapolis, MN: University of Minnesota Press.
Cassisi, J. E., & Workman, D. E. (1992). The detection of malingering and deception
with a short form of the MMPI-2 based on the L, F, and K scales. Journal of
Clinical Psychology, 48, 54-58.
Gough, H.G. (1947). Simulated patterns on the Minnesota Multiphasic personality
inventory. Journal of Abnormal and Social Psychology, 42, 215-225.
Gough, H. G. (1950). The F minus K dissimulation index for the MMPI. Journal of
Consulting Psychology, 14, 408-413.
Gough, H. G. (1954). Some common misconceptions about neuroticism. Journal of
Consulting Psychology, 18, 287-292.
Graham, J. R. (Ed.). (1993). MMPI-2: Assessing personality and psychopathology (2nd
ed.). New York, Oxford: Oxford University Press.
Graham, J. R., Watts, D., & Timbrook, R. (1991). Detecting fake-good and fake-bad
MMPI-2 profiles. Journal of Personality Assessment, 57, 264-277.
Hathaway, S. R., & McKinley, J. C. (1943). The Minnesota Multiphasic Personality
Inventory. Minneapolis: University of Minnesota Press.
Leckart, B. (1994). A revised dissimulation scale applicable to the MMPI-2. American
Journal of Forensic Psychology, 12, 5-14.
Lees-Haley, P. R., English, L.T., & Glenn, W.J. (1991). A fake bad scale on the MMPI-2
for personal injury claimants’. Psychological Reports, 68, 203-210.
Lees-Haley, P. R. (1992). Efficacy of MMPI-2 validity scales and MCMI-II modifier
scales for detecting spurious PTSD claims: F, F – K, fake bad scale, ego strength,
47
subtle – obvious subscales, DIS, and DEB. Journal of Clinical Psychology, 48,
681-689.
Lim, J., & Butcher, J. (1996). Detection of faking on the MMPI-2: Differentiation among
faking-bad, denial, and claiming extreme virtue. Journal of Personality
Assessment, 67, 1-25.
Nichols, D., Greene, R., & Schmolck, P. (1989). Criteria for assessing inconsistent
patterns of item endorsement on the MMPI: Rationale, development, and
empirical trials. Journal of Clinical Psychology, 45, 239-250.
Rogers, R., Bagby, R. M., & Chakraborty, D. (1993). Feigning schizophrenic disorders
on the MMPI-2: Detection of coached simulators. Journal of Personality
Assessment, 60, 215-226.
Rogers, R., Sewell, K.W., & Salekin, R.T. (1994). A meta-analysis of malingering on the
MMPI-2. Assessment, 1, 227-237.
Rogers, R., Sewell, K.W., Martin, M. A., & Vitacco, M.J. (2003). Detection of feigned
mental disorders: A meta-analysis of the MMPI-2 and malingering. Assessment,
10, 160-177.
Storm, J., & Graham, J. R. (2000). Detection of coached general malingering on the
MMPI-2. Psychological Assessment, 12, 158-165.
Timbrook, R. E., Graham, J. R., Keiller, S. W., & Watts, D. (1993). Comparison of the
Weiner-Harmon subtle-obvious scales and the standard validity scales in
detecting valid and invalid MMPI-2 profiles. Psychological Assessment, 5, 53-61.

48
Wetter, M. W., Baer, R. A., Berry, D. T. R., Smith, G. T., & Larsen, L. H. (1992).
Sensitivity of MMPI-2 validity scales to random responding and malingering.
Psychological Assessment, 4, 369-374.
49
Appendix A
Administration Instructions for Both Conditions

50
Honest Group Instructions
Welcome to our study on personality testing. Pass out and read informed sign consent. Emphasize that participation is voluntary and anonymous.
Are there any questions about the study? Collect informed consents and pass out tests and answer sheets. Be sure answer sheets are coded appropriately for group - first digit of ID should be 1 (for honest group). For this study you will be taking a personality test called the MMPI. Please open the test booklet and read the instructions on the first page. After reading the instructions, please wait until I tell you to begin, because I have a few other instructions which are not in the test booklets.
Read instructions out loud. Then say: Please don’t write on the test booklet. On the answer sheet, fill in sex and no other information. Remember this study is anonymous – we don’t want you to write your name or any other identifying information anywhere. When taking the test, please answer honestly. Are there any questions? OK, you may begin. When people finish, check answer sheet to see if they answered the items. A few skipped items are fine, entire columns are not. Offer to answer any questions about the study (do so outside of the room to avoid disturbing the other test takers).
51
Faking Group Instructions Welcome to our study on personality testing. Pass out and read informed sign consent. Emphasize that participation is voluntary and anonymous.
Are there any questions about the study? Collect informed consents and pass out tests and answer sheets. Be sure answer sheets are coded appropriately for group - first digit of ID should be 2 (for faking group). For this study you will be taking a personality test called the MMPI. Please open the test booklet and read the instructions on the first page. After reading the instructions, please wait until I tell you to begin, because I have a few other instructions which are not in the test booklets. Please don’t write on the test booklet. On the answer sheet, fill in sex and no other information. Remember this study is anonymous – we don’t want you to write your name or other identifying information anywhere.
Read instructions out loud. Put transparency up and leave up during experiment (don’t dim lights).
When answering the questions, we want you to answer the questions as if you are suffering from the mental disorder Schizophrenia. Schizophrenia is characterized by disturbances of thinking, mood, and behavior. Delusions and hallucinations may be present. Behavior may be withdrawn, aggressive, or bizarre. This test is designed to identify people who are suffering from Schizophrenia. It is also designed to identify people who are lying when they answered the questions. Your goal is to get a score that says you are suffering from Schizophrenia and to not get a score that says you were lying when you answered the questions. Are there any questions? When people finish, check answer sheet to see if they answered the items. A few skipped items are fine, entire columns are not. Offer to answer any questions about the study (do so outside of the room to avoid disturbing the other test takers).