Embed Size (px)
Citation preview
1
Detecting Hydrogen in Helium Streams
Samuel Goodman
Pittsford Mendon High School
Rochester, New York
Advisor: Dr. Walter Shmayda
Laboratory for Laser Energetics
University of Rochester
Rochester, New York
September 2013
2
Abstract
Three different approaches to detecting hydrogen in helium streams were assessed: thermal
conductivity, atmospheric sampling using a mass spectrometer, and permeation through a
palladium/silver membrane. The thermal conductivity detection system utilized an assembly of
four cells fitted with filaments wired to make a Wheatstone bridge. Pure helium flowed through
two of the cells. Helium containing hydrogen passed through the remaining two cells. The
filament temperature, which is determined by the thermal conductivity of the gas surrounding the
filaments, depends on the hydrogen concentration in the helium carrier. In the atmospheric
sampling approach, a slip-stream is drawn from the carrier via two differentially pumped orifices
and injected into a vacuum system. The vacuum system is fitted with a mass spectrometer tuned
to hydrogen. In the permeation approach, the helium stream is passed over a hot palladium/silver
(Pd/Ag) membrane. Hydrogen permeates through the membrane to increase the pressure in a
vacuum system. The change in the vacuum pressure is directly related to the hydrogen
concentration in the carrier on the upstream side of the membrane. The Pd/Ag permeation
approach proved to be the most sensitive hydrogen detection technique. This approach was used
to investigate the performance of a cryotrap. Several interesting phenomena were detected when
evaluating the cryotrap. A large but brief breakthrough occurs when the column reaches
capacity, and hydrogen elution can occur when the full, cold column is purged with helium.
Introduction
The University of Rochester Laboratory for Laser Energetics (LLE), whilst carrying out
internal confinement fusion experiments, utilizes tritium gas, one of the reactants required for the
fusion process, in the fabrication of its cryogenic targets. Tritium processing equipment is
3
typically encased in a glovebox to prevent the release of the tritium to the environment. Helium
is used as a purge gas in the glovebox. Any tritium that has been released from process
equipment is swept out of the glovebox and collected by zirconium-iron (ZrFe) alloy. Annually,
the ZrFe alloy is removed from the box circulation loop to recover the tritium. Tritium is
released from the alloy into a helium carrier stream by heating the ZrFe to 450° C. One proposed
method for recovering the tritium from this inert gas stream is a cryotrap.(1)
The cryotrap is a specialized coil of stainless steel tubing filled with a molecular sieve.
The helium containing tritium is flown through the cryotrap. When cooled to liquid nitrogen
temperatures (77 K), the molecular sieve extracts tritium from the carrier stream, while helium
flows out the other end of the cryotrap. When the temperature of the molecular sieve is raised
above liquid nitrogen temperatures, tritium is released back into the carrier stream and exits the
cryotrap. This way, tritium can be concentrated and recovered, minimizing risk and emissions.
To evaluate the cryotrap’s ability to collect, store and release tritium, three systems for
detecting hydrogen in a helium stream were proposed, constructed, and calibrated. For the sake
of safety and convenience, tritium was replaced with hydrogen for all experiments, as its
behavior is almost identical when interacting with the molecular sieve, the vacuum-backed
membrane, and various detectors. The most sensitive system was then used to investigate the
performance of the cryotrap.
System 1
The first detection system relied on a thermal conductivity detector (TCD). The TCD
consists of four cells: two are used as reference, while the other two are used for the sample
itself. These cells are aligned in a Wheatstone bridge configuration (figure 1). Hydrogen gas
4
flows through the sample cells in a helium carrier, while the reference cells are exposed to pure
helium gas. When the concentration of hydrogen in helium changes through the sample cells, the
thermal conductivity of the gas stream changes, causing a change in temperature of the cell’s
filament.(2) This temperature change results in a changed resistance in the circuit shown in figure
1. The resistance change results in a different voltage output from the TCD. The Wheatstone
bridge is balanced when gas compositions across all reference and sample cells are the same.
When this occurs, the voltage output is zero.
This hydrogen detection system proved problematic. The thermal conductivities of
hydrogen and helium are very similar, 0.1805 W·m−1·K−1 for hydrogen compared to 0.1513
W·m−1·K−1 for helium. Because the sample gas stream was primarily composed of helium, with
the hydrogen concentration often less than 2% of the helium concentration, the signal-to-noise
ratio of the TCD voltage output was low, regardless of the differences in gas flow rate and
hydrogen concentration. The TCD was operated at temperatures ranging from 80° C to 200° C in
an attempt to enhance the TCD’s response relative to the helium carrier, but no significant
difference in the signal-to-noise ratio was produced. Shielded cabling also failed to significantly
reduce noise.
Options to improve hydrogen detectability include a more sensitive TCD, the
implementation of a lock-in amplifier, or the use of an inert carrier gas with a thermal
conductivity more remote from that of hydrogen.
System 2
The second proposed system relies on an atmospheric sampling system with an RF-
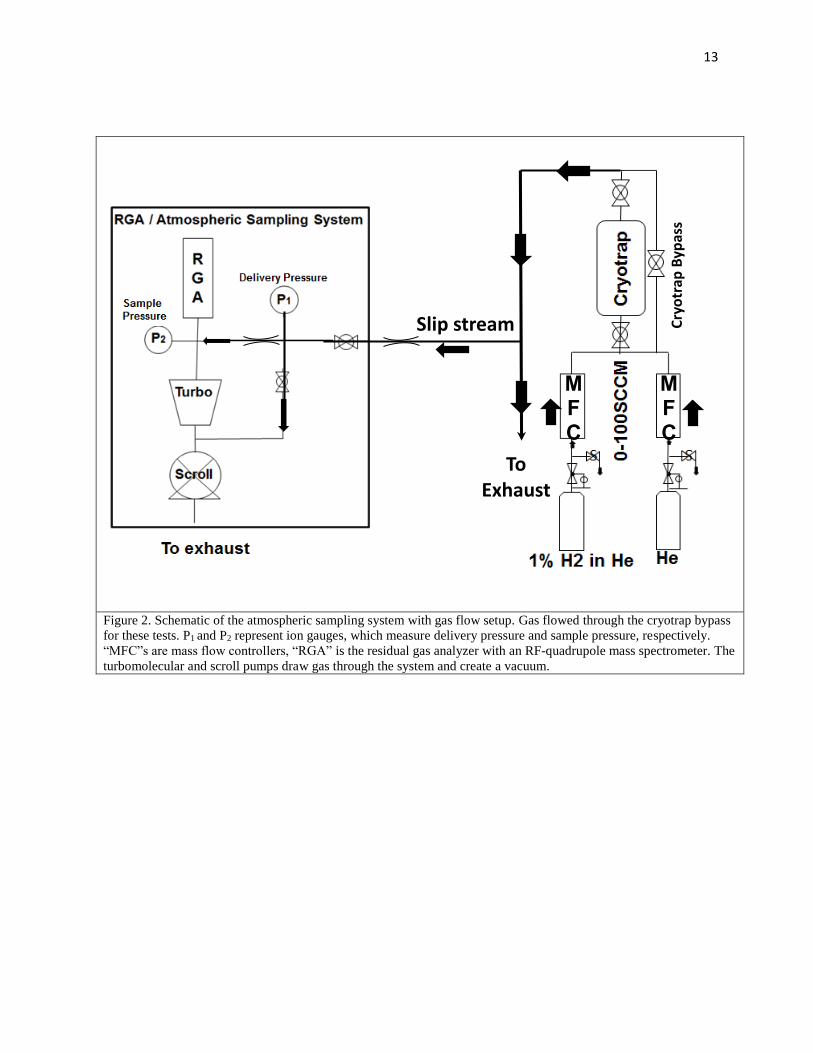
quadrupole mass spectrometer. The schematic for this system can be found in figure 2. Gas flow
5
is initially regulated by two mass flow controllers (MFCs). The slip stream of the carrier gas is
pumped through a precision micro-orifice. The delivery pressure of the hydrogen/helium slip
stream is measured by the first ion gauge P1. From there, a sample stream passes through a
second precision micro-orifice (leftward of P1 in figure 2) and into the vacuum chamber created
by the turbomolecular pump. The pressure of the sample stream is measured by the second ion
gauge P2, and the pressures of the individual molecular components of the sample stream are
measured by the RF-quadrupole within the residual gas analyzer (RGA). The flow rate through
the second micro-orifice can be increased by increasing the upstream pressure measured by P1.
All gas that is taken in with the slip stream, but is not part of the sample stream, is pumped out
by the scroll pump. For the following tests, the carrier gas passed through the cryotrap bypass.
The effect of delivery pressure through the precision micro-orifice and changes in the
flow rate were evaluated in order to characterize the RGA hydrogen detection system.
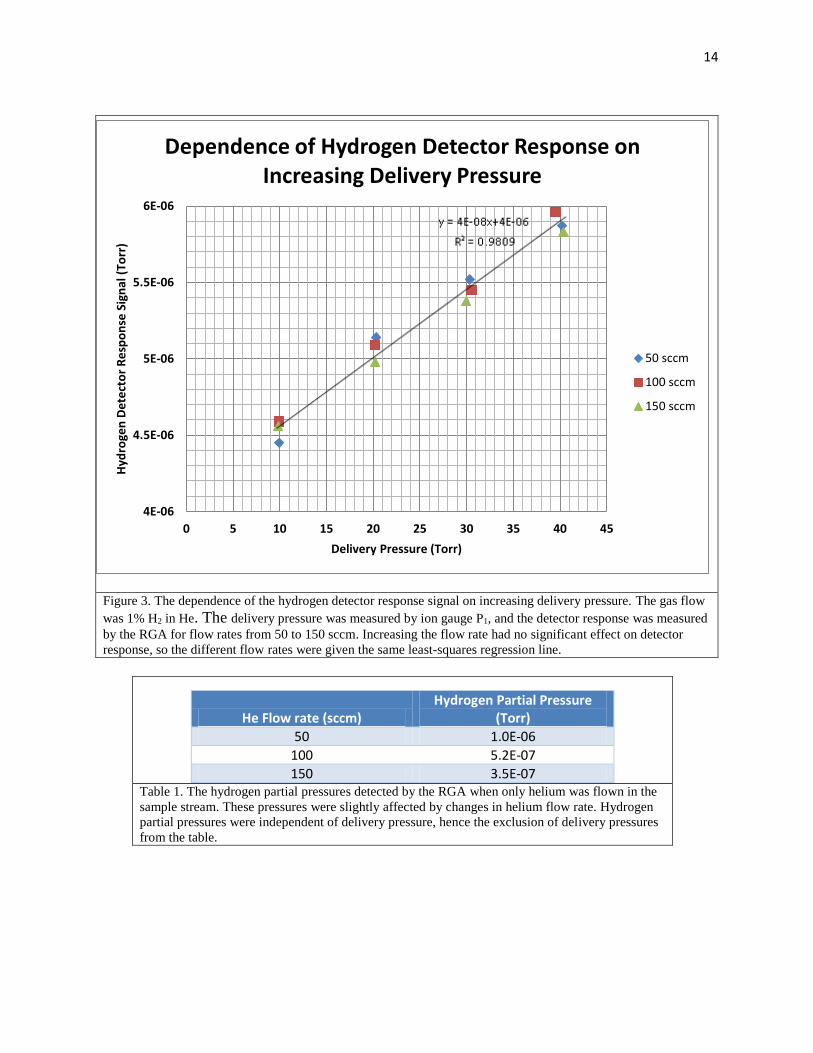
For the test in figure 3, 1% hydrogen in helium gas was flown in the carrier stream. The
linear relationship between delivery pressure and hydrogen detector response in figure 3 shows
that the pressure on the upstream side of the precision micro-orifice determines the gas flow into
the vacuum. A four fold increase in the delivery pressure yielded a 28% increase in detected
hydrogen. To first order, the detected signal was insensitive to the helium gas flow rate.
For the test summarized in table 1, only helium was flown in the sample stream. The
hydrogen partial pressure detected by the RGA did not change with delivery pressure, but it did
change slightly when the helium flow rate set by the MFCs increased. The very small hydrogen
partial pressures indicate that the vacuum system is remarkably efficient at pumping out
hydrogen.
6
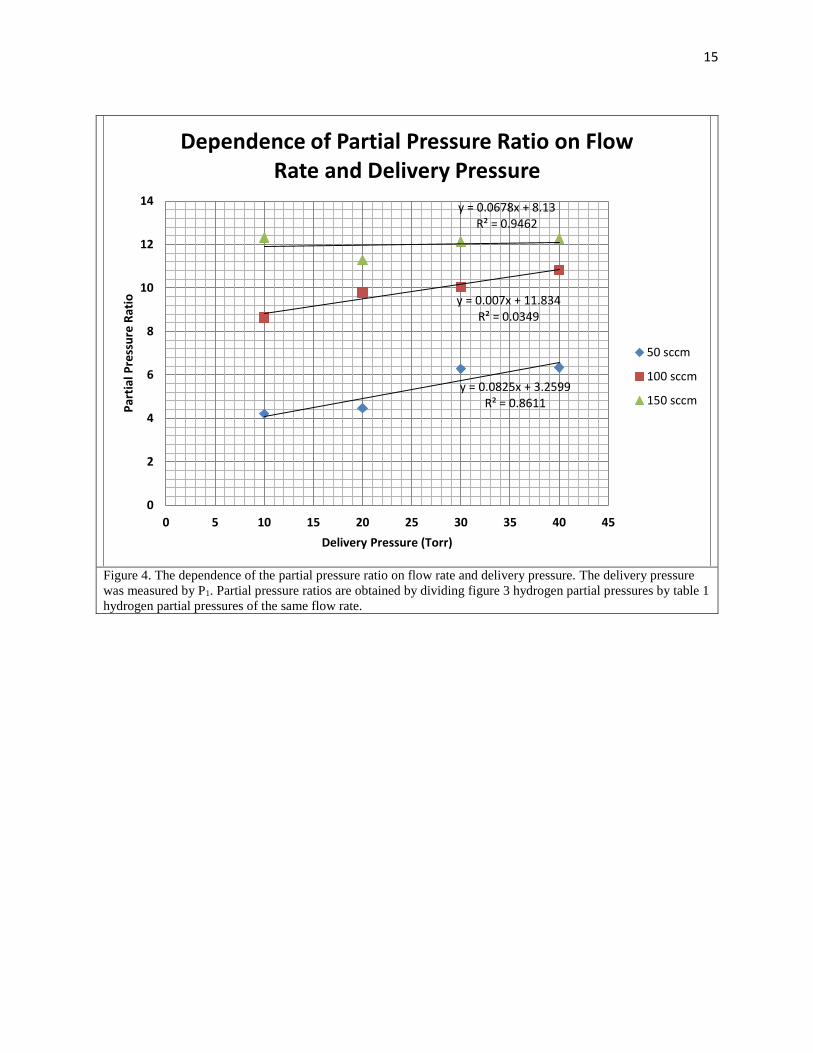
Figure 4 illustrates the ratio between the partial pressures in figure 3 (with hydrogen
flow) and table 1 (without hydrogen flow), and that ratio’s dependence on flow rate and and
delivery pressure. This shows the system’s ability to distinguish different hydrogen
concentrations under varying delivery pressures and flow rates. The system can differentiate
between an absence of hydrogen and the presence of very small quantites of hydrogen. Also of
note is that the ratio becomes less dependent on delivery pressure at higher flow rates. Operating
at 150 sccm eliminates the detector’s dependence on delivery pressure.
While this system allowed for predictable and precise measurments of hydrogen pressure,
it took a very long time for all hydrogen to be pumped out the system once introduced, and the
flow rate through the micro-orifices had to be recalculated every time the upstream pressure was
changed. It also proved to be less sensitive than system 3.
System 3
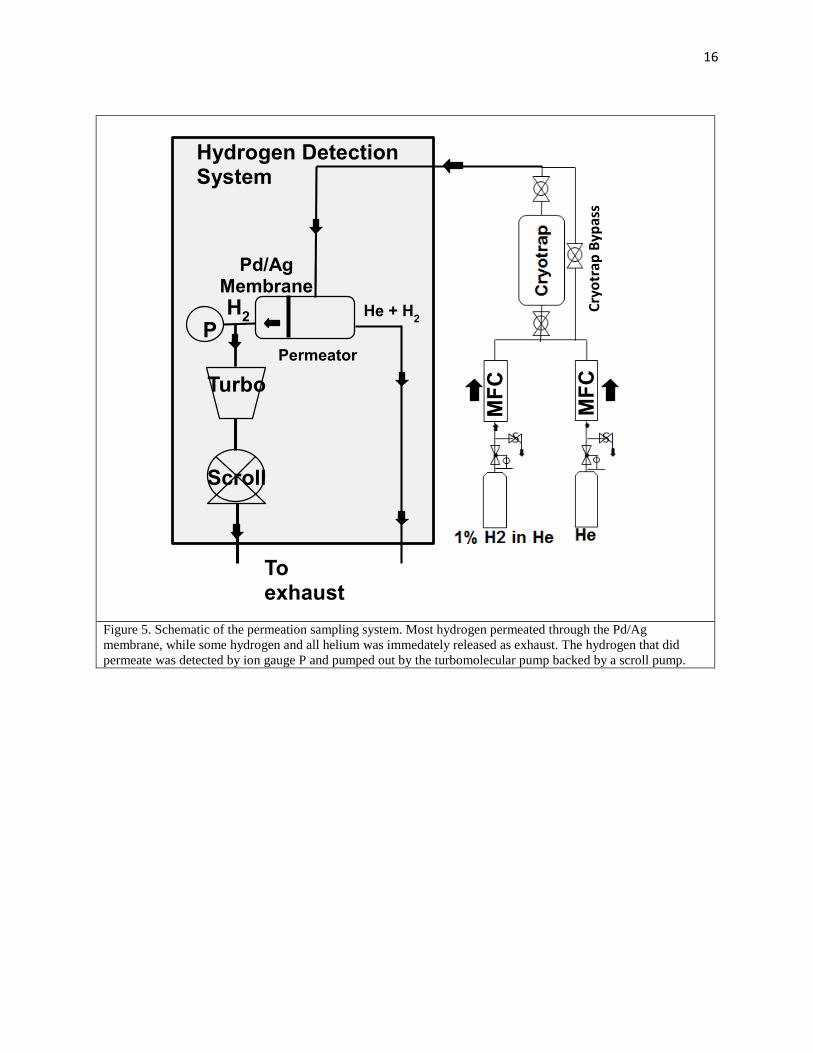
The third system relies on permeation through a palladium/silver membrane. A schematic
for this sampling approach can be seen in figure 5. In this system, a membrane separates the
vacuum chamber from the carrier stream. The vacuum chamber draws gas from the carrier
stream through the membrane, but the membrane is only permeable to atomic hydrogen.
Molecular hydrogen dissociates on the membrane surface into atomic hydrogen which readily
passes through the membrane and reforms as molecular hydrogen on the downstream side.(3)
Most hydrogen in the carrier stream passes through the membrane. Helium and some hydrogen
in the carrier stream leave through the exhaust system. Molecular hydrogen within the vacuum
chamber on the downstream side is detected by ion gauge P. When heated above 180° C, the
membrane diffusivity for hydrogen increases noticeably. In the present work, the membrane
7
temperature was maintained between 250°C and 400°C. Temperatures below 400°C were used to
ensure that the amount of hydrogen permeating into the vacuum system did not swamp the
turbomolecular pump.
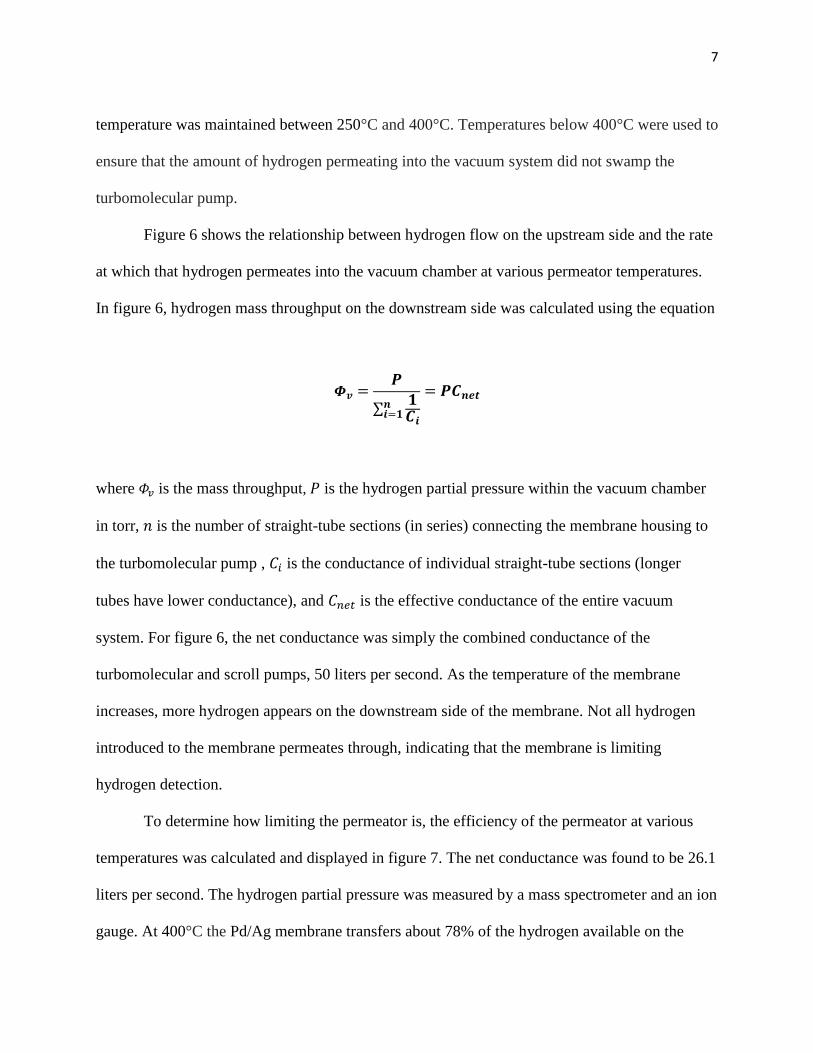
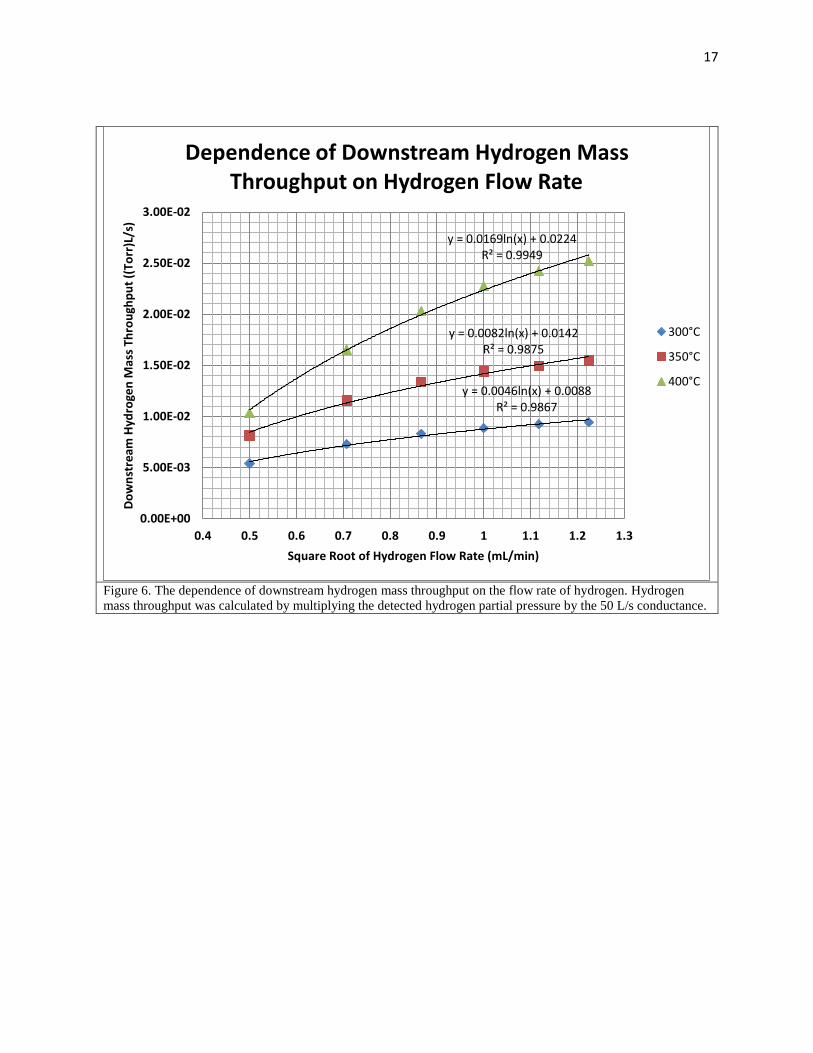
Figure 6 shows the relationship between hydrogen flow on the upstream side and the rate
at which that hydrogen permeates into the vacuum chamber at various permeator temperatures.
In figure 6, hydrogen mass throughput on the downstream side was calculated using the equation
𝜱𝒗 =𝑷
∑𝟏𝑪𝒊
𝒏𝒊=𝟏
= 𝑷𝑪𝒏𝒆𝒕
where 𝛷𝑣 is the mass throughput, 𝑃 is the hydrogen partial pressure within the vacuum chamber
in torr, 𝑛 is the number of straight-tube sections (in series) connecting the membrane housing to
the turbomolecular pump , 𝐶𝑖 is the conductance of individual straight-tube sections (longer
tubes have lower conductance), and 𝐶𝑛𝑒𝑡 is the effective conductance of the entire vacuum
system. For figure 6, the net conductance was simply the combined conductance of the
turbomolecular and scroll pumps, 50 liters per second. As the temperature of the membrane
increases, more hydrogen appears on the downstream side of the membrane. Not all hydrogen
introduced to the membrane permeates through, indicating that the membrane is limiting
hydrogen detection.
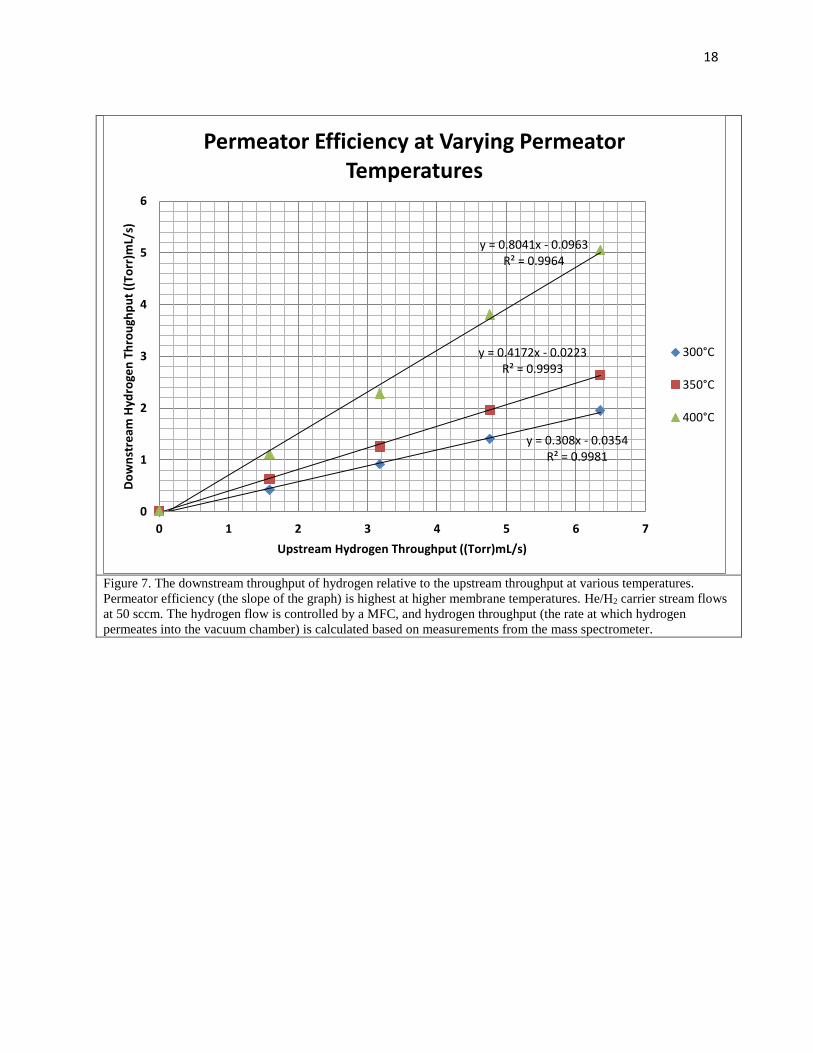
To determine how limiting the permeator is, the efficiency of the permeator at various
temperatures was calculated and displayed in figure 7. The net conductance was found to be 26.1
liters per second. The hydrogen partial pressure was measured by a mass spectrometer and an ion
gauge. At 400°C the Pd/Ag membrane transfers about 78% of the hydrogen available on the
8
upstream side of the membrane, as shown in figure 7. Using this figure, the hydrogen flown in
the system can be measured, even though some of it does not pass through the Pd/Ag membrane.
Characterization of the Cryotrap
Because system 3 (the permeation approach) had the highest sensitivity to hydrogen and
was the most user friendly, it was chosen to detect hydrogen flowing through the cryotrap. The
schematic for these tests is illustrated in figure 5.
The cryotrap was cooled with liquid nitrogen. The liquid nitrogen was flown through a
stainless steel coil which was brazed to the stainless steel column containing the molecular sieve.
The assembly was insulated to reduce heat loss to the surroundings. The column was cooled by
thermal conduction once the cooling coil was filled with liquid nitrogen. The temperature of the
cryotrap was monitored by thermocouples. Once the cryotrap reached temperatures around
-180°C, helium gas was flown through the cryotrap bypass to establish a baseline reading on the
mass spectrometer hydrogen detector. Once this baseline was established, the bypass was closed,
the cryotrap was opened, and a hydrogen/helium carrier stream was flown through. This change
in gas composition produced no change in the baseline, indicating that the molecular sieve was
extracting all the hydrogen from the carrier stream. Once the column was filled to capacity,
hydrogen would break through to the downstream side. At this point the hydrogen/helium flow
was stopped and a pure helium stream initiated. The column was unloaded by raising the
temperature of the column.
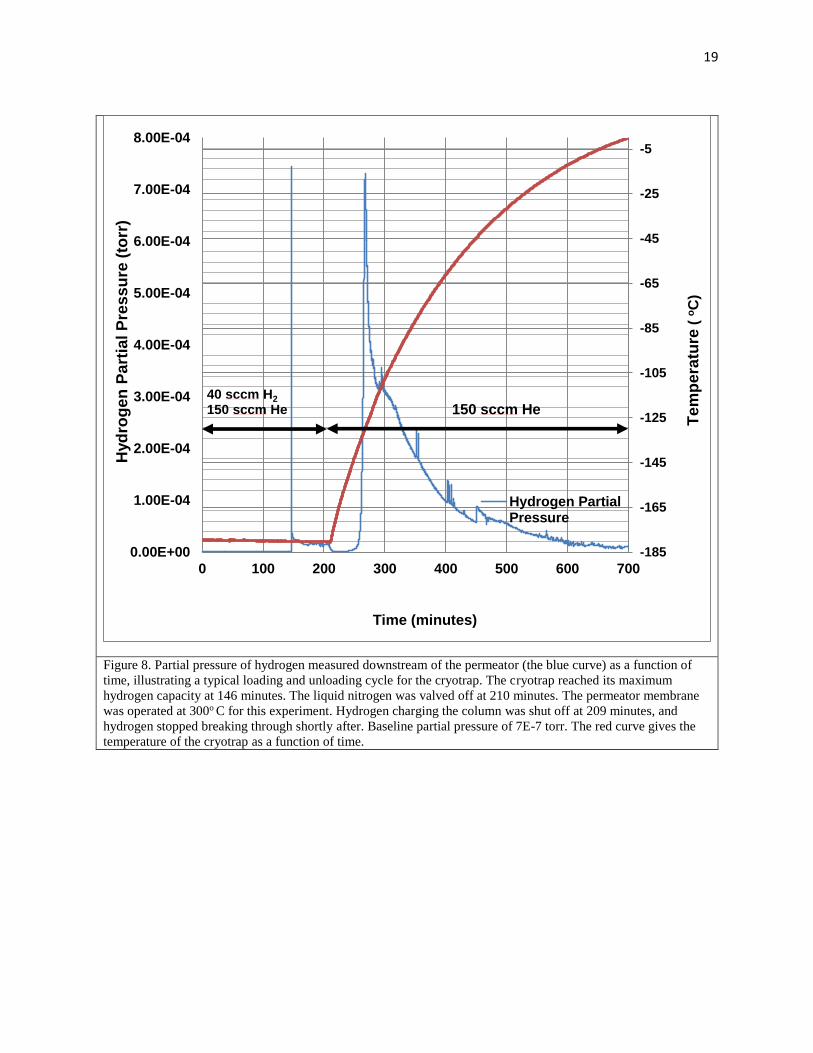
Figure 8 provides the partial pressure of hydrogen present downstream of the cryotrap as
a function of time during the loading and unloading cycle of the cryotrap. Helium flowing at 150
sccm is co-mixed with hydrogen flowing at 40 sccm and introduced into the inlet of the cryotrap
9
held at 93 K. Initially all the hydrogen is adsorbed on the cold molecular sieve. No hydrogen is
detected downstream of the cryotrap, and the hydrogen partial pressure at the exhaust end of the
cryotrap is at a background value. At 146 minutes hydrogen breaks through the cryotrap. A spike
in the hydrogen partial pressure is observed followed by a steady although slightly declining
hydrogen partial pressure. This curve suggests that initially a puff of hydrogen is released into
the helium stream followed by a gradual release of hydrogen into the helium discharge
approximately two orders of magnitude lower. The capacity of the column to hold hydrogen at
93 K before hydrogen appears at the outlet is 5.86 sL or equivalently 108.7 scc per gram of
molecular sieve at 93 K (-180oC).
At 209 minutes, the injection of hydrogen into the cryotrap inlet is stopped but the helium
purge stream continues to flow at 150 sccm. Within a few seconds the hydrogen partial pressure
in the exhaust stream is observed to decrease towards the original baseline value and remain at
the low value until the cryotrap begins to warm up. Clearly the column can retain the captured
hydrogen without releasing its contents to the helium purge stream provided the column remains
cold.
At 210 minutes, the liquid nitrogen cooling to the coil is turned off but the coil does not
warm up noticeably for an additional 13 minutes. At 233 minutes, the coil temperature reaches
127 K (-156oC) and the hydrogen partial pressure is observed to increase above the baseline
value. The majority of the hydrogen is released once the column reaches approximately 130 K
(-140oC). The remainder of the gas is released as the coil warms up beyond 170 K (-100oC).
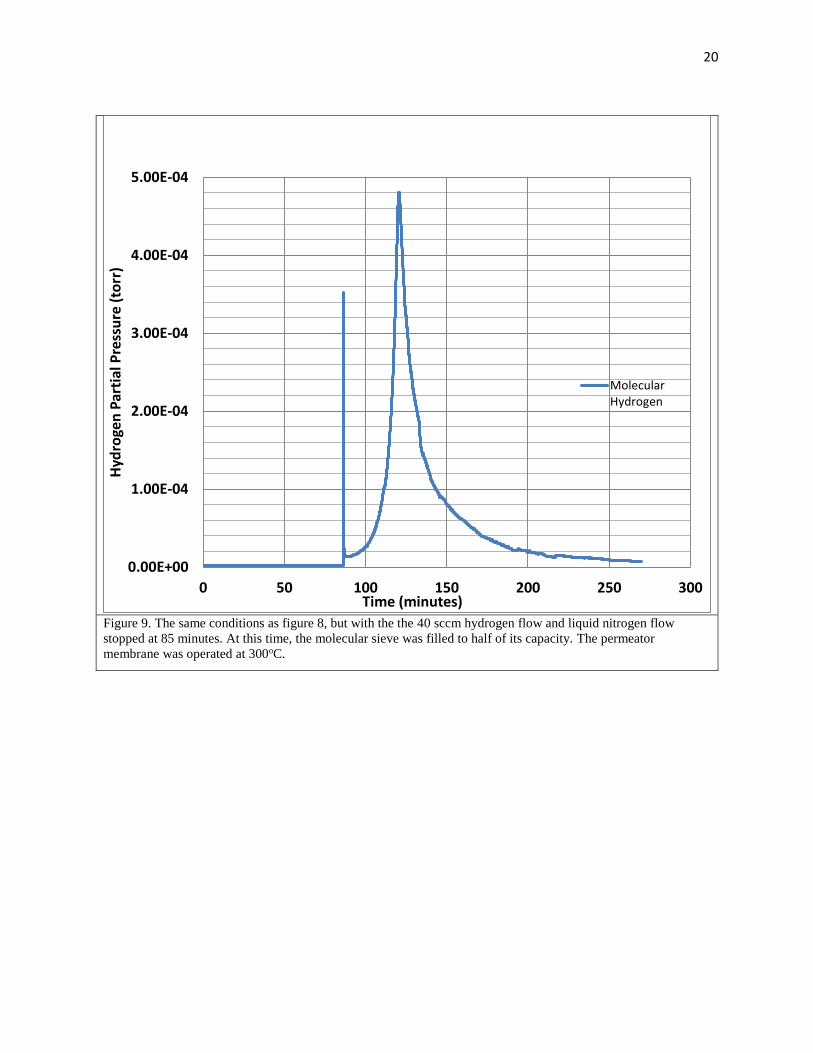
To understand if the initial spike observed at minute 146 in Figure 8 was an artifact of
filling the coil to capacity, a second test was carried out in which the coil was filled to half
capacity using the same loading conditions. The results are provided in Figure 9. At 85 min both
10
the hydrogen and the liquid nitrogen flows were stopped. A spike similar to that observed in
Figure 8 is observed moments after the hydrogen flow is turned off before the hydrogen partial
pressure in the coil exhaust returns towards background. As the coil starts to warm up, the
hydrogen partial pressure is observed to rise above its background value. This test establishes
that the hydrogen partial pressure spike in the coil effluent is not a result of the cryotrap being
charged to capacity.
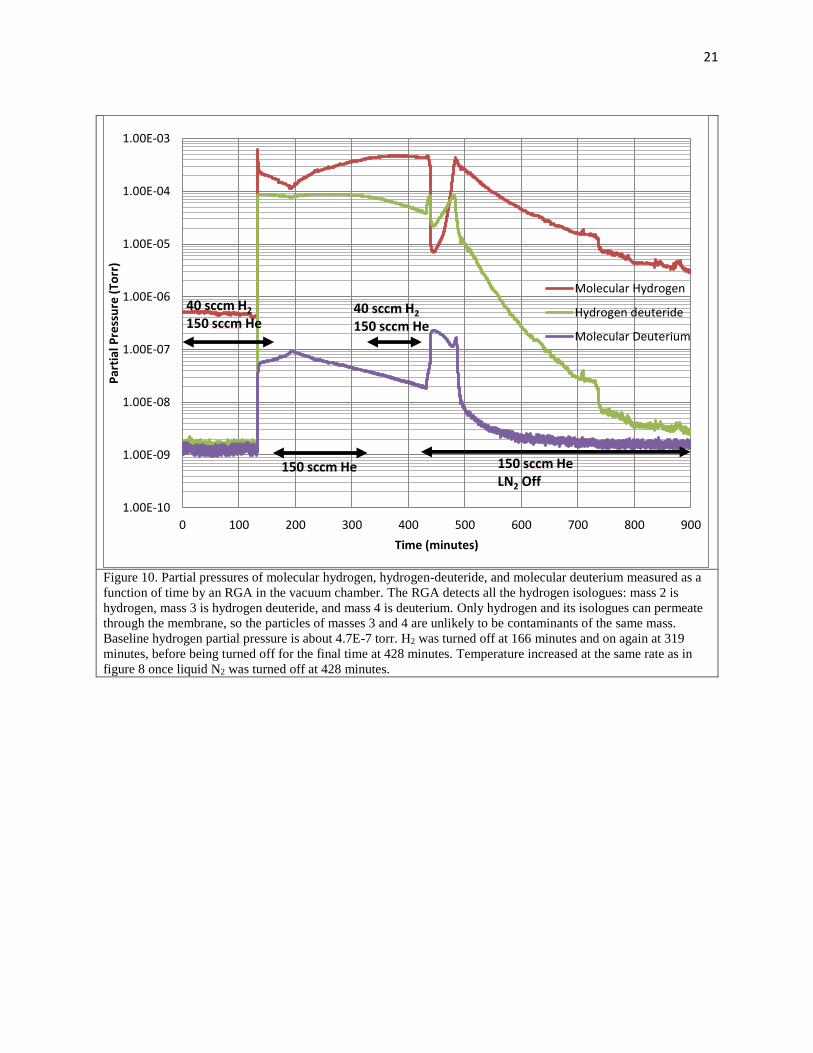
Deuterium is naturally present in hydrogen gas at a concentration on the order of 150
ppm. To determine if D2 is responsible for the spike observed in the two preceding tests, the
experiment described in Figure 8 was repeated. However, in this test the residual gas analyzer
(RGA) was set to measure the concentrations of three hydrogen isologues: H2, HD and D2. The
results are illustrated in Figure 10. At 146 minutes hydrogen breaks through the column as
before, once the column is fully loaded, and the characteristic spike is observed. However,
increases in both HD and D2 are also observed. The HD contribution is most likely a result of
isotope scrambling of H2 and D2 to form HD as the two species permeate through the Pd/Ag
membrane in the hydrogen detector. The D2 partial pressure increase continues for an additional
30 minutes and then begins to decrease with time even after the hydrogen flow has been re-
initiated at 319 minutes. The H2 partial pressure increases to approximately the peak value of the
initial spike and remains at that value even though hydrogen is being added at the coil entrance.
Both H2 and D2 are being eluted from the coil at concentrations that do not depend on the inlet
hydrogen/deuterium concentrations.
At 428 minutes the LN2 cooling to the coil is turned off. Four minutes later, at 432
minutes, D2 release from the coil increases rapidly to a reach an approximate steady state value
until the column is emptied of D2. The hydrogen concentration in the effluent drops, and at 428
11
minutes the coil has heated sufficiently to start the release of H2 from the coil. All the D2 is
released in about 58 minutes. The bulk of the H2 is released after 400 minutes. The details of this
behavior will be the subject of future work.
Conclusions
Of the three hydrogen detection systems proposed for evaluating the performance of the
cryotrap, the permeation system proved to be the most effective and feasible. It had a high degree
of sensitivity and efficiency. The thermal conductivity detection system was difficult to
implement due to the similar thermal conductivities of helium and 1% hydrogen in helium. The
atmospheric sampling system, while workable, lacked the sensitivity of the permeation system.
Evaluation of the cryotrap with the permeation system revealed several interesting
phenomena. Breakthrough is sudden and significant once the column reaches capacity. Hydrogen
can be eluted from a full, cold column by continuously purging the column with helium.
Deuterium can be separated from hydrogen by warming the column.
References
1. Shmayda, Walter. Evaluation of Tritium Capture Systems. 25th Symposium on Fusion
Engineering. San Francisco, CA, USA. June 10-14 2013.
2. Jo, Aaron. Hydrogen Isotope Separation Using Gas Chromatography. 2012 Summer
Research Program at the University of Rochester's Laboratory for Laser Energetics.
3. Yokogawa Corporation of America. Hydrogen Permeation. January 11, 2012
12
Acknowledgements
I would like to thank Dr. R.S. Craxton for allowing me to participate in this program. I
would also like to thank Dr. Shmayda and Neil Redden for the incredible support they gave me,
along with Andrew Boyce and Aaron Jo for the guidance they provided.
Figures
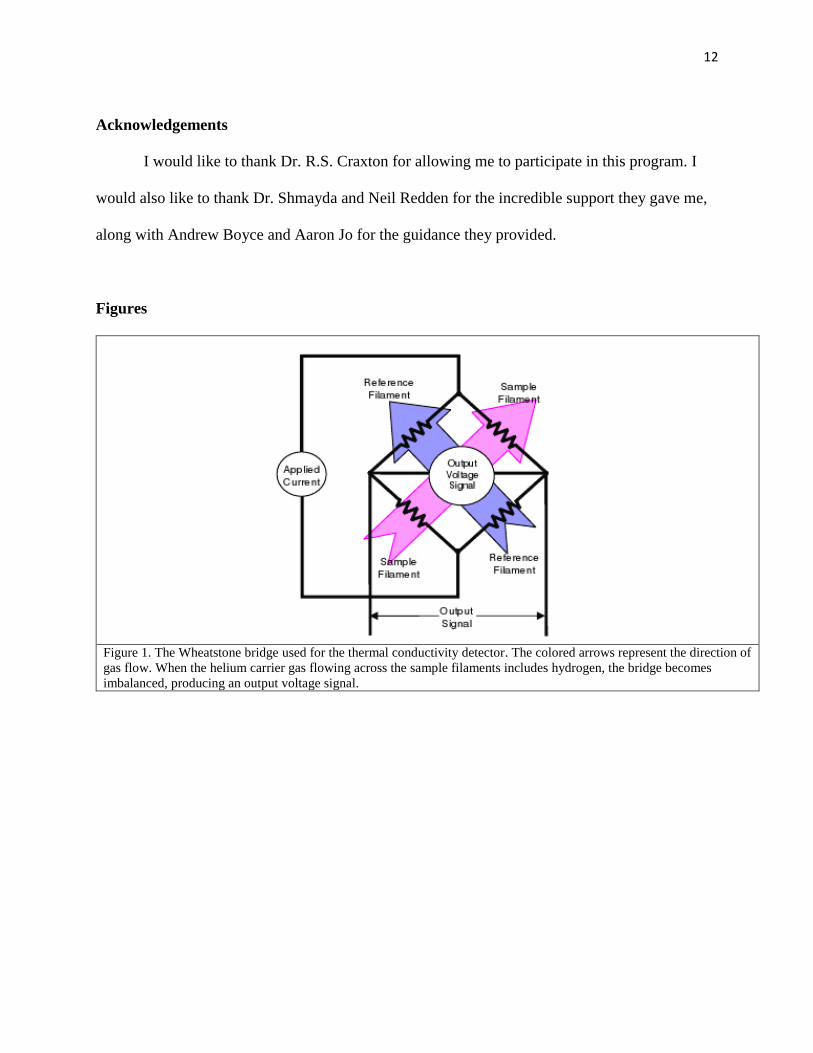
Figure 1. The Wheatstone bridge used for the thermal conductivity detector. The colored arrows represent the direction of
gas flow. When the helium carrier gas flowing across the sample filaments includes hydrogen, the bridge becomes
imbalanced, producing an output voltage signal.
13
Figure 2. Schematic of the atmospheric sampling system with gas flow setup. Gas flowed through the cryotrap bypass
for these tests. P1 and P2 represent ion gauges, which measure delivery pressure and sample pressure, respectively.
“MFC”s are mass flow controllers, “RGA” is the residual gas analyzer with an RF-quadrupole mass spectrometer. The
turbomolecular and scroll pumps draw gas through the system and create a vacuum.
MFC
MFC
Slip stream
To Exhaust
Cry
otr
ap B
ypas
s
14
Figure 3. The dependence of the hydrogen detector response signal on increasing delivery pressure. The gas flow
was 1% H2 in He. The delivery pressure was measured by ion gauge P1, and the detector response was measured
by the RGA for flow rates from 50 to 150 sccm. Increasing the flow rate had no significant effect on detector
response, so the different flow rates were given the same least-squares regression line.
He Flow rate (sccm) Hydrogen Partial Pressure
(Torr)
50 1.0E-06
100 5.2E-07
150 3.5E-07 Table 1. The hydrogen partial pressures detected by the RGA when only helium was flown in the
sample stream. These pressures were slightly affected by changes in helium flow rate. Hydrogen
partial pressures were independent of delivery pressure, hence the exclusion of delivery pressures
from the table.
4E-06
4.5E-06
5E-06
5.5E-06
6E-06
0 5 10 15 20 25 30 35 40 45
Hyd
roge
n D
ete
cto
r R
esp
on
se S
ign
al (
Torr
)
Delivery Pressure (Torr)
Dependence of Hydrogen Detector Response on Increasing Delivery Pressure
50 sccm
100 sccm
150 sccm
15
Figure 4. The dependence of the partial pressure ratio on flow rate and delivery pressure. The delivery pressure
was measured by P1. Partial pressure ratios are obtained by dividing figure 3 hydrogen partial pressures by table 1
hydrogen partial pressures of the same flow rate.
y = 0.0825x + 3.2599R² = 0.8611
y = 0.0678x + 8.13R² = 0.9462
y = 0.007x + 11.834R² = 0.0349
0
2
4
6
8
10
12
14
0 5 10 15 20 25 30 35 40 45
Par
tial
Pre
ssu
re R
atio
Delivery Pressure (Torr)
Dependence of Partial Pressure Ratio on Flow Rate and Delivery Pressure
50 sccm
100 sccm
150 sccm
16
Figure 5. Schematic of the permeation sampling system. Most hydrogen permeated through the Pd/Ag
membrane, while some hydrogen and all helium was immedately released as exhaust. The hydrogen that did
permeate was detected by ion gauge P and pumped out by the turbomolecular pump backed by a scroll pump.
Scroll
P
Hydrogen Detection System
Turbo
Permeator
MF
C
MF
C
He + H2 H
2
To exhaust
Pd/Ag Membrane
Cry
otr
ap B
ypas
s
17
Figure 6. The dependence of downstream hydrogen mass throughput on the flow rate of hydrogen. Hydrogen
mass throughput was calculated by multiplying the detected hydrogen partial pressure by the 50 L/s conductance.
y = 0.0046ln(x) + 0.0088R² = 0.9867
y = 0.0082ln(x) + 0.0142R² = 0.9875
y = 0.0169ln(x) + 0.0224R² = 0.9949
0.00E+00
5.00E-03
1.00E-02
1.50E-02
2.00E-02
2.50E-02
3.00E-02
0.4 0.5 0.6 0.7 0.8 0.9 1 1.1 1.2 1.3
Do
wn
stre
am H
ydro
gen
Mas
s Th
rou
ghp
ut
((To
rr)L
/s)
Square Root of Hydrogen Flow Rate (mL/min)
Dependence of Downstream Hydrogen Mass Throughput on Hydrogen Flow Rate
300°C
350°C
400°C
18
Figure 7. The downstream throughput of hydrogen relative to the upstream throughput at various temperatures.
Permeator efficiency (the slope of the graph) is highest at higher membrane temperatures. He/H2 carrier stream flows
at 50 sccm. The hydrogen flow is controlled by a MFC, and hydrogen throughput (the rate at which hydrogen
permeates into the vacuum chamber) is calculated based on measurements from the mass spectrometer.
y = 0.308x - 0.0354R² = 0.9981
y = 0.4172x - 0.0223R² = 0.9993
y = 0.8041x - 0.0963R² = 0.9964
0
1
2
3
4
5
6
0 1 2 3 4 5 6 7
Do
wn
stre
am H
ydro
gen
Th
rou
ghp
ut
((To
rr)m
L/s)
Upstream Hydrogen Throughput ((Torr)mL/s)
Permeator Efficiency at Varying Permeator Temperatures
300°C
350°C
400°C
19
Figure 8. Partial pressure of hydrogen measured downstream of the permeator (the blue curve) as a function of
time, illustrating a typical loading and unloading cycle for the cryotrap. The cryotrap reached its maximum
hydrogen capacity at 146 minutes. The liquid nitrogen was valved off at 210 minutes. The permeator membrane
was operated at 300o C for this experiment. Hydrogen charging the column was shut off at 209 minutes, and
hydrogen stopped breaking through shortly after. Baseline partial pressure of 7E-7 torr. The red curve gives the
temperature of the cryotrap as a function of time.
-185
-165
-145
-125
-105
-85
-65
-45
-25
-5
0.00E+00
1.00E-04
2.00E-04
3.00E-04
4.00E-04
5.00E-04
6.00E-04
7.00E-04
8.00E-04
0 100 200 300 400 500 600 700
Hyd
rog
en
Pa
rtia
l P
res
su
re (
torr
)
Time (minutes)
Hydrogen PartialPressure
40 sccm H2
150 sccm He
Te
mp
era
ture
( oC
)
150 sccm He
20
Figure 9. The same conditions as figure 8, but with the the 40 sccm hydrogen flow and liquid nitrogen flow
stopped at 85 minutes. At this time, the molecular sieve was filled to half of its capacity. The permeator
membrane was operated at 300oC.
0.00E+00
1.00E-04
2.00E-04
3.00E-04
4.00E-04
5.00E-04
0 50 100 150 200 250 300
Hyd
roge
n P
arti
al P
ress
ure
(to
rr)
Time (minutes)
MolecularHydrogen
21
Figure 10. Partial pressures of molecular hydrogen, hydrogen-deuteride, and molecular deuterium measured as a
function of time by an RGA in the vacuum chamber. The RGA detects all the hydrogen isologues: mass 2 is
hydrogen, mass 3 is hydrogen deuteride, and mass 4 is deuterium. Only hydrogen and its isologues can permeate
through the membrane, so the particles of masses 3 and 4 are unlikely to be contaminants of the same mass.
Baseline hydrogen partial pressure is about 4.7E-7 torr. H2 was turned off at 166 minutes and on again at 319
minutes, before being turned off for the final time at 428 minutes. Temperature increased at the same rate as in
figure 8 once liquid N2 was turned off at 428 minutes.
1.00E-10
1.00E-09
1.00E-08
1.00E-07
1.00E-06
1.00E-05
1.00E-04
1.00E-03
0 100 200 300 400 500 600 700 800 900
Par
tial
Pre
ssu
re (
Torr
)
Time (minutes)
Molecular Hydrogen
Hydrogen deuteride
Molecular Deuterium
40 sccm H2
150 sccm He40 sccm H2
150 sccm He
150 sccm He 150 sccm HeLN2 Off