Embed Size (px)
Citation preview
The European Accounting Review 2002, 11:3, 509-535 _________________________________________________________________________
Detecting falsified financial statements: a comparative study using multicriteria
analysis and multivariate statistical techniques
Ch. Spathis Aristotle University of Thessaloniki
M. Doumpos and C. Zopounidis
Technical University of Crete _________________________________________________________________________ ABSTRACT
Falsifying Financial Statements involves the manipulation of financial accounts by overstating assets, sales and profit, or understating liabilities, expenses, or losses. This paper explores the effectiveness of an innovative classification methodology in detecting firms that issue falsified financial statements (FFS) and the identification of the factors associated to FFS. The methodology is based on the concepts of multicriteria decision aid (MCDA) and the application of the UTADIS classification method (UTilités Additives DIScriminantes). A sample of 76 Greek firms (38 with FFS and 38 non-FFS) described over ten financial ratios is used for detecting factors associated with FFS. A Jackknife procedure approach is employed for model validation and comparison with multivariate statistical techniques, namely discriminant and logit analysis. The results indicate that the proposed MCDA methodology outperforms traditional statistical techniques which are widely used for FFS detection purposes. Furthermore, the results indicate that the investigation of financial information can be helpful towards the identification of FFS and highlight the importance of financial ratios such as the total debt to total assets ratio, the inventories to sales ratio, the net profit to sales ratio and the sales to total assets ratio. Keywords: Financial statements, Fraud detection, Red flags, Multicriteria decision aid, Multivariate statistical techniques, Jackknife approach.
1. INTRODUCTION Falsified Financial Statement (FFS) are increasingly frequent over the last few years. Falsifying financial statements primarily consists of the manipulating elements by overstating assets, sales and profit, or understating liabilities, expenses, or losses. When a financial statement contains falsifications so that its elements no longer represent the true picture, we speak of fraud. Management fraud can be defined as “deliberate fraud committed by management that injures investors and creditors through misleading financial statements” (Eliott and Willingham, 1980). The type of fraud addressed in this paper is financial statement fraud: the intentional misstatements or omissions of amounts or disclosures in financial statements (AICPA 1977). Fraud and white-collar crime have reached proportions in the United States. Some estimations suggest that fraud costs American business more
Ch. Spathis, M. Doumpos and C. Zopounidis / The European Accounting Review ___________________________________________________________________________ 2 than $400 billion annually (Wells, 1997). In a global economy and multinational trade, the trend of international fraud affects all countries (Vanasco, 1998).
In this study, we examine in-depth publicly available data from firms’ financial statements for detecting FFS using a multicriteria decision aid classification method. The goal of this research is to identify financial factors to be used by auditors in assessing the likelihood of FFS. One main objective is to introduce, apply, and evaluate the use of a new decision aid method in differentiating between fraud and non-fraud observations. For this purpose a multicriteria decision aid (MCDA) approach is employed. Compared to existing techniques the proposed methodology provides a non-parametric framework for developing FFS detection models based on goal-programming techniques. The developed models have a non-linear utility-based form that enables the consideration of both quantitative and qualitative criteria (e.g., management). Though qualitative criteria are not considered in this study, prior research has shown that qualitative criteria contribute to FFS detection. Furthermore, the developed FFS detection models have a decision aid orientation, in the sense that they can be used not only to take a decision but also to explain the way that it has been taken. In that regard, the users of such models can understand how the models’ suggestions are obtained on the basis of the performance of the firms on the considered factors (decision criteria).
Within this context, an analysis is performed based on a sample consisting of 76 Greek firms, including both firms with FFS and non-FFS firms. The analysis is conducted in four main stages: (a) factor analysis is used to selection of variables, (b) a multicriteria decision aid (MCDA) classification method (UTADIS; Zopounidis and Doumpos, 1999), is used to investigate its applicability and efficiency in identifying the factors associated with FFS, (c) a Jackknife approach is employed for model validation in order to explore thoroughly the effectiveness of the proposed approach, and (d) a comparison with well-known multivariate statistical techniques including discriminant analysis and logit analysis is also performed. The models were developed with a high probability of detecting FFS in the sample, and they indicate the significance of the financial ratios total debt to total assets, inventories to sales, net profit to sales and sales to total assets.
The rest of paper is organised as follows: Section 2 reviews the previous research on the detection of FFS. Section 3 presents the major aspects of the proposed methodology, including the model used to detect FFS and the sample data used in the present study. Section 4 describes the results obtained using the UTADIS classification method and reports the comparison with multivariate statistical techniques. Finally, in Section 5 the concluding remarks are presented. 2. PREVIOUS RESEARCH Background literature No one knows how many business failures are actually caused by fraud, but undeniably lots of businesses go bankrupt each year due to fraud losses. In USA incidences of fraud cut across all industries with greatest losses apparent (fraud losses by industry) in real estate financing, manufacturing, banking, oil and gas, construction, and in health care (Wells, 1997). Losses can occur in almost any area, certainly not just in cash area. Losses in cash actually represent the lowest level of fraud. Accounts receivable, expenditures for services, and inventory losses are each three times higher than those in cash. Fraud is not just a problem in large firms. Small businesses with 1-100 employees are also susceptible. This is a serious problem because fraud in a small firm has a greater impact, as the firm does not have the resources to absorb the loss (Wells, 1997).
A report by the Committee of Sponsoring Organizations of the Treadway Commission (COSO) that compiled by Beasley et al., (1999) examined Fraudulent Financial Reporting from 1987 – 1997 by U.S. public companies. Some of the most critical insights of the study are: (a) the companies committing fraud generally were small, and most (78 percent of the sample) were not listed in the New York or American Stock Exchanges; (b) incidences of fraud went to the very top of the organizations concerned. In the 72 percent of the cases, the CEO appeared to be associated with the fraud, and in 43 percent the CEO was associated with the financial statement fraud; (c) the audit committees and boards of the respective companies appeared to be weak. Most audit committees rarely met, and the companies’ boards of directors were dominated by insiders and other outsiders “grey” directors, with

Ch. Spathis, M. Doumpos and C. Zopounidis / The European Accounting Review ___________________________________________________________________________
3 significant equity ownership and apparently little experience of serving as directors of others companies. Twenty-five percent of the companies did not have an audit committee; (d) the founders and board members owned a significant portion of the companies. In nearly 40 percent of the companies, authorizations for votes by proxy provided evidence of family relationships among the directors and/or officers. The founder and current CEO were the same person or the original CEO/President was still in place in nearly half of the companies; (e) severe consequences resulted when companies committed fraud, including bankruptcy, significant changes in ownership, and suspension from trading in national exchanges.
Most techniques for manipulating profits can be grouped into three broad categories – changing accounting methods, fiddling with managerial estimates of costs, and shifting the period when expenses and revenues are included in results (Worthy, 1984). Other false statements include manipulating documents, altering test documents, and producing false work reports (Comer, 1998). For example, recording revenue on shipments after year-end by backdating shipment documents. Asset misappropriation schemes include the theft of company assets e.g., cash and inventory. The study of Vanasco (1998) examines the role of professional associations, governmental agencies, and international accounting and auditing bodies in promulgating standards to prevent fraud in financial statements and other white-collar crimes. It also examines several fraud cases. The cases examined show that the cash, inventory, and related party transactions are prone to fraud. Auditors assign a high-risk index to the potential misappropriation of inventory, cash defalcation, and conflict of interest. Typical financial statement fraud techniques involved the overstatement of revenues and assets (Beasley et al., 1999). Over half the frauds involved overstating revenues by recording revenues prematurely or fictitiously. Many of those revenue frauds only affected transactions recorded right at the end of significant financial reporting periods (i.e., quarter end or year end). About half the frauds also involved overstating assets by understating allowances for receivables, overstating the value of inventory, property, plant and equipment and other tangible assets, and recording assets that did not exist.
Fraudulent statements are the most costly schemes per case. In spite of being the most common and the smallest loss per case, asset misappropriation presents in total the largest losses of the categories. Fraudulent statements, on the other hand, have the lowest total losses. Corporate falsification can also be classified as those committed by insiders for the company (violation of government regulations, i.e., tax, securities, safety and environmental laws). Senior managers might perpetrate financial statement falsifications to deceive investors and lenders or to inflate profits and thereby gain higher salaries and bonuses. Higson (1999) analysed the results of thirteen interviews with senior auditors / forensic accountants on whether their clients report suspected fraud to an external authority. Though some companies do report it, quite a number seem reticent about reporting. Three factors appear to contribute to: (a) the imprecision of the word “fraud”, (b) the vagueness of directors’ responsibilities, and (c) the confusion over the reason for the reporting suspected fraud.
In 1997, the Auditing Standards Board issued Statement on Auditing Standards (SAS) No. 82: Consideration of Fraud in a Financial Statement Audit. This Standard requires auditors to assess the risk of fraud on each audit and encourages auditors to consider both the internal control system and management’s attitude toward controls, when making this assessment (Caplan, 1999). This SAS No. 82, which supersedes SAS No. 53, clarifies but does not increase auditors’ responsibilities to detect fraud (Mancino, 1997). Recent research on SAS No. 82 indicates that implementation of the specific fraud risk assessment varies greatly across firms (Shelton, Whittington and Landsittel, 2000). Shelton et al., looked at the practices of all of the Big Five firms and two second-tier firms. Their study reported that three of the Big Five and both second-tier firms incorporate fraud risk assessment into the overall risk assessment process. The “Auditor’s Report” (Tatum et al., 2001) provides us with a more recent review on the academic fraud literature.
Risk factors “red flags” that relate to fraudulent financial reporting may be grouped in the following three categories (SAS No 82):
(a) Management’s characteristics and influence over the control environment. These pertain to management’s abilities, pressures, style, and attitude relating to internal control and the financial reporting process. For example, strained relationships between management and the current or previous auditor.

Ch. Spathis, M. Doumpos and C. Zopounidis / The European Accounting Review ___________________________________________________________________________ 4
(b) Industry conditions. These involve the economic environment in which the entity operates. For example, a declining industry with increasing business failures.
(c) Operating characteristics and financial stability. These pertain to the nature and complexity of the entity and its transactions, the entity’s financial condition, and its profitability. For example, significant related-party transactions not in the ordinary course of business or with related entities not audited or audited by another firm.
The International Auditing Practices Committee (IAPC) of the International Federation of Accountants approved the International Statement on Auditing (ISA) 240. This standard respects the auditor’s consideration of the risk that fraud and error may exist, and clarifies the discussion of the inherent limitations of an auditor’s ability to detect error and fraud, particularly management fraud. Moreover, it emphasizes the distinction between management and employee fraud and expands the discussion of fraudulent financial reporting.
Detecting Falsified Financial Statements
In their study, Matsumura and Tucker (1992) examine a strategic interaction between a manager and an auditor and develop a theoretical foundation through game-theoretic analysis and economic experimentation. In the game, the manager first chose a probability of committing fraud. Then the auditor, without observing the manager's choice, determined whether to perform tests of controls and decided the level of detailed tests of balances. Four independent variables (a) the auditor's penalty, (b) auditing standard requirements, (c) the quality of the internal control structure, and (d) the audit fee, were examined to assess their effects on tests of transactions and detailed tests of balances, fraud detection, and incidence of fraud. The results indicate that the increase of the auditor's penalty decreases fraud, increases detailed tests of balances, decreases tests of transactions, and finally increases fraud detection. For a strategy with reference to auditing and fraud, Morton (1993) notes, that auditors often use sampling methods to audit probabilistically and the probability of auditing is usually contingent on information about that item. His model of an audit reporting game in which a manager reports on the privately observed value of a firm, the optimal audit policy for the firm's owner is never to audit if a report is sufficiently large and to audit probabilistically in other cases. Only a costly audit can verify the report and impose penalties on the manager if fraud is found. However, the manager has perfect control over the report and would never make a fraudulent report that would certainly be discovered. As the audit cost decreases, the likelihood for an audit expands and the amount of misreporting declines.
Bloomfield (1997) uses behavioural laboratory experiments, which indicated amongst other conclusions that auditors have more trouble assessing fraud risk when they face high legal liability for audit failure and the firm they are auditing has strong internal controls, in place. Another study examines how reliance on a mechanical decision aid is effected by decision consequences (Boatsman et al., 1997). Experimental participants made planning choices based on available input from actual management fraud cases before and after receiving the decision aid’s predictions of fraud probability. The experiment documents two types of nonreliance: (a) intentionally shifting the final planning judgement away from the aid’s prediction even through this prediction supports the initial planning judgement and (b) ignoring the aid when its prediction does not support the initial planning judgement. The study of Bonner et al., (1998) examines whether certain types of financial reporting fraud result in a higher likelihood of litigation against independent auditors and develops a new taxonomy to document types of fraud that includes 12 general categories. They find that auditors are more likely to be sued when the financial statement frauds are of types that most commonly occur or when the frauds arise from fictitious transactions.
Detecting management fraud is a difficult task using normal audit procedures (Porter and Cameron, 1987; Coderre, 1999). First, there is a shortage of knowledge concerning the characteristics of management fraud. Second, given its infrequency, most auditors lack the experience necessary to detect it. Finally, managers are deliberately trying to deceive the auditors (Fanning and Cogger, 1998). For such managers, who understand the limitations of an audit, standard-auditing procedures may be insufficient. These limitations suggest the need for additional analytical procedures for the effective detection of management fraud.
Ch. Spathis, M. Doumpos and C. Zopounidis / The European Accounting Review ___________________________________________________________________________
5
Recent work has attempted to build models to predict the presence of management fraud. Results from logit regression analysis of 75 fraud and 75 no-fraud firms indicate that no-fraud firms have boards with significantly higher percentages of outside members than fraud firms (Beasley, 1996). Hansen et al., (1996) use a powerful generalized qualitative – response model to predict management fraud based on a set of data developed by an international public accounting firm. The model includes the probit and logit techniques. The results indicate good predictive capability for both symmetric and asymmetric cost assumptions. An experiment was conducted to examine the use of an expert system developed to enhance the performance of auditors (Eining et al., 1997). Auditors using the expert system exhibited the ability to better discriminate among situations with varying levels of management fraud risk and made more consistent decisions regarding appropriate audit actions. Green and Choi (1997) presented the development of a neural network fraud classification model employing endogenous financial data. A classification model creation from the learned behavior pattern was applied to a test sample. During the preliminary stage of an audit, a financial statement classified as fraudulent signals the auditor to increase substantive testing during fieldwork. Fanning and Cogger (1998) use an Artificial Neural Network (ANN) to develop a model for detecting management fraud. Uses publicly available predictors of fraudulent financial statements, they find a model of eight variables with a high probability of detection.
Summers and Sweeney (1998) investigate the relationship between insider trading and fraud. They find, with the use of a cascaded logit model, that in the presence of fraud, insiders reduce their holdings of company stock through high levels of selling activity as measured by either the number of transactions, the number of shares sold, or the dollar amount of shares sold. Beneish (1999) investigates the incentives and the penalties related to earnings overstatements primary in firms that are subject to accounting enforcement actions by the Securities and Exchange Commission (SEC). He finds that the managers are likely to sell their holdings and exercise stock appreciation rights in the period when earnings are overstated, and that the sales occur at inflated prices. The evidence suggests that the monitoring of managers’ trading behavior can be informative about the likelihood of earnings overstatement. Eilifsen et al., (1999) and Hellman (1999), analyse the link between the calculation of taxable income and accounting income influences on the incentive to manipulate earnings, as well as the demand for regulation and verification of both financial statements and tax accounts. Prior work in this field has examined several variables related to data from audit work papers and from financial statements, with various techniques, for their usefulness in detecting management fraud (Fanning et al., 1995).
Bell and Carcello (2000) developed and tested a logistic regression model that estimates the likelihood of fraudulent financial reporting for an audit client conditioned on the presence or absence of several fraud-risk factors. The significant risk factors included in the final model are: weak internal control environment, rapid company growth, inadequate or inconsistent relative profitability, management that places undue emphasis on meeting earnings projections, management that lies to the auditors or is overly evasive, ownership status (public vs. private) on the entity, and interaction term between a weak control environment and an aggressive management attitude towards financial reporting.
3. METHODOLOGY Data The selection of the Greece is due to the availability of the data. It is important to note that the usefulness of the proposed methodology is not affected by the fact that it is applied only to the Greece. The types of data that are employed in this study are also available in other countries. Most FFS in Greece can be identified on the basis of the quantity and content of the qualifications in the reports filed by the auditors on accounts for: depreciation, forecast payment defaults, forecast staff severance pay, participation in other companies, and fiddling of accounts for tax purposes. Most qualifications of financial statements in Greece have the type of “except for” type of qualification that is given when the matter is a material but not fundamental uncertainty or disagreement. This type of opinion is given when there is a GAAP disagreement or a scope limitation. Some qualifications have the type of
Ch. Spathis, M. Doumpos and C. Zopounidis / The European Accounting Review ___________________________________________________________________________ 6 “adverse” type of opinion indicating that the financial statements do not give a true and fair view. This type of opinion is given when the matter concerned gives rise to a fundamental disagreement. An “adverse” opinion is used if the GAAP disagreement is pervasively material. The classification of a financial statement as falsified was based on: (a) the inclusion in the auditors' reports of opinions of serious doubt as to the correctness of accounts; (b) the application of Greek legislation regarding negative net worth; (c) inclusion of the company in the Athens Stock Exchange categories of "under observation" and "negotiation suspended" for reasons associated with falsification of the company's financial data; (d) the existence of court proceedings pending with respect to FFS or serious taxation contraventions.
Thirty-eight firms with complete information are included in the final sample of FFS discovered firms. The FFS discovered firms were matched to 38 non-FFS firms. Thus, the sample of a total of 76 manufacturing firms includes 38 with FFS and 38 with non-FFS (the sample did not include financial companies). An inherent limitation in the study of FFS is the inability to identify all firms in which fraudulent acts occur. FFS never discovered are not available for study. This study compares firms with discovered FFS that are publically revealed to firms that do not have publicly revealed FFS. For the non-FFS firms of the sample, no published indication of FFS behavior was uncovered in a search of databases and the relevant auditors’ reports. It has to be noted that while the process of insuring that none of the considered non-FFS firms had issued FFS was extensive, it cannot guarantee that the financial statements in this group of firms were not falsified. It only guarantees that there was no publicly available FFS information in the auditors’ reports and other sources, such as the Stock Exchange and the Ministry of Finance. Since this only covers information known to this date, there is no guarantee that future information will not prove that members of the control group issue FFS.
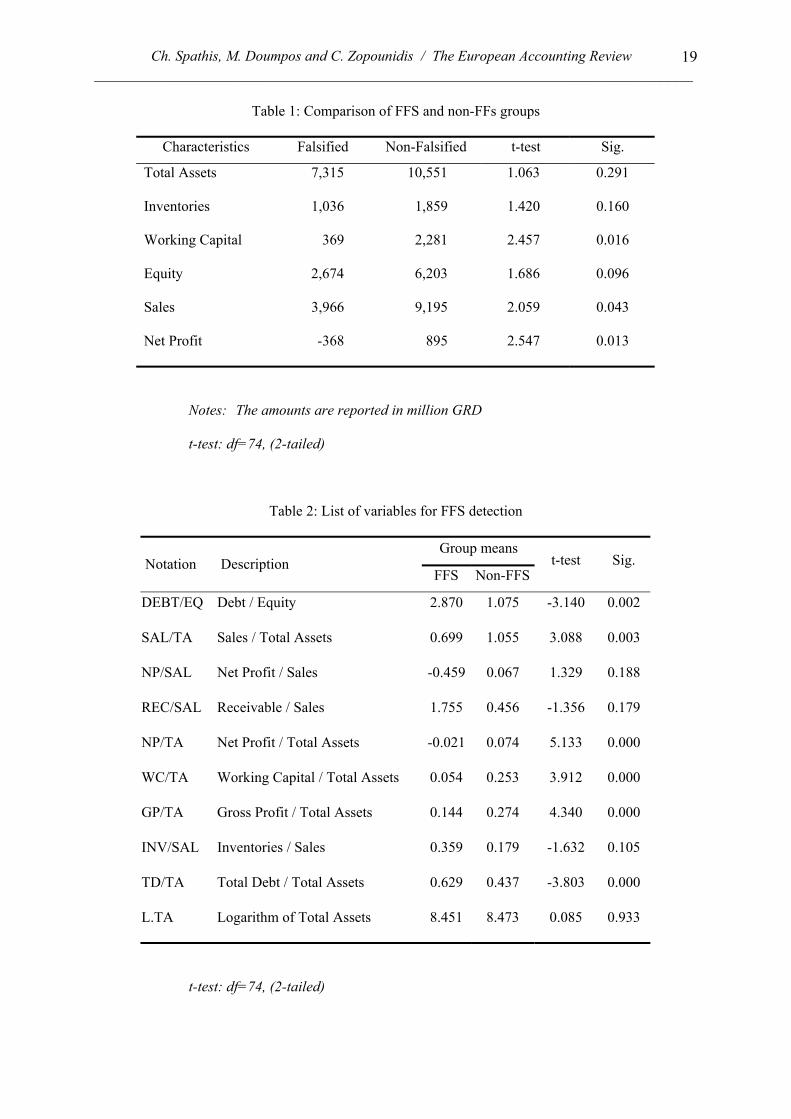
Auditors have checked all the companies included in the sample. All public limited companies (sociétés anonymes) and limited liability companies are obliged to submit to an auditor’s control when they fulfill two of the three following criteria: a) Total revenues are over 1 billion GRD (1 EURO = 340.75 GRD), b) total assets are over 500 million GRD, and c) the average number of employees is over 50 (Ballas, 1994). Differences in the firm size could influence the analyses performed. Rather than matching several control firms to each FFS discovered firm to analyze the effect of size, we minimized the data collection task and controlled for size by matching a single control company to the FFS discovered firms. Some of the characteristics of the full sample companies are presented in Table 1.
Insert Table 1 here
With regard to total assets, although the mean value for FFS firms is 7,315 mill. GRD, and
10,551 mill. GRD for non-FFS firms, the difference is not statistically significant (t=1.063, p=0.291). There is a statistically significant difference between average profits of FFS firms, with losses averaging at 368 mill. GRD, and non-FFS companies averaging a profit of 895 mill. GRD (t=2.547, p=0.013). Similarly a significant difference can be observed in average working capital between FFS firms with 369 mill. GRD, and non-FFS firms with 2,281 mill. GRD (t=2.457, p=0.016). Mean equity also gives a statistically significant difference between FFS firms and non-FFS firms with 2,674 mill. GRD, and 6,203 mill. GRD respectively (t=1.686, p=0.096). With regard to inventories, although mean value for FFS firms is 1,036 mill. GRD, and 1,859 mill. GRD for non-FFS firms, the difference is not statistically significant (t=1.420, p=0.160). Variables The variables in this study come from many sources. To find variables, prior work on the topic of FFS was carefully considered. Such work of Green and Choi (1997), Hoffman (1997), Hollman and Patton (1997), Zimbelman (1997), Beasley (1996), Bologna et al., (1996), Arens and Loebbecke (1994), Bell et al., (1993), Schilit (1993), Davia et al., (1992), Green (1991), Stice (1991), Loebbecke et al., (1989), Palmrose (1987), and Albrecht and Romney (1986) contained suggested indicators of FFS.

Ch. Spathis, M. Doumpos and C. Zopounidis / The European Accounting Review ___________________________________________________________________________
7 Initially, a set of 17 financial ratios was selected on judgmental bases. However, to avoid ratios providing the same information due to high correlations, it was decided to exclude highly correlated ratios, while retaining ratios describing all aspects of financial performance, including profitability, solvency/liquidity and managerial performance (Courtis, 1978). Except for the correlation analysis, the statistical significance of the financial ratios was also considered through t-tests. This combination of correlation analysis and t-tests led to the selection of a limited set of 10 variables (9 financial ratios and the size related L.TA), which provide meaningful and non-overlapping information (as much as possible). The selected variables for FFS detection are presented in Table 2, along with the results of a t-test on the means for the two groups of firms.
Insert Table 2 here
It is an open question whether a high debt structure is associated with FFS (Persons, 1995). A
high debt structure may increase the likelihood of FFS since it shifts the risk from equity owners and managers to debt owners. Research suggests that the potential wealth transfer from debt holders to managers increase as leverage increases (Chow and Rice, 1982). Management may manipulate financial statements, given the need to meet certain debt covenants. This suggests that higher levels of debt may increase the probability of FFS. This is measured through the difference in the ratio of debt to equity (DEBT/EQ) and total debt to total assets (TD/TA).
There are certain financial statements that are more likely to be manipulated by management. These variables include sales, accounts receivable, allowance for doubtful accounts and inventory (Shilit, 1993; Green, 1991; Loebbecke et al., 1989; Wright and Ashton, 1989). The subjective nature of the judgments involved with these accounts makes them more difficult to audit. Persons (1995), Schilit (1993), Stice (1991), Green (1991) and Feroz et al., (1991) suggest that management may manipulate accounts receivable. The fraudulent activity of recording sales before they are earned may show as additional accounts receivable. We tested this by considering the ratio of accounts receivable to sales (REC/SAL; Fanning and Cogger, 1998; Green, 1991; Daroca and Holder, 1985). Accounts receivable and inventory depend on the subjective judgment involved in estimating uncollected accounts and obsolete inventory. Because subjective judgment is involved in determining the value of these accounts, management may use these accounts as tools for financial statement manipulation (Summers and Sweeney, 1998). Loebbecke et al., (1989) found that the inventory account and accounts receivable were involved in 22 percent and 14 percent, respectively, of frauds in their sample.
Many researchers such as Vanasco (1998), Persons (1995), Schilit (1993) and Stice (1991) also suggest that management may manipulate inventories. The company may not match sales with the corresponding cost of goods sold, thus increasing gross margin, net income and strengthening the balance sheet. Another type of manipulation involves reporting inventory at lower than cost or market value. The company may choose not to record the right amount of obsolete inventory. Consequently, the ratio of inventory to sales is considered (INV/SAL). Another issue examined in this research is whether higher or lower gross margins are related to the issuing of FFS. For this purpose, the ratio of gross profit to total assets is used (GP/TA).
The profitability orientation is tempered by the manager’s own utility maximization, defined (partially) by job security. Following this definition, the achievement of stable or increasing earnings streams maximizes the manager’s utility. This approach is based on the expectation that management will be able to maintain or improve past levels of profitability, regardless of what those levels were (Summers and Sweeney, 1998). If this expectation is not met by actual performance, then it provides a motivation for financial statement falsification. Loebbecke et al., (1989) found that profit relative to industry was inadequate for 35 percent of companies with fraud in their sample. In this research some other financial statement red flag variables were examined, such as the sales to total assets ratio (SAL/TA), net profit to sales (NP/SAL), net profit to total assets (NP/TA), working capital to total assets (WC/TA), for their ability to predict FFS. The sales to total assets ratio was a significant predictor in prior research (Persons, 1995; Fanning and Cogger, 1998).
Ch. Spathis, M. Doumpos and C. Zopounidis / The European Accounting Review ___________________________________________________________________________ 8
Firm size associated with FFS. We examined the relationship between size and FFS. The firms committing FFS generally were small (Beasley et al., 1999). We used the natural log transformation for the total assets (L.TA) in an attempt to induce normality and stabilize variances (Neter et al., 1996).
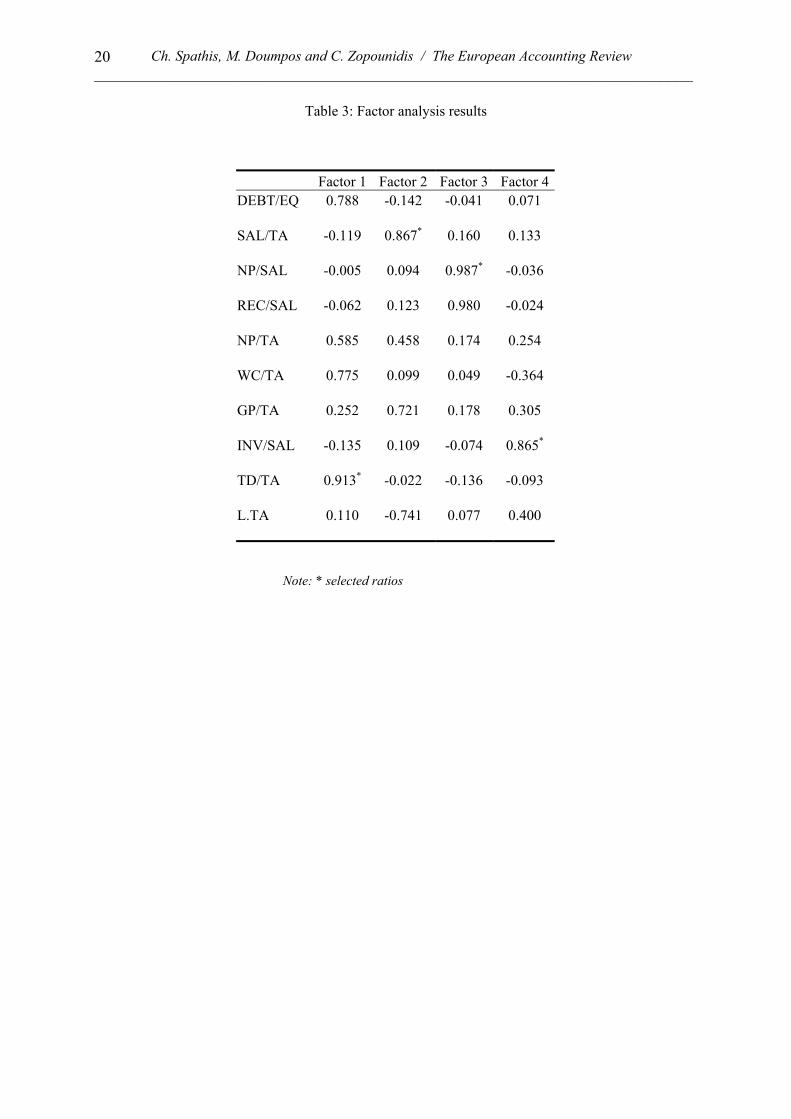
The above set of 10 variables constitutes the basis for the analysis of FFS detection in this study. Furthermore, in order to avoid the multicollinearity among the selected variables set factor analysis is also employed. Factor analysis resulted to the extraction of four factors with eigenvalues higher than one, which explain more than 78% of the total variance in the sample. After applying a varimax rotation, the factor loadings (Table 3) are employed to select a limited set of variables. From each factor the variable with the higher factor loading (in absolute terms) is selected. Thus four variables are selected: SAL/TA, NP/SAL, INV/SAL and TD/TA. The correlations among these four variables are all insignificant at the 1% level.
Insert Table 3 here
Method The method used to develop the FFS detection model in this study, is the UTADIS multicriteria decision aid method. The UTADIS method leads to the development of an additive utility model for the classification of a set of alternatives in predefined homogeneous classes with the minimum classification error. In the FFS case, the alternatives correspond to the firms, whereas the classification involves two groups, i.e., the firms for which FFS is detected and the ones for which there is no FFS detection.
The method operates on the basis of a non-parametric regression-based framework that is similar to the one commonly used in traditional statistical and econometric classification techniques (e.g., discriminant analysis, logit, probit, etc.). Initially, using a training sample the classification model is developed. If the classification accuracy of the model in the training sample is satisfactory, then it can be used to any other sample for extrapolating purposes. The model development process is briefly outlined below. A detailed description can be found in Devaud et al., (1980), as well as in Zopounidis and Doumpos (1999).
Let the training sample consist of n firms (alternatives) a1, a2, …, an described over a set of m evaluation criteria (variables) g1, g2, …, gm. Henceforth, g will be used to denote the vector of the evaluation criteria, and vector gj will be used to denote the performance of firm aj on the criteria vector g.
The firms of under consideration (training sample) are classified into q ordered classes C1, C2, …, Cq (Ck is preferred to Ck+1, k = 1, 2, …, q−1). In this case study, C1 corresponds to the non-FFS group and C2 correspond to the FFS group (q=2). This specification assumes that the non-FFS firms are in a better corporate performance status compared to the FFS firms. Should the classification results be satisfactory then, this will indicate that the above assumption is valid. The additive utility model, which is developed through the UTADIS method for the classification of the firms, has the following form:
∑=
′=′m
iiii gupU
1)()(g ∈[0,1] (1)
where pi∈[0, 1] is the weight of criterion gi (the criteria weights pi sum up to 1) and is the corresponding marginal utility function normalized between 0 and 1. Conceptually, the global utility
of a firm a
)( ii gu′
)( jU g′ j is an aggregate index of the overall performance of the firm on the basis of all criteria. The higher is the global utility, the higher is the overall performance of the firms. Considering the aforementioned assumption on the relation between corporate performance and the FFS status of each firm (it is assumed that non-FFS firms have higher corporate performance than FFS firms), it can be concluded that the higher the global utility of a firm, the more likely is that the firm belongs to the non-FFS group.
Ch. Spathis, M. Doumpos and C. Zopounidis / The European Accounting Review ___________________________________________________________________________
9
The aggregation made through the additive utility function considers both the performance of the firm on each individual criterion and the weight of the criterion (the higher the weight the more significant is the criterion). The performance of the firm on each criterion is considered through the marginal utility functions . The marginal utility functions provide a mechanism for transforming the criteria’s scale into a utility/value scale ranging between 0 and 1. This enables the expression of the performance of the alternatives on each criterion in utility/value terms according to the intrinsic preferential/value system of the decision maker (i.e., auditor, financial decision maker, etc.). The higher the marginal utility of an alternative on a criterion (closer to 1), the higher is the performance of the alternative. Generally, the marginal utility functions are non-linear monotone functions defined on each criterion’s range. These functions are increasing for criteria whose higher values indicate higher utility for the decision maker (criteria of increasing preference) and decreasing in the opposite case (criteria of decreasing preference). In this study the ratios SAL/TA, NP/SAL, NP/TA, WC/TA, GP/TA and L.TA are modeled as increasing preference criteria, since they are positively related to corporate performance (as mentioned above the assumption made is that non-FFS firms are the ones which in a better corporate performance status). Based on the same rationale, the DEBT/EQ, REC/SAL, INV/SAL and TD/TA ratios are treated as decreasing preference criteria.
)( ii gu′
The problem with the use of the additive utility function (1) is that both the criteria weights pi and the marginal utilities u are unknown variables. Therefore the estimation of this utility function requires non-linear techniques, which are usually computationally intensive. This problem is addressed using the transformation
)( ii g′
)()( iiiii gupgu ′= . Since u )( ii g′ is normalized between 0 and 1, it is clear that ui(gi) ranges in the interval [0, pi]. Thus, estimating the marginal utility function ui(gi) is equivalent to estimating both the criteria weights pi and the marginal utilities u . In this way, the additive utility function is simplified to the following form:
)( ii g′
∑=
=m
iii guU
1)()(g ∈[0,1] (2)
The global utility defined on the basis of the equation (2) serves as an index used to decide upon the classification of the firms into the predefined classes (FFS and non-FFS firms). The classification is performed through the comparison of the global utilities of the firms to some utility thresholds u1>u2> … >uq-1 that define the lower bound of each class:
∈⇒<
∈⇒<≤
∈⇒≥
− qjqj
jj
jj
CauU
CauUu
CauU
)(
............................................
)(
)(
1
212
11
g
g
g
(3)
In the special two-group case considered in this study, the classification of the firms as FFS (group C1) or non-FFS (group C2) is performed as follows:
∈⇒<
∈⇒≥
21
11
)(
)(
CauU
CauU
jj
jj
g
g (4)
Details on the procedure used to estimate the additive utility function and the utility thresholds that discriminate the classes are given in the Appendix, while a detailed example on the use of the method can be found in Zopounidis and Doumpos (2001).
The UTADIS method has been applied to several fields of financial management including bankruptcy prediction, credit risk assessment, country risk evaluation, credit cards assessment, portfolio selection and management (Doumpos and Zopounidis, 1998).
We used the discriminant analysis and logit regression methods as benchmarks for the UTADIS results. These methods were selected for comparison purposes in this study because of their popularity in the study of financial decision problems requiring a grouping of a set of alternatives. Furthermore,
Ch. Spathis, M. Doumpos and C. Zopounidis / The European Accounting Review ___________________________________________________________________________ 10 the methods are popular among academic researchers for evaluating the performance of new algorithms and approaches to study general classification problems. Jackknife approach for model validation
Since in the present study only one sample of firms is available, model validation and testing is cumbersome. In order to overcome this limitation and derive robust conclusions on the efficiency of the proposed MCDA classification approach as well as on the findings of the analysis with respect to the factors associated with FFS, a Jackknife approach is employed. This approach is realized in the following three steps:
Step 1: Selection of one FFS firm and one non-FFS firm from the original sample of 76 firms. The two selected firms form a model validation sample.
Step 2: Development of a FFS detection model using the remaining 74 firms as the training sample (the two firms selected in step 1 are excluded).
Step 3: Classification of the two excluded firms using the FFS detection model developed in step 2.
The above three steps are repeated for all combinations of FFS with non-FFS firms, that is 382=1,444 replications. After all replications are performed, an unbiased estimate of the true error rate is obtained as percentage of the replications the two excluded firms are misclassified. McLachlan (1992) notes that such a Jackknife approach is superior to the use of a holdout sample, because it permits the use of all available data in the estimation, while avoiding the bias in the estimation of error rate resulting from the model being tested on the same data from which it has been derived (Kahya and Theodossiou, 1999; Doumpos et al., 2000).
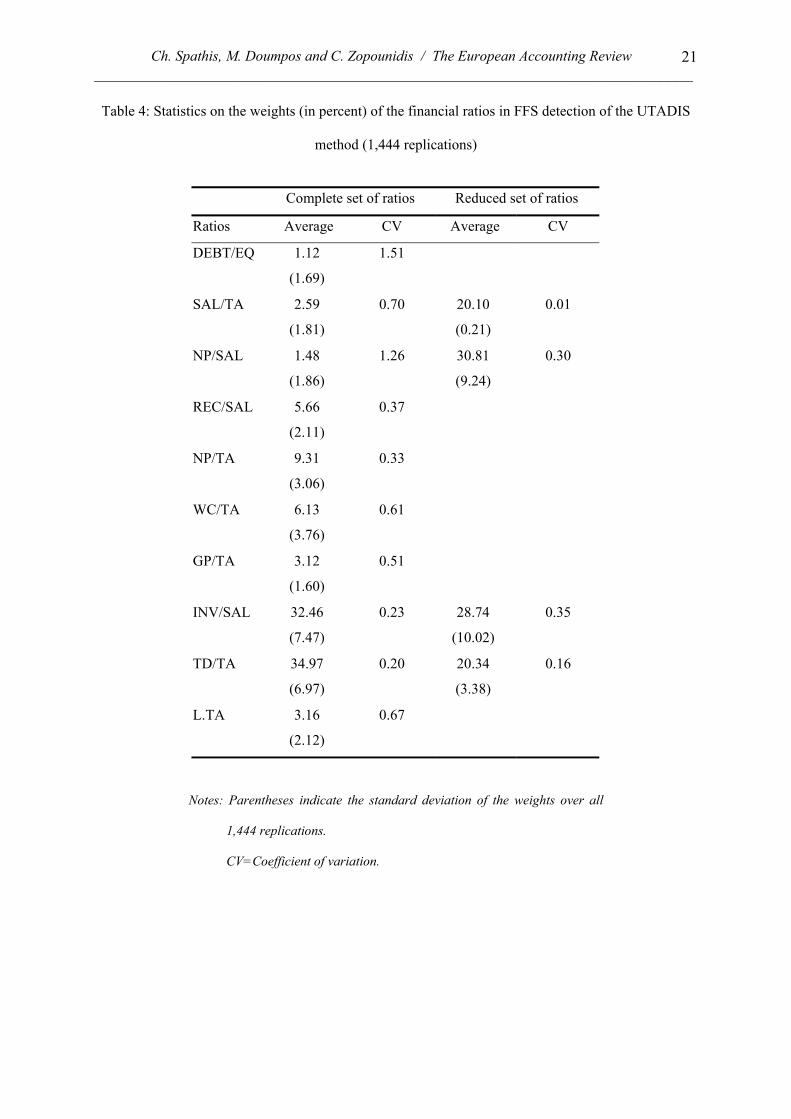
4. RESULTS At each replication of the Jackknife approach discussed in the previous section, different FFS detection models are developed using the UTADIS method. These models incorporate both the complete set of financial ratios as well as the reduced set of four ratios selected using factor analysis. Table 4 summarizes some statistics on the robustness of the significance of each financial ratio in the discrimination between FFS firms and non-FFS firms according to the models developed through UTADIS.
Insert Table 4 here
The results indicate two ratios to be significant explanatory factors associated with FFS, both when the complete set of ratios is considered as well as when the reduced set of ratios is employed. These are the total debt/total assets ratio (TD/TA) and the inventory/sales ratio (INV/SAL). When the complete set of ratios is considered, the average weight of both ratios along the 1,444 replications exceeds 30%. Furthermore, the variability of the weights of these ratios is quite limited since the coefficient of variation is 0.23 for INV/SAL and 0.20 for TD/TA. Both ratios remain significant when the reduced set of ratios is considered. The analysis shows that higher TD/TA may indicate that many firms issuing FFS were in financial distress (Persons, 1995; Fanning and Cogger, 1998; Summers and Sweeney, 1998). This could provide the motivation for management fraud. On the other hand, the identification of INV/SAL as a crucial factor agrees with the results of previous studies in this field. The inventory is likely to be manipulated by management (Loebecke et al., 1989; Shilit, 1993; Summers and Swenney, 1998). SAS No. 47, Audit Risk and Materiality in Conducting and Audit (AICPA), states that any account that requires subjective judgment in determining its value increases audit risk. Inventory is noted as such an account due to the subjective judgment involved in estimating obsolete inventory. The results of this study indicate that higher INV/SAL are associated with increased likelihood of FFS.
Ch. Spathis, M. Doumpos and C. Zopounidis / The European Accounting Review ___________________________________________________________________________
11
Two other ratios that are found significant when the reduced set of ratios is considered are the sales/total assets ratio (SAL/TA) and the net profit/sales ratio (NP/SAL). The ratio of sales to total assets should that firms with FFS were operating at less efficiency since they get fewer sales for the same total assets. This ratio was a significant predicator in prior research (Persons, 1995; Fanning and Cogger, 1998). Α further examination indicates that firms with FFS were less profitable (lower NP/TA and NP/SAL) since they get less profit for the same total assets and sales. Firms with high net profit to total assets and sales have an increased probability of being classified into non-FFS firms. The low values for NP/TA and NP/SAL for the FFF firms compared to the corresponding ones for non-FFS indicate that the companies facing difficulties of low returns in relation to assets and sales try to manipulate the FS either by increasing revenue or reducing expenditure so as to improve the profit and loss account. This result agrees with the existing research (Loebecke et al., 1989; Summers and Sweeney, 1998; Beasley et al., 1999).
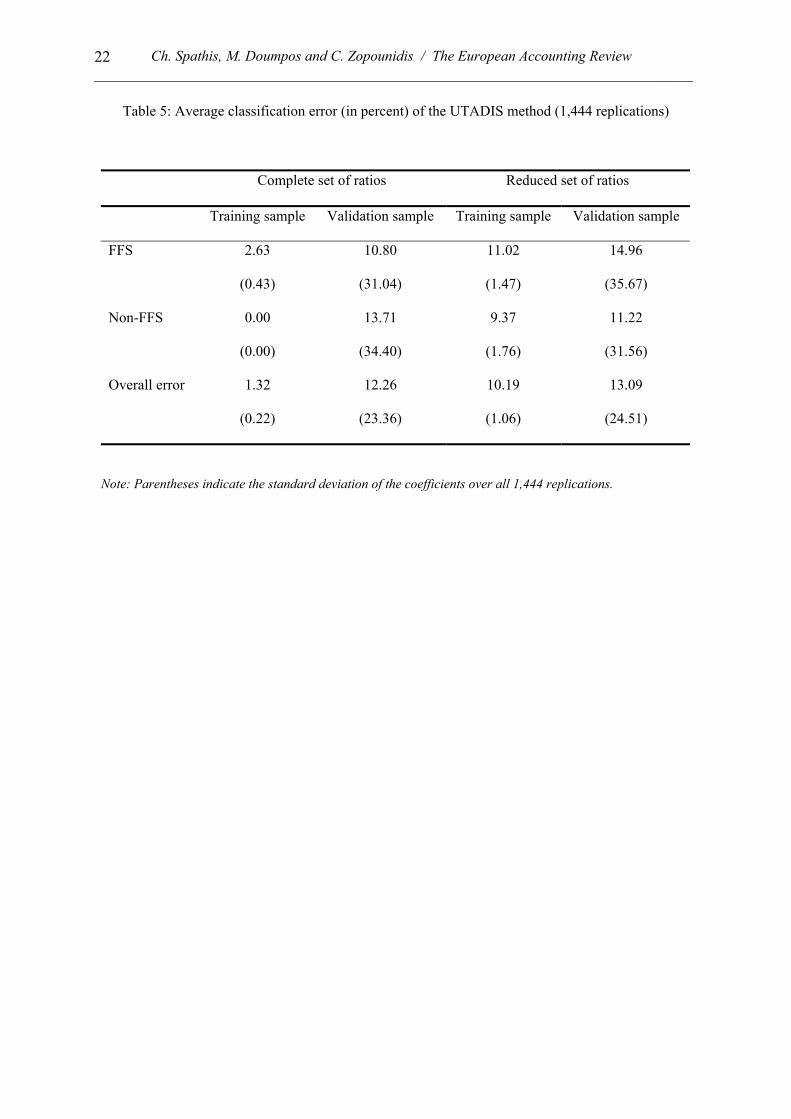
The average classification results obtained through the UTADIS method in discriminating between FFS and non-FFS firms over the 1,444 replications are reported in Table 5, both in the case where the complete set of ratios is considered as well as in the case of the reduced set of ratios. In this table the row corresponding to FFS represents the average type I error rate over all 1,444 replications of the Jackknife approach (classification of FFS firm as non-FFS), whereas the non-FFS row corresponds to the average type II error rate (classification of non-FFS firm as FFS).
Insert Table 5 here
The results indicate that the proposed MCDA classification approach is quite efficient in discriminating between FFS and non-FFS firms, thus supporting the conclusion that such an approach can assist auditors in their practice. Even in when the reduced set of four financial ratios is used, the average overall classification error in the validation sample is limited to 13.09%, slightly higher compared to the case where the complete set of ratios is employed. Therefore, auditors can use the proposed classification methodology to perform a fast analysis of widely available financial information, in order to examine the financial statements of the firms for potential frauds. Thus, the auditors have more time available to investigate other information (non-financial one) and derive secure conclusions on the likelihood of FFS. Comparison with multivariate statistical techniques
The MCDA classification procedure, whose results were discussed in the previous sub-section, is not the only classification approach than can be employed to detect FFS. Over the past three decades statistical procedures have been used in numerous research studies by financial and accounting researchers to address classification problems in these fields. Discriminant analysis and logit analysis are the most popular of such procedures.
Discriminant analysis (DA) leads to the development of a linear discriminant function that maximises the ratio of among–group to within–group variability, assuming that the variables are normally distributed and that the dispersion matrices among groups are equal (in the linear case). The selection of DA for comparison purposes in this study was decided upon the popularity of the method among financial and accounting researchers. Furthermore, academic researchers commonly use DA as a benchmark for the performance of new classification procedures. Logit analysis (LA) is an alternative parametric approach to DA. The theoretical advantages of LA over DA have been the major motivation for financial and accounting researchers in using this approach, mainly over the last two decades. LA uses the cumulative logistic probability function to estimate the probability that a firm will not issue FFS on the basis of a set of independent variables (financial ratios). Maximum likelihood estimation techniques are employed to determine the parameters cumulative logistic probability function (constant term and coefficients of the financial ratios). A comprehensive review of the applications of these two classification procedures in business and finance can be found in the book of Altman et al., (1981).

Ch. Spathis, M. Doumpos and C. Zopounidis / The European Accounting Review ___________________________________________________________________________ 12
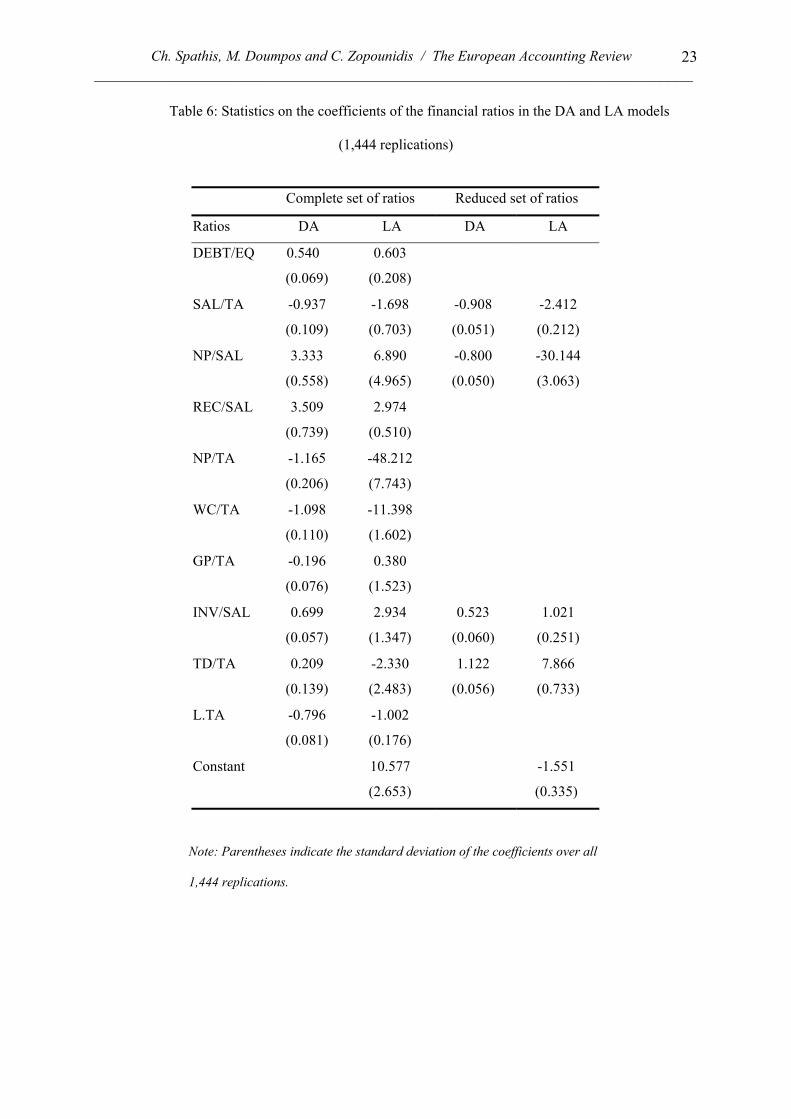
The results obtained from the application of DA and LA, regarding the contribution of the financial ratios in detecting FFS are presented in Table 6. In the case of DA the standardized canonical discriminant function coefficients are reported. Both in the case of DA and LA ratios with positive coefficient are positively related to the probability that a firm issues FFS, whereas ratios with negative coefficient are negatively related to the probability that a firm issues FFS. On the basis of the results of Table 6 some interesting points are worth noting. The net profit/sales ratio (NP/SAL) seems to be the most important factor in discriminating the two groups of firms. When the complete set of ratios is considered it has the second highest standardized coefficient in the DA models whereas its coefficient in the LA models is also quite significant (it is significant at the 5% level at 521 replications). The positive coefficients of this ratio in both the DA and LA models indicate that is positively related to FFS. However, this result should taken into careful consideration, bearing in mind the fact that the corresponding coefficients (in the reduced set of ratios case) change to negative. This indicates that most probably the positive coefficients in the complete set of ratios case are due to multicollinearity. Thus, the coefficients obtained from the reduced set of ratios provide a more reliable estimation of the impact of the NP/SAL ratio in discriminating between FFS and non-FFS firms. In that regard, the signs of this significant ratio when the reduced set of ratios is employed for model development are in accordance with the findings obtained from the preceding analysis of the UTADIS method (i.e., the NP/SAL ratio is negatively related to the probability of FFS). Furthermore, it is interesting to observe that the stability of the coefficients of the NP/SAL ratio is significantly improved in the reduced set of ratios case (i.e., the coefficient of variation σ/µ is reduced). A second finding that is in accordance with the results of the UTADIS method involves the significance of the total debt/total assets ratio (TD/TA). This ratio is found significant in the DA and LA models developed on the basis of the reduced set of ratios. Its positive coefficients indicate that it is positively related to FFS (i.e., firms with high TD/TA are more probable to issue FFS), which confirms the results of the UTADIS method.
Insert Table 6 here
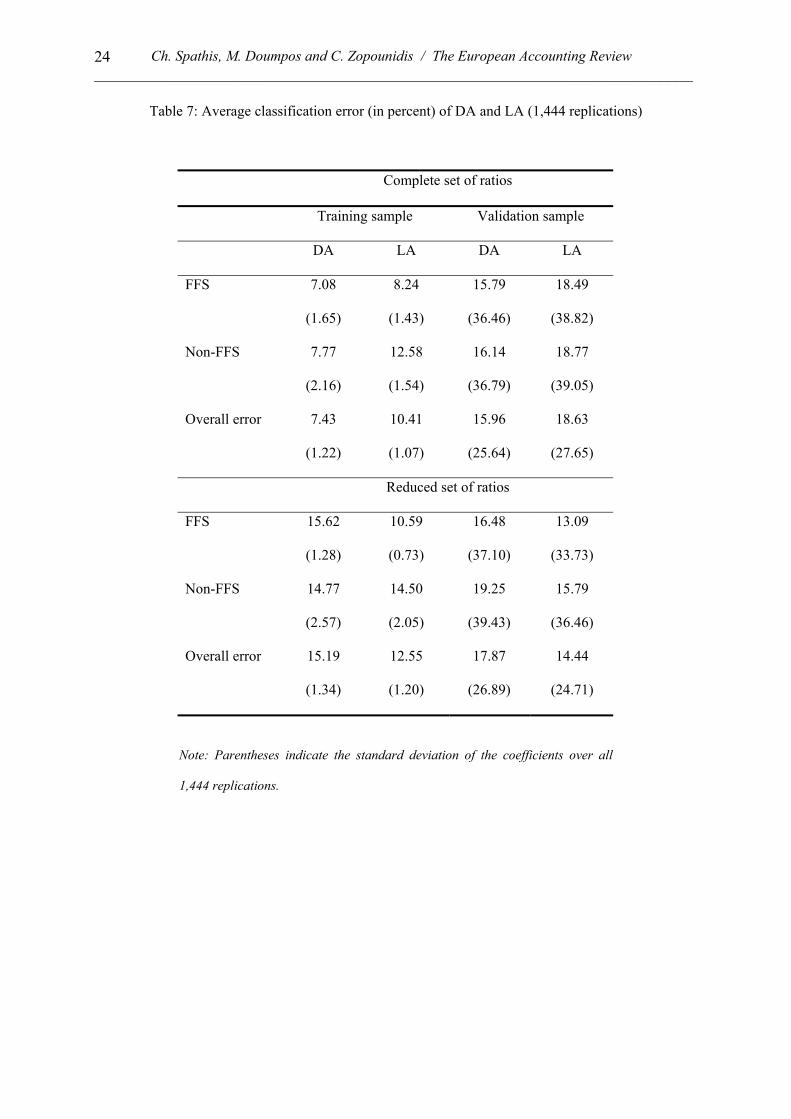
The classification results obtained from the application of DA and LA in discriminating FFS
and non-FFS firms are presented in Table 7.
Insert Table 7 here
With regard to the training sample, the overall error rate of UTADIS is significantly lower than
the one of DA and LA both in the case of the complete set of ratios as well as in the case of the reduced set (the difference is higher when the complete set of ratios is employed). Of course, higher model fit does not ensure higher generalising ability, which is the ultimate objective in decision models, developed through regression – based techniques. In that respect, the results on the validation tests are of particular interest towards the evaluation of the predictability of UTADIS and the other statistical methods. The comparison to the results of Tables 5 and 7 indicates that in terms of the overall error rate, UTADIS still performs better than the other statistical methods. For the validation sample when the complete set of ratios is employed, the overall error rate, over the 1,444 replications, is 12.26% for UTADIS vs. 15.96% for DA and 18.63% for LA. When the reduced set of ratios is considered, UTADIS still performs better than DA and LA (13.09% for UTADIS, 14.44% for LA and 17.87% for DA). These results support the finding that the proposed multicriteria decision aid classification methodology can provide an efficient approach for detecting FFS compared to existing well-established statistical techniques. 5. CONCLUDING REMARKS

Ch. Spathis, M. Doumpos and C. Zopounidis / The European Accounting Review ___________________________________________________________________________
13 The present study used the UTADIS multicriteria decision aid classification method to address the identification of firms issuing FFS. Ten financial ratios were selected for examination as potential predictors of FFS. These variables appeared to be important in prior research and constitute ratios derived from published financial statements. The variables selected by the above techniques as possible indicators of FFS are: the ratio of total debt to total assets, the inventories to sales ratio, the net profit to sales ratio and the sales to total assets ratio. The proposed approach shows high accuracy in correctly estimating the likelihood that a firm issues FFS. The results of the extensive Jackknife model validation procedure fully support this remark. Therefore, the conducted analysis suggests that there is a strong potential in detecting FFS through the examination of publicly available financial statements. The study’s results along with the comparison with well-established statistical classification procedures, support future use of multicriteria analysis as a fraud-risk assessment tool.
The use of the proposed methodological framework could be of assistance to auditors, both internal and external, to taxation and other state authorities, individual and institutional, investors, stock exchange, law firms, economic analysts, credit scoring agencies and to the banking system. For the auditing profession, moving to address its responsibility to detect FFS, the results of this study should be beneficial. The auditors can provide with the help of this model effective expert witness testimony and computer litigation support regarding FFS at a low cost to the auditor.
The auditors with suitable software will run on auditing financial statements posted on Internet web sites scans and analyses the differences between trends of the company’s reports. It also identifies “red flags” that substantially differ from defined norms. The software implementation of the proposed methodology can be achieved easily without significant cost using any programming environment or commercially available linear programming packages. Furthermore, the Internet technology except for a data collection mean, it can also be used for the implementation of the proposed methodology at low cost. The methodology can be implemented at the central level (on a server) and auditors can employ the proposed methodology via the Internet by inputting data through a spreadsheet interface and obtaining online estimations on the probability that a firm issues FFS. Such an implementation approach would be of interest to audit firms, where expert decision analysts will be responsible for model development at the central level and auditors will use the developed FFS detection models via the Internet.
Expect for the above practical issue, the present study also contributes to auditing and accounting research by examining the suggested variables to identify those that can best discriminate cases of FFS. This study suggests certain variables from publicly available information to which auditors should be allocating additional audit time. With advanced MCDA techniques and a greater number of variables (e.g., the number of members of the board of directors, the rate of turnover of the financial manager, the type of auditor used and the frequency with which they are changed, auditors observations, inventory evaluation methods, and depreciation methods), it is possible to develop a more powerful analytical tool for the detection of FFS.
ACKNOWLEDGMENTS
Early versions of this paper were presented at the 23rd Congress of the European Accounting Association held in Munich, Germany (29–31 March, 2000) and at the 9th Annual Meeting of the European Financial Management Association held in Athens, Greece (28 June–1 July, 2000). We wish to thank the participants for their constructive comments and criticisms that resulted in significant improvements in the present version. We wish to thank the three anonymous referees for their valuable comments and the editor of the EAR. APPENDIX
The model development process in the UTADIS methods involves the estimation of the marginal utility functions ui(gi) for all criteria gi (i=1, 2, …, m) and the utility thresholds uk (k=1, 2, …, q-1) that distinguish the classes. The model development process is based on the general regression-based framework outlined in section 3 (sub-section “Method”).
Ch. Spathis, M. Doumpos and C. Zopounidis / The European Accounting Review ___________________________________________________________________________ 14
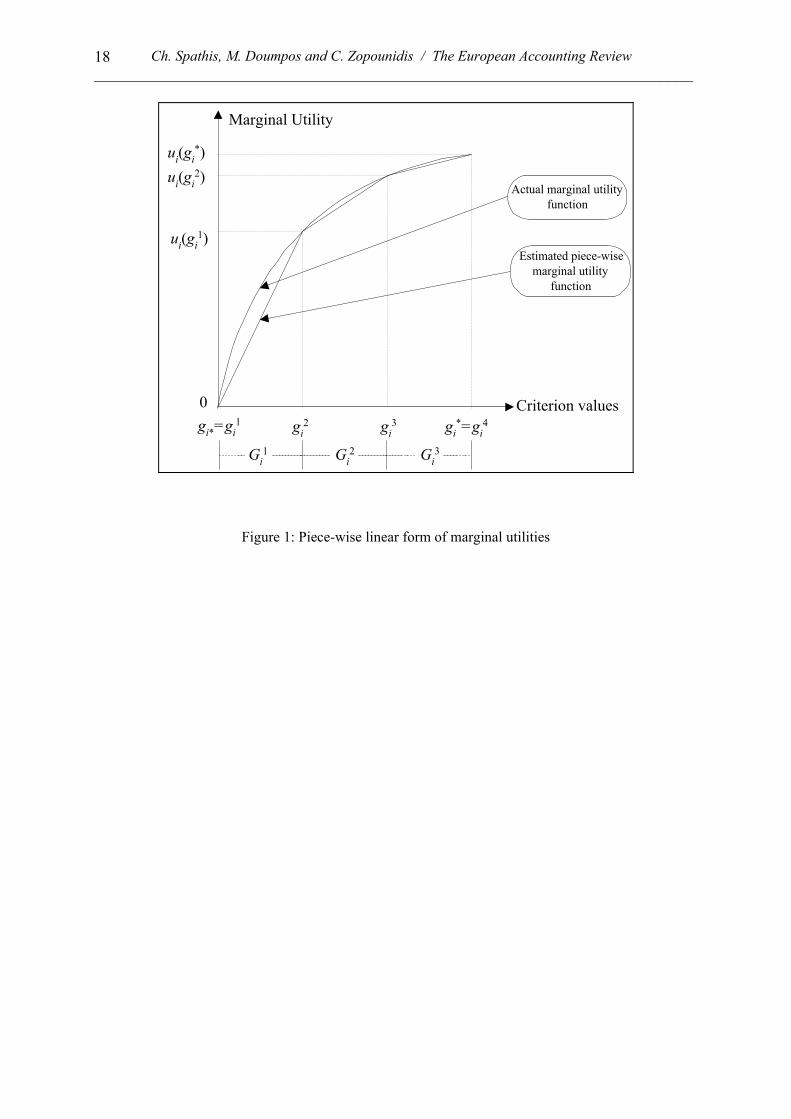
The marginal utility functions are modeled in a piece-wise linear form (Figure 1). For each evaluation criterion gi its range Gi = [ , ] is defined. The values and of criterion ggi*
*ig gi* gi
*i
represent the least and the most preferred ones respectively. Assuming that all criteria are of increasing preference1, the most preferred value is considered as the maximum value of a criterion for all firms included in the training sample. Similarly, the least preferred value is considered as the minimum value of a criterion for all firms of the training sample.
Insert Figure 1 here
The range Gi is divided into bi -1 equal subintervals G , h=1, 2, ..., b],[ 1+= h
ihi
hi gg i-1 (Figure
1). The number of these subintervals can be specified by the decision maker, or it can be determined by the analyst so that there is at least one firm falling into each subinterval (this is the approach used in this study). The model development process involves the estimation of the marginal utility of each of break-point (t = 1, 2, …, bt
ig i). Once these marginal utilities are estimated, simple linear interpolation can be used to estimate the marginal utility of any criterion value. Therefore, assuming that the performance of a firm aj on criterion gi (denoted as gij) falls within the rij subinterval [ (1≤ r
], 1+ijij ri
ri gg
i j≤ bi–1), its global utility can be expressed as follows:
( ) ( ) ( )[∑∑=
+
+=
−−
−+==
m
i
rii
riir
iri
riijr
ii
m
iijij
ijij
ijij
ij
ij gugugg
ggguguU
1
11
1)()(g ] (5)
Estimations of the global utility model (marginal utilities of all break-points , t = 1, 2, …, btig i)
and utility thresholds are accomplished through the solution of the following linear program: minimize F = ∑∑ ∑
∈
−
∈ ∈
−++ +++++qjj kj Ca
jCa Ca
jjj σσσσ ...)(...1
(6)
subject to: 0)( 1 ≥+− +
jj uU σg , ∀aj∈C 1 (7)
≥+−
−≤−−
+
−−
0)(
)( 1
jkj
jkj
uU
uU
σ
δσ
g
g, ∀aj∈Ck, k = 2, 3, …, q-1 (8)
δσ −≤−− −− jqj uU 1)(g , ∀aj∈Cq (9)
)()( 1 hii
hii gugu −+ ≥ 0, ∀ i = 1, 2, …, m, ∀ h = 1, 2, …, bi-1 (10)
uk−1 − uk ≥ s, ∀ k = 2, 3, ..., q−1 (11) )( 1
ii gu =0, ∀ i = 1, 2, …, m (12) +jσ ≥ 0, ≥ 0, ∀ j = 1, 2, …, n (13) −
jσ
)( tii gu ≥ 0, ∀ i = 1, 2, …, m, ∀ t = 2, 3, …, bi (14) The global utilities U(gj) used in constraints (7)-(9) are given by expression (5). In constraints
(8), (9) and (11), s and δ are user-defined constants (cf. discussion below). The decision variables of the above linear program include:
1. the marginal utilities , t = 2, 3, …, b)( tii gu i (by definition u =0; cf. constraint (12)), )( 1
ii g2. the utility thresholds uk, k = 1, 2, …, q-1, and
1 Without loss of generality the discussion of the model development process considers only increasing
preference criteria. Criteria of decreasing preference are transformed into increasing preference through sign reversal.

Ch. Spathis, M. Doumpos and C. Zopounidis / The European Accounting Review ___________________________________________________________________________
15
3. the error variables and , j = 1, 2, …, n. +jσ −
jσThe objective function of the above linear program involves the minimization of the violations
of the classification rules defined in (3) (cf. section 3, sub-section “Method”). These violations are defined through constraints (7)-(9). In these constraints δ is used as a small positive constant to ensure the strict inequalities in the classification rules (3). Constraint (10) is used to ensure the monotonicity of the estimated marginal utility functions. Constraint (11) is used to ensure that the utility threshold that distinguishes the classes Ck−1 and Ck is strictly larger than the utility threshold that distinguishes the classes Ck and Ck+1 (this is a necessary condition imposed by the rank-ordering of the classes). In constraint (11) s is a small positive constant such that δ<s<1/q.
After the solution F* of the linear program (6)-(14) has been obtained, a post–optimality stage is performed in order to identify, if possible, other optimal or near optimal solutions, which could provide a more consistent representation of the decision maker’s preferences. The post-optimality analysis is performed following the approach proposed by Siskos and Yannacopoulos (1985). In particular, during the post-optimality stage m+q–1 new linear programs are solved. The first m of these linear programs begin with the optimal solution of the linear program (6)-(14) and explore alternative optimal solutions or near optimal solutions that maximize each criterion’s weight
. The subsequent q-1 linear programs begin with the optimal solution of the linear program (6)-(14) and explore alternative optimal solutions or near optimal solutions that maximize the utility thresholds u
)()( * ibiiiii gugup ==
*F
1, u2, …, uq-1. In all cases the new solutions found during the post-optimality stage are subject to the additional constraint , where is the value of the objective function corresponding to the optimal solution of the linear program (6)-(14) and z is a small portion of . The final additive utility classification model is constructed as the average of all solutions obtained from the post-optimality analysis stage. All results presented in section 4 are obtained using this post-optimality analysis approach.
*)1( FzF +≤ *F
REFERENCES Albrecht, S. and Romney, M. (1986) “Red-flagging management: A validation”, Advances in
Accounting, 3: 323-333. Altman E. I., Avery R., Eisenbeis R. and Stinkey J. (1981) Application of Classification Techniques in
Business Banking and Finance. Greenwich: JAI Press. American Institute of Certified Public Accountants (AICPA) (1997) Consideration of Fraud in a
Financial Statement Audit. Statement on Auditing Standards No. 82, New York. Arens, A. and Loebbecke, J. (1994) Auditing: An Integrated Approach (6th edition). Englewood Cliffs:
Prentice Hall. Beasley, M. (1996) “An empirical analysis of the relation between board of director composition and
financial statement fraud”, The Accounting Review, 71(4): 443-466. Beasley, S. M., Carcello, J. V. and Hermanson, D. R. (1999) Fraudulent Financial Reporting: 1987-
1997: An Analysis of U.S. Public Companies. Research Report, COSO. Ballas, A. (1994) “Accounting in Greece”, The European Accounting Review, 3(1): 107-121. Bell, T., Szykowny, S. and Willingham, J. (1993) “Assessing the Likelihood of Fraudulent Financial
Reporting: A Cascaded Logic Approach”, Working Paper, KPMG Peat Marwick, Montvale, NJ. Beneish, M.D. (1999) “Incentives and penalties related to earnings overstatements that violate
GAAP”, The Accounting Review, 74(4): 425-457. Bell, T. and Carcello, J. (2000) “A decision aid for assessing the likelihood of fraudulent financial
reporting”, Auditing: A Journal of Practice & Theory, 19(1): 169-178. Bloomfield, R. I. (1997) “Strategic dependence and the assessment of fraud risk: A laboratory study”,
The Accounting Review, 72(4): 517-538. Boatsman, J. R., Moeckel, C., and Pei, B. K. W. (1997) “The effects of decision consequences on
auditors’ reliance on decision aids in audit planning”, Organizational Behavior and Human Decision Process, 71(2): 211-247.
Ch. Spathis, M. Doumpos and C. Zopounidis / The European Accounting Review ___________________________________________________________________________ 16 Bologna, G., Lindquist, R. and Wells, J. (1996) The Accountant’s Handbook of Fraud and
Commercial Crime. New York: John Wiley. Bonner, S. E. Palmrose, Z. V. Young S. M. (1998) “Fraud type and auditor litigation. An analysis of
SEC accounting and auditing enforcement releases”, The Accounting Review, 73(4): 503-532. Caplan, D. (1999) “Internal controls and the detection of management fraud”, Journal of Accounting
Research, 37(1): 101-117. Chow, C. and Rice, S. (1982) “Qualified audit opinions and share prices – An investigation”,
Auditing: A Journal of Practice & Theory, 1: 35-53. Coderre, G. D. (1999) Fraud Detection. Using Data Analysis Techniques to Detect Fraud. Global
Audit Publications. Comer, J. M. (1998) Corporate Fraud (3rd Edition). Hampshire: Gower Publishing Limited. Courtis, J. K. (1978) “Modelling a financial ratios categoric framework”, Journal of Business Finance
and Accounting, 5(4): 371–386. Daroca, F. and Holder, W. (1985) “The use of analytical procedures in renew and audit engagements”,
Auditing: A Journal of Practice & Theory, 4: 80-92. Davia, H., Coggins, P., Wideman, J. and Kastantin, J. (1992) Management Accountant’s Guide to
Fraud Discovery and Control. New York: John Wiley. Devaud, J. M., Groussaud, G. and Jacquet-Lagrèze, E. (1980) “UTADIS: Une méthode de
construction de fonctions d’utilité additives rendant compte de jugements globaux”, European Working Group on Multicriteria Decision Aid, Bochum.
Doumpos, M. and Zopounidis, C. (1998) “The use of the preference desegregation analysis in the assessment of financial risks”, Fuzzy Economic Review, 3(1): 39-57.
Doumpos, M., Pentaraki, K., Zopounidis, C. and Agorastos, C. (2000), “Assessing country risk using a multi–group discrimination method: A comparative analysis”, Managerial Finance (in press).
Eilifsen, A., Knivsfla, K.H. and Soettem, F. (1999) “Earnings manipulation: cost of capital versus tax”, The European Accounting Review, 8(3): 481-491.
Eining, M. M., Jones, D. R. and Loebbecke, J. K. (1997) “Reliance on decision aids: An examination of auditors’ assessment of management fraud”, Auditing: A Journal of Practice & Theory, 16(2): 1-19.
Elliot, R., and Willingham, J. (1980) Management Fraud: Detection and Deterrence, Petrochelli. New York.
Fanning, K., Cogger, K. and Srivastava, R. (1995) “Detection of management fraud: A neural network approach”, International Journal of Intelligent Systems in Accounting, Finance & Management, 4(2): 113-126.
Fanning, K. and Cogger, K. (1998) “Neural detection of management fraud using published financial data”, International Journal of Intelligent Systems in Accounting, Finance & Management, 7(1): 21-41.
Feroz, E., Park, K. and Pastens, V. (1991) “The financial and market effects of the SEC’s accounting and auditing enforcement’s releases”, Journal of Accounting Research, 29: 107-142.
Green, B. (1991) “Identifying management irregularities through preliminary analytical procedures”, Unpublished Doctoral Dissertation, Kent State University.
Green, B. P. and Choi, J. H. (1997) “Assessing the risk of management fraud through neural-network technology”, Auditing: A Journal of Practice & Theory, 16(1): 14-28.
Hansen, J. V., McDonald, J. B., Messier, W. F., and T. B. Bell, (1996) “A generalized qualitative – response model and the analysis of management fraud”, Management Science, 42(7): 1022-1032.
Higson, A. (1999) “Why is management reticent to report fraud? An exploratory study”, 22rd Annual Congress of European Accounting Association, Bordeaux, France.
Hellman, N. (1999) “Earnings manipulation: Cost of capital versus tax. A commentary”, The European Accounting Review, 8(3): 493-497.
Hoffman, V. B. (1997) “Discussion of the effects of SAS No 82 on auditors attention to fraud risk-factors and audit planning decisions”, Journal of Accounting Research, 35(5): 99-104.
Hollman, V. P. and Patton, J. M. (1997) “Accountability, the dilution effect and conservatism in auditors fraud judgments”, Journal of Accounting Research, 35(2): 227-237.
Ch. Spathis, M. Doumpos and C. Zopounidis / The European Accounting Review ___________________________________________________________________________
17 International Auditing Practices Committee (IPAC) (2001) The auditor’s responsibility to detect fraud
and error in financial statements. International Statement on Auditing (ISA) 240. Kahya, E. and Theodossiou, P. (1999), “Predicting corporate financial distress: A time-series CUSUM
methodology”, Review of Quantitative Finance and Accounting, 13: 323-345. Loebbecke, J., Eining, M. and Willingham, J. (1989) “Auditor’s experience with material
irregularities: Frequency, nature, and detectability”, Auditing: A Journal of Practice & Theory, 9: 1-28.
Mancino, J. (1997) “The auditor and fraud”, Journal of Accountancy, April: 32-36. Matsumura, E. and Tucker, R. R. (1992) “Fraud detection – A theoretical foundation”, The Accounting
Review, 67(4): 753-782. McLachlan, G. J. (1992), Discriminant Analysis and Statistical Pattern Recognition. New York:
Wiley. Morton, S. (1993) “Strategic auditing for fraud”, The Accounting Review, 68(4): 825-839. Neter, J., Kutter, M., Nachtschein, C. and Wasserman, W. (1996) Applied Linear Statistical Models.
Chicago: Irwin. Palmrose, Z. (1987) “Litigation and independent auditors: The role of business failures and
management fraud”, Auditing: A Journal of Practice and Theory, 6(2): 90-102. Persons, O. (1995) “Using financial statement data to identify factors associated with fraudulent
financing reporting”, Journal of Applied Business Research, 11(3): 38-46. Porter, B. and Cameron, A. (1987) “Company fraud – what price the auditor?” Accountant’s Journal,
December: 44-47. Schilit, H. (1993) Financial Shenanigans: How to Detect Accounting Gimmicks and Fraud in
Financial Reports. New York: McGraw-Hill. Shelton, S., Whittington, R., and Landsittel, D. (2000) Fraud risk assessment: An analysis of practices
of auditing firms. Forum Paper, Auditing Section Midyear Conference, American Accounting Association.
Siskos, Y. and Yannacopoulos, D. (1985) “UTASTAR: An ordinal regression method for building additive value functions” Investigacao Operacional, 5(1): 39-53.
Stice, J. (1991) “Using financial and market information to identify pre-engagement market factors associated with lawsuits against auditors”, The Accounting Review, 66(3): 516-533.
Summers, S. L. and Sweeney, J. T. (1998) “Fraudulently misstated financial statements and insider trading: An empirical analysis”, The Accounting Review, 73(1): 131-146.
Vanasco, R. R. (1998) “Fraud Auditing”, Managerial Auditing Journal, 13(1): 4-71. Tatum, K., B. Ballou, J. Carcello, P. Gillett, G. Krull, K. Kubin, Rittenberg, L. and Simuett, R. (2001)
“Fraud: A review of academic literature”, The Auditor’s Report, Special Issue on Fraud Detection, 24(2) Winter.
Wells, J. T. (1997) Occupational Fraud and Abuse. Austin: Obsidian Publishing. Worthy, F. S. (1984) “Manipulating Profits: How it’s done?”, Fortune, 25: 50-54. Wright, A. and Ashton, R. (1989) “Identifying audit adjustments with attention-direction procedures”,
The Accounting Review, 64(4): 79-83. Zimbelman, M. F. (1997) “The effects of SAS No 82 on auditors attention to fraud risk-factors and
audit planning decisions”, Journal of Accounting Research, 35(5): 75-79. Zopounidis, C. and Doumpos, Μ. (1999) “A multicriteria decision aid methodology for sorting decision
problems: The case of financial distress”, Computational Economics, 14(3): 197-218. Zopounidis, C. and Doumpos, M. (2001), “Multicriteria sorting methods”, in: C.A. Floudas and P.M.
Pardalos (eds.), Encyclopedia of Optimization, Kluwer Academic Publishers, Dordrecht (in press).
Ch. Spathis, M. Doumpos and C. Zopounidis / The European Accounting Review ___________________________________________________________________________ 18
Marginal Utility
Criterion valuesgi*=gi
1 gi*=gi
4gi2 gi
3
0
ui(gi1)
ui(gi2)
ui(gi*)
Actual marginal utilityfunction
Estimated piece-wisemarginal utility
function
Gi1 Gi
2 Gi3
Figure 1: Piece-wise linear form of marginal utilities
Ch. Spathis, M. Doumpos and C. Zopounidis / The European Accounting Review ___________________________________________________________________________
19
Table 1: Comparison of FFS and non-FFs groups
Characteristics Falsified Non-Falsified t-test Sig.
Total Assets 7,315 10,551 1.063 0.291
Inventories 1,036 1,859 1.420 0.160
Working Capital 369 2,281 2.457 0.016
Equity 2,674 6,203 1.686 0.096
Sales 3,966 9,195 2.059 0.043
Net Profit -368 895 2.547 0.013
Notes: The amounts are reported in million GRD
t-test: df=74, (2-tailed)
Table 2: List of variables for FFS detection
Group means Notation Description
FFS Non-FFSt-test Sig.
DEBT/EQ Debt / Equity 2.870 1.075 -3.140 0.002
SAL/TA Sales / Total Assets 0.699 1.055 3.088 0.003
NP/SAL Net Profit / Sales -0.459 0.067 1.329 0.188
REC/SAL Receivable / Sales 1.755 0.456 -1.356 0.179
NP/TA Net Profit / Total Assets -0.021 0.074 5.133 0.000
WC/TA Working Capital / Total Assets 0.054 0.253 3.912 0.000
GP/TA Gross Profit / Total Assets 0.144 0.274 4.340 0.000
INV/SAL Inventories / Sales 0.359 0.179 -1.632 0.105
TD/TA Total Debt / Total Assets 0.629 0.437 -3.803 0.000
L.TA Logarithm of Total Assets 8.451 8.473 0.085 0.933
t-test: df=74, (2-tailed)
Ch. Spathis, M. Doumpos and C. Zopounidis / The European Accounting Review ___________________________________________________________________________ 20
Table 3: Factor analysis results
Factor 1 Factor 2 Factor 3 Factor 4DEBT/EQ 0.788 -0.142 -0.041 0.071
SAL/TA -0.119 0.867* 0.160 0.133
NP/SAL -0.005 0.094 0.987* -0.036
REC/SAL -0.062 0.123 0.980 -0.024
NP/TA 0.585 0.458 0.174 0.254
WC/TA 0.775 0.099 0.049 -0.364
GP/TA 0.252 0.721 0.178 0.305
INV/SAL -0.135 0.109 -0.074 0.865*
TD/TA 0.913* -0.022 -0.136 -0.093
L.TA 0.110 -0.741 0.077 0.400
Note: * selected ratios
Ch. Spathis, M. Doumpos and C. Zopounidis / The European Accounting Review ___________________________________________________________________________
21 Table 4: Statistics on the weights (in percent) of the financial ratios in FFS detection of the UTADIS
method (1,444 replications)
Complete set of ratios Reduced set of ratios
Ratios Average CV Average CV
DEBT/EQ 1.12
(1.69)
1.51
SAL/TA 2.59
(1.81)
0.70 20.10
(0.21)
0.01
NP/SAL 1.48
(1.86)
1.26 30.81
(9.24)
0.30
REC/SAL 5.66
(2.11)
0.37
NP/TA 9.31
(3.06)
0.33
WC/TA 6.13
(3.76)
0.61
GP/TA 3.12
(1.60)
0.51
INV/SAL 32.46
(7.47)
0.23 28.74
(10.02)
0.35
TD/TA 34.97
(6.97)
0.20 20.34
(3.38)
0.16
L.TA 3.16
(2.12)
0.67
Notes: Parentheses indicate the standard deviation of the weights over all
1,444 replications.
CV=Coefficient of variation.
Ch. Spathis, M. Doumpos and C. Zopounidis / The European Accounting Review ___________________________________________________________________________ 22
Table 5: Average classification error (in percent) of the UTADIS method (1,444 replications)
Complete set of ratios Reduced set of ratios
Training sample Validation sample Training sample Validation sample
FFS 2.63
(0.43)
10.80
(31.04)
11.02
(1.47)
14.96
(35.67)
Non-FFS 0.00
(0.00)
13.71
(34.40)
9.37
(1.76)
11.22
(31.56)
Overall error 1.32
(0.22)
12.26
(23.36)
10.19
(1.06)
13.09
(24.51)
Note: Parentheses indicate the standard deviation of the coefficients over all 1,444 replications.
Ch. Spathis, M. Doumpos and C. Zopounidis / The European Accounting Review ___________________________________________________________________________
23
Table 6: Statistics on the coefficients of the financial ratios in the DA and LA models
(1,444 replications)
Complete set of ratios Reduced set of ratios
Ratios DA LA DA LA
DEBT/EQ 0.540
(0.069)
0.603
(0.208)
SAL/TA -0.937
(0.109)
-1.698
(0.703)
-0.908
(0.051)
-2.412
(0.212)
NP/SAL 3.333
(0.558)
6.890
(4.965)
-0.800
(0.050)
-30.144
(3.063)
REC/SAL 3.509
(0.739)
2.974
(0.510)
NP/TA -1.165
(0.206)
-48.212
(7.743)
WC/TA -1.098
(0.110)
-11.398
(1.602)
GP/TA -0.196
(0.076)
0.380
(1.523)
INV/SAL 0.699
(0.057)
2.934
(1.347)
0.523
(0.060)
1.021
(0.251)
TD/TA 0.209
(0.139)
-2.330
(2.483)
1.122
(0.056)
7.866
(0.733)
L.TA -0.796
(0.081)
-1.002
(0.176)
Constant 10.577
(2.653)
-1.551
(0.335)
Note: Parentheses indicate the standard deviation of the coefficients over all
1,444 replications.
Ch. Spathis, M. Doumpos and C. Zopounidis / The European Accounting Review ___________________________________________________________________________ 24
Table 7: Average classification error (in percent) of DA and LA (1,444 replications)
Complete set of ratios
Training sample Validation sample
DA LA DA LA
FFS 7.08
(1.65)
8.24
(1.43)
15.79
(36.46)
18.49
(38.82)
Non-FFS 7.77
(2.16)
12.58
(1.54)
16.14
(36.79)
18.77
(39.05)
Overall error 7.43
(1.22)
10.41
(1.07)
15.96
(25.64)
18.63
(27.65)
Reduced set of ratios
FFS 15.62
(1.28)
10.59
(0.73)
16.48
(37.10)
13.09
(33.73)
Non-FFS 14.77
(2.57)
14.50
(2.05)
19.25
(39.43)
15.79
(36.46)
Overall error 15.19
(1.34)
12.55
(1.20)
17.87
(26.89)
14.44
(24.71)
Note: Parentheses indicate the standard deviation of the coefficients over all
1,444 replications.