Embed Size (px)
Citation preview
Washington University School of MedicineDigital Commons@Becker
Open Access Publications
2011
Detecting disease rare alleles using single SNPs infamilies and haplotyping in unrelated subjects fromthe Genetic Analysis Workshop 17 dataAldi T. KrajaWashington University School of Medicine in St. Louis
Jacek CzajkowskiWashington University School of Medicine in St. Louis
Mary F. FeitosaWashington University School of Medicine in St. Louis
Ingrid B. BoreckiWashington University School of Medicine in St. Louis
Michael A. ProvinceWashington University School of Medicine
Follow this and additional works at: https://digitalcommons.wustl.edu/open_access_pubs
Part of the Medicine and Health Sciences Commons
This Open Access Publication is brought to you for free and open access by Digital Commons@Becker. It has been accepted for inclusion in OpenAccess Publications by an authorized administrator of Digital Commons@Becker. For more information, please contact [email protected].
Recommended CitationKraja, Aldi T.; Czajkowski, Jacek; Feitosa, Mary F.; Borecki, Ingrid B.; and Province, Michael A., ,"Detecting disease rare alleles usingsingle SNPs in families and haplotyping in unrelated subjects from the Genetic Analysis Workshop 17 data." BMC Proceedings.,. S96.(2011).https://digitalcommons.wustl.edu/open_access_pubs/522

PROCEEDINGS Open Access
Detecting disease rare alleles using single SNPs infamilies and haplotyping in unrelated subjectsfrom the Genetic Analysis Workshop 17 dataAldi T Kraja*, Jacek Czajkowski, Mary F Feitosa, Ingrid B Borecki, Michael A Province
From Genetic Analysis Workshop 17Boston, MA, USA. 13-16 October 2010
Abstract
We present an evaluation of discovery power for two association tests that work well with common alleles but areapplied to the Genetic Analysis Workshop 17 simulations with rare causative single-nucleotide polymorphisms(SNPs) (minor allele frequency [MAF] < 1%). The methods used were genome-wide single-SNP association testsbased on a linear mixed-effects model for discovery and applied to the familial sample and sliding windowshaplotype association tests for replication, implemented within causative genes in the unrelated individuals sample.Both methods are evaluated with respect to the simulated trait Q2. The linear mixed-effects model and haplotypeassociation tests failed to detect the rare alleles of the simulated associations. In contrast, the linear mixed-effectsmodel and haplotype association tests detected effects for the most important simulated SNPs with MAF > 1%.We conclude that these findings reflect inadequate statistical power (the result of small simulated samples) for thecomplex genetic model that underlies these data.
BackgroundBased on evolutionary history, it is expected that humangenomes will be arranged into local regions with highhaplotype similarity intermingled with local regions withhaplotype diversity. In the diverse haplotype regions,rare alleles may play an important role in creating thefoundation for individual subjects’ susceptibility or resis-tance to a particular disease. It is a common practice ingenetic research to identify causative disease regions inthe framework of association using single single-nucleo-tide polymorphism (SNP) tests or by grouping neighbor-ing regions under identifiable haplotypes and to testtheir association with disease and quantitative traits.Genetic Analysis Workshop 17 (GAW17) provides 200replicates of simulated data of a family-based cohortwith eight large families and 200 replicates of simulateddata for unrelated individuals. This simulated problem ischallenging, because both sets of data are relatively
small (n = 697). We investigate the two problems inde-pendently to determine whether the family-based asso-ciation tests have power to detect rare allele effects andwhether rare allele effects in the simulated genes canalso be detected by haplotype analysis of the unrelatedindividuals sample.
MethodsThe GAW17 data represent 200 replicates of simulatedphenotypes for a sample of 697 subjects organized in 8large families (referred in this article as the familial sam-ple) and 200 replicates of simulated phenotypes for aseparate sample of data of 697 unrelated individuals(referred to here as the unrelated sample). Genotypesfrom the 1000 Genomes Project were used as the geno-type sample for the unrelated sample. The GAW17simulation authors [1] used the family data set, bymeans of the program CHRSIM [2], to drop the phasedfounder genotypes throughout the rest of the pedigreeby considering a single obligate crossover event occur-ring on each chromosome. The same two genotype sets
* Correspondence: [email protected] of Statistical Genomics, Center for Genome Sciences & SystemsBiology, Washington University School of Medicine, 4444 Forest ParkBoulevard, St. Louis, MO 63110, USA
Kraja et al. BMC Proceedings 2011, 5(Suppl 9):S96http://www.biomedcentral.com/1753-6561/5/S9/S96
© 2011 Kraja et al; licensee BioMed Central Ltd. This is an open access article distributed under the terms of the Creative CommonsAttribution License (http://creativecommons.org/licenses/by/2.0), which permits unrestricted use, distribution, and reproduction inany medium, provided the original work is properly cited.
were used for all 200 phenotypic simulation replicatesfor the familial or unrelated sample.We analyzed the unrelated sample genotypes for link-
age disequilibrium using HaploView software (version4.2), with the purpose of identifying tag SNPs [3]. Theoptions we used in a batch mode run of HaploView foridentifying tag SNPs were –pairwiseTagging and –tagrsqcutoff 0.8. We used the number of discovered tagSNPs as a denominator for extrapolating the Bonferronigenome-wide significance threshold for a single-SNPassociation test (see Results section).After setting a genome-wide significance threshold, we
applied a linear mixed effects (LME) model to the famil-ial sample. The LME statistical analyses are based onlinear estimates of additive genetic effects of singleSNPs. The LME model is:
E Y g g( ,cov) cov= + +a b b1 2 , (1)
where b1g measures the change in Y as a result of theadditive change in the genotype gÎ(−1, 0, +1) where −1is the code for the homozygote genotype for the minorallele, 0 is the code for the heterozygote, and +1 is thecode for the homozygote for the major allele. We imple-mented association tests using a statistical mixed modelon the familial sample via the mixed procedure (PROCMIXED) of SAS (version 9.2, Linux OS). The “repeated”statement was used with sub=pedid, which defines thestructure of the R matrix, and the covariance structurewas selected as UN. We tested all 24,487 SNPs includedin the simulation, although we had prior knowledge ofthe GAW17 simulation answers. With such prior knowl-edge we focused on trait Q2.Q2 was simulated as a quantitative trait, influenced
primarily by 72 SNPs in 13 genes, with 1–15 functionalvariants per gene and with minor allele frequencies(MAFs) ranging from 0.07% to 17.07%. The residual
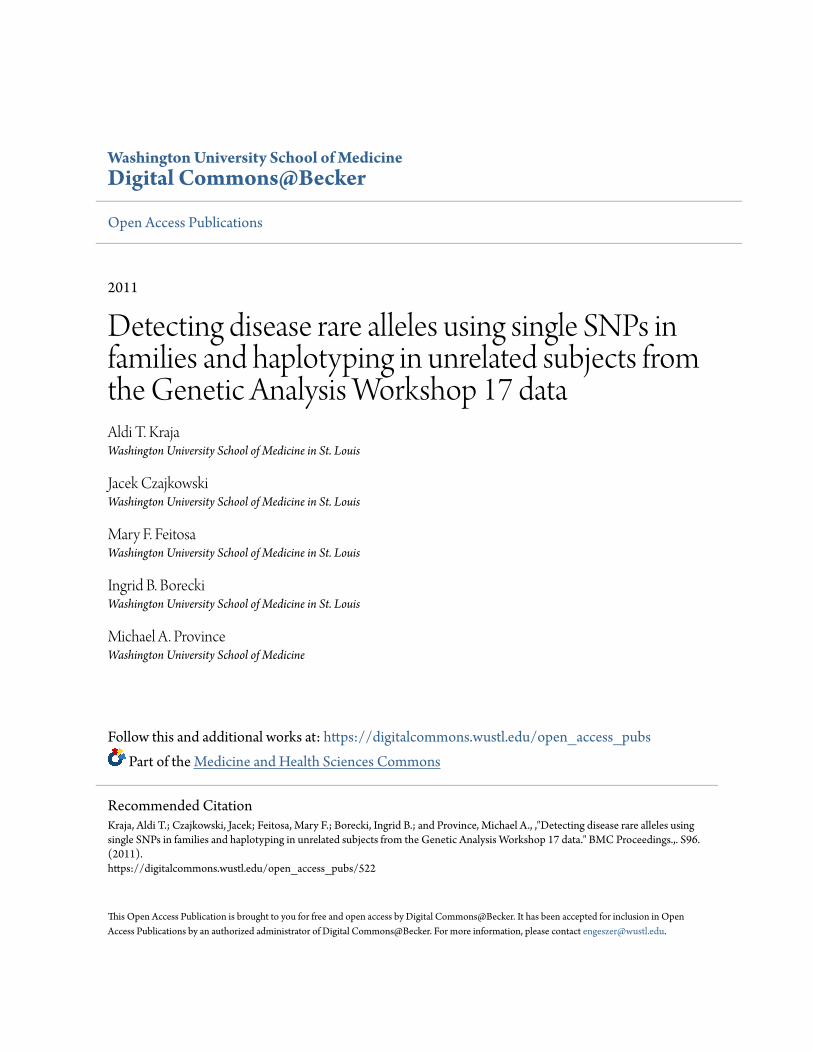
Figure 1 Genome-wide linear mixed effects additive model association test results of 200 replications of family-based cohort data onQ2 residuals. None of the SNPs’ −log10p mean values passed the 5.4 genome-wide threshold. Sens. = sensitivity. Red triangles markchromosomes that were simulated with Q2 causative SNPs (72 of them in 13 genes).
Kraja et al. BMC Proceedings 2011, 5(Suppl 9):S96http://www.biomedcentral.com/1753-6561/5/S9/S96
Page 2 of 6

heritability of Q2 was simulated to be 29%. Most of thegenes affecting the Q2 trait were selected to be relatedto cardiovascular disease risk and inflammation, andthey are located on chromosomes 2, 3, 6–12, and 17.Before the LME association tests, we performed a step-wise regression for Q2 within Sex to remove the effectsof Age and Age2. As a result, we produced a Q2 resi-dual, which we then used as the dependent variable Y inour analyses. In the statistical analyses, the variable Sexwas included as a covariate (b2cov).We applied haplotype association tests only in the
unrelated individuals sample and specifically within cau-sative simulated genes. We viewed the haplotype analy-sis as a replication analysis by completing it in theunrelated sample for only trait Q2 simulated causativegenes. This was justified by the preceding gain of infor-mation from the LME analysis and from the knowledgewe had of the simulated model for Q2. We implementedthe haplotype analyses using Haplo.Stats, version 1.4.4[4]. The haplotypes studied were created by sliding win-dows of two and windows of three adjacent SNPs. Thisprogram was run in a batch mode in R software, version2.10.0, for Linux OS. The Haplo.Stats package includes
an EM algorithm to estimate haplotype frequencies forunrelated subjects. In the haplo.score function (withinthis package), Schaid et al. [4] implemented the scorestatistics Ub and Vb, where:
UY Y
Xi igi
i
N
b a= −
∅=∑
( )1
(2)
is a measure of covariation of residuals with therecoded genotypes and:
V V V V Vb bb ba aa ab= − −1 (3)
is the variance. To test the association of the trait andmarker haplotypes, Schaid et al. [4] also provided a glo-bal score statistic S,
S U V U= ′ −b b b
1 , (4)
with a chi-square distribution and degrees of freedomequal to the rank of Vb.Finally, we use two definitions to summarize the LME
results: sensitivity and specificity. Sensitivity is the
Figure 2 Sensitivity and specificity of SNPs discovery by using the linear mixed-effects additive model on gene bases for the Q2 simulated trait
Kraja et al. BMC Proceedings 2011, 5(Suppl 9):S96http://www.biomedcentral.com/1753-6561/5/S9/S96
Page 3 of 6

proportion of true-positive causative SNPs that have asignificant test result in 200 replications; and specificityis the proportion of true-negative SNPs that have anegative test result in 200 replications. Both sensitivityand specificity are expressed as percentages.
ResultsThe HaploView linkage disequilibrium analysis on all24,487 markers in the unrelated sample identified11,626 tag SNPs. Therefore our Bonferroni genome-wide significance (a = 0.05) threshold p-value for inde-pendent tests was 4.3 × 10⁻⁶ (−log10p = 5.4). Figure 1shows the results of the average −log10p single-SNP gen-ome-wide significance of 200 replications in familiesproduced by fitting an additive genetic model on Q2residuals. The average of −log10p for 200 replicationswas for all simulated SNPs under the 5.4 (−log10p)threshold. In particular, a group of SNPs simulated ingenes VNN1 (C6S5380, MAF = 17.9%) on chromosome
6 and LPL (C8S442, MAF = 4.2%) showed to someextent significant results.Figure 2 shows the sensitivity per simulated gene by
selecting the most significant representative SNP. Forexample, sensitivity was 37.5% for LPL (marker C8S442)and 34.5% for VNN1 (marker C6S5380). The specificityfor noncausative genes of these tests was very high,>99% (Figure 2).We performed association tests for all causative genes,
with sliding windows of haplotypes taken two or threemarkers at a time, in the unrelated sample. Both types ofsliding windows incorporated the detectable effects of thesimulated data. For example, haplotype C8S441-C8S442-C8S443 with a frequency of 1.6% in the gene LPL wasassociated significantly with Q2 (Figure 3). Another hap-lotype that included marker C8S442 (C8S442-C8S443-C8S444) and had the same frequency of 1.6% alsoshowed significant association with Q2. In genes VNN3and VNN1 a few haplotypes (with two-marker windows)
Figure 3 Three-marker sliding windows haplotypes for the LPL gene. Haplotypes containing the SNP C8S442, although close to rarehaplotypes (frequency 1.6), showed distinct association with Q2 trait.
Kraja et al. BMC Proceedings 2011, 5(Suppl 9):S96http://www.biomedcentral.com/1753-6561/5/S9/S96
Page 4 of 6

showed significant association with Q2, for example, hap-lotype C6S5448-C6S5449 with a frequency of 1% andhaplotype C6S5379-C6S5380 with a frequency of 17.1%(Figure 4). When using the genome-wide significancethreshold of −log10p of 5.4, sensitivity on genes VNN3and VNN1 of the most significant haplotype (C6S5379-C6S5380) was 11.5%, and for LPL (haplotype C8S441-C8S442-C8443) the sensitivity was 2%. Otherwise, if weconsidered the haplotype analysis in the unrelated sampleas a replication of the preliminary discovery in the famil-ial sample and set the significance threshold to a valuecorresponding to the number of haplotype windows testsper gene, then the corresponding sensitivity became22.9% for LPL and 64.5% for VNN3 and VNN1. Otherhaplotypes from other rare allele SNP simulated regionsdid not confirm significant results.
DiscussionDetecting association of very rare alleles (MAF < 1%)with disease or quantitative traits in familial data of
small sample size is challenging. One would haveguessed that in the GAW17 data set, because of itssimulation as a transmission of selected alleles from theunrelated sample into the familial sample, one or morerare alleles would have been transmitted as commonalleles in the familial sample. In the simulated data suchconversion from rare alleles into common ones with theexisting small sample sizes (from unrelated foundersinto familial data) was not present. Therefore in bothsets of genotypic data, simulations were performedmostly on the very rare alleles in 96% of the 72 selectedSNPs for Q2. The average −log10p-value of genome-wide association tests on the simulated data was lessthan the significance threshold. This illustrates thenecessity of finding other methods that manage associa-tion tests for rare alleles.With the massive data dumps coming from new
sequencing technologies, rare alleles will be capturedmore often in the data and will be the aim of manystudies. Moreover, it is believed that rare alleles are
Figure 4 Two-marker sliding windows haplotypes for genes VNN3 and VNN1. Haplotypes containing C6S5380 and C6S5449 show distinctassociation with Q2.
Kraja et al. BMC Proceedings 2011, 5(Suppl 9):S96http://www.biomedcentral.com/1753-6561/5/S9/S96
Page 5 of 6

the gold dust that confer the rest of disease heritabil-ity. It is possible that, in contrast to this simulation,sample sizes in real data will become larger as thecosts of sequencing decrease. But in the existing casewe needed to find ways to increase our statisticalpower to identify the rare causative variants in associa-tion with disease or quantitative traits. Therefore weused a two-step analysis design: the LME model fordiscovering genome-wide causative SNPs or genes inthe familial sample and haplotype association tests forreplicating primary findings, but now in the unrelatedsample.The haplotype association test has more power to
identify the SNPs’ effect on disease and quantitativetraits. The haplotype association tests produced signif-icant results for several common haplotypes, includingthose with a frequency close to 1%. However, thismethod also failed to identify any other significanthaplotypes in association with Q2 from the very raresimulated SNPs (MAF < 1%). Based on our results for200 replications, we conclude that failing to detect thevery rare causative SNPs was not a failure of themethods but more a reflection of the low statisticalpower available with the small sample size of thesimulated data.
ConclusionsThe genotypic data analyzed from the 1000 GenomesProject (sampled real data) based on unrelated indivi-duals show that for the selected gene regions there isan important saving of about 53% when tag SNPs areused rather than the full sequence. The other dimen-sion of the data, the sample size of 697 individualsused in this simulation, was small, and thus althoughsequence data were available, the power of associationanalysis was low. Therefore the additive single-SNPassociation tests based on LME models in small sam-ples of data failed to detect the simulated causativevery rare polymorphisms. The association tests basedon haplotype analyses improved the p-value strengthby replicating discovered causative polymorphisms, butthey still failed with very rare alleles, reflecting theinadequate statistical power of small sample sizes inthe simulated data.
AcknowledgementsThis article has been published as part of BMC Proceedings Volume 5Supplement 9, 2011: Genetic Analysis Workshop 17. The full contents of thesupplement are available online at http://www.biomedcentral.com/1753-6561/5?issue=S9.
Authors’ contributionsATK and JC carried out the analyses; ATK, JC, MFF, IBB, and MAP planned theanalyses, wrote the manuscript as well as revised it. All authors read andapproved the final manuscript.
Competing interestsThe authors declare that there are no competing interests.
Published: 29 November 2011
References1. Almasy LA, Dyer TD, Peralta JM, Kent JW Jr., Charlesworth JC, Curran JE,
Blangero J: Genetic Analysis Workshop 17 mini-exome simulation. BMCProc 2011, 5(suppl 9):S2.
2. Speer MC, Terwilliger JD, Ott J: Data simulation for GAW9 problems 1 and2. Genet Epidemiol 1995, 12:561-564.
3. Barrett JC, Fry B, Maller J, Daly MJ: HaploView: analysis and visualization ofLD and haplotype maps. Bioinformatics 2005, 21:263-265.
4. Schaid DJ, Rowland CM, Tines DE, Jacobson RM, Poland GA: Score tests forassociation between traits and haplotypes when linkage phase isambiguous. Am J Hum Genet 2002, 70:425-434.
doi:10.1186/1753-6561-5-S9-S96Cite this article as: Kraja et al.: Detecting disease rare alleles usingsingle SNPs in families and haplotyping in unrelated subjects from theGenetic Analysis Workshop 17 data. BMC Proceedings 2011 5(Suppl 9):S96.
Submit your next manuscript to BioMed Centraland take full advantage of:
• Convenient online submission
• Thorough peer review
• No space constraints or color figure charges
• Immediate publication on acceptance
• Inclusion in PubMed, CAS, Scopus and Google Scholar
• Research which is freely available for redistribution
Submit your manuscript at www.biomedcentral.com/submit
Kraja et al. BMC Proceedings 2011, 5(Suppl 9):S96http://www.biomedcentral.com/1753-6561/5/S9/S96
Page 6 of 6


![Genome-wide SNP data of Izumo and Makurazaki ...reports of substructure within Japanese people using genome-wide SNPs [9, 10] and HLA alleles [11, 12]. Nonetheless, some regions in](https://img.pdfslide.us/doc/110x75/60e5e9bd90426402df484d86/genome-wide-snp-data-of-izumo-and-makurazaki-reports-of-substructure-within.jpg)