Embed Size (px)
Citation preview
DETECTING BEHAVIORAL FAILURES IN EMERGING ELECTRIC VEHICLE1INFRASTRUCTURE USING SUPERVISED TEXT CLASSIFICATION ALGORITHMS2
345
Sooji Ha6School of Civil & Environmental Engineering and School of Computational Science &7Engineering8Georgia Institute of Technology, Atlanta, GA, 303329Email: [email protected]
11Daniel J. Marchetto12School of Public Policy13Georgia Institute of Technology, Atlanta, GA, 3033214Email: [email protected]
16Mary Elizabeth Burke17School of Public Policy18Georgia Institute of Technology, Atlanta, GA, 3033219Email: [email protected]
21Omar Isaac Asensio*22School of Public Policy and Institute for Data Engineering & Science (IDEaS)23Georgia Institute of Technology, Atlanta, GA, 3033224Email: [email protected] Number: 0000-0003-2143-502226* Corresponding Author27
2829303132333435
Submission Date: August 1, 201936
Ha, Marchetto, Burke and Asensio 2
ABSTRACT1There is a growing interest in applying computational tools to the automatic discovery of social2and economic behavior. For example, with decisions involving resource allocation related to pub-3lic infrastructure, the ability to predict failures can allow for more efficient policy responses. In4this paper, we use social data from a popular electric vehicle (EV) driver app to characterize the5emerging EV charging station infrastructure. We introduce a typology of EV charging experiences6collected from user reviews and deploy text classification algorithms, including convolutional neu-7ral networks (CNN), to automatically learn about potential failures. We use machine learning8techniques as a pre-processing tool for econometric analyses on the quality of service delivery.9After classifying the reviews into 9 main user topics and 34 subtopics, we find that the dominant10issues in EV charging relate to station functionality and availability, which drive negative consumer11experience. Contrary to the public discourse about EVs, range anxiety was not of large concern to12existing EV drivers. Based on our findings, we move towards automated identification of failures13in public charging infrastructure that can significantly reduce research evaluation costs through14relatively simple computational solutions.15
16Keywords: electric vehicles, consumer behavior, convolutional neural networks, natural language17processing, mobile data18
Ha, Marchetto, Burke and Asensio 3
INTRODUCTION1The transportation sector has become a dominant source of CO2 emissions in the United States2(1). In the last few years, there has been a growing attention on vehicle electrification as a strategy3to reduce mobile source emissions with positive spillovers in air quality benefits (2). For example,4in order to accelerate electric vehicle (EV) purchases, a majority of U.S. states are offering some5type of financial incentive to complement federal tax credits, including rebates, tax exemptions and6other incentives (3–5). An important complementarity to EV adoption is the availability of public7charging infrastructure. It is now estimated that global investment in EV charging infrastructure8from public and private sources will reach $80 billion USD by 2025 (6). In the US, this investment9growth also marks an expected transition in policy support to a focus on charging infrastructure.10
However, currently there is no easy way to evaluate the needs of drivers or assess perfor-11mance. This is because the infrastructure upgrades needed to be able to monitor electric consump-12tion and use in individual charging stations are at early stages of development or not available.13Further, the large-scale data required to evaluate system performance cannot easily be aggregated14across charging networks. Given the rise in real-time streaming data in transportation and mo-15bility apps, much of the useful intelligence about charging infrastructure performance lies highly16unstructured. Consumer reviews, for example, can be collected instantly from thousands of users,17and manually processing or analyzing this unstructured data to collect useful information has not18been possible. We argue that real-time, streaming data will be increasingly important for research19evaluation of sustainable infrastructure. For example, since the release of a popular charging sta-20tion locator app, there have been over 1.5 million user reviews of charging stations lying dormant as21text (7). Given this volume of data, even at an expert processing rate of 120 reviews per hour, it will22be prohibitively costly for humans to classify this unstructured text data for research evaluation.23
We have shown in prior research that consumer sentiment can be automatically processed24with high accuracy through computational aid (8). From this analysis, the evidence suggests that25there is a significant amount of negative consumer sentiment related to the charging experience.26While we demonstrated state-of-the-art performance from neural network-based models in this27domain, learning about the sources of negative consumer experience, which is needed to conduct28policy analysis, remains a challenging task due to the complexity of natural language processing29(NLP). In this paper, we therefore introduce a computational solution to analyze the content of real-30time text data as tailored to the domain of EVs and consumer behavior. Because it is known that31consumer reviews may be subject to self-selection and other observational biases, we use machine32learning as a pre-processing tool to conduct econometric analyses for statistical adjustment. We use33this approach to automatically learn about large-scale barriers to EV infrastructure use nationally.34
Contrary to the public discourse, we find that range anxiety is not a major concern among35existing EV drivers. Instead, our results suggest that the major issues facing EV drivers relate to36station functionality and availability—an insight that we make possible through large-scale data37integration.38
MACHINE LEARNING AND TEXT CLASSIFICATION39With the increasing popularity of social data from digital platforms, user-generated short texts have40become an important data source for NLP. In the transportation domain regarding EV adoption,41there are as yet few research studies that translate the unstructured data from user generated texts42into actionable intelligence. One exception is a recent paper by Kuhl et al. (2019) in which43the authors manually coded Twitter data and found that contrary to what has been the focus in the44
Ha, Marchetto, Burke and Asensio 4
literature, charging infrastructure was the most discussed topic (9). There is no definitive study that1does large-scale analysis of EV behavior for policy analysis. Further, the implementation of recent2advances, such as deep neural networks (DNNs), which have revolutionized the field of natural3language processing (10) have not been implemented for transportation policy. There are two4prevailing types of DNNs. The first are convolutional neural networks (CNNs). CNNs extract the5most meaningful information from text data by decomposing the hierarchical structure of sentences6or phrases (11). The other prevailing DNN architecture is that of recurrent neural networks (RNNs)7(12). RNNs have the added benefit of flexibility in analyzing a sequence of text. For instance, a8recent study by Ma et al., (2019) collected Chinese consumers’ online comments about electric9vehicles and processed the data with a variant of an RNN architecture, known as the long short-10term memory (LSTM) in order to review EV purchase preferences such as retail prices, and EV11makes and models (13). However, the authors do not report their classifier performance measures12in their text mining analysis (e.g., accuracy and F1 score), so it is not possible to meaningfully13access the relative merits of DNNs in this domain.14
Choosing between CNN or RNN architectures for any type of data is currently an ongo-15ing debate in the literature (10). In our prior work, we initially demonstrated that a CNN model16produced state-of-the-art accuracy with good balance measures for sentiment classification tasks,17which weakly dominated an RNN model (14). From the consumer analysis of charging station18sentiment, we were also able to demonstrate that there were differences in station-level sentiment19when looking at the geographical regions (e.g. urban, rural, etc.) even after controlling for ob-20servable station characteristics. However, sentiment analysis, although informative about quality21perceptions, does not give us a window into the specific mechanisms or sources of the negative22sentiment. As such, in this contribution, we are interested in applying innovations in NLP to intro-23duce a typology of charging behavior and to provide insights on the use of computational tools for24the automatic detection and discovery of barriers to infrastructure management.25
DATA AND METHODS26We have a nationally representative sample of unstructured consumer reviews at 12,720 US charg-27ing station locations as provided by a popular EV charge station locator app. The text data consists28of 127,257 reviews written in English from 29,532 registered and unregistered EV drivers during29the period from 2011 to 2015. The sample represents charging stations from the entire U.S. market30during the period of study. This includes data aggregated from 10 major EV charging networks31in the US. In the sample, we also geocoded point of interest (POI) location information using32Google places API for categories such as Dealerships, Government, Healthcare, Hotel/Lodging,33Other, Park, Parking Garage/Lot, Residential, Restaurant, School/University, Shopping Center,34Store/Retail, and Workplace. For more information, ref. (8).35
EV Charging Infrastructure Consumer Reviews36The charging station reviews can be considered social interactions within the community of EV37drivers. After analyzing the contents of over 8,000 reviews, two research assistants were able to38identify the main categories discussed by users and were able to determine which issues are most39prominent regarding the charging experiences of this community. In preliminary experiments,40we investigated several unsupervised topic modeling techniques that did not provide theoretically41meaningful clusters. Therefore, we took the approach of hard coding labels based on human intel-42ligence. We introduce 9 main categories and 34 subcategories that make up a typology of charging43
Ha, Marchetto, Burke and Asensio 5
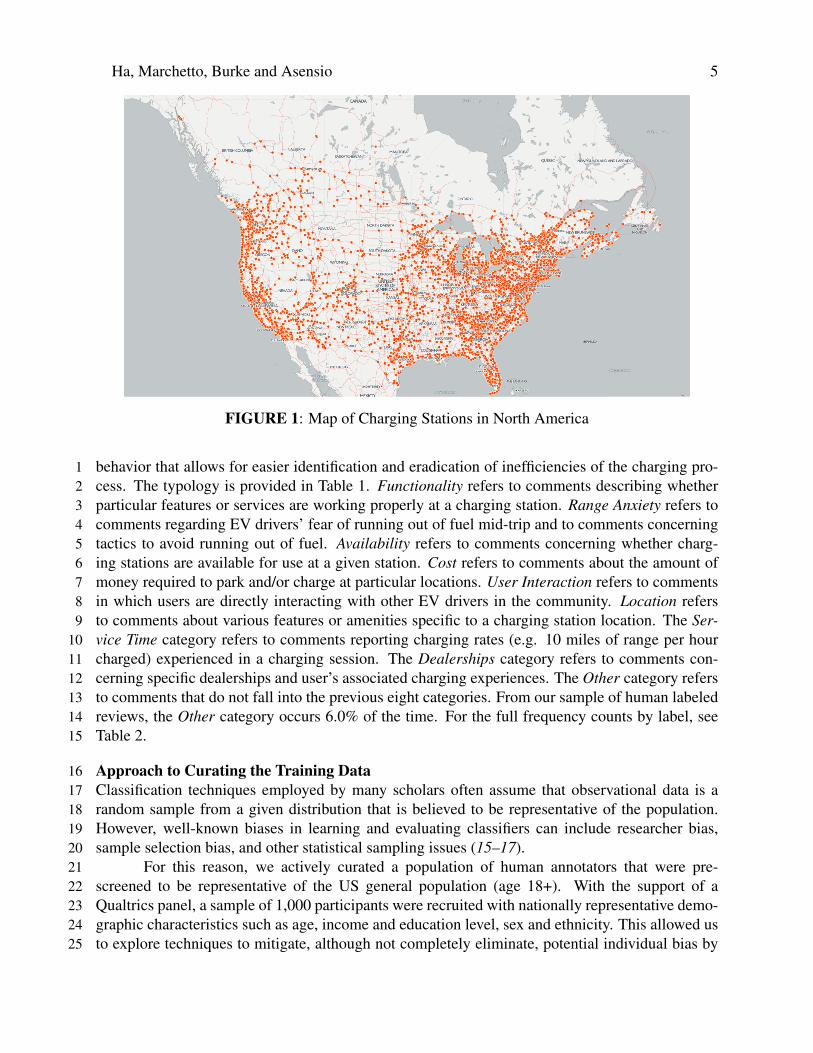
FIGURE 1: Map of Charging Stations in North America
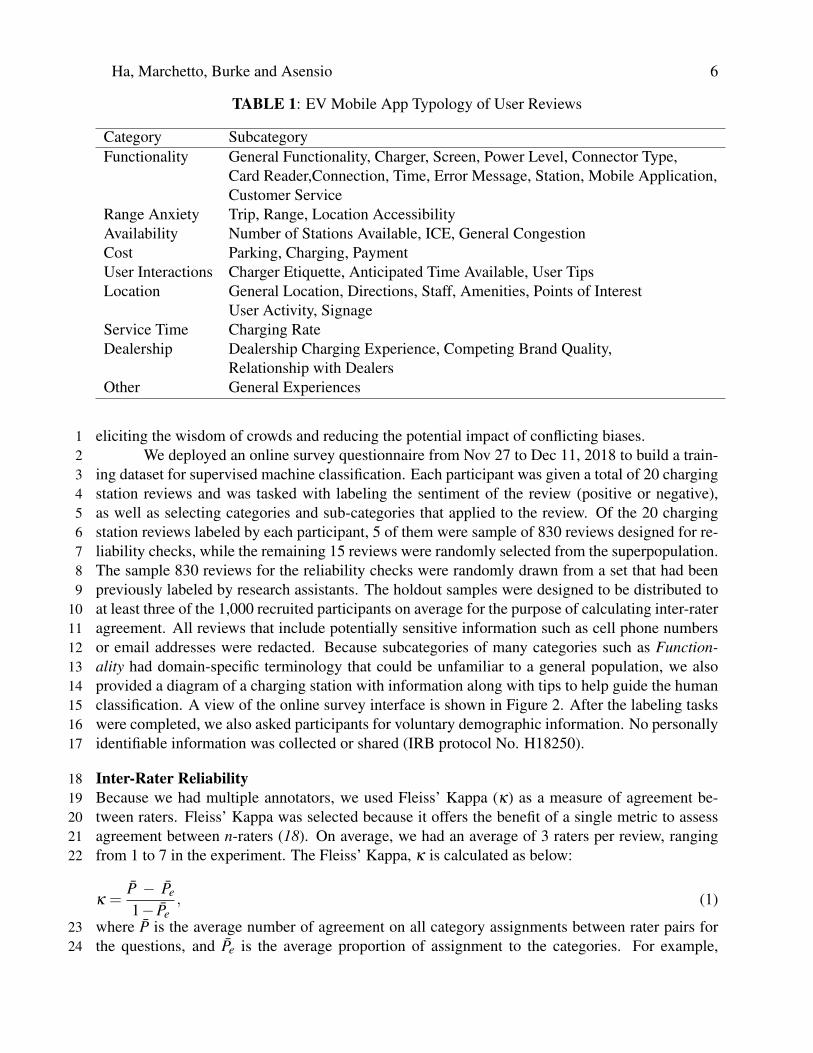
behavior that allows for easier identification and eradication of inefficiencies of the charging pro-1cess. The typology is provided in Table 1. Functionality refers to comments describing whether2particular features or services are working properly at a charging station. Range Anxiety refers to3comments regarding EV drivers’ fear of running out of fuel mid-trip and to comments concerning4tactics to avoid running out of fuel. Availability refers to comments concerning whether charg-5ing stations are available for use at a given station. Cost refers to comments about the amount of6money required to park and/or charge at particular locations. User Interaction refers to comments7in which users are directly interacting with other EV drivers in the community. Location refers8to comments about various features or amenities specific to a charging station location. The Ser-9vice Time category refers to comments reporting charging rates (e.g. 10 miles of range per hour10charged) experienced in a charging session. The Dealerships category refers to comments con-11cerning specific dealerships and user’s associated charging experiences. The Other category refers12to comments that do not fall into the previous eight categories. From our sample of human labeled13reviews, the Other category occurs 6.0% of the time. For the full frequency counts by label, see14Table 2.15
Approach to Curating the Training Data16Classification techniques employed by many scholars often assume that observational data is a17random sample from a given distribution that is believed to be representative of the population.18However, well-known biases in learning and evaluating classifiers can include researcher bias,19sample selection bias, and other statistical sampling issues (15–17).20
For this reason, we actively curated a population of human annotators that were pre-21screened to be representative of the US general population (age 18+). With the support of a22Qualtrics panel, a sample of 1,000 participants were recruited with nationally representative demo-23graphic characteristics such as age, income and education level, sex and ethnicity. This allowed us24to explore techniques to mitigate, although not completely eliminate, potential individual bias by25
Ha, Marchetto, Burke and Asensio 6
TABLE 1: EV Mobile App Typology of User Reviews
Category SubcategoryFunctionality General Functionality, Charger, Screen, Power Level, Connector Type,
Card Reader,Connection, Time, Error Message, Station, Mobile Application,Customer Service
Range Anxiety Trip, Range, Location AccessibilityAvailability Number of Stations Available, ICE, General CongestionCost Parking, Charging, PaymentUser Interactions Charger Etiquette, Anticipated Time Available, User TipsLocation General Location, Directions, Staff, Amenities, Points of Interest
User Activity, SignageService Time Charging RateDealership Dealership Charging Experience, Competing Brand Quality,
Relationship with DealersOther General Experiences
eliciting the wisdom of crowds and reducing the potential impact of conflicting biases.1We deployed an online survey questionnaire from Nov 27 to Dec 11, 2018 to build a train-2
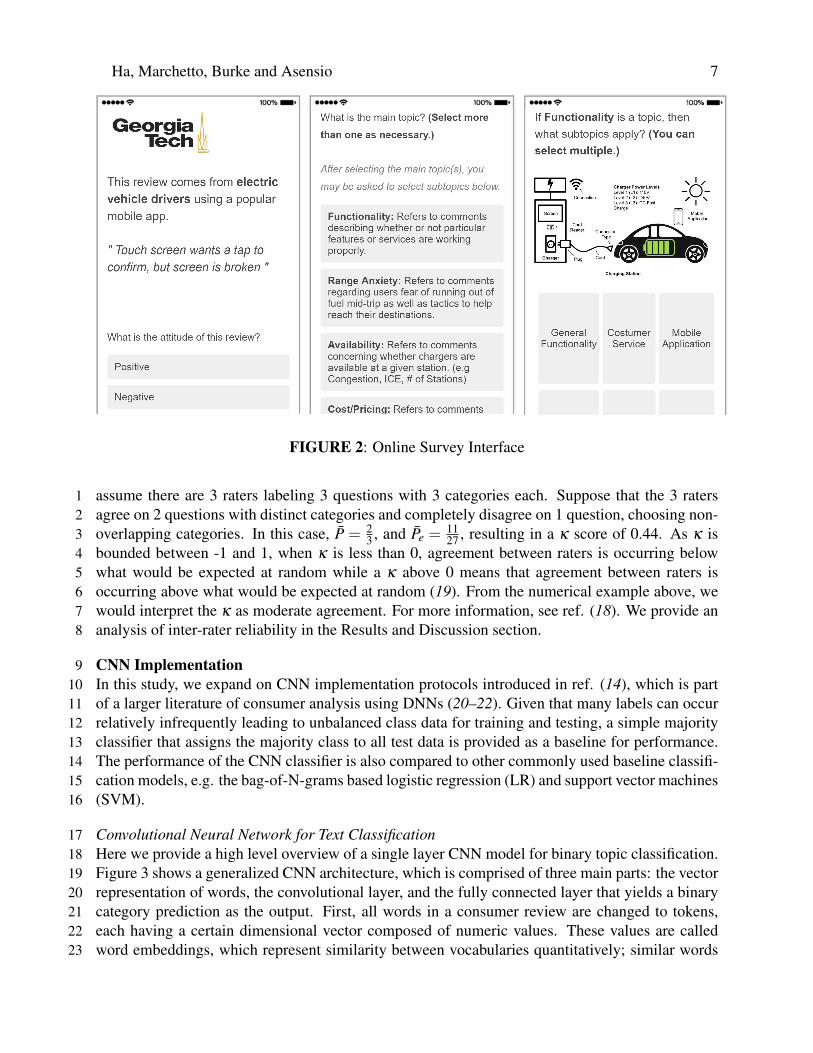
ing dataset for supervised machine classification. Each participant was given a total of 20 charging3station reviews and was tasked with labeling the sentiment of the review (positive or negative),4as well as selecting categories and sub-categories that applied to the review. Of the 20 charging5station reviews labeled by each participant, 5 of them were sample of 830 reviews designed for re-6liability checks, while the remaining 15 reviews were randomly selected from the superpopulation.7The sample 830 reviews for the reliability checks were randomly drawn from a set that had been8previously labeled by research assistants. The holdout samples were designed to be distributed to9at least three of the 1,000 recruited participants on average for the purpose of calculating inter-rater10agreement. All reviews that include potentially sensitive information such as cell phone numbers11or email addresses were redacted. Because subcategories of many categories such as Function-12ality had domain-specific terminology that could be unfamiliar to a general population, we also13provided a diagram of a charging station with information along with tips to help guide the human14classification. A view of the online survey interface is shown in Figure 2. After the labeling tasks15were completed, we also asked participants for voluntary demographic information. No personally16identifiable information was collected or shared (IRB protocol No. H18250).17
Inter-Rater Reliability18Because we had multiple annotators, we used Fleiss’ Kappa (k) as a measure of agreement be-19tween raters. Fleiss’ Kappa was selected because it offers the benefit of a single metric to assess20agreement between n-raters (18). On average, we had an average of 3 raters per review, ranging21from 1 to 7 in the experiment. The Fleiss’ Kappa, k is calculated as below:22
k =P̄ � P̄e
1� P̄e, (1)
where P̄ is the average number of agreement on all category assignments between rater pairs for23the questions, and P̄e is the average proportion of assignment to the categories. For example,24
Ha, Marchetto, Burke and Asensio 7
FIGURE 2: Online Survey Interface
assume there are 3 raters labeling 3 questions with 3 categories each. Suppose that the 3 raters1agree on 2 questions with distinct categories and completely disagree on 1 question, choosing non-2overlapping categories. In this case, P̄ = 2
3 , and P̄e =1127 , resulting in a k score of 0.44. As k is3
bounded between -1 and 1, when k is less than 0, agreement between raters is occurring below4what would be expected at random while a k above 0 means that agreement between raters is5occurring above what would be expected at random (19). From the numerical example above, we6would interpret the k as moderate agreement. For more information, see ref. (18). We provide an7analysis of inter-rater reliability in the Results and Discussion section.8
CNN Implementation9In this study, we expand on CNN implementation protocols introduced in ref. (14), which is part10of a larger literature of consumer analysis using DNNs (20–22). Given that many labels can occur11relatively infrequently leading to unbalanced class data for training and testing, a simple majority12classifier that assigns the majority class to all test data is provided as a baseline for performance.13The performance of the CNN classifier is also compared to other commonly used baseline classifi-14cation models, e.g. the bag-of-N-grams based logistic regression (LR) and support vector machines15(SVM).16
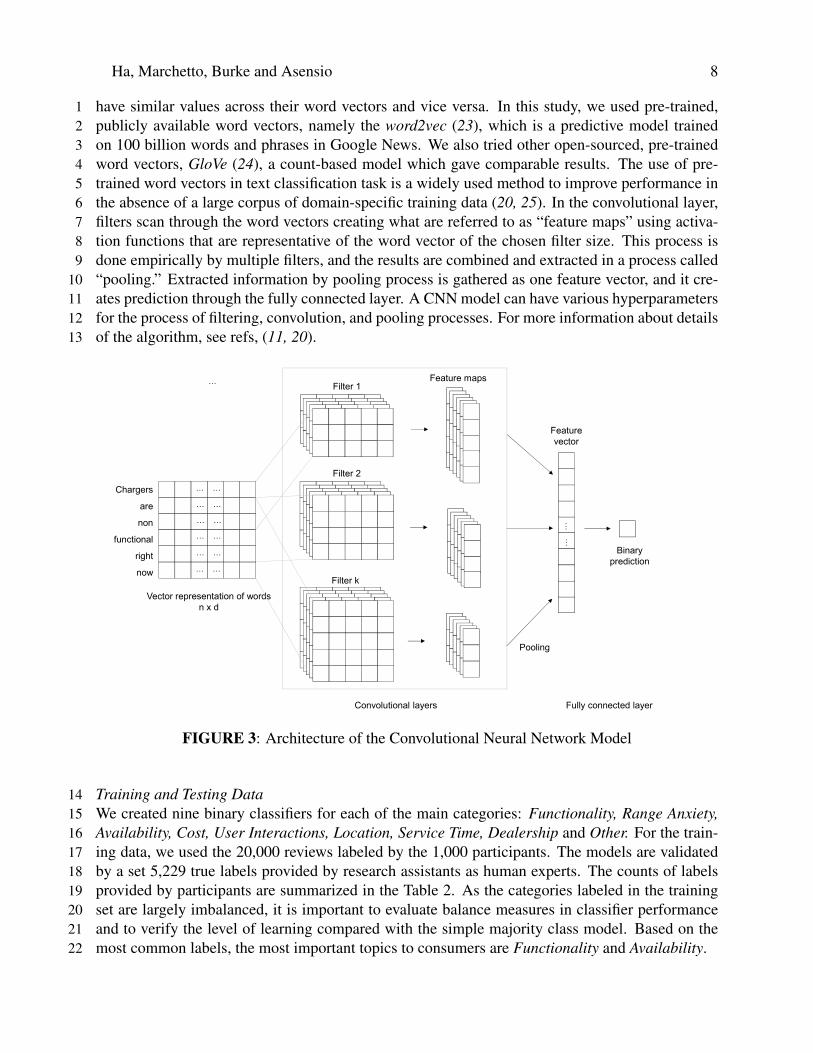
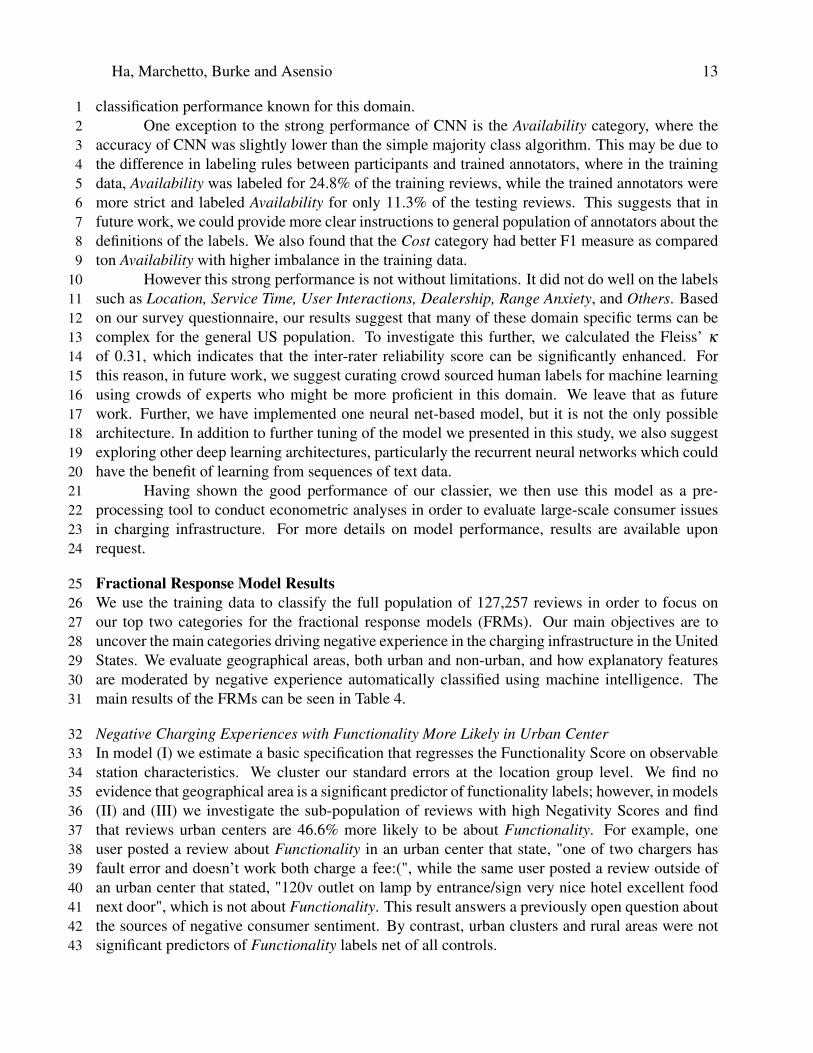
Convolutional Neural Network for Text Classification17Here we provide a high level overview of a single layer CNN model for binary topic classification.18Figure 3 shows a generalized CNN architecture, which is comprised of three main parts: the vector19representation of words, the convolutional layer, and the fully connected layer that yields a binary20category prediction as the output. First, all words in a consumer review are changed to tokens,21each having a certain dimensional vector composed of numeric values. These values are called22word embeddings, which represent similarity between vocabularies quantitatively; similar words23
Ha, Marchetto, Burke and Asensio 8
have similar values across their word vectors and vice versa. In this study, we used pre-trained,1publicly available word vectors, namely the word2vec (23), which is a predictive model trained2on 100 billion words and phrases in Google News. We also tried other open-sourced, pre-trained3word vectors, GloVe (24), a count-based model which gave comparable results. The use of pre-4trained word vectors in text classification task is a widely used method to improve performance in5the absence of a large corpus of domain-specific training data (20, 25). In the convolutional layer,6filters scan through the word vectors creating what are referred to as “feature maps” using activa-7tion functions that are representative of the word vector of the chosen filter size. This process is8done empirically by multiple filters, and the results are combined and extracted in a process called9“pooling.” Extracted information by pooling process is gathered as one feature vector, and it cre-10ates prediction through the fully connected layer. A CNN model can have various hyperparameters11for the process of filtering, convolution, and pooling processes. For more information about details12of the algorithm, see refs, (11, 20).13
Chargers
are
non
functional
right
now
Convolutional layers
… …
… …
… …
… …
… …
… …
……
Fully connected layer
Filter 1
Filter 2
Filter k
Feature maps
Feature vector
Binary prediction
Vector representation of wordsn x d
…
Pooling
FIGURE 3: Architecture of the Convolutional Neural Network Model
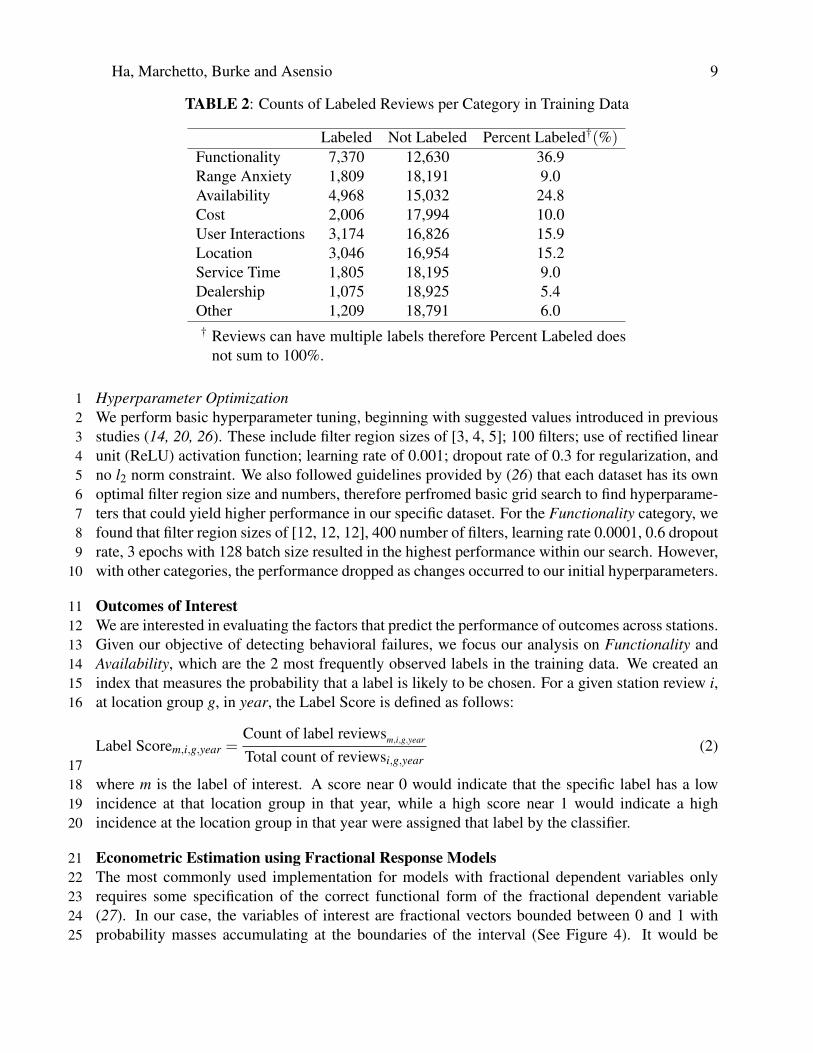
Training and Testing Data14We created nine binary classifiers for each of the main categories: Functionality, Range Anxiety,15Availability, Cost, User Interactions, Location, Service Time, Dealership and Other. For the train-16ing data, we used the 20,000 reviews labeled by the 1,000 participants. The models are validated17by a set 5,229 true labels provided by research assistants as human experts. The counts of labels18provided by participants are summarized in the Table 2. As the categories labeled in the training19set are largely imbalanced, it is important to evaluate balance measures in classifier performance20and to verify the level of learning compared with the simple majority class model. Based on the21most common labels, the most important topics to consumers are Functionality and Availability.22
Ha, Marchetto, Burke and Asensio 9
TABLE 2: Counts of Labeled Reviews per Category in Training Data
Labeled Not Labeled Percent Labeled†(%)Functionality 7,370 12,630 36.9Range Anxiety 1,809 18,191 9.0Availability 4,968 15,032 24.8Cost 2,006 17,994 10.0User Interactions 3,174 16,826 15.9Location 3,046 16,954 15.2Service Time 1,805 18,195 9.0Dealership 1,075 18,925 5.4Other 1,209 18,791 6.0† Reviews can have multiple labels therefore Percent Labeled does
not sum to 100%.
Hyperparameter Optimization1We perform basic hyperparameter tuning, beginning with suggested values introduced in previous2studies (14, 20, 26). These include filter region sizes of [3, 4, 5]; 100 filters; use of rectified linear3unit (ReLU) activation function; learning rate of 0.001; dropout rate of 0.3 for regularization, and4no l2 norm constraint. We also followed guidelines provided by (26) that each dataset has its own5optimal filter region size and numbers, therefore perfromed basic grid search to find hyperparame-6ters that could yield higher performance in our specific dataset. For the Functionality category, we7found that filter region sizes of [12, 12, 12], 400 number of filters, learning rate 0.0001, 0.6 dropout8rate, 3 epochs with 128 batch size resulted in the highest performance within our search. However,9with other categories, the performance dropped as changes occurred to our initial hyperparameters.10
Outcomes of Interest11We are interested in evaluating the factors that predict the performance of outcomes across stations.12Given our objective of detecting behavioral failures, we focus our analysis on Functionality and13Availability, which are the 2 most frequently observed labels in the training data. We created an14index that measures the probability that a label is likely to be chosen. For a given station review i,15at location group g, in year, the Label Score is defined as follows:16
Label Scorem,i,g,year =Count of label reviewsm,i,g,year
Total count of reviewsi,g,year(2)
17where m is the label of interest. A score near 0 would indicate that the specific label has a low18incidence at that location group in that year, while a high score near 1 would indicate a high19incidence at the location group in that year were assigned that label by the classifier.20
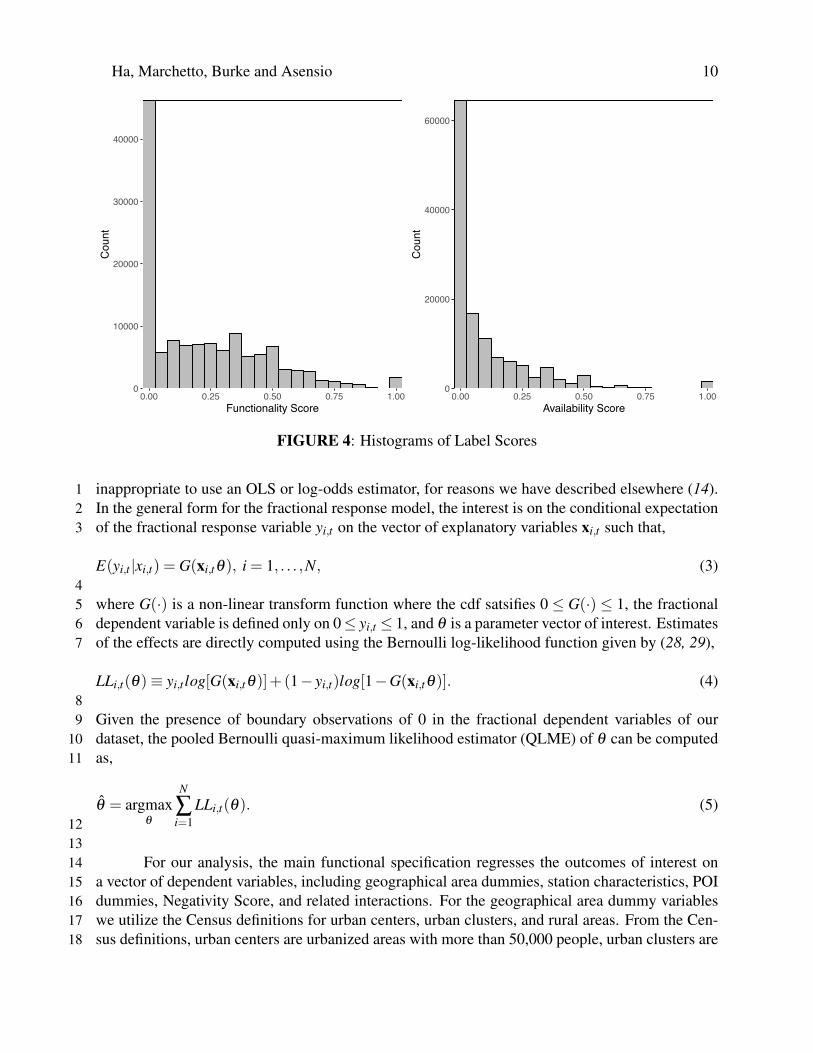
Econometric Estimation using Fractional Response Models21The most commonly used implementation for models with fractional dependent variables only22requires some specification of the correct functional form of the fractional dependent variable23(27). In our case, the variables of interest are fractional vectors bounded between 0 and 1 with24probability masses accumulating at the boundaries of the interval (See Figure 4). It would be25
Ha, Marchetto, Burke and Asensio 10
0
10000
20000
30000
40000
0.00 0.25 0.50 0.75 1.00Functionality Score
Cou
nt
0
20000
40000
60000
0.00 0.25 0.50 0.75 1.00Availability Score
Cou
nt
FIGURE 4: Histograms of Label Scores
inappropriate to use an OLS or log-odds estimator, for reasons we have described elsewhere (14).1In the general form for the fractional response model, the interest is on the conditional expectation2of the fractional response variable yi,t on the vector of explanatory variables xi,t such that,3
E(yi,t |xi,t) = G(xi,tq), i = 1, . . . ,N, (3)4
where G(·) is a non-linear transform function where the cdf satsifies 0 G(·) 1, the fractional5dependent variable is defined only on 0 yi,t 1, and q is a parameter vector of interest. Estimates6of the effects are directly computed using the Bernoulli log-likelihood function given by (28, 29),7
LLi,t(q)⌘ yi,t log[G(xi,tq)]+(1� yi,t)log[1�G(xi,tq)]. (4)8
Given the presence of boundary observations of 0 in the fractional dependent variables of our9dataset, the pooled Bernoulli quasi-maximum likelihood estimator (QLME) of q can be computed10as,11
q̂ = argmaxq
N
Âi=1
LLi,t(q). (5)1213
For our analysis, the main functional specification regresses the outcomes of interest on14a vector of dependent variables, including geographical area dummies, station characteristics, POI15dummies, Negativity Score, and related interactions. For the geographical area dummy variables16we utilize the Census definitions for urban centers, urban clusters, and rural areas. From the Cen-17sus definitions, urban centers are urbanized areas with more than 50,000 people, urban clusters are18
Ha, Marchetto, Burke and Asensio 11
urbanized ares with populations between 2,500 and 50,000 people, and rural areas are any such1areas outside of urbanized ones (30). The station characteristics include measures of the number2of connectors at a station, the number of networks at a station, and a proprietary station quality3rating that ranges between 1 and 5. The general functional specification is as follows:4
Label Scorem,i,g,year = ai,year +Geographical Area Dummiesg +Station Characteristicsi,g,year
+Negativity Scorei,g,year + Interaction Effectsi,g,year +POI Dummiesg (6)
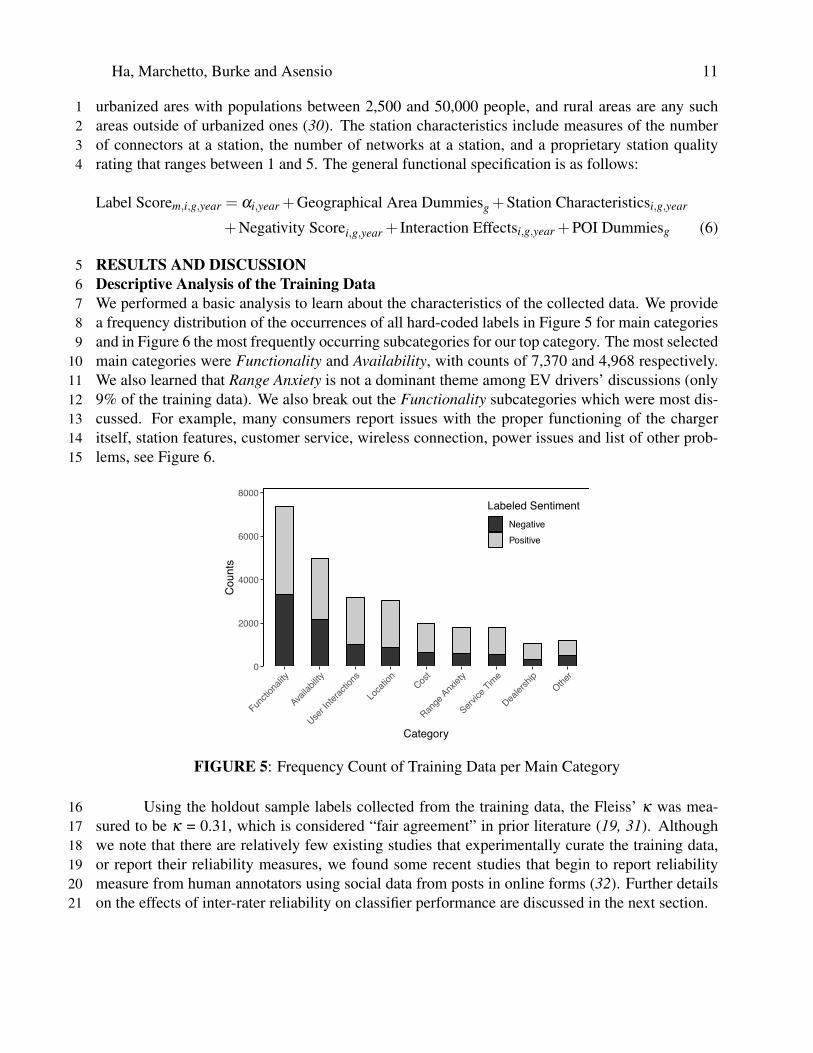
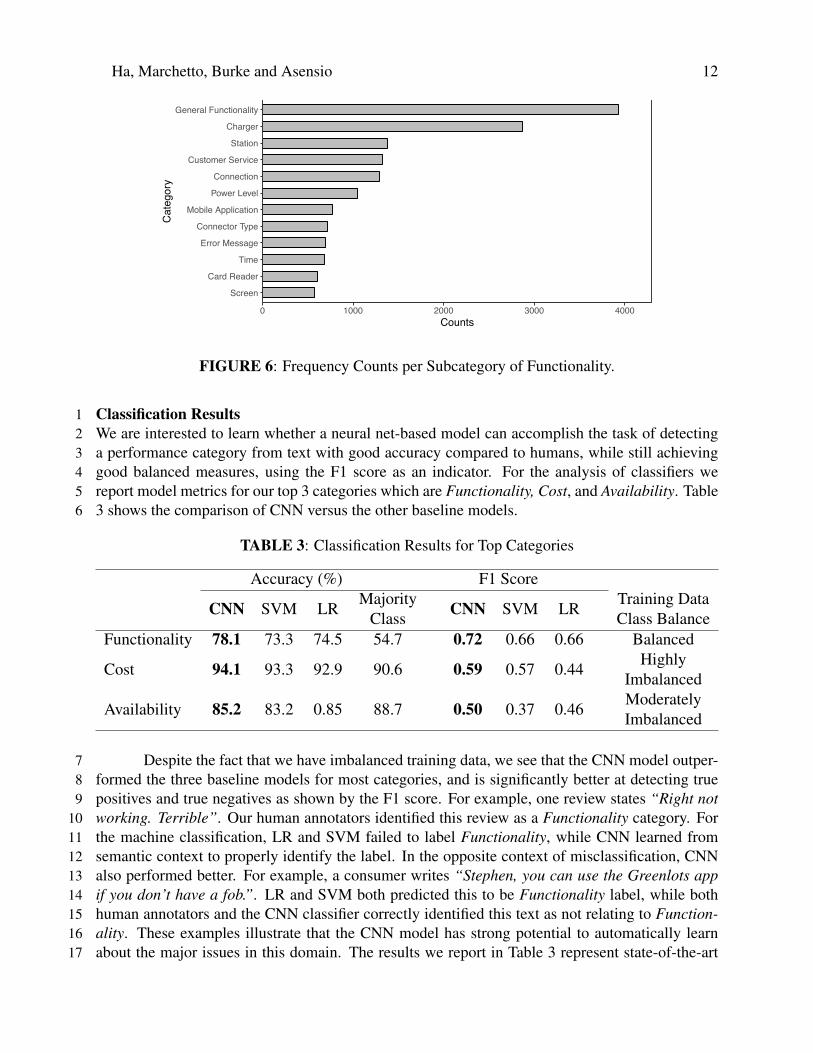
RESULTS AND DISCUSSION5Descriptive Analysis of the Training Data6We performed a basic analysis to learn about the characteristics of the collected data. We provide7a frequency distribution of the occurrences of all hard-coded labels in Figure 5 for main categories8and in Figure 6 the most frequently occurring subcategories for our top category. The most selected9main categories were Functionality and Availability, with counts of 7,370 and 4,968 respectively.10We also learned that Range Anxiety is not a dominant theme among EV drivers’ discussions (only119% of the training data). We also break out the Functionality subcategories which were most dis-12cussed. For example, many consumers report issues with the proper functioning of the charger13itself, station features, customer service, wireless connection, power issues and list of other prob-14lems, see Figure 6.15
0
2000
4000
6000
8000
Functio
nality
Availab
ility
User In
terac
tions
Loca
tion
Cost
Range
Anxiet
y
Service
Time
Dealer
ship
Other
Category
Coun
ts
Labeled SentimentNegativePositive
FIGURE 5: Frequency Count of Training Data per Main Category
Using the holdout sample labels collected from the training data, the Fleiss’ k was mea-16sured to be k = 0.31, which is considered “fair agreement” in prior literature (19, 31). Although17we note that there are relatively few existing studies that experimentally curate the training data,18or report their reliability measures, we found some recent studies that begin to report reliability19measure from human annotators using social data from posts in online forms (32). Further details20on the effects of inter-rater reliability on classifier performance are discussed in the next section.21
Ha, Marchetto, Burke and Asensio 12
Screen
Card Reader
Time
Error Message
Connector Type
Mobile Application
Power Level
Connection
Customer Service
Station
Charger
General Functionality
0 1000 2000 3000 4000Counts
Cat
egor
y
FIGURE 6: Frequency Counts per Subcategory of Functionality.
Classification Results1We are interested to learn whether a neural net-based model can accomplish the task of detecting2a performance category from text with good accuracy compared to humans, while still achieving3good balanced measures, using the F1 score as an indicator. For the analysis of classifiers we4report model metrics for our top 3 categories which are Functionality, Cost, and Availability. Table53 shows the comparison of CNN versus the other baseline models.6
TABLE 3: Classification Results for Top Categories
Accuracy (%) F1 Score
CNN SVM LR MajorityClass CNN SVM LR Training Data
Class BalanceFunctionality 78.1 73.3 74.5 54.7 0.72 0.66 0.66 Balanced
Cost 94.1 93.3 92.9 90.6 0.59 0.57 0.44 HighlyImbalanced
Availability 85.2 83.2 0.85 88.7 0.50 0.37 0.46 ModeratelyImbalanced
Despite the fact that we have imbalanced training data, we see that the CNN model outper-7formed the three baseline models for most categories, and is significantly better at detecting true8positives and true negatives as shown by the F1 score. For example, one review states “Right not9working. Terrible”. Our human annotators identified this review as a Functionality category. For10the machine classification, LR and SVM failed to label Functionality, while CNN learned from11semantic context to properly identify the label. In the opposite context of misclassification, CNN12also performed better. For example, a consumer writes “Stephen, you can use the Greenlots app13if you don’t have a fob.”. LR and SVM both predicted this to be Functionality label, while both14human annotators and the CNN classifier correctly identified this text as not relating to Function-15ality. These examples illustrate that the CNN model has strong potential to automatically learn16about the major issues in this domain. The results we report in Table 3 represent state-of-the-art17
Ha, Marchetto, Burke and Asensio 13
classification performance known for this domain.1One exception to the strong performance of CNN is the Availability category, where the2
accuracy of CNN was slightly lower than the simple majority class algorithm. This may be due to3the difference in labeling rules between participants and trained annotators, where in the training4data, Availability was labeled for 24.8% of the training reviews, while the trained annotators were5more strict and labeled Availability for only 11.3% of the testing reviews. This suggests that in6future work, we could provide more clear instructions to general population of annotators about the7definitions of the labels. We also found that the Cost category had better F1 measure as compared8ton Availability with higher imbalance in the training data.9
However this strong performance is not without limitations. It did not do well on the labels10such as Location, Service Time, User Interactions, Dealership, Range Anxiety, and Others. Based11on our survey questionnaire, our results suggest that many of these domain specific terms can be12complex for the general US population. To investigate this further, we calculated the Fleiss’ k13of 0.31, which indicates that the inter-rater reliability score can be significantly enhanced. For14this reason, in future work, we suggest curating crowd sourced human labels for machine learning15using crowds of experts who might be more proficient in this domain. We leave that as future16work. Further, we have implemented one neural net-based model, but it is not the only possible17architecture. In addition to further tuning of the model we presented in this study, we also suggest18exploring other deep learning architectures, particularly the recurrent neural networks which could19have the benefit of learning from sequences of text data.20
Having shown the good performance of our classier, we then use this model as a pre-21processing tool to conduct econometric analyses in order to evaluate large-scale consumer issues22in charging infrastructure. For more details on model performance, results are available upon23request.24
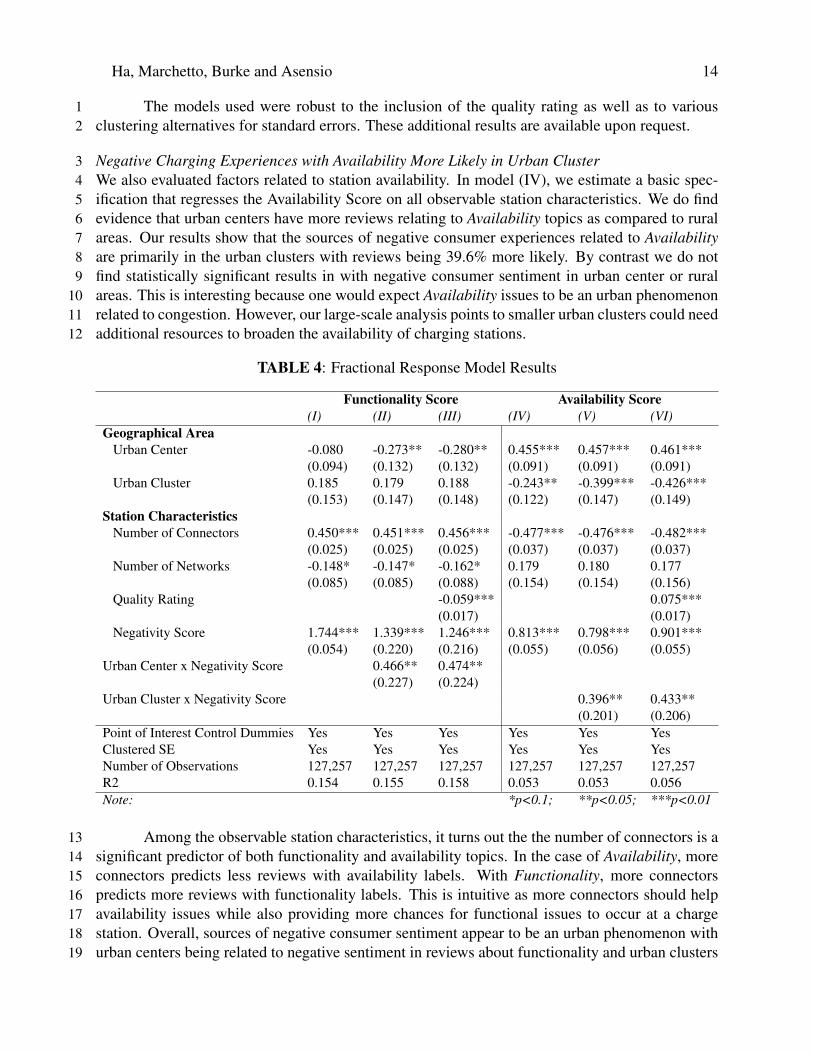
Fractional Response Model Results25We use the training data to classify the full population of 127,257 reviews in order to focus on26our top two categories for the fractional response models (FRMs). Our main objectives are to27uncover the main categories driving negative experience in the charging infrastructure in the United28States. We evaluate geographical areas, both urban and non-urban, and how explanatory features29are moderated by negative experience automatically classified using machine intelligence. The30main results of the FRMs can be seen in Table 4.31
Negative Charging Experiences with Functionality More Likely in Urban Center32In model (I) we estimate a basic specification that regresses the Functionality Score on observable33station characteristics. We cluster our standard errors at the location group level. We find no34evidence that geographical area is a significant predictor of functionality labels; however, in models35(II) and (III) we investigate the sub-population of reviews with high Negativity Scores and find36that reviews urban centers are 46.6% more likely to be about Functionality. For example, one37user posted a review about Functionality in an urban center that state, "one of two chargers has38fault error and doesn’t work both charge a fee:(", while the same user posted a review outside of39an urban center that stated, "120v outlet on lamp by entrance/sign very nice hotel excellent food40next door", which is not about Functionality. This result answers a previously open question about41the sources of negative consumer sentiment. By contrast, urban clusters and rural areas were not42significant predictors of Functionality labels net of all controls.43
Ha, Marchetto, Burke and Asensio 14
The models used were robust to the inclusion of the quality rating as well as to various1clustering alternatives for standard errors. These additional results are available upon request.2
Negative Charging Experiences with Availability More Likely in Urban Cluster3We also evaluated factors related to station availability. In model (IV), we estimate a basic spec-4ification that regresses the Availability Score on all observable station characteristics. We do find5evidence that urban centers have more reviews relating to Availability topics as compared to rural6areas. Our results show that the sources of negative consumer experiences related to Availability7are primarily in the urban clusters with reviews being 39.6% more likely. By contrast we do not8find statistically significant results in with negative consumer sentiment in urban center or rural9areas. This is interesting because one would expect Availability issues to be an urban phenomenon10related to congestion. However, our large-scale analysis points to smaller urban clusters could need11additional resources to broaden the availability of charging stations.12
TABLE 4: Fractional Response Model Results
Functionality Score Availability Score(I) (II) (III) (IV) (V) (VI)
Geographical AreaUrban Center -0.080 -0.273** -0.280** 0.455*** 0.457*** 0.461***
(0.094) (0.132) (0.132) (0.091) (0.091) (0.091)Urban Cluster 0.185 0.179 0.188 -0.243** -0.399*** -0.426***
(0.153) (0.147) (0.148) (0.122) (0.147) (0.149)Station Characteristics
Number of Connectors 0.450*** 0.451*** 0.456*** -0.477*** -0.476*** -0.482***(0.025) (0.025) (0.025) (0.037) (0.037) (0.037)
Number of Networks -0.148* -0.147* -0.162* 0.179 0.180 0.177(0.085) (0.085) (0.088) (0.154) (0.154) (0.156)
Quality Rating -0.059*** 0.075***(0.017) (0.017)
Negativity Score 1.744*** 1.339*** 1.246*** 0.813*** 0.798*** 0.901***(0.054) (0.220) (0.216) (0.055) (0.056) (0.055)
Urban Center x Negativity Score 0.466** 0.474**(0.227) (0.224)
Urban Cluster x Negativity Score 0.396** 0.433**(0.201) (0.206)
Point of Interest Control Dummies Yes Yes Yes Yes Yes YesClustered SE Yes Yes Yes Yes Yes YesNumber of Observations 127,257 127,257 127,257 127,257 127,257 127,257R2 0.154 0.155 0.158 0.053 0.053 0.056Note: *p<0.1; **p<0.05; ***p<0.01
Among the observable station characteristics, it turns out the the number of connectors is a13significant predictor of both functionality and availability topics. In the case of Availability, more14connectors predicts less reviews with availability labels. With Functionality, more connectors15predicts more reviews with functionality labels. This is intuitive as more connectors should help16availability issues while also providing more chances for functional issues to occur at a charge17station. Overall, sources of negative consumer sentiment appear to be an urban phenomenon with18urban centers being related to negative sentiment in reviews about functionality and urban clusters19
Ha, Marchetto, Burke and Asensio 15
being related to negative sentiment in reviews about availability.1
POLICY IMPLICATIONS2In this study, we have been able to demonstrate that advances in computational algorithms can3be deployed at relatively low cost with promising performance measures. We also demonstrate4that through large-scale data aggregation, it may be possible to build a framework that could cap-5ture consumer intelligence about the functioning of the infrastructure, in near-real-time. Such6capabilities could revolutionize how we manage, evaluate, and invest in charging infrastructure for7electrified transportation. Based on our results, we have three main policy recommendations. First,8a necessary criteria for building frameworks for real-time analysis is data and information sharing.9We suggest the expansion of policies that can allow for greater real-time data sharing regionally10and between jurisdictions. Second, given the discovery of negative consumer experiences as an11urban phenomena, we suggest strategies for local and regional government to push greater stan-12dards and investment to help ensure that the quality and reliability of the charging experience is13core to policies for EV growth. Third, the discussion of range anxiety as consumer barrier appears14to be overstated, whereas station functionality and charging availability at the point of use may be15the more critical limitation. Real-time streaming data is already changing the nature of mobility16decisions for consumers. With a trained model present, thousands of reviews can be processed17and analyzed in matter of minutes, if not faster. This should yield significant cost reductions for18infrastructure performance evaluation.19
ACKNOWLEDGEMENTS20We thank the generous support of the National Science Foundation Award No. 1931980, the An-21thony and Jeanne Pritzker Family Foundation, Microsoft Azure for Research (Award CRM:0518988),22the Sustainable LA Grand Challenge, and the Ivan Allen College Dean’s SGR-C Award. For valu-23able research assistance, we thank Cade Lawson and Soobin Oh. We thank Suzie Lee and Han-24nah Weirich at Qualtrics for participant support. For valuable comments and feedback, we thank25Richard Fujimoto, Emily Grubert, Haesun Park and Iris Tien. This research was supported in part26through research cyber-infrastructure resources and services provided by the Partnership for an Ad-27vanced Computing Environment (PACE) at the Georgia Institute of Technology, Atlanta, Georgia,28USA.29
Ha, Marchetto, Burke and Asensio 16
REFERENCES11. EPA, Inventory of U.S. Greenhouse Gas Emissions and Sinks: 1990-2016, 2018, document2
No. 430-R-18-003.32. Council, N. R. et al., Hidden costs of energy: unpriced consequences of energy production4
and use. National Academies Press, 2010.53. Department of Energy, Electric Vehicles: Tax Credits and Other Incentives Database,6
2019, access date: 07/31/2019, https://www.energy.gov/eere/electricvehicles/7electric-vehicles-tax-credits-and-other-incentives.8
4. Carley, S., R. M. Krause, B. W. Lane, and J. D. Graham, Intent to purchase a plug-in9electric vehicle: A survey of early impressions in large US cites. Transportation Research10Part D: Transport and Environment, Vol. 18, 2013, pp. 39–45.11
5. Sheldon, T. L., J. DeShazo, and R. T. Carson, Electric and plug-in hybrid vehicle demand:12lessons for an emerging market. Economic Inquiry, Vol. 55, No. 2, 2017, pp. 695–713.13
6. Navigant, Market Data: EV Market Forecasts: Global Forecasts for Light Duty Plug-In14Hybrid and Battery EV Sales and Populations: 2017-2016, 2017.15
7. Recargo, PlugShare Key Features and Benefits, 2019, access date: 07/31/2019, https:16//recargo.com/plugshare.html.17
8. Alvarez, K., A. Dror, E. Wenzel, and O. I. Asensio, Evaluating Electric Vehicle User18Mobility Data using Neural Network based Language Models. In Proceedings of 98th19Annual Meeting of the Transportation Research Board, ADC80 Standing Committee on20Alternative Transportation Fuels and Technologies, Washington, D.C., 2019.21
9. Kuhl, N., M. Goutier, A. Ensslen, and P. Jochem, Literature vs. Twitter: Empirical insights22on customer needs in e-mobility. Journal of Cleaner Production, Vol. 213, 2019, pp. 508–23520.24
10. Yin, W., K. Kann, M. Yu, and H. Schütze, Comparative study of CNN and RNN for natural25language processing. arXiv preprint arXiv:1702.01923, 2017.26
11. LeCun, Y., L. Bottou, Y. Bengio, P. Haffner, et al., Gradient-based learning applied to27document recognition. Proceedings of the IEEE, Vol. 86, No. 11, 1998, pp. 2278–2324.28
12. Elman, J. L., Finding structure in time. Cognitive science, Vol. 14, No. 2, 1990, pp. 179–29211.30
13. Ma, S. C., Y. Fan, J. F. Guo, J. H. Xu, and J. Zhu, Analysing online behaviour to determine31Chinese consumers’ preferences for electric vehicles. Journal of Cleaner Production, Vol.32229, 2019, pp. 244–255.33
14. Asensio, O. I., K. Alvarez, A. Dror, E. Wenzel, C. Hollauer, and S. Ha, Evaluating popular34sentiment of electric vehicle owners in the United States with real-time data from mobile35platforms. Working paper, 2019.36
15. Shepperd, M., D. Bowes, and T. Hall, Researcher bias: The use of machine learning in37software defect prediction. IEEE Transactions on Software Engineering, Vol. 40, No. 6,382014, pp. 603–616.39
16. Zadrozny, B., Learning and evaluating classifiers under sample selection bias. In Proceed-40ings of the twenty-first international conference on Machine learning, ACM, 2004, p. 114.41
17. Dwork, C., V. Feldman, M. Hardt, T. Pitassi, O. Reingold, and A. L. Roth, Preserving42statistical validity in adaptive data analysis. In Proceedings of the forty-seventh annual43ACM symposium on Theory of computing, ACM, 2015, pp. 117–126.44
Ha, Marchetto, Burke and Asensio 17
18. Fleiss, J. L., Measuring nominal scale agreement among many raters. Psychological bul-1letin, Vol. 76, No. 5, 1971, p. 378.2
19. Landis, J. R. and G. G. Koch, The Measurement of Observer Agreement for Categorical3Data. Biometrics, Vol. 33, No. 1, 1977, pp. 159–174.4
20. Kim, Y., Convolutional Neural Networks for Sentence Classification. arXiv:1408.58825[cs], 2014, arXiv: 1408.5882.6
21. Kalchbrenner, N., E. Grefenstette, and P. Blunsom, A convolutional neural network for7modelling sentences. arXiv preprint arXiv:1404.2188, 2014.8
22. Johnson, R. and T. Zhang, Effective Use of Word Order for Text Categorization with Con-9volutional Neural Networks. arXiv:1412.1058 [cs, stat], 2014, arXiv: 1412.1058.10
23. Mikolov, T., I. Sutskever, K. Chen, G. S. Corrado, and J. Dean, Distributed Representa-11tions of Words and Phrases and their Compositionality. In Advances in Neural Information12Processing Systems 26 (C. J. C. Burges, L. Bottou, M. Welling, Z. Ghahramani, and K. Q.13Weinberger, eds.), Curran Associates, Inc., 2013, pp. 3111–3119.14
24. Pennington, J., R. Socher, and C. Manning, Glove: Global Vectors for Word Representa-15tion. In Proceedings of the 2014 Conference on Empirical Methods in Natural Language16Processing (EMNLP), Association for Computational Linguistics, Doha, Qatar, 2014, pp.171532–1543.18
25. Iyyer, M., J. Boyd-Graber, L. Claudino, R. Socher, and H. Daumé III, A Neural Network19for Factoid Question Answering over Paragraphs. In Proceedings of the 2014 Conference20on Empirical Methods in Natural Language Processing (EMNLP), Association for Com-21putational Linguistics, Doha, Qatar, 2014, pp. 633–644.22
26. Zhang, Y. and B. Wallace, A Sensitivity Analysis of (and Practitioners’ Guide to) Con-23volutional Neural Networks for Sentence Classification. In Proceedings of the Eighth In-24ternational Joint Conference on Natural Language Processing (Volume 1: Long Papers),25Asian Federation of Natural Language Processing, Taipei, Taiwan, 2017, pp. 253–263.26
27. Ramalho, E. A., J. J. Ramalho, and J. M. Murteira, Alternative estimating and testing em-27pirical strategies for fractional regression models. Journal of Economic Surveys, Vol. 25,28No. 1, 2011, pp. 19–68.29
28. Papke, L. E. and J. M. Wooldridge, Econometric methods for fractional response variables30with an application to 401 (k) plan participation rates. Journal of applied econometrics,31Vol. 11, No. 6, 1996, pp. 619–632.32
29. Papke, L. E. and J. M. Wooldridge, Panel data methods for fractional response variables33with an application to test pass rates. Journal of Econometrics, Vol. 145, No. 1-2, 2008,34pp. 121–133.35
30. US Census, 2010 Urban Area FAQS, 2010.3631. Gwet, K. L., Handbook of inter-rater reliability: the definitive guide to measuring the37
extent of agreement among raters ; [a handbook for researchers, practitioners, teachers &38students]. Advanced Analytics, Gaithersburg, MD, 3rd ed., 2012.39
32. Bobicev, V. and M. Sokolova, Inter-Annotator Agreement in Sentiment Analysis: Machine40Learning Perspective. In RANLP, 2017, pp. 97–102.41