Embed Size (px)
Citation preview
Detecting ASIC Miners in Zcash(draft v1.1)
Alex Biryukov, Daniel FeherUniversity of Luxembourg
June 6, 2018
1 IntroductionOn May 3 the ASIC manufacturer Bitmain announcedan ASIC miner for Equihash (and another company,ASICminer as well, on May 10). Bitmain is one of thebiggest ASIC provider companies in the world, while alsohaving large shares in mining power in Bitcoin, and otherlarge cryptocurrencies. These announcements raise thequestion when did these companies develop an ASIC, didthey launch and test it on Equihash-based cryptocurren-cies before the announcement. Are ASIC miners presentin the current Zcash mining ecosystem and if yes, to whatextent. By italics we marked items for which we wouldappreciate feedback from the community.
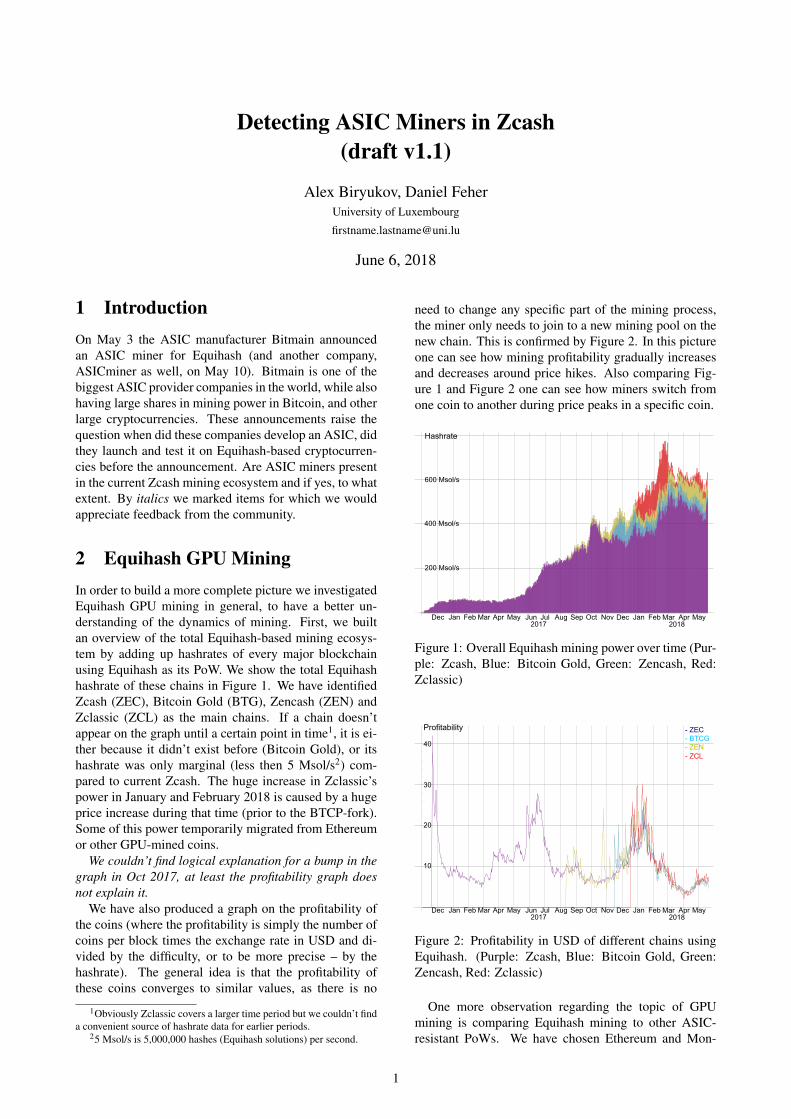
2 Equihash GPU MiningIn order to build a more complete picture we investigatedEquihash GPU mining in general, to have a better un-derstanding of the dynamics of mining. First, we builtan overview of the total Equihash-based mining ecosys-tem by adding up hashrates of every major blockchainusing Equihash as its PoW. We show the total Equihashhashrate of these chains in Figure 1. We have identifiedZcash (ZEC), Bitcoin Gold (BTG), Zencash (ZEN) andZclassic (ZCL) as the main chains. If a chain doesn’tappear on the graph until a certain point in time1, it is ei-ther because it didn’t exist before (Bitcoin Gold), or itshashrate was only marginal (less then 5 Msol/s2) com-pared to current Zcash. The huge increase in Zclassic’spower in January and February 2018 is caused by a hugeprice increase during that time (prior to the BTCP-fork).Some of this power temporarily migrated from Ethereumor other GPU-mined coins.
We couldn’t find logical explanation for a bump in thegraph in Oct 2017, at least the profitability graph doesnot explain it.
We have also produced a graph on the profitability ofthe coins (where the profitability is simply the number ofcoins per block times the exchange rate in USD and di-vided by the difficulty, or to be more precise – by thehashrate). The general idea is that the profitability ofthese coins converges to similar values, as there is no
1Obviously Zclassic covers a larger time period but we couldn’t finda convenient source of hashrate data for earlier periods.
25 Msol/s is 5,000,000 hashes (Equihash solutions) per second.
need to change any specific part of the mining process,the miner only needs to join to a new mining pool on thenew chain. This is confirmed by Figure 2. In this pictureone can see how mining profitability gradually increasesand decreases around price hikes. Also comparing Fig-ure 1 and Figure 2 one can see how miners switch fromone coin to another during price peaks in a specific coin.
0
Dec Mar Jun Jul OctJan Feb Apr May Aug Sep Nov MarDec Jan AprFeb May2017 2018
400 Msol/s
200 Msol/s
600 Msol/s
Hashrate
Figure 1: Overall Equihash mining power over time (Pur-ple: Zcash, Blue: Bitcoin Gold, Green: Zencash, Red:Zclassic)
Dec Mar Jun Jul OctJan Feb Apr May Aug Sep Nov MarDec Jan AprFeb May2017 2018
10
20
30
40
Profitability - ZEC- BTCG- ZEN- ZCL
Figure 2: Profitability in USD of different chains usingEquihash. (Purple: Zcash, Blue: Bitcoin Gold, Green:Zencash, Red: Zclassic)
One more observation regarding the topic of GPUmining is comparing Equihash mining to other ASIC-resistant PoWs. We have chosen Ethereum and Mon-
1
ero3, as they are among the largest GPU mined coins. Wecompare the hashrate of these Blockchains in Figure 3 byconverting all rates into sol/s. This is done by comparingthe mining capabilities of the same GPUs on the differ-ent PoWs. The interesting observation in this graph is,that even when there is a large peak in Equihash mining,compared to the sum there is no visible difference. Thisis possibly caused by miner migration from Ethereummining to Equihash mining for better profitability duringthose spikes.
Dec Mar Jun Jul OctJan Feb Apr May Aug Sep Nov MarDec Jan AprFeb May2017 2018
1000 Msol/s
2000 Msol/s
3000 Msol/s
4000 Msol/s
Hashrate
Figure 3: Estimate of overall power of GPU-minedblockchains (Purple: Zcash, Dark Blue: ZenCash, LightBlue: Bitcoin Gold, Green: Zclassic, Orange: Monero,Yellow: Ethereum)
3 Fraction of large miners in themining power
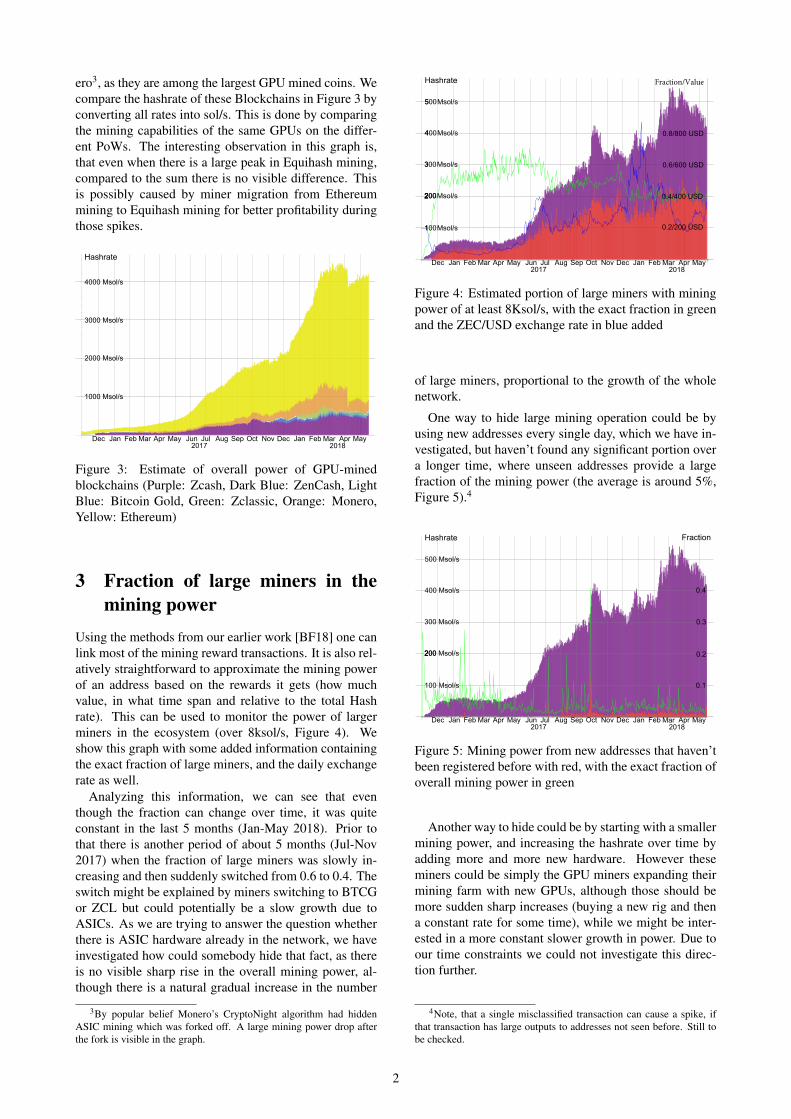
Using the methods from our earlier work [BF18] one canlink most of the mining reward transactions. It is also rel-atively straightforward to approximate the mining powerof an address based on the rewards it gets (how muchvalue, in what time span and relative to the total Hashrate). This can be used to monitor the power of largerminers in the ecosystem (over 8ksol/s, Figure 4). Weshow this graph with some added information containingthe exact fraction of large miners, and the daily exchangerate as well.
Analyzing this information, we can see that eventhough the fraction can change over time, it was quiteconstant in the last 5 months (Jan-May 2018). Prior tothat there is another period of about 5 months (Jul-Nov2017) when the fraction of large miners was slowly in-creasing and then suddenly switched from 0.6 to 0.4. Theswitch might be explained by miners switching to BTCGor ZCL but could potentially be a slow growth due toASICs. As we are trying to answer the question whetherthere is ASIC hardware already in the network, we haveinvestigated how could somebody hide that fact, as thereis no visible sharp rise in the overall mining power, al-though there is a natural gradual increase in the number
3By popular belief Monero’s CryptoNight algorithm had hiddenASIC mining which was forked off. A large mining power drop afterthe fork is visible in the graph.
Dec Mar Jun Jul OctJan Feb Apr May Aug Sep Nov MarDec Jan AprFeb May2017 2018
Fraction/ValueHashrate
22002002
3003
4004
5005
1001
Msol/s
Msol/s
Msol/s
Msol/s
Msol/s 0.2/200 USD
0.4/400 USD
0.6/600 USD
0.8/800 USD
Figure 4: Estimated portion of large miners with miningpower of at least 8Ksol/s, with the exact fraction in greenand the ZEC/USD exchange rate in blue added
of large miners, proportional to the growth of the wholenetwork.
One way to hide large mining operation could be byusing new addresses every single day, which we have in-vestigated, but haven’t found any significant portion overa longer time, where unseen addresses provide a largefraction of the mining power (the average is around 5%,Figure 5).4
Dec Mar Jun Jul OctJan Feb Apr May Aug Sep Nov MarDec Jan AprFeb May2017 2018
200 Msol/s
300 Msol/s
400 Msol/s
500 Msol/s
Hashrate
2002
100 Msol/s
Fraction
0.4
0.3
0.2
0.1
Figure 5: Mining power from new addresses that haven’tbeen registered before with red, with the exact fraction ofoverall mining power in green
Another way to hide could be by starting with a smallermining power, and increasing the hashrate over time byadding more and more new hardware. However theseminers could be simply the GPU miners expanding theirmining farm with new GPUs, although those should bemore sudden sharp increases (buying a new rig and thena constant rate for some time), while we might be inter-ested in a more constant slower growth in power. Due toour time constraints we could not investigate this direc-tion further.
4Note, that a single misclassified transaction can cause a spike, ifthat transaction has large outputs to addresses not seen before. Still tobe checked.
2
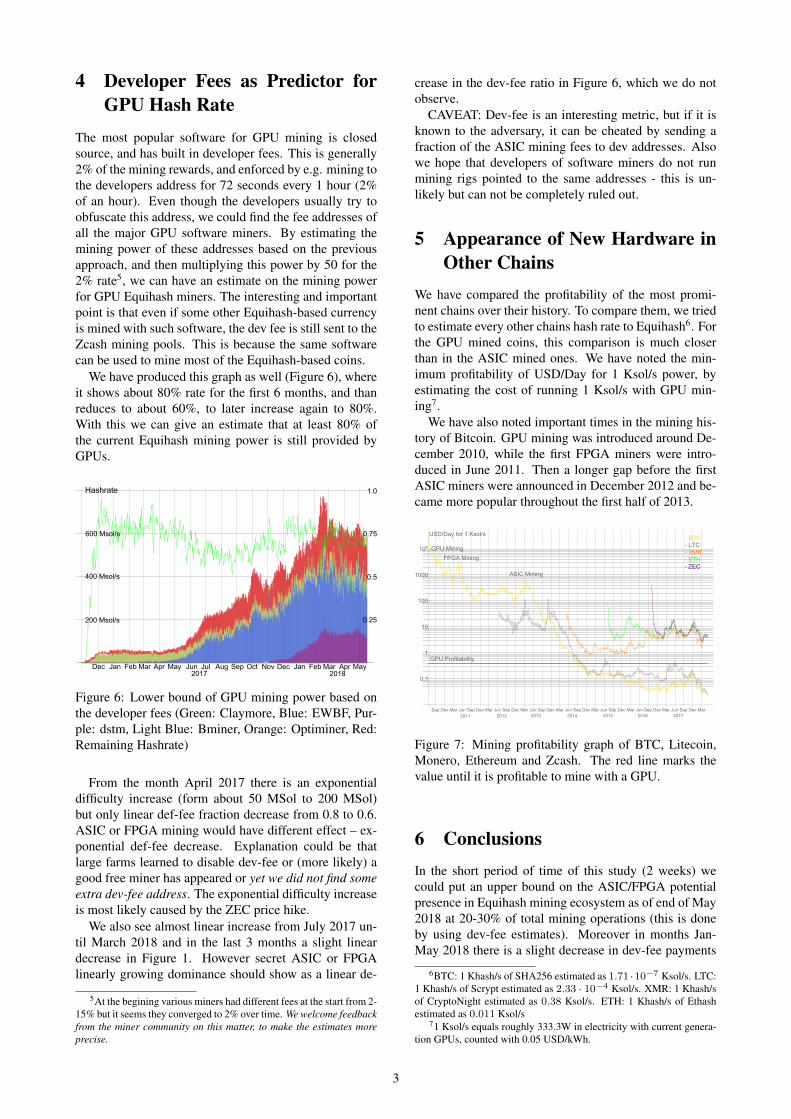
4 Developer Fees as Predictor forGPU Hash Rate
The most popular software for GPU mining is closedsource, and has built in developer fees. This is generally2% of the mining rewards, and enforced by e.g. mining tothe developers address for 72 seconds every 1 hour (2%of an hour). Even though the developers usually try toobfuscate this address, we could find the fee addresses ofall the major GPU software miners. By estimating themining power of these addresses based on the previousapproach, and then multiplying this power by 50 for the2% rate5, we can have an estimate on the mining powerfor GPU Equihash miners. The interesting and importantpoint is that even if some other Equihash-based currencyis mined with such software, the dev fee is still sent to theZcash mining pools. This is because the same softwarecan be used to mine most of the Equihash-based coins.
We have produced this graph as well (Figure 6), whereit shows about 80% rate for the first 6 months, and thanreduces to about 60%, to later increase again to 80%.With this we can give an estimate that at least 80% ofthe current Equihash mining power is still provided byGPUs.
Dec Mar Jun Jul OctJan Feb Apr May Aug Sep Nov Dec Jan AprFeb May2017
Mar2018
400 Msol/s
200 Msol/s
600 Msol/s
Hashrate 1.0
0.75
0.5
0.25
Figure 6: Lower bound of GPU mining power based onthe developer fees (Green: Claymore, Blue: EWBF, Pur-ple: dstm, Light Blue: Bminer, Orange: Optiminer, Red:Remaining Hashrate)
From the month April 2017 there is an exponentialdifficulty increase (form about 50 MSol to 200 MSol)but only linear def-fee fraction decrease from 0.8 to 0.6.ASIC or FPGA mining would have different effect – ex-ponential def-fee decrease. Explanation could be thatlarge farms learned to disable dev-fee or (more likely) agood free miner has appeared or yet we did not find someextra dev-fee address. The exponential difficulty increaseis most likely caused by the ZEC price hike.
We also see almost linear increase from July 2017 un-til March 2018 and in the last 3 months a slight lineardecrease in Figure 1. However secret ASIC or FPGAlinearly growing dominance should show as a linear de-
5At the begining various miners had different fees at the start from 2-15% but it seems they converged to 2% over time. We welcome feedbackfrom the miner community on this matter, to make the estimates moreprecise.
crease in the dev-fee ratio in Figure 6, which we do notobserve.
CAVEAT: Dev-fee is an interesting metric, but if it isknown to the adversary, it can be cheated by sending afraction of the ASIC mining fees to dev addresses. Alsowe hope that developers of software miners do not runmining rigs pointed to the same addresses - this is un-likely but can not be completely ruled out.
5 Appearance of New Hardware inOther Chains
We have compared the profitability of the most promi-nent chains over their history. To compare them, we triedto estimate every other chains hash rate to Equihash6. Forthe GPU mined coins, this comparison is much closerthan in the ASIC mined ones. We have noted the min-imum profitability of USD/Day for 1 Ksol/s power, byestimating the cost of running 1 Ksol/s with GPU min-ing7.
We have also noted important times in the mining his-tory of Bitcoin. GPU mining was introduced around De-cember 2010, while the first FPGA miners were intro-duced in June 2011. Then a longer gap before the firstASIC miners were announced in December 2012 and be-came more popular throughout the first half of 2013.
Sep Dec Mar Jun Sep Dec Mar Jun Sep Dec Mar Jun Sep Dec Mar Jun Sep Dec Mar Jun Sep Dec Mar Jun Sep Dec Mar Jun Sep Dec Mar2011 2012 2013 2014 2015 2016 2017
USD/Day for 1 Ksol/s
0.1
1
10
100
1000
104
- BTC- LTC- XMR- ETH- ZEC
GPU MiningFPGA Mining
ASIC Mining
GPU Profitability
Figure 7: Mining profitability graph of BTC, Litecoin,Monero, Ethereum and Zcash. The red line marks thevalue until it is profitable to mine with a GPU.
6 ConclusionsIn the short period of time of this study (2 weeks) wecould put an upper bound on the ASIC/FPGA potentialpresence in Equihash mining ecosystem as of end of May2018 at 20-30% of total mining operations (this is doneby using dev-fee estimates). Moreover in months Jan-May 2018 there is a slight decrease in dev-fee payments
6BTC: 1 Khash/s of SHA256 estimated as 1.71 ·10−7 Ksol/s. LTC:1 Khash/s of Scrypt estimated as 2.33 · 10−4 Ksol/s. XMR: 1 Khash/sof CryptoNight estimated as 0.38 Ksol/s. ETH: 1 Khash/s of Ethashestimated as 0.011 Ksol/s
71 Ksol/s equals roughly 333.3W in electricity with current genera-tion GPUs, counted with 0.05 USD/kWh.
3
of about 10% which could be due to ASIC/FPGA miningbut it could have some other explanation as well.
Most of the mining power (95%) is concentrated inpools so any large hidden ASIC/FPGA operation shouldbe present in one or several of the pools, moreover fourpools concentrate 87.5% of the total mining power.
Nearly constant fraction of ≥ 8KSol miners over thelast year also might indicate little or no ASIC mining sofar. In appendix A we also comment on the the recent51% attack on Bitcoin Gold.
It is important to note that our current methods can be”fooled” by careful ASIC miner and the methods are alsonot fine-grained enough to detect ASIC miner testing offew % of the total hash-rate. This is a work for furtherresearch.
7 AcknowledgementThis work was partially funded with the grant from theZcash foundation.
References[BF18] Alex Biryukov and Daniel Feher. Deanonymiza-
tion of hidden transactions in zcash.https://cryptolux.org/images/d/d9/Zcash.pdf, 2018.
[Nic18] Nicehashable. PoW 51% Attack Cost. https://www.crypto51.app/, 2018.
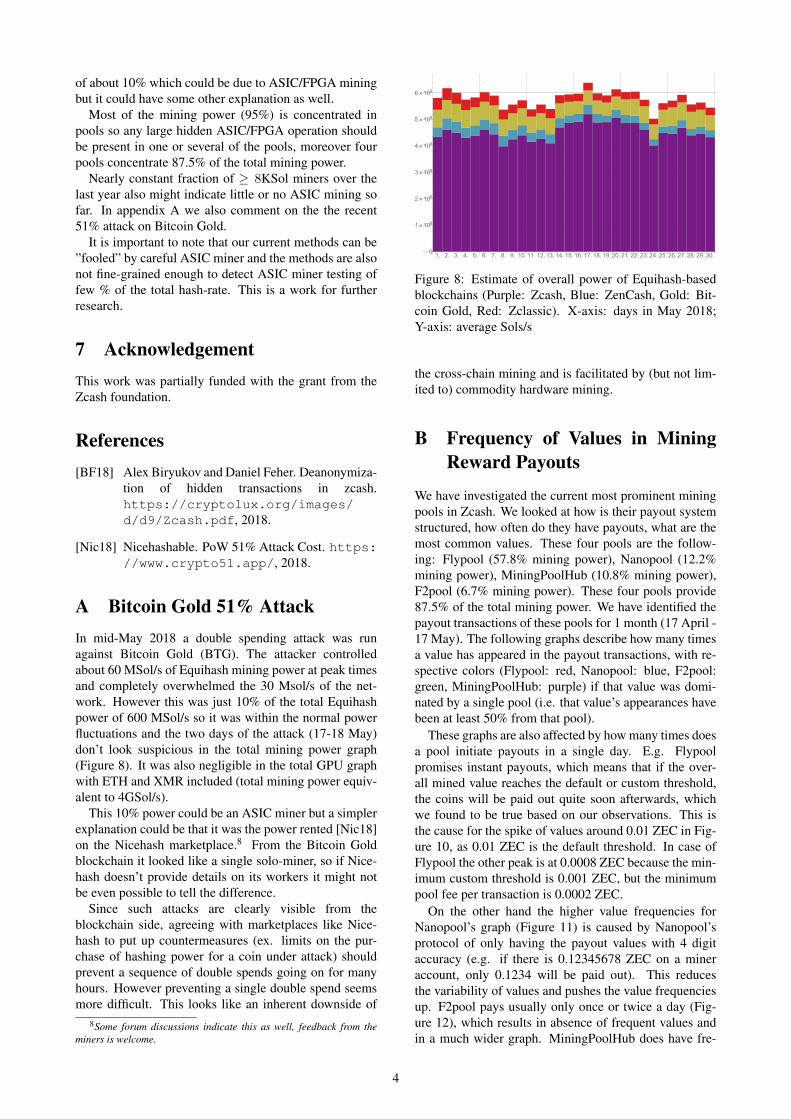
A Bitcoin Gold 51% AttackIn mid-May 2018 a double spending attack was runagainst Bitcoin Gold (BTG). The attacker controlledabout 60 MSol/s of Equihash mining power at peak timesand completely overwhelmed the 30 Msol/s of the net-work. However this was just 10% of the total Equihashpower of 600 MSol/s so it was within the normal powerfluctuations and the two days of the attack (17-18 May)don’t look suspicious in the total mining power graph(Figure 8). It was also negligible in the total GPU graphwith ETH and XMR included (total mining power equiv-alent to 4GSol/s).
This 10% power could be an ASIC miner but a simplerexplanation could be that it was the power rented [Nic18]on the Nicehash marketplace.8 From the Bitcoin Goldblockchain it looked like a single solo-miner, so if Nice-hash doesn’t provide details on its workers it might notbe even possible to tell the difference.
Since such attacks are clearly visible from theblockchain side, agreeing with marketplaces like Nice-hash to put up countermeasures (ex. limits on the pur-chase of hashing power for a coin under attack) shouldprevent a sequence of double spends going on for manyhours. However preventing a single double spend seemsmore difficult. This looks like an inherent downside of
8Some forum discussions indicate this as well, feedback from theminers is welcome.
1. 2. 3. 4. 5. 6. 7. 8. 9. 10. 11. 12. 13. 14. 15. 16. 17. 18. 19. 20. 21. 22. 23. 24. 25. 26. 27. 28. 29. 30.0
1×10⁸
2×10⁸
3×10⁸
4×10⁸
5×10⁸
6×10⁸
Figure 8: Estimate of overall power of Equihash-basedblockchains (Purple: Zcash, Blue: ZenCash, Gold: Bit-coin Gold, Red: Zclassic). X-axis: days in May 2018;Y-axis: average Sols/s
the cross-chain mining and is facilitated by (but not lim-ited to) commodity hardware mining.
B Frequency of Values in MiningReward Payouts
We have investigated the current most prominent miningpools in Zcash. We looked at how is their payout systemstructured, how often do they have payouts, what are themost common values. These four pools are the follow-ing: Flypool (57.8% mining power), Nanopool (12.2%mining power), MiningPoolHub (10.8% mining power),F2pool (6.7% mining power). These four pools provide87.5% of the total mining power. We have identified thepayout transactions of these pools for 1 month (17 April -17 May). The following graphs describe how many timesa value has appeared in the payout transactions, with re-spective colors (Flypool: red, Nanopool: blue, F2pool:green, MiningPoolHub: purple) if that value was domi-nated by a single pool (i.e. that value’s appearances havebeen at least 50% from that pool).
These graphs are also affected by how many times doesa pool initiate payouts in a single day. E.g. Flypoolpromises instant payouts, which means that if the over-all mined value reaches the default or custom threshold,the coins will be paid out quite soon afterwards, whichwe found to be true based on our observations. This isthe cause for the spike of values around 0.01 ZEC in Fig-ure 10, as 0.01 ZEC is the default threshold. In case ofFlypool the other peak is at 0.0008 ZEC because the min-imum custom threshold is 0.001 ZEC, but the minimumpool fee per transaction is 0.0002 ZEC.
On the other hand the higher value frequencies forNanopool’s graph (Figure 11) is caused by Nanopool’sprotocol of only having the payout values with 4 digitaccuracy (e.g. if there is 0.12345678 ZEC on a mineraccount, only 0.1234 will be paid out). This reducesthe variability of values and pushes the value frequenciesup. F2pool pays usually only once or twice a day (Fig-ure 12), which results in absence of frequent values andin a much wider graph. MiningPoolHub does have fre-
4
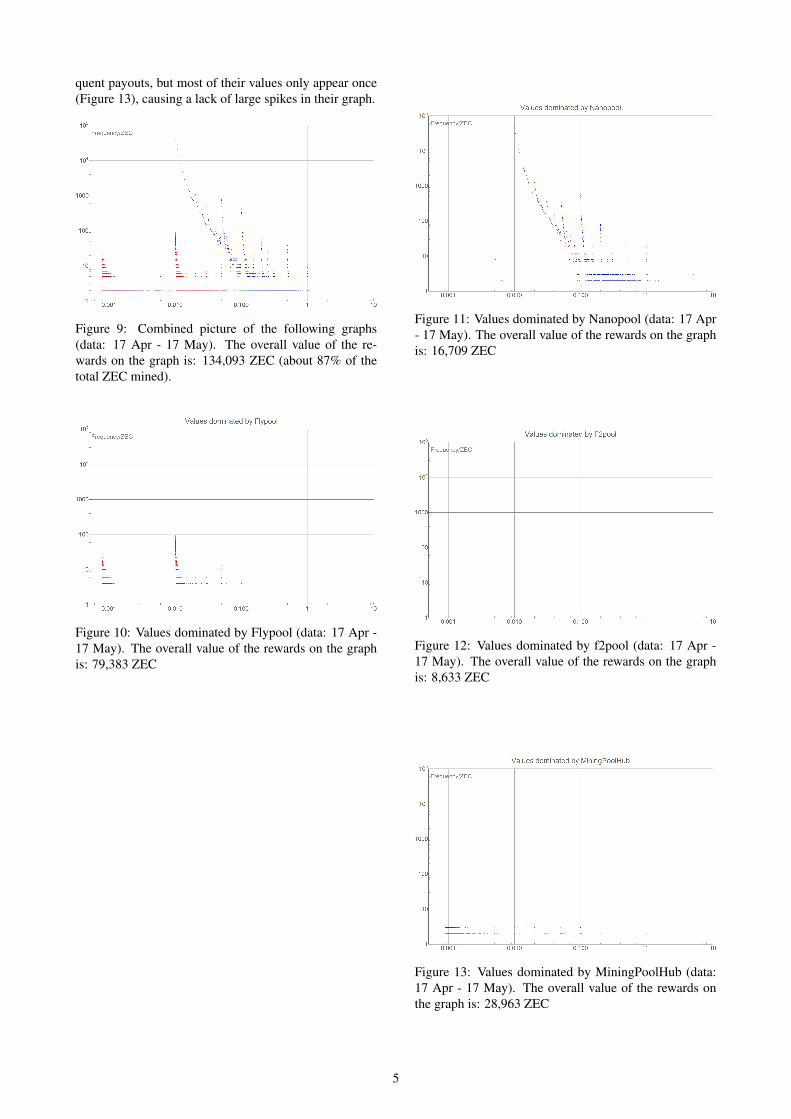
quent payouts, but most of their values only appear once(Figure 13), causing a lack of large spikes in their graph.
Figure 9: Combined picture of the following graphs(data: 17 Apr - 17 May). The overall value of the re-wards on the graph is: 134,093 ZEC (about 87% of thetotal ZEC mined).
Figure 10: Values dominated by Flypool (data: 17 Apr -17 May). The overall value of the rewards on the graphis: 79,383 ZEC
Figure 11: Values dominated by Nanopool (data: 17 Apr- 17 May). The overall value of the rewards on the graphis: 16,709 ZEC
Figure 12: Values dominated by f2pool (data: 17 Apr -17 May). The overall value of the rewards on the graphis: 8,633 ZEC
Figure 13: Values dominated by MiningPoolHub (data:17 Apr - 17 May). The overall value of the rewards onthe graph is: 28,963 ZEC
5