Embed Size (px)
Citation preview
Empir Software EngDOI 10.1007/s10664-013-9296-2
Detecting and refactoring code smells in spreadsheetformulas
Felienne Hermans ·Martin Pinzger ·Arie van Deursen
© Springer Science+Business Media New York 2014
Abstract Spreadsheets are used extensively in business processes around the world and justlike software, spreadsheets are changed throughout their lifetime causing understandabilityand maintainability issues. This paper adapts known code smells to spreadsheet formulas. Tothat end we present a list of metrics by which we can detect smelly formulas; a visualizationtechnique to highlight these formulas in spreadsheets and a method to automatically suggestrefactorings to resolve smells. We implemented the metrics, visualization and refactoringsuggestions techniques in a prototype tool and evaluated our approach in three studies.Firstly, we analyze the EUSES spreadsheet corpus, to study the occurrence of the formulasmells. Secondly, we analyze ten real life spreadsheets, and interview the spreadsheet own-ers about the identified smells. Finally, we generate refactoring suggestions for those tenspreadsheets and study the implications. The results of these evaluations indicate that for-mula smells are common, that they can reveal real errors and weaknesses in spreadsheetformulas and that in simple cases they can be refactored.
Keywords Spreadsheets · Code smells · Refactoring
1 Introduction
The use of spreadsheets is very common in industry, Winston (2001) estimates that 90 % ofall analysts in industry perform calculations in spreadsheets. Spreadsheet developers are infact end-user programmers that are usually not formally trained software engineers. There
Communicated by: Massimiliano Di Penta and Jonathan Maletic
F. Hermans (�) · M. Pinzger · A. van DeursenDelft University of Technology, Mekelweg 4, 2628 CD Delft, The Netherlandse-mail: [email protected]
M. Pinzgere-mail: [email protected]
A. van Deursene-mail: [email protected]
Empir Software Eng
are many of those end-user programmers, more than there are traditional programmers, andthe artifacts they create can be just as important to an organization as regular software.Technically, spreadsheets also have similarities to software. One could view spreadsheetformulas as little pieces of source code, since both consist of constants, variables, condi-tional statements and references to other parts of the software. It therefore seems viable toinvestigate what principles from software engineering are also applicable to spreadsheets.
In previous work (Hermans et al. 2012a) we have defined code smells between work-sheets, such as high coupling between worksheets and middle men worksheets. Theevaluation of those smells showed that they can indeed reveal weak spots in a spreadsheet’sdesign. In this paper we follow that line of thought, but focus our attention on smells withinspreadsheet formulas. To that end we present a set of formula smells, based on Fowler’s codesmells. We subsequently define metrics for each of the formula smells, to enable the auto-matic detection of the smells. Our detection approach uses thresholds to divide the severityof each formula smell into low, moderate, and high. The thresholds are based on the anal-ysis of 4,233 spreadsheets from the EUSES corpus (Fisher and Rothermel 2005). Thereonwe address the issue of communicating the detected smells to spreadsheet users. We chooseto do this within the spreadsheet itself, with a spreadsheet risk map, a colored overlay onthe spreadsheet, indicating risk in the spreadsheet formulas. Finally we evaluate the catalogof smells in two ways, with a quantitative and qualitative evaluation. First, we perform aquantitative evaluation on the EUSES spreadsheet corpus. Then, a qualitative analysis wasperformed with ten real life spreadsheets and their developers from industry. With these twostudies we aim to answer the three research questions
R1 What formula smells are most common, and why?R2 To what extent do formula smells expose threats to spreadsheet quality?R3 To what extent are risk maps an appropriate way to visualize formula smells?
This paper is an extension of our previous paper published in the proceedings of ICSM2012 (Hermans et al. 2012b). In comparison to the ICSM paper, this paper adds: anextended version of the discussion section (Section 13); a broader overview of related work(Section 14); a catalog of refactorings to resolve the formula smells (Section 4); a descrip-tion of an implementation that generates refactorings (Section 6.2) and a new exploratorystudy of the impact of refactoring smells. This additional study, found in Section 11, answersthe additional research question
R4 To what extent can formula smells be refactored by generated refactoring suggestions?
The aim of this extended version is to gain a more deeper understanding on how detectedsmells in spreadsheets can be refactored. The evaluations in the original ICSM paper showedthat formula smells can indeed reveal weaknesses and even find real mistakes in a spread-sheet. It furthermore showed that risk maps, although not yet perfect, are a good aid inlocating and understanding formula smells. Based on the additional evidence we presentin this paper, we conclude that many spreadsheet smells can be refactored; however, somesmells are in balance with each other and additional support is needed to help users find thesweet spot in that balance.
2 Formula Smells
In this section, we present our formula smells, which are based on the existing workin the field of source code smells. Smells in source code indicate suspicious pieces of
Empir Software Eng
code, that the developer might want to refactor to improve readability and minimize thechance of future errors. Formula smells are inspired by source code smells: they indi-cate formulas that are suspicious; not easy to read or error-prone. To create our catalogof formula smells, we looked at all inter-class code smells defined by Fowler (1999) andremoved those code smells that are specific to source code, like the Temporary Field smell.This left us with the following list of formula smells. Note that in other work (Hermanset al. 2012a), we studied code smells between worksheets, based on code smells betweenclasses.
2.1 Multiple Operations
One of the most well-known code smells is the Long Method. Inspired by this code smell,we define the formula smell Multiple Operations. Analogous to a long method, a formulawith many operations will likely be harder to understand than a shorter one. Especiallysince in most spreadsheet programs, there is limited space to view a formula, causing longformulas to be cut off.
2.2 Multiple References
Another code smell that we use as a basis is the Many Parameters code smell. A methodthat uses many input values might be split into multiple methods to improve readability.The formula equivalent of this smell occurs when a formula references many different othercells, like SUM(A1:A5;B7;C18;C19;F19). In this case the essence of the formula is clear;some cells are summed. However locating the different cells that are contained in the sumcan be challenging.
2.3 Conditional Complexity
Fowler states that the nesting of many conditional operations should be considered a threatto code readability, since conditionals are hard to read. Since spreadsheet systems alsoallow for the use of conditionals, spreadsheet formulas are at risk of this treat too. Wehence consider a formula with many conditional operations as smelly, like the formulaIF(A3=1,IF(A4=1,IF(A5<34700,50)),0). Because this formula contains many conditionalbranches, it is quite hard to read.
2.4 Long Calculation Chain
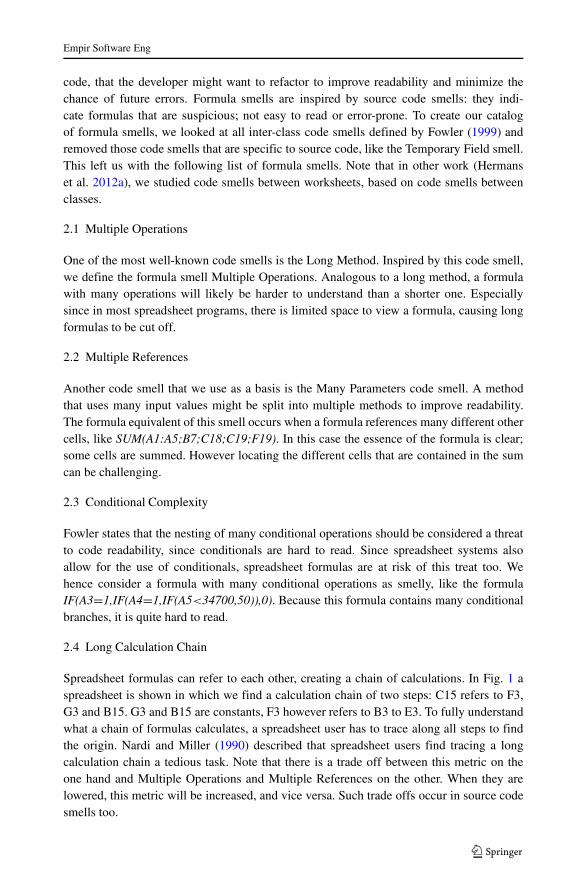
Spreadsheet formulas can refer to each other, creating a chain of calculations. In Fig. 1 aspreadsheet is shown in which we find a calculation chain of two steps: C15 refers to F3,G3 and B15. G3 and B15 are constants, F3 however refers to B3 to E3. To fully understandwhat a chain of formulas calculates, a spreadsheet user has to trace along all steps to findthe origin. Nardi and Miller (1990) described that spreadsheet users find tracing a longcalculation chain a tedious task. Note that there is a trade off between this metric on theone hand and Multiple Operations and Multiple References on the other. When they arelowered, this metric will be increased, and vice versa. Such trade offs occur in source codesmells too.
Empir Software Eng
Fig. 1 A spreadsheet containing a calculation chain of two steps
2.5 Duplicated Formulas
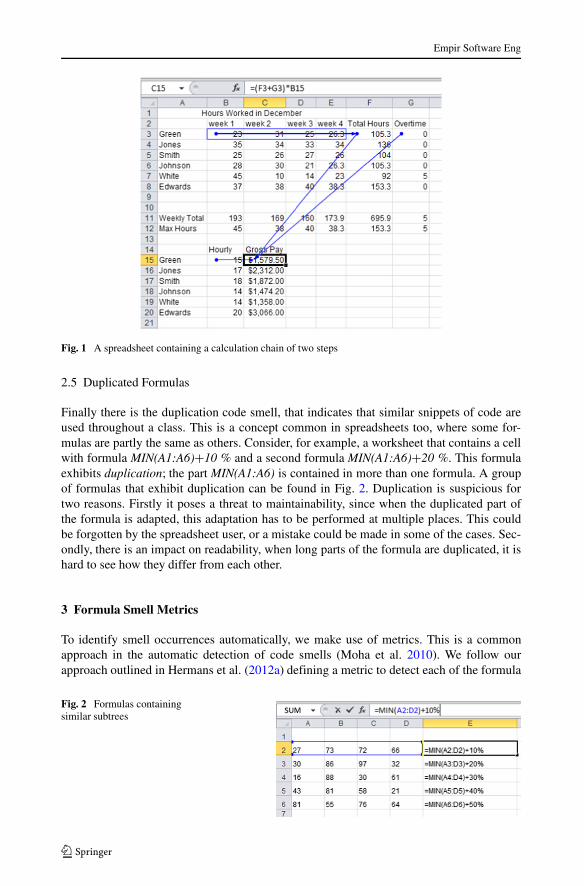
Finally there is the duplication code smell, that indicates that similar snippets of code areused throughout a class. This is a concept common in spreadsheets too, where some for-mulas are partly the same as others. Consider, for example, a worksheet that contains a cellwith formula MIN(A1:A6)+10 % and a second formula MIN(A1:A6)+20 %. This formulaexhibits duplication; the part MIN(A1:A6) is contained in more than one formula. A groupof formulas that exhibit duplication can be found in Fig. 2. Duplication is suspicious fortwo reasons. Firstly it poses a threat to maintainability, since when the duplicated part ofthe formula is adapted, this adaptation has to be performed at multiple places. This couldbe forgotten by the spreadsheet user, or a mistake could be made in some of the cases. Sec-ondly, there is an impact on readability, when long parts of the formula are duplicated, it ishard to see how they differ from each other.
3 Formula Smell Metrics
To identify smell occurrences automatically, we make use of metrics. This is a commonapproach in the automatic detection of code smells (Moha et al. 2010). We follow ourapproach outlined in Hermans et al. (2012a) defining a metric to detect each of the formula
Fig. 2 Formulas containingsimilar subtrees
Empir Software Eng
smells in spreadsheets. This method entails the definition of a metric for each of the smellsto indicate the presence of that particular smell.
Multiple Operations We measure the length of a formula in terms of the total number offunctions that the formula contains.
Multiple References This metric is counted in terms of the number of ranges a formula isreferring to. We use the number of ranges rather than the number of individual references,as in previous work we have found that formulas referring to multiple ranges are moredifficult for spreadsheet users to read (Hermans et al. 2012c).
Conditional Complexity is measured in terms of the number of conditionals containedby a formula.
Long Calculation Chain This metric is defined as the length of the longest path of cellsthat need to be dereferenced when computing the value of the formula.
Duplicated Formula For the localization of this smell more information about all formu-las in the spreadsheet is needed. Consider the spreadsheet in Fig. 2. All the formulas incolumn E calculate the minimum of the four cells left to it, followed by the addition of acertain percentage. We argue that in this case, duplication should be detected. However,looking at the formulas, they do not look similar. We therefore will use the relative R1C1notation when detecting duplication.
In the relative R1C1 notation, references to other cells are expressed relative to thecell containing the formula. MIN(A2:D2) in cell E2 is written as MIN(RC[-4]:RC[-1]) inrelative R1C1 notation. With this notation, all formulas in Fig. 2 contain the subformulaMIN(RC[-4]:RC[-1]), with different percentages. With this, we will measure the dupli-cate code smell as the number of formulas, located in the same worksheet and expressedin relative R1C1 notation, with which a formula shares at least one proper subtree. Weexclude the entire tree as subtree, since having the same R1C1 formula in an entire rowor column is the usual way of defining a formula in spreadsheets.
With our definition of smells, we focus at smells in the calculation design of the formulas.Therefore, other plausible smells, like the occurrence of magic numbers in formulas, are leftout of the scope of this paper.
4 Refactorings Corresponding to Smells
In this section, we will describe how the five formula smells can be refactored.
4.1 Multiple Operations
A refactoring corresponding to the Multiple Operations smell is the division of the multi-ple operations over different cells in the spreadsheet. This refactoring looks at argumentsof the root of the formula. Each argument of the root will be a new formula and the currentformula will reference those new formulas. We call this refactoring the Extract Subformularefactoring. An additional, supporting refactoring that can be performed is the Extract Com-mon Subformula refactoring. This refactoring can be applied if a formula contains the samesubformula multiple times.
Empir Software Eng
4.2 Multiple References
When a formula suffers from the Multiple References smell, there are several options torefactor. The simplest refactoring we can apply, is to restructure the cells a formula refer-ences into a lower number of ranges. This is possible when adjacent cells are referencedindividually, like in formula SUM(A1;A2;A3;A4; A5), this can be rewritten to SUM(A1:A5).We call this refactoring Group References.
Secondly, there is the option to relocate the cells in the spreadsheet. If a formula is refer-ring to multiple cells, like SUM(A1:A5;B7;C18;C19;F19), we could move the values in B7,C18, C19 and F19 to A6 until A10, and subsequently rewrite the formula as SUM(A1:A10).We call this refactoring the Move References refactoring. However, this is not always adesired option, as there might be other formulas referring to a subset of these cells. In thatcase, this refactoring will cause those formulas to start suffering from the Multiple Refer-ences smell. Finally, we could apply the Extract Subformula refactoring. This refactoring isalways applicable.
4.3 Conditional Complexity
To reduce the Conditional Complexity smell, in some cases we could combine multiplebranches of an IFformula into one. This is possible if multiple branches result in the samevalue. For instance, in the formula IF(A1=5,“OK”, IF(B1=7, “OK”, “NOT OK”)), twodifferent branches result in “OK”. These can be combined into one: IF(OR(A1=5,B1=7),“OK”, “NOT OK”). This formula might be easier to understand, as it only contains one IF.If this refactoring results in a too complex condition, this can be again refactored with theExtract Subformula refactoring. We call this refactoring the Merge Branches refactoring.
If the conditional formula contains similar subformulas, the Extract Common Subfor-mula is suggested. If that is not possible, the Extract Subformula can be applied, both onthe condition and on the branches.
4.4 Long Calculation Chain
This smell is most difficult to refactor, as there is a trade off between this metric andMultiple Operations and Multiple References. For this smell, we look whether there are cal-culation steps in the chain that do not occur in other chains. If this is the case, these twocalculation steps can be put into one formula. We call this refactoring the Merge Formu-las refactoring. This is the only refactoring in our catalog applicable to cells with the LongCalculation Chain smell.
4.5 Duplicated Formulas
The Duplicated Formula smell can be refactored by putting the shared subtrees in a separateformula and replacing the subtree with a reference to that formula. This is just a specialapplication of the Extract Subformula refactoring, in this case applied to a group of cells.In the example of Fig. 2 this would mean that column E becomes MIN(A2:D2). Then, incolumn E, all cells are R1C1 equal, whereas in column F we would get A2+10 %. This waythe common functionality is in one place (E) and the variable part has its own place (F). Ifsomething were to change in the refactored version of the spreadsheet (for instance, MINbecomes MAX), we can adapt cell E2 and let Excel change the entire column by double
Empir Software Eng
clicking the bottom right corner of the cell. In the original situation, that change wouldinvolve updating all cells separately.
5 Determining Smell Thresholds
In order to use metrics as smell indicators, we determine thresholds for each of the metrics.We do this by analyzing a large body of spreadsheets. Then, based on the values for themetrics we find in that body of spreadsheets, setting the thresholds for the metrics thatindicate the smell.
The body of spreadsheets we use is the EUSES Spreadsheet Corpus (Fisher andRothermel 2005). This corpus consists of 4,223 real life spreadsheets, from all sorts ofdomains, ranging from educational to financial, and from inventory to biology. It was cre-ated in 2005 and has since then been used by several researchers to evaluate spreadsheetalgorithms, for instance (Abraham and Erwig 2006; Cunha et al. 2009).
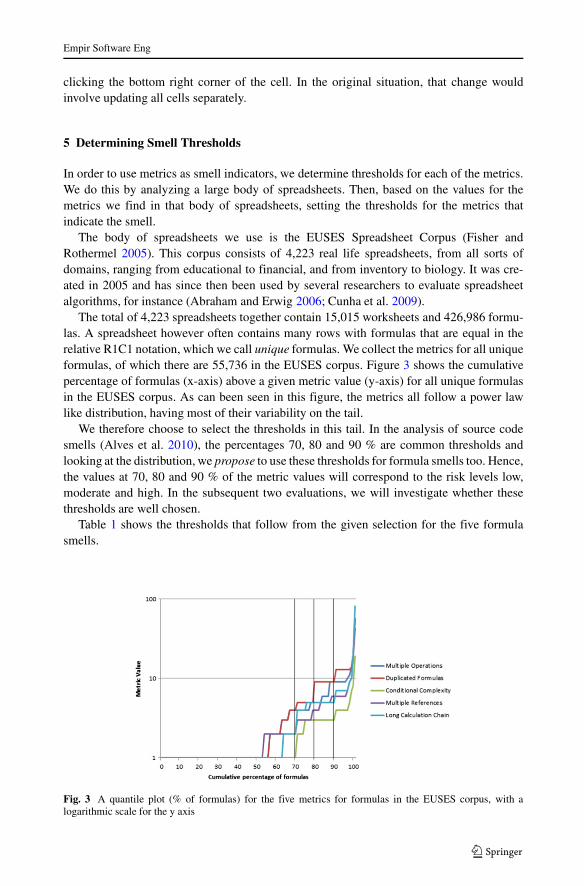
The total of 4,223 spreadsheets together contain 15,015 worksheets and 426,986 formu-las. A spreadsheet however often contains many rows with formulas that are equal in therelative R1C1 notation, which we call unique formulas. We collect the metrics for all uniqueformulas, of which there are 55,736 in the EUSES corpus. Figure 3 shows the cumulativepercentage of formulas (x-axis) above a given metric value (y-axis) for all unique formulasin the EUSES corpus. As can been seen in this figure, the metrics all follow a power lawlike distribution, having most of their variability on the tail.
We therefore choose to select the thresholds in this tail. In the analysis of source codesmells (Alves et al. 2010), the percentages 70, 80 and 90 % are common thresholds andlooking at the distribution, we propose to use these thresholds for formula smells too. Hence,the values at 70, 80 and 90 % of the metric values will correspond to the risk levels low,moderate and high. In the subsequent two evaluations, we will investigate whether thesethresholds are well chosen.
Table 1 shows the thresholds that follow from the given selection for the five formulasmells.
Fig. 3 A quantile plot (% of formulas) for the five metrics for formulas in the EUSES corpus, with alogarithmic scale for the y axis
Empir Software Eng
Table 1 Thresholds for themetrics that indicate the formulasmells
Smell 70 % 80 % 90 %
Multiple operations 4 5 9
Multiple references 3 4 6
Conditional complexity 2 3 4
Long calculation chain 4 5 7
Duplicated formulas 6 9 13
6 Risk Maps
Now we have established a method to detect the formula smells, this section will describe away to communicate the located smells and their corresponding refactorings to spreadsheetusers.
6.1 Smells
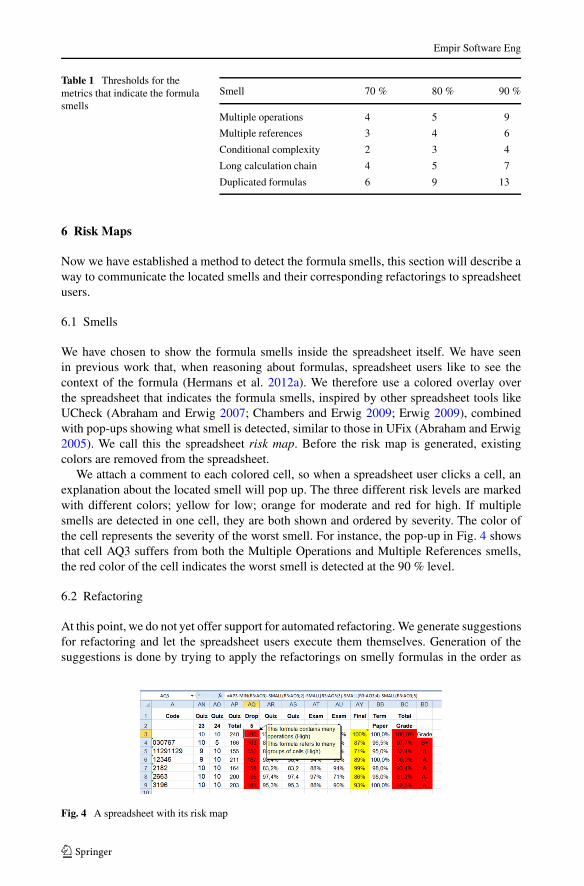
We have chosen to show the formula smells inside the spreadsheet itself. We have seenin previous work that, when reasoning about formulas, spreadsheet users like to see thecontext of the formula (Hermans et al. 2012a). We therefore use a colored overlay overthe spreadsheet that indicates the formula smells, inspired by other spreadsheet tools likeUCheck (Abraham and Erwig 2007; Chambers and Erwig 2009; Erwig 2009), combinedwith pop-ups showing what smell is detected, similar to those in UFix (Abraham and Erwig2005). We call this the spreadsheet risk map. Before the risk map is generated, existingcolors are removed from the spreadsheet.
We attach a comment to each colored cell, so when a spreadsheet user clicks a cell, anexplanation about the located smell will pop up. The three different risk levels are markedwith different colors; yellow for low; orange for moderate and red for high. If multiplesmells are detected in one cell, they are both shown and ordered by severity. The color ofthe cell represents the severity of the worst smell. For instance, the pop-up in Fig. 4 showsthat cell AQ3 suffers from both the Multiple Operations and Multiple References smells,the red color of the cell indicates the worst smell is detected at the 90 % level.
6.2 Refactoring
At this point, we do not yet offer support for automated refactoring. We generate suggestionsfor refactoring and let the spreadsheet users execute them themselves. Generation of thesuggestions is done by trying to apply the refactorings on smelly formulas in the order as
Fig. 4 A spreadsheet with its risk map
Empir Software Eng
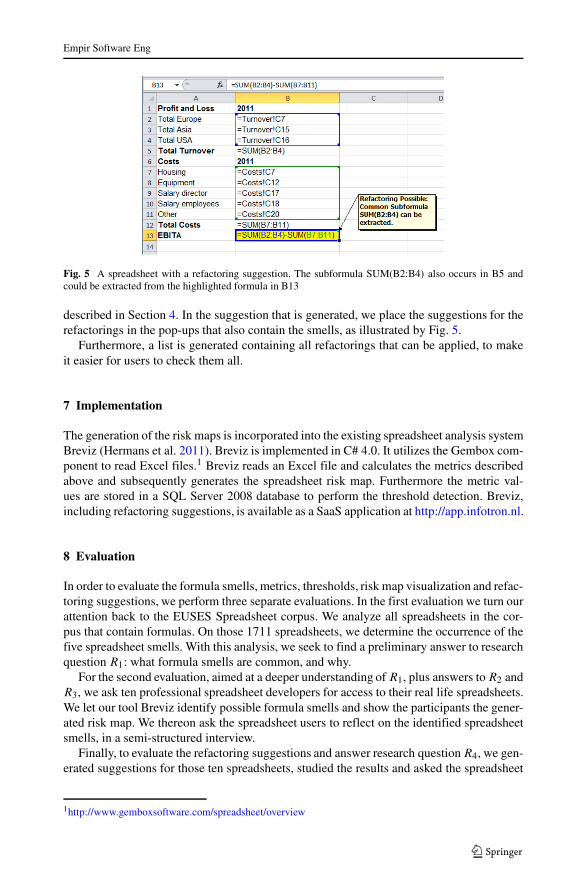
Fig. 5 A spreadsheet with a refactoring suggestion. The subformula SUM(B2:B4) also occurs in B5 andcould be extracted from the highlighted formula in B13
described in Section 4. In the suggestion that is generated, we place the suggestions for therefactorings in the pop-ups that also contain the smells, as illustrated by Fig. 5.
Furthermore, a list is generated containing all refactorings that can be applied, to makeit easier for users to check them all.
7 Implementation
The generation of the risk maps is incorporated into the existing spreadsheet analysis systemBreviz (Hermans et al. 2011). Breviz is implemented in C# 4.0. It utilizes the Gembox com-ponent to read Excel files.1 Breviz reads an Excel file and calculates the metrics describedabove and subsequently generates the spreadsheet risk map. Furthermore the metric val-ues are stored in a SQL Server 2008 database to perform the threshold detection. Breviz,including refactoring suggestions, is available as a SaaS application at http://app.infotron.nl.
8 Evaluation
In order to evaluate the formula smells, metrics, thresholds, risk map visualization and refac-toring suggestions, we perform three separate evaluations. In the first evaluation we turn ourattention back to the EUSES Spreadsheet corpus. We analyze all spreadsheets in the cor-pus that contain formulas. On those 1711 spreadsheets, we determine the occurrence of thefive spreadsheet smells. With this analysis, we seek to find a preliminary answer to researchquestion R1: what formula smells are common, and why.
For the second evaluation, aimed at a deeper understanding of R1, plus answers to R2 andR3, we ask ten professional spreadsheet developers for access to their real life spreadsheets.We let our tool Breviz identify possible formula smells and show the participants the gener-ated risk map. We thereon ask the spreadsheet users to reflect on the identified spreadsheetsmells, in a semi-structured interview.
Finally, to evaluate the refactoring suggestions and answer research question R4, we gen-erated suggestions for those ten spreadsheets, studied the results and asked the spreadsheet
1http://www.gemboxsoftware.com/spreadsheet/overview
Empir Software Eng
owners to comment on a number of selected refactorings. The following sections describethe three evaluations in more detail.
9 Smell Occurrences in the EUSES Corpus
9.1 Goal
The objective of the first study is to understand how common the five formula smells are,given the thresholds we have selected. While the thresholds were chosen such as percentagesof formulas containing a smell, here we are interested in the distribution of smelly formulasacross spreadsheets.
9.2 Setup
We use the Breviz tool to analyze those spreadsheets in the EUSES corpus that containformulas and check those 1711 spreadsheets for the presence of formula smells and theirseverity. Per spreadsheet the tool outputs the metric values for each of the five formulasmells. We use this data to analyze the distribution of the formula smells over the threemetric categories; above the 70, 80 and 90 % thresholds.
This evaluation tells us whether the choices we made for the thresholds are justified, asit gives us an initial idea of the distribution of the formula smells over the spreadsheets.
9.3 Results
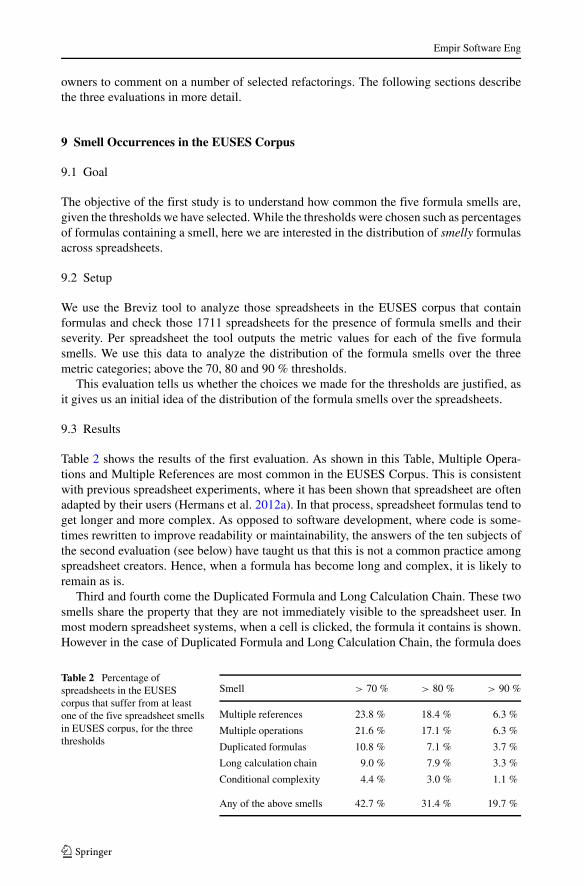
Table 2 shows the results of the first evaluation. As shown in this Table, Multiple Opera-tions and Multiple References are most common in the EUSES Corpus. This is consistentwith previous spreadsheet experiments, where it has been shown that spreadsheet are oftenadapted by their users (Hermans et al. 2012a). In that process, spreadsheet formulas tend toget longer and more complex. As opposed to software development, where code is some-times rewritten to improve readability or maintainability, the answers of the ten subjects ofthe second evaluation (see below) have taught us that this is not a common practice amongspreadsheet creators. Hence, when a formula has become long and complex, it is likely toremain as is.
Third and fourth come the Duplicated Formula and Long Calculation Chain. These twosmells share the property that they are not immediately visible to the spreadsheet user. Inmost modern spreadsheet systems, when a cell is clicked, the formula it contains is shown.However in the case of Duplicated Formula and Long Calculation Chain, the formula does
Table 2 Percentage ofspreadsheets in the EUSEScorpus that suffer from at leastone of the five spreadsheet smellsin EUSES corpus, for the threethresholds
Smell > 70 % > 80 % > 90 %
Multiple references 23.8 % 18.4 % 6.3 %
Multiple operations 21.6 % 17.1 % 6.3 %
Duplicated formulas 10.8 % 7.1 % 3.7 %
Long calculation chain 9.0 % 7.9 % 3.3 %
Conditional complexity 4.4 % 3.0 % 1.1 %
Any of the above smells 42.7 % 31.4 % 19.7 %
Empir Software Eng
not reveal where the calculation chain of the formula ends, and with what formulas a cellshares subtrees. So it is interesting to see that around 10 percent of spreadsheets suffer froma smell that is not visible to a spreadsheet user that is not explicitly looking for it.
Conditional Complexity is the least common smell. This is surprising, since we have seenbefore that conditional operations are quite common in spreadsheets. We therefore divedinto this phenomenon deeper. We found that of the total of 426,986 formulas in the corpus,5,976 contain at least one conditional operation, this is 1.4 % of all formulas. These formu-las are divided over 380 spreadsheets, which amounts to 22.2 % of the spreadsheets withformulas. We can hence state that the use of conditional operations is relatively common.
However, only 92 of the spreadsheets (5.3 %) contain formulas with more than 2 con-ditional operations in one formula, adding up to only 695 formulas (0.2 %). Evidently, thenesting of conditional formulas is not very common. We will hence devote attention to thisfact in the second evaluation.
Regarding the thresholds, given our current choices a substantial percentage of the corpussuffers from spreadsheet smells, especially in the low category. In the second case studywe will continue to investigate the thresholds, by observing how spreadsheet users fromindustry feel about formulas that are marked as smelly by these thresholds.
10 Formula Smells in an Industrial Case Study
10.1 Goal
The aim of our second evaluation is investigating which of the formula smells actuallyposes a threat to spreadsheets (R2), and whether risk maps help spreadsheet users find andunderstand formula smells (R3). To determine this, we have surveyed spreadsheet users andinterviewed them about a spreadsheet that they often work with and that they found waslarge and complicated. We stated that this spreadsheet did not necessarily had to be createdby them initially, but they had to have experience with changing its formulas.
10.2 Setup
For the second evaluation we interviewed 10 professional spreadsheet users from the finan-cial domain. We conducted our evaluation at Robeco, a Dutch asset management companywith approximately 1600 employees worldwide, and over 130 billion Euro worth of assetsunder management.
We invited 27 participants of a previous study performed at Robeco (Hermans et al.2012a) to participate in this evaluation, where they were asked to provide us with a spread-sheet that they worked with regularly. We explained to participants that we were going toanalyze the quality of their spreadsheet, and discuss it with them. We provided subjects witha list of the five formula smells and a short explanation of each smell, so they could studythis before the experiment. We had one interview with every participant and for each of thesessions, the procedure was as follows. First we asked the subject to explain the spreadsheetto us. We then analyzed the spreadsheet and generated the spreadsheet risk map, which weshowed to users within Excel. We subsequently let subjects inspect the risk map, and askedthem in a semi-structured interview setup, for each of the located formula smells 1) whetherthey understood the smell that was identified and 2) whether they thought this smell poseda threat to spreadsheet understandability, and if yes, why, and how severe the threat was,according to them. We finally asked them how the risk map and the pop-up helped them
Empir Software Eng
in understanding the formula smells. We made notes of each of the interviews by hand andsubsequently coded them.
Each of the participants was interviewed on its own, separate from other participantsand studied only their own spreadsheet. The interviews were performed face to face at theRobeco headquarters, on three different days. The interviews were executed and transcribedin Dutch, so quotes in the following are translations.
10.3 Results
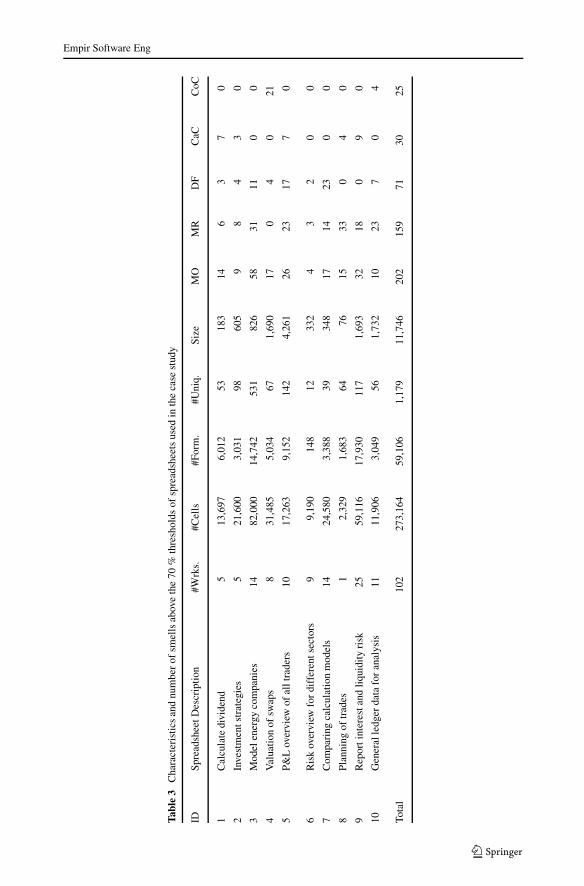
Table 3 shows an overview of the spreadsheets used in the case study in terms of the num-bers of worksheets, cells, formulas, unique formulas and file size. The five final columnsindicate the number of unique formulas in the spreadsheets suffering from the given smell,Multiple Operations (MO), Duplicate Formula (DF), Multiple References (MR), Condi-tional Complexity (CoC) and Long Calculation Chain (CaC). As can be seen from this table,formula smells occur frequently in the ten spreadsheets. The following describes the resultof the case studies in detail.
10.3.1 General Observations
When confronted with the most smelly formula cells, participants often needed time toexplain the formula. In all cases the participants expressed statements like “what was thisformula again?” or “let me just have a quick look”. A commonality among the ten cases inthe study is the fact that all participants immediately recognized the impact a smelly, hencecomplex formula could have on spreadsheet formulas understandability. When we discussedthe most complex formulas in the spreadsheet with the participants, they indicated that itwas going to be very hard to understand or adapt this formula for someone else than thespreadsheet’s creator.
Most participants (8) had never considered the situation where another spreadsheet userhad to understand their formulas that much. A previous study by Hermans et al. confirmsthe importance of such transfer scenarios (Hermans et al. 2012a). What we found in ourpresent study, however, is that participants did not realize prior to this study that keepingformulas short and simple would help future users of the spreadsheet understand it betterand faster. A side effect of our study was increased awareness with our participants that theyshould take understandability into account when building and adapting spreadsheets.
We found that the three thresholds and the corresponding coloring help subjects estimateseverity of the detected smell. One of the subjects compared this to the triangle function inExcel. This function marks potential errors, like calculations over empty cells with a smallgreen triangle at the bottom of a cell. He stated: “That function is annoying, since manycells get colored. Because you have different shades, I can start inspecting the red ones, andignore the yellow ones for now”.
Regarding the values of the thresholds, we discussed each colored cell with the spread-sheet owner, systematically going through the worksheets. In all but one case the subjectsagreed with the classification of the formulas. Only spreadsheet user S3 stated that he feltthat the system was too strict. His spreadsheet contained 3 cells with five different referencesand four operations. These cells were hence marked as having both the Multiple Operationsand the Multiple References smell, while the user still found this acceptable. In the otherformulas in his spreadsheet where these smells were located, he did found they were smelly,since the metric values for those formulas where higher than respectively 5 and 4. So from
Empir Software Eng
Tabl
e3
Cha
ract
eris
tics
and
num
ber
ofsm
ells
abov
eth
e70
%th
resh
olds
ofsp
read
shee
tsus
edin
the
case
stud
y
IDSp
read
shee
tDes
crip
tion
#Wrk
s.#C
ells
#For
m.
#Uni
q.Si
zeM
OM
RD
FC
aCC
oC
1C
alcu
late
divi
dend
513
,697
6,01
253
183
146
37
0
2In
vest
men
tstr
ateg
ies
521
,600
3,03
198
605
98
43
0
3M
odel
ener
gyco
mpa
nies
1482
,000
14,7
4253
182
658
3111
00
4V
alua
tion
ofsw
aps
831
,485
5,03
467
1,69
017
04
021
5P&
Lov
ervi
ewof
allt
rade
rs10
17,2
639,
152
142
4,26
126
2317
70
6R
isk
over
view
for
diff
eren
tsec
tors
99,
190
148
1233
24
32
00
7C
ompa
ring
calc
ulat
ion
mod
els
1424
,580
3,38
839
348
1714
230
0
8Pl
anni
ngof
trad
es1
2,32
91,
683
6476
1533
04
0
9R
epor
tint
eres
tand
liqu
idit
yri
sk25
59,1
1617
,930
117
1,69
332
180
90
10G
ener
alle
dger
data
for
anal
ysis
1111
,906
3,04
956
1,73
210
237
04
Tota
l10
227
3,16
459
,106
1,17
911
,746
202
159
7130
25
Empir Software Eng
the perspective of this user the thresholds should be higher, however as stated above, he wasthe only one; the other nine subjects stated all marked formulas were indeed smelly.
10.3.2 Multiple Operations
Findings Multiple Operations were found in all ten spreadsheets, making them the numberone common smell. In all cases we found that the subjects said that keeping the formulasshort makes them easier to read and understand. Two of the subjects believed that formulaswith many operations are often a cause of errors, saying “the chance of errors in such along formula is so much bigger; when I find errors, it is almost always in long formulas”.When asked for the reason that Multiple Operations where created, all subjects stated thatthis was an evolutionary process. Multiple Operations are hardly ever created at once. Theyare the result of the repeated adaptation of a formula, adding operations as the spreadsheetchanges. As one of the subjects stated “Usually it starts with just a sum, but than you wantto round it, add something and before you know it, the formula is two lines long”. Thetwo subjects above—the ones who had realized the error risk of Multiple Operations—didtry to minimize formula length. However, sometimes, for instance, when a deadline wasapproaching, Multiple Operations were introduced anyway. There was no common practiceamong the spreadsheet users to restructure the spreadsheet after such a deadline. One ofthese two subjects mentioned “when it works, it works. No one really cares how it is done”.
We found that the risk map helped in the case of Multiple Operations. In the case wherethis smell was located, the smelly cells were clearly marked with a color (yellow, orange orred). Hence, the reason why the smell was detected was immediately clear; many subjectsstated something like “I understand why this formula is selected by your system, it is quitelong.”
Conclusions Spreadsheet users feel that Multiple Operations are more error prone thanshorter formulas. This is especially due to the fact that formulas that suffer from the Multi-ple Operations smell are hard to quickly understand. Therefore, it is harder to spot an errorand hence these formulas are less likely be corrected when they are wrong. Multiple Oper-ations are often the result of changes to the spreadsheets, and the refactoring of complexformulas is not something that spreadsheet users commonly do.
10.3.3 Multiple References
Findings Experiences with Multiple References were similar to those with Multiple Opera-tions; when confronted with the smelly cells, it took the nine subjects a considerable amountof time, in the longest case even ten minutes, to explain the formula. This made them realizethat it would be very hard for others to understand and adapt the formula, especially sincelocating the references can be a challenge. Excel supports users in locating the referencesby coloring the referenced cells. However, if there are many references and colors users findthis feature to be more annoying than helpful as confirmed by nine of our participants. Oneof the subjects stated, when looking at a formula that referred to no less than 17 ranges “thisformula is a real puzzle”.
In this case, as opposed to the Multiple Operations smell, some participants did notimmediately understand how to adapt this formula to make it less smelly. When asked,one of the participants even stated “but I need all that input to make the calculation”.Splitting the formula into different steps seemed more difficult than with the Multiple Oper-ations. In that case the formulas consist of different operations, and the splitting would
Empir Software Eng
consist of separating the operations. In this case however, we encountered formulas likeSUM(A1:A5;B6;D7;E12), of which it was not immediately clear to the spreadsheet usershow to improve it. It can be split into multiple steps, but what steps are logical is not so easyto determine for the user. We asked the nine participants to describe how they were goingto split the formula, and only one was able to formulate a strategy. The other hesitated, oneof them stated “I don’t know where I should start, because I don’t remember how I madethis formula”. As an alternative, cells could be moved, such that this formula will refer toone range. This made the participants hesitate even more. They clearly felt that moving for-mulas around was a tricky operation, since the effect of this move on other formulas is notclear. One of the subjects that tried to lower the references said “if I move this, what willhappen to the other formulas? I would like to preview that”.
For this smell again, the risk maps are a good way of conveying this smell. Formulaswith many references were colored red, orange or yellow; and hence attracted the attentionof the spreadsheet users. Clicking the formula revealed easily that the formula had too manyreferences.
Conclusions Subjects found that formulas with many references are not easy to understand,since finding all references can be difficult. Even though the risk was understood, subjectsfound it hard to come up with the right refactoring to overcome this smell. This is partlycaused by the fact that a long list of references can indicate that the placement of formulasis not optimal, and hence this smell can also reveal a weakness in the organization of thespreadsheet.
Refactorings to the location of formulas were found especially hard for the subjects, andsupport for this, like a preview, is definitely a promising avenue for future research.
Finally we found it interesting that Excel’s feature to color the cells referenced by aformula is only helpful in cases with few references (typically above 6 it got confusing forthe participants). There is apparently a need for better support in locating references.
10.3.4 Duplicated Formula
Findings In the evaluation we found that the cases in which duplicated formulas aredetected can be divided into two distinct categories.
– Common Subformula Different formulas are simply sharing a subformula, and there isan opportunity for refactoring.
– Rare Formulas: There is one formula that differs slightly from its neighbors, andtherefore shares a subtree with these neighbors.
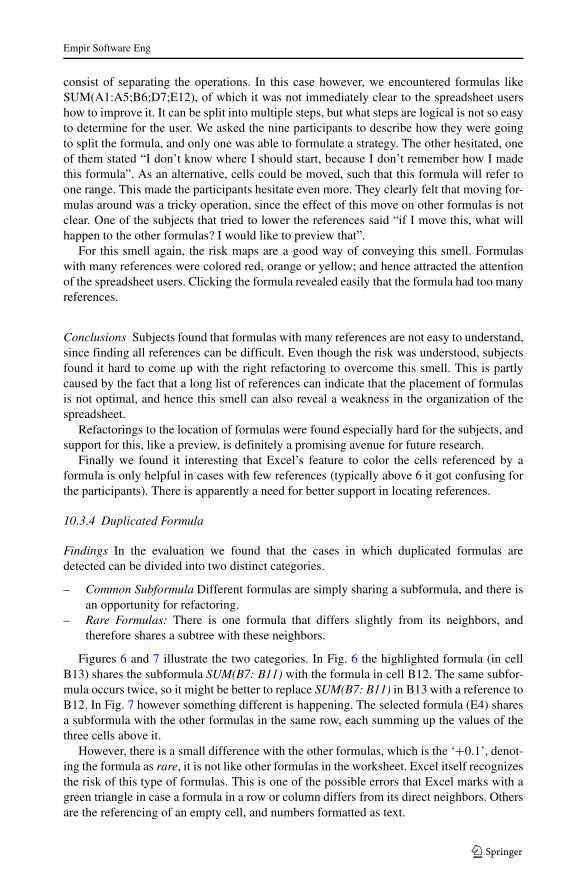
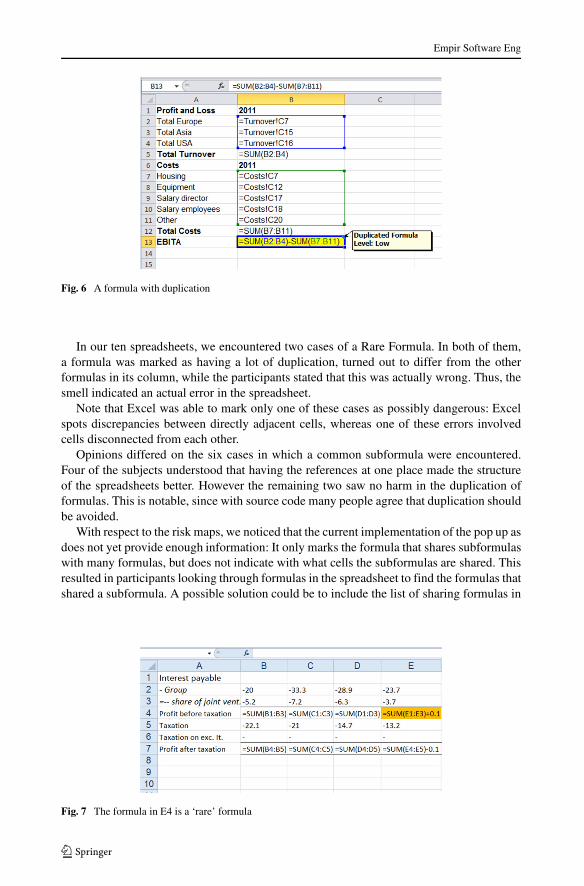
Figures 6 and 7 illustrate the two categories. In Fig. 6 the highlighted formula (in cellB13) shares the subformula SUM(B7: B11) with the formula in cell B12. The same subfor-mula occurs twice, so it might be better to replace SUM(B7: B11) in B13 with a reference toB12. In Fig. 7 however something different is happening. The selected formula (E4) sharesa subformula with the other formulas in the same row, each summing up the values of thethree cells above it.
However, there is a small difference with the other formulas, which is the ‘+0.1’, denot-ing the formula as rare, it is not like other formulas in the worksheet. Excel itself recognizesthe risk of this type of formulas. This is one of the possible errors that Excel marks with agreen triangle in case a formula in a row or column differs from its direct neighbors. Othersare the referencing of an empty cell, and numbers formatted as text.
Empir Software Eng
Fig. 6 A formula with duplication
In our ten spreadsheets, we encountered two cases of a Rare Formula. In both of them,a formula was marked as having a lot of duplication, turned out to differ from the otherformulas in its column, while the participants stated that this was actually wrong. Thus, thesmell indicated an actual error in the spreadsheet.
Note that Excel was able to mark only one of these cases as possibly dangerous: Excelspots discrepancies between directly adjacent cells, whereas one of these errors involvedcells disconnected from each other.
Opinions differed on the six cases in which a common subformula were encountered.Four of the subjects understood that having the references at one place made the structureof the spreadsheets better. However the remaining two saw no harm in the duplication offormulas. This is notable, since with source code many people agree that duplication shouldbe avoided.
With respect to the risk maps, we noticed that the current implementation of the pop up asdoes not yet provide enough information: It only marks the formula that shares subformulaswith many formulas, but does not indicate with what cells the subformulas are shared. Thisresulted in participants looking through formulas in the spreadsheet to find the formulas thatshared a subformula. A possible solution could be to include the list of sharing formulas in
Fig. 7 The formula in E4 is a ‘rare’ formula
Empir Software Eng
the pop up, or create an Excel plug in that highlights the sharing formulas when a formulasuffering form duplication is selected. We will address this in future work.
Conclusions Rare formulas can reveal true weaknesses and even errors in spreadsheets, andspreadsheet users agree with that.
However, the refactoring of duplicate pieces of formulas—in source code refactoringvery common—is not considered to be an improvement to all spreadsheet users.
10.3.5 Long Calculation Chain
Findings This smell triggered most discussion with the five subjects whose spreadsheetswere diagnosed with this smell.
The main reason was the fact that the risk maps do not provide enough information tounderstand this smell immediately. When a certain cell suffers from the Long CalculationChain smell at the 70 % level, this means that the path from this formula to the begin-ning of the longest calculation chain is at least 5 steps. The cells that are included in thiscalculation chain were not shown in the pop up. This led to spreadsheet users repeatedlystepping through formulas to check whether a formula indeed had a long calculation chain;and whether that was necessary.
Two of the subjects found that the calculation chain (in one case 10, in the other 17 steps)was indeed long, and that some restructuring would improve readability. The other threesubjects found that, although the number of steps was high, this was necessary in orderto calculate the needed values. We did notice that it is easier to trace and understand thedifferent calculation steps when they are located in the same row or column. When we askedthe five subjects about this, they concurred. This means there is a need for an additionalmetric based on the location of the cells involved in the calculation chain. We will look intothis in future research.
Furthermore there is the trade off between Multiple Operations and Multiple Referenceson one the hand, and Long Calculation Chain on the other. When discussing this phe-nomenon with the five subjects, we learned that they felt in need of guidance where the rightbalance is. Hence, better support for managing this trade off is needed. This might be donewith our risk maps or with other interfaces to help users to find the proper balance betweenthe formula smells.
Conclusions Long Calculation chains are relatively common, but are difficult to refactor forspreadsheet users. Hence more support to help users to understand and refactor this smell isnecessary.
10.3.6 Conditional Complexity
Findings This metric was the least common in the case study, similar to the finding in theevaluation of the EUSES corpus. In the two spreadsheets in which it was located, the riskmaps easily helped in locating the Conditional Complexity smell. When the users selectedthe cells suffering from the smell, they learned from the pop up that nested conditionalswere found in the formula.
The two subjects understood and even apologized for the detected smell, stating “I knowthis formula is too hard, I was trying to get something to work, and then it just remainedlike that”. Both subjects were well aware of the fact that nesting more than two conditionalformulas was not such a good idea.
Empir Software Eng
Conclusions The Conditional Complexity smell is in fact already known to spreadsheetusers. Apparently there is some notion among the spreadsheet users that conditional oper-ations are complex and should be handled with some care, probably explaining the lowoccurrence of this smell.
11 Refactoring Evaluation
11.1 Goal
With this third evaluation, we want to obtain a preliminary understanding of the usefulnessof the generated spreadsheet refactoring suggestions. To that end, the authors of the paperhave re-analyzed the ten spreadsheets of Robeco and specifically investigated how smellscould be refactored.
11.2 Setup
We use the Breviz tool to analyze the ten industrial spreadsheets of the previous evaluationand generate suggested refactorings for all smelly formulas. Subsequently, we inspectedthose suggestions manually for all smelly formulas. We determined whether the suggestedrefactoring would resolve the smell and what other impact it would have, specificallywhether executing the refactoring would create new smells.
11.3 Results
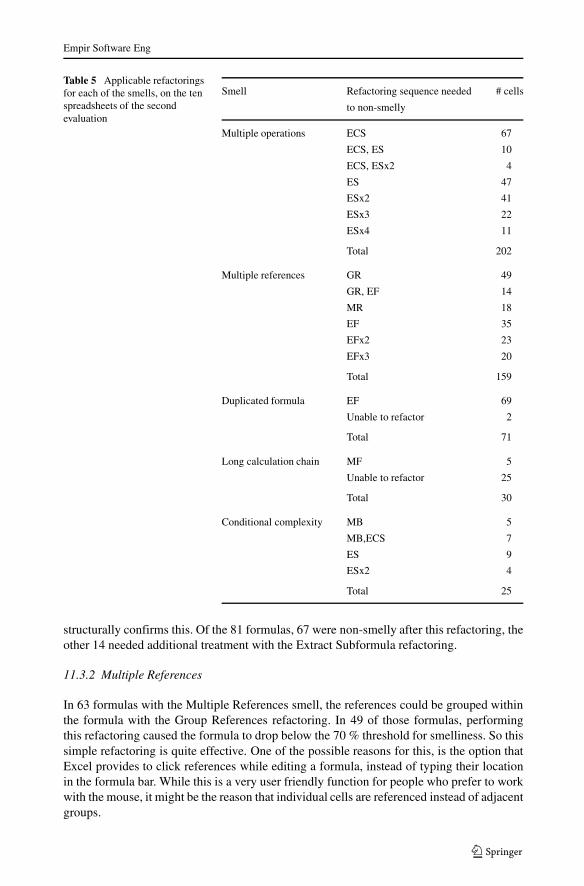
Table 4 shows which of the six refactorings—Extract Common Subformula (ECS), ExtractSubformula (ES), Group References (GR), Move References (MR), Merge Branches (MB)and Merge Formulas (MF)—could be applied to the smelly formulas in the test set, for eachof the five smells. A dash (–) indicates a given refactoring can not be applied to remove thatsmell. Table 5 lists, for each of the smells, what refactorings need to be executed to relievethe smell.
11.3.1 Multiple Operations
In 81 of the 202 formulas suffering from the Multiple Operations, the Extract CommonSubformula could be applied. This number is quite high; one would expect that a simplerefactoring like replacing a common subformula would be something that users would per-form themselves. However, we learned from the previous evaluation that improving qualityof spreadsheets is not a priority. The fact that even such an obvious refactoring is not applied
Table 4 Applicable refactorings for each of the smells, on the ten spreadsheets of the second evaluation
Smell Smelly formulas ECS ES GR MR MB MF
Multiple operations 202 81 202 – – – –
Multiple references 159 – 159 63 18 – –
Duplicated formula 71 – 71 – – – –
Long calculation chain 30 – 30 – – – –
Conditional complexity 25 7 25 – – 12 –
Empir Software Eng
Table 5 Applicable refactoringsfor each of the smells, on the tenspreadsheets of the secondevaluation
Smell Refactoring sequence needed # cells
to non-smelly
Multiple operations ECS 67
ECS, ES 10
ECS, ESx2 4
ES 47
ESx2 41
ESx3 22
ESx4 11
Total 202
Multiple references GR 49
GR, EF 14
MR 18
EF 35
EFx2 23
EFx3 20
Total 159
Duplicated formula EF 69
Unable to refactor 2
Total 71
Long calculation chain MF 5
Unable to refactor 25
Total 30
Conditional complexity MB 5
MB,ECS 7
ES 9
ESx2 4
Total 25
structurally confirms this. Of the 81 formulas, 67 were non-smelly after this refactoring, theother 14 needed additional treatment with the Extract Subformula refactoring.
11.3.2 Multiple References
In 63 formulas with the Multiple References smell, the references could be grouped withinthe formula with the Group References refactoring. In 49 of those formulas, performingthis refactoring caused the formula to drop below the 70 % threshold for smelliness. So thissimple refactoring is quite effective. One of the possible reasons for this, is the option thatExcel provides to click references while editing a formula, instead of typing their locationin the formula bar. While this is a very user friendly function for people who prefer to workwith the mouse, it might be the reason that individual cells are referenced instead of adjacentgroups.
Empir Software Eng
In the remaining 96 smelly cells, 18 times the Move References refactoring was applica-ble. This means some of the referenced cells were exclusively used by the smelly formulaand therefore the references could be moved without interfering with other formulas. Asnoted in the previous evaluation, this is actually a smell in the structure of the worksheetthan in the formula itself: those references were placed a location that caused the formulato be smelly.
On the last 78 formulas we manually applied Extract Formula refactoring, causing 43formulas to remain smelly after one step. These formulas needed two (23) or three (20)additional Extract Formula refactorings to drop below the threshold.
11.3.3 Duplicated Formula
The Duplicated Formula smell can only be refactored with the Extract Subformula refactor-ing, but the interesting fact here is that this refactoring will always impact other cells too, asthere must be other cells sharing a subformula. otherwise the formula would not suffer fromthe Duplicated Formula smell. As described above, there are two different cases in whichthis smell occurs: Common Subformula and Rare Formula. In the case of a Rare Formula,the Extract Subformula does not help, since in that case the formula was never supposed toshare a subformula. In the other cases, applying Extract Subformula will always relieve thesmell.
11.3.4 Long Calculation Chain
In the second evaluation, we saw that the Long Calculation Chain smell is the hardest smellto understand, as it does not occur in one formula only, but rather concerns a group of cells.Of the 30 formulas in which this smell occurred, in only 7 of them, we could apply theMerge Formulas refactoring, as the formulas in the chain did not occur in other chains. In5 of those 7, the refactoring could be applied without going over the threshold for MultipleReferences or Multiple Operations. In these cases, the trade off seemed to be not present.This is due to the fact that since these formulas only occurred in one chain, the impact ofthe refactoring was low. For the remaining 25 cases however, we would need additionalinterface support to help the user refactor formulas that occur in multiple chains. This is aninteresting direction for future work.
11.3.5 Conditional Complexity
In 12 of the 25 formulas with the Conditional Complexity smell, branches could be merged,i.e. the Merge Branches refactoring was applicable. After the merging of those branches, in7 cases, common subformulas could be extracted, either in the condition or in the branches.This observation also gives additional credibility to the hypothesis that such complex for-mulas are not created at once. If the entire conditions would be known, the spreadsheet usercould have put it in one branch at creation of the formula. When multiple branches result inthe same value, it seems likely some branches were added at a later time. This is corrobo-rated by the statement of the creator of one of those formulas, who stated: “I was trying toget this formula to work”. In the 13 cases on which Merge Branches could not be applied,this was the case because there were no multiple branches resulting in the same value. Inthat case, the smell can only be relieved by applying the Extract Subformula refactoring. In9 of the 13 cases, the smell could be resolved with one application of Extract Subformula,in the other 4 cases, two applications were needed.
Empir Software Eng
12 Answers to Research Questions
With the results of the EUSES analysis and the case studies, we revisit the researchquestions.
R1 What spreadsheet smells are most common, and why? In the first two evaluations wehave seen that Multiple Operations and Multiple References are the most common smells,and from the second evaluation we have learned that this is often caused by the modifica-tion of a spreadsheet, sometimes under time pressure. Since there is little awareness of therisks of Multiple Operations, spreadsheet users seem not to be concerned too much aboutunderstandability and maintainability of formulas. They keep extending formulas with moreoperations and more references, causing formulas to become long and complicated.
R2 To what extent do formula smells expose threats to spreadsheet quality? We found twoactual faults in a spreadsheet by looking at the Duplication Smell. With respect to the othersmells, the concern caught is lack of understandability. Spreadsheet users found that ourcurrent smell detection strategies reveal the formulas that are the least maintainable. Theseformulas will be time consuming to change, and changes made will be more error prone.
R3 To what extent are risk maps an appropriate way to visualize spreadsheet smells? Thestrengths of risk maps include their simplicity and the fact that the visualization is shownwithin the context of the spreadsheet. Seven subjects explicitly stated they liked the riskmaps, posing statements like “these colors draw my attentions to the formulas that deservea second check”. Users furthermore appreciated the different levels of the smells, allowingthem to inspect the worst formulas first. For the Long Calculation smell, however, additionalinterface elements are needed, in order to help spreadsheet users understand the cause ofthe smell.
In addition to the risk maps, three of the subjects asked for a general score of the qualityof their spreadsheet. Although we could provide them with the number of smells and theirseverity by looking into our database, an aggregation of the metrics is not provided by thecurrent prototype. This could, for instance, be added by generating an extra worksheet inthe spreadsheet in which overviews of all metrics are shown, for instance similar to the starranking system of Cunha et al. (2012).
R4 To what extent can formula smells be refactored by generated refactoring sugges-tions? In our third evaluation, we found that some smells can be refactored using thesuggestions we generate. For instance the Multiple Operations smell and the Multiple Ref-erences smell, especially in the case where the Group References refactoring can be applied.This refactoring does not impact other cells and is quite easy to perform. However, it mightbe hard for spreadsheet users themselves to perform these refactorings. In future work, weplan to investigate the possibility of automating the execution of the refactorings, especiallyfor smells like the Long Calculation Chain that are harder to perform and balance.
13 Discussion
13.1 Better Calibration of Thresholds
In this paper, we have calibrated the thresholds based on a large set of diverse spreadsheets.However, this set stems from 2005 and the standards of spreadsheet use might have changedor could change in the future. Hence, it might be better to select a set of spreadsheetsand continuously monitor their smell levels and calibrate based on that. Alternatively, wecould use a smaller, more specific set, resulting in more focused guidelines. For instance,
Empir Software Eng
calibrating the metrics for a given domain or even company might improve the results, asspreadsheet formulas in different settings might have styles for formulas.
13.2 Interacting Smells and Refactorings
As mentioned above, some smells are related to each other, like Multiple Operations andMultiple References. Refactoring the one might also solve the other. Some other smells areinversely related like Long Calculation Chain with Multiple Operations; refactoring onemight actually cause the other. In future versions of our tool, we want to take this effect intoaccount, for instance for prioritizing the suggested refactorings.
13.3 Named Ranges
In the current set of smells we have not taken into account named ranges, a spreadsheet fea-ture allowing users to assign a name to a number of cells. We encountered named ranges inone of the case studies, where a formula that summed a named range, SUM(NamedRange),was marked as having the Many Reference smells. Initially the subject did not understandwhy it was marked as referring to many different ranges, since there was only one refer-ence. The named range itself however consisted of several separate ranges. This raises thequestion whether we think this is smelly, and why. Note that the smell is in fact related tothe named range itself—it is probably not a good idea to create a named range consisting ofmultiple ranges—rather than to the formula referencing the named range.
13.4 Applicability of the Risk Maps
Our risk map visualization exhibits limitations if the smell in question addresses concernsnot exclusively contained in the smelly formula itself. This explains why some subjectswere dissatisfied with the pop-ups of Long Calculation Chain and Duplicated Formulas,which essentially require information from cells outside the smelly formula itself. In futureresearch we will explore how to present smells at different levels of abstraction in oneintegrated view.
13.5 Spreadsheet Evolution
While performing the case study, subjects shared that spreadsheets tend to undergo manychanges during their life time (an observation also made in Hermans et al. (2012a)) and thatthese changes can lead to a degradation of formula quality. This is an issue that warrantsfurther investigation, calling for a longitudinal study of spreadsheet quality in which wecould study different versions of one single spreadsheet to understand to a deeper extenthow formulas become smelly.
13.6 Threats to Validity
A threat to the external validity of our quantitative evaluation concerns the representative-ness of the EUSES Corpus spreadsheet set. This set, however, consists of 4223 spreadsheetscovering 11 different domains. Furthermore, it has been used in many other studies and iscollected from practice.
A threat to the external validity of our qualitative evaluation concerns the representa-tiveness of the selected set of employees of Robeco and their spreadsheets. However other
Empir Software Eng
papers (Hendry and Green 1994; Panko 2006) report on industrial spreadsheet stories sim-ilar to the ones we found at Robeco, so their practice seems representative. Further studiesare however needed to generalize our findings.
With respect to internal validity, one of the threats is the fact that we did not pick arandom sample of people. This effect can be decreased by using a larger test group in futureexperiments. We however believe the current test group serves as a good reference group, asthe persons varied in age, function and daily tasks with spreadsheets. Another threat is thefact that subjects might have cleaned up their spreadsheets before participating in the study.However, given the large number of smells we found, this does seem the case.
14 Related Work
Efforts related to our research include work on code smells, starting with the canonical workby Fowler (1999). His book gives an overview of code smells and corresponding refac-torings. Recent efforts focused on the automatic identification of code smells by meansof metrics. Marinescu (2001) for instance, uses metrics to identify suspect classes, thoseclasses that might have design flaws. Lanza et al. (2005) explain this methodology in moredetail. Alves et al. (2010) focus on a strategy to obtain thresholds for metrics from a bench-mark. Olbrich et al. furthermore investigates the changes in smells over time, and discussestheir impact (Olbrich et al. 2009). Moha et al. (2010) goes a step further and designedthe DECOR method to automatically generate their code smell detection algorithms fromspecification. The CCFinder tool (Kamiya et al. 2002) specially aims at detecting clonesin source code, which have similarity to our Duplicated Formula smell. The CodeCity sys-tem (Wettel and Lanza 2008; Wettel et al. 2011) presents a new technique to visualize codesmells by using a 3D visualization technique, based on the metaphor of a city.
Other work related to ours include papers that provide spreadsheet design guidelines.Raffensperger (2009), for instance advises to merge references that occur only once. Hefurthermore states that unnecessary complex formulas with many operations and parenthesisshould be avoided. Rajalingham et al. (2000) also propose guidelines to improve spreadsheetquality, which they base on principles of software engineering.
Secondly, there are papers that address common errors in spreadsheets, like (Ayalew et al.2000; Panko 1998), together with their causes. Powell et al. for instance (Powell et al. 2009)names conditional formulas (which is one of our smells) among the top three of commonlyoccurring spreadsheet error categories.
Furthermore there is related work on finding anomalies on spreadsheets, for instance thework on the UCheck tool (Abraham and Erwig 2007; Chambers and Erwig 2009; Erwig2009). UCheck determines the type of cells, and locates possible anomalies based on thistype system. UCheck uses a similar visualization, with colors in the spreadsheet, to indicatefound anomalies. Their follow up system UFix (Abraham and Erwig 2005) adds popupmessages to explain details on the found errors.
Finally, there are papers on spreadsheet metrics, which are also aimed at locating weakpoints in spreadsheets. In 2004, Bregar published a paper presenting a list of spreadsheetmetrics based on software metrics (Bregar 2004). He however does not provide any justi-fication of the metrics, nor did he present an evaluation. Hodnigg and Mittermeir (2008)propose several spreadsheet metrics of which some are similar to Bregar’s. Their metricsare divided into three categories: general metrics, such as the number of formulas and thenumber of distinct formulas; formula complexity metrics, such as the number of referencesper formula, and the length of the longest calculation chain; and finally metrics, such as the
Empir Software Eng
presence of scripts in, e.g., Visual Basic for Applications (VBA), user defined functions andexternal sources. Besides the metrics, the authors also pose the interesting suggestion to usedifferent types of visualizations for cells with different values for the metrics. Hole et al.(2009) propose an interesting approach to analyze spreadsheets in terms of basic spreadsheetmetrics, such as the number of functions used, the presence of charts and the complexity ofprogram code constructs to predict the level of the spreadsheet creator.
We ourselves have worked on spreadsheet smells in previous work (Hermans et al.2012a). In that paper we focused on detecting smells between worksheets, like high cou-pling. That paper followed our earlier work, in which we worked on the visualization ofspreadsheets by means of class diagrams (Hermans et al. 2010) and dataflow diagrams(Hermans et al. 2012a).
This paper differs from our previous work by focusing on detecting smells in spreadsheetformulas. Recently, other work on spreadsheet smells has been published (Cunha et al.2012), that aims at smells in values, such as typographical errors and values that do notfollow the normal distribution. Other recent work by Badame and Dig (2012) suggests anapproach to support spreadsheet users in removing formula smells by refactoring. Theirrefactorings are, however, not based on smells.
15 Concluding Remarks
The goal of this paper is to investigate the applicability of code smells to spreadsheetformulas as a means to asses and improve spreadsheet quality.
To that end we have created a list of formula smells, based on our experiences withspreadsheets, related work in spreadsheet guidelines and literature on code smells. Wesubsequently defined a set of metrics for detecting five formula smells and presented thevisualization of these smells with the spreadsheet risk map. We have evaluated the metricsand the risk map with a qualitative and quantitative evaluation. The quantitative evaluationwas performed on the spreadsheets from the EUSES corpus. The qualitative evaluation waswith spreadsheets from ten professional spreadsheet users from industry.
The key contributions of this paper are as follows:
– A catalog of spreadsheet formula smells, based on code smells– A refactoring corresponding to each smell– A method to automatically detect these smells and suggest refactorings– An evaluation of the formula smells on the EUSES corpus– An evaluation of the formula smells and their refactorings on ten professional
spreadsheets.
We have found that spreadsheet formula smells occur frequently, and can pose a realthreat to spreadsheet understandability, and can even detect actual errors. Spreadsheet usersin our qualitative evaluation found that the risk maps were a good way of indicating for-mula smells, and that the three thresholds helped them get a feeling of the importance ofthe located smells. The third evaluation showed that refactoring suggestions could resolvethe detected smells with one refactoring in 59 % of the cases and with no more than 4refactorings in 95 % of the cases.
The current research gives rise to several directions for future work. Firstly, the defini-tions of the current set of metrics could be refined; as mentioned in the evaluation section,we could split the duplication metric, and add a metric for the location of cells in a long
Empir Software Eng
calculation chain. Secondly, some smells ask for a more elaborate visualization, for instanceto indicate the balance between Multiple Operations and Long Calculation Chain. Finally,more support for formula refactoring is needed.
References
Abraham R, Erwig M (2005) How to communicate unit error messages in spreadsheets. In: Proceedings ofWEUSE ’05, pp 1–5
Abraham R, Erwig M (2006) Inferring templates from spreadsheets. In: Proceedings of ICSE ’06, pp 182–191Abraham R, Erwig M (2007) Ucheck: a spreadsheet type checker for end users. J Vis Lang Comput 18:71–
95. doi:10.1016/j.jvlc.2006.06.001Alves TL, Ypma C, Visser J (2010) Deriving metric thresholds from benchmark data. In: Proceedings of
ICSM ’10. IEEE Computer Society, pp 1–10Ayalew Y, Clermont M, Mittermeir RT (2000) Detecting errors in spreadsheets. In: Proceedings of
EuSpRIG ’00, pp 51–62Badame S, Dig D (2012) Refactoring meets spreadsheet formulas. In: Proceedings of ICSM ’12, pp 399–409Bregar A (2004) Complexity metrics for spreadsheet models. In: Proceedings of EuSpRIG ’04, p 9Chambers C, Erwig M (2009) Automatic detection of dimension errors in spreadsheets. J Vis Lang Comput
20:269–283Cunha J, Fernandes JP, Mendes J, Hugo Pacheco JS (2012) Towards a catalog of spreadsheet smells. In:
Proceeding of ICCSA’12. LNCSCunha J, Fernandes JP, Peixoto C, Saraiva J (2012) A quality model for spreadsheets. In: Proceedings of
QUATIC ’12, pp 231–236Cunha J, Saraiva J, Visser J (2009) Discovery-based edit assistance for spreadsheets. In: Proceedings of
VL/HCC ’09, pp 233–237. IEEEErwig M (2009) Software engineering for spreadsheets. IEEE Softw 26:25–30. doi:10.1109/MS.2009.140Fisher M, Rothermel G (2005) The EUSES spreadsheet corpus: a shared resource for supporting experimen-
tation with spreadsheet dependability mechanisms. In: Proceedings of WEUSE ’05, pp 47–51Fowler M (1999) Refactoring: improving the design of existing code. Addison-Wesley Longman Publishing
Co., Inc., BostonHendry DG, Green TRG (1994) Creating, comprehending and explaining spreadsheets: a cognitive inter-
pretation of what discretionary users think of the spreadsheet model. Int J Human-Computer Stud40(6):1033–1065
Hermans F, Pinzger M, van Deursen A (2010) Automatically extracting class diagrams from spreadsheets.In: Proceedings of ECOOP ’10, pp 52–75
Hermans F, Pinzger M, van Deursen A (2011) Breviz: spreadsheet visualization and quality analysis. In:Proceedings of EuSpRIG ’11, pp 63–72
Hermans F, Pinzger M, van Deursen A (2012a) Detecting and visualizing inter-worksheet smells inspreadsheets. In: Proceedings of ICSE ’12, pp 441–451
Hermans F, Pinzger M, van Deursen A (2012b) Detecting code smells in spreadsheet formulas. In:Proceedings of ICSM ’12, pp 409–418
Hermans F, Pinzger M, van Deursen A (2012c) Measuring spreadsheet formula understandability. In:Proceedings of EuSpRIG ’12
Hodnigg K, Mittermeir R (2008) Metrics-based spreadsheet visualization: support for focused maintenance.In: Proceedings of EuSpRIG ’08, p 16
Hole S, McPhee D, Lohfink A (2009) Mining spreadsheet complexity data to classify end user developers.In: Proceedings of ICDM ’09. CSREA Press, pp 573–579
Kamiya T, Kusumoto S, Inoue K (2002) Ccfinder: a multilinguistic token-based code clone detection systemfor large scale source code. TSE 28(7):654–670
Lanza M, Marinescu R, Ducasse S (2005) Object-oriented metrics in practice. Springer-Verlag, New York,Inc., Secaucus
Marinescu R (2001) Detecting design flaws via metrics in object-oriented systems. In: Proceedings ofTOOLS ’01. IEEE Computer Society, pp 173–182
Moha N, Gueheneuc YG, Duchien L, Le Meur AF (2010) Decor: a method for the specification and detectionof code and design smells. TSE 36(1):20–36
Nardi B, Miller J (1990) The spreadsheet interface: a basis for end user programming. In: Proceeding of theIFIP conference on human-computer interaction (INTERACT). North-Holland, pp 977–983
Olbrich S, Cruzes DS, Basili V, Zazworka N (2009) The evolution and impact of code smells: a case studyof two open source systems. In: Proceedings of ESEM ’09, pp 390–400
Empir Software Eng
Panko R (2006) Facing the problem of spreadsheet errors. Decis Line 37(5):8–10Panko RR (1998) What we know about spreadsheet errors. J End User Comput 10(2):15–21Powell S, Baker K, Lawson B (2009) Errors in operational spreadsheets: a review of the state of the art. In:
Proceedings of HICCS ’09. IEEE Computer Society, pp 1–8Raffensperger J (2009) New guidelines for spreadsheets. Int J Bus Econ 2:141–154Rajalingham K, Chadwick D, Knight B, Edwards D (2000) Quality control in spreadsheets: a software
engineering-based approach to spreadsheet development. In: Proceedings HICSS ’00, pp 133–143Wettel R, Lanza M (2008) Visually localizing design problems with disharmony maps. In: Proceedings of
SoftVis ’08, pp 155–164Wettel R, Lanza M, Robbes R (2011) Software systems as cities: a controlled experiment. In: Proceedings of
ICSE ’11, pp 551–560Winston W (2001) Executive education opportunities. OR/MS Today 28(4)
Felienne Hermans is an assistant professor at the Delft University of Technology. In January 2013, shedefended her PhD thesis that centers around applying techniques for software to spreadsheets, in order tounderstand, visualize and improve them. In 2010 Felienne founded Infotron, a startup that uses the algorithmsdeveloped during the PhD project to analyze spreadsheet quality for large companies. In her spare time,Felienne volunteers as a referee for the First Lego League, a world wide technology competition for kids.
Martin Pinzger is a full professor of Software Engineering and the head of the Software EngineeringResearch Group at the University of Klagenfurt, Austria. His research interests are in software engineeringwith focus on software evolution, software design, software quality analysis, collaborative software engi-neering, software repository mining, software visualization, and empirical studies in software engineering.He received a PhD in informatics from the Vienna University of Technology in 2005. He was a Postdoc atthe University of Zurich and an Assistant Professor at the Delft University of Technology from which hereceived tenure in 2012. In 2012, he won an NWO Vidi grant, one of the most prestigious Dutch individ-ual research grants. In 2013, he received an ICSE 2013 ACM SIGSOFT distinguished paper award and theICSM 2013 Most Influential Paper award.
Empir Software Eng
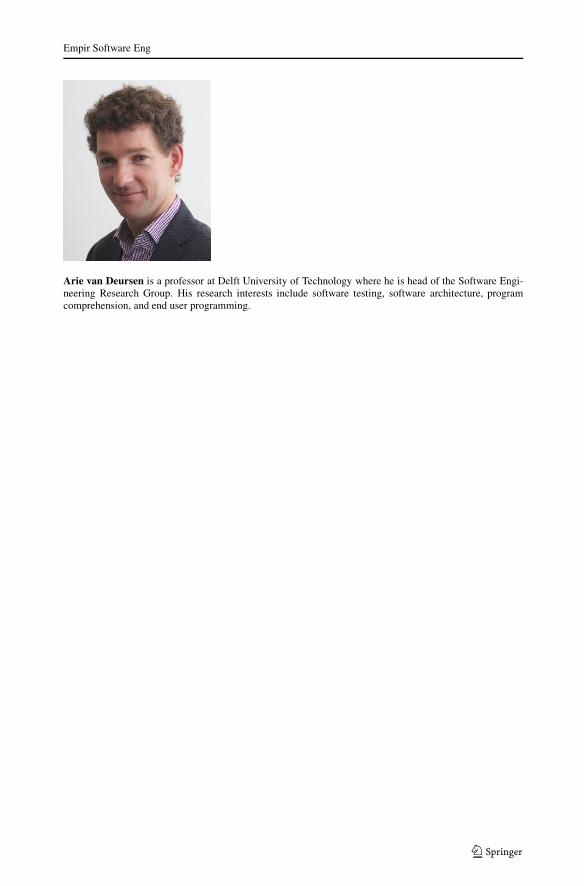
Arie van Deursen is a professor at Delft University of Technology where he is head of the Software Engi-neering Research Group. His research interests include software testing, software architecture, programcomprehension, and end user programming.

![Hryszko16 Defect Prediction with Bad Smells in Code · code smells metrics effectiveness in defect prediction process for Java pro-gramming language [7]. No code smells metrics for](https://img.pdfslide.us/doc/110x75/5f973522c7a749289f3ae87d/hryszko16-defect-prediction-with-bad-smells-in-code-code-smells-metrics-effectiveness.jpg)

![House of Cards: Code Smells in Open-source C# Repositories · 3) We exclude test code from the analysis since test code contains a different type of smells (i.e., test smells [18])](https://img.pdfslide.us/doc/110x75/5f63bde12a99b538ca0bc7a3/house-of-cards-code-smells-in-open-source-c-3-we-exclude-test-code-from-the-analysis.jpg)