Embed Size (px)
Citation preview
DETAILED PROJECT REPORT
ON
WHRS IN REFRIGERATION SYSTEM BY DE-SUPER
HEATER TECHNOLOGY (210 TRX01 NO)
(GUJARAT DAIRY CLUSTER)
Bureau of Energy Efficiency
Prepared By
Reviewed By
WASTE HEAT RECOVERY IN REFRIGERATION SYSTEM BY DE-SUPER HEATER TECHNOLOGY (210 TR)
GUJARAT DAIRY CLUSTER
BEE, 2010
Detailed Project Report on Waste Heat Recovery by De-super
Heater Technology (210 TR)
Gujarat Dairy Cluster, Gujarat (India)
New Delhi: Bureau of Energy Efficiency;
Detail Project Report No.: GUJ/DRY/DSH/05
For more information
Bureau of Energy Efficiency
Ministry of Power, Government of India
4th Floor, Sewa Bhawan, Sector - 1
R. K. Puram, New Delhi -110066
Ph: +91 11 26179699 Fax: 11 26178352
Email: [email protected]
WEB: www.bee-india.nic.in
Acknowledgement
We are sincerely thankful to the Bureau of Energy Efficiency, Ministry of Power, for giving us
the opportunity to implement the ‘BEE SME project in “Ahmedabad Dairy Cluster,
Ahmedabad”. We express our sincere gratitude to all concerned officials for their support and
guidance during the conduct of this exercise.
Dr. Ajay Mathur, Director General, BEE
Smt. Abha Shukla, Secretary, BEE
Shri Jitendra Sood, Energy Economist, BEE
Shri Pawan Kumar Tiwari, Advisor (SME), BEE
Shri Rajeev Yadav, Project Economist, BEE
Petroleum Conservation Research Association (PCRA) is also thankful to “Shri P.K.Sarkar,
OSD & other officials of Gujarat Co-operative Milk Marketing Federation (GCMMF) & its union
members” for their valuable inputs, co-operation, support and identification of the units for
energy use and technology audit studies and facilitating the implementation of BEE SME
program in Ahmedabad Dairy Cluster.
We take this opportunity to express our appreciation for the excellent support provided by
Dairy Unit Owners, Local Service Providers, and Equipment Suppliers for their active
involvement and their valuable inputs in making the program successful and in completion of
the Detailed Project Report (DPR).
PCRA is also thankful to all the SME owners, plant in charges and all workers of the SME
units for their support during the energy use and technology audit studies and in
implementation of the project objectives.
Petroleum Conservation Research Association
Ahmedabad
Contents
List of Annexure iv
List of Tables v
List of Figures vi
List of Abbreviation vii
Executive summary viii
About BEE’S SME program ix
1 INTRODUCTION ........................................................................................................... 1
1.1 Brief introduction about cluster ...................................................................................... 1
1.2 Energy performance in existing system ......................................................................... 7
1.2.1 Fuel consumption .......................................................................................................... 7
1.2.2 Average annual production ............................................................................................ 7
1.2.3 Specific energy consumption ......................................................................................... 9
1.3 Existing technology/equipment .................................................................................... 10
1.3.1 Description of existing technology ............................................................................... 10
1.3.2 Role in process ........................................................................................................... 12
1.4 Baseline establishment for existing technology ........................................................... 12
1.4.1 Design and operating parameters ............................................................................... 13
1.5 Barriers in adoption of proposed equipment ................................................................ 13
1.5.1 Technological barrier ................................................................................................... 13
1.5.2 Financial barrier .......................................................................................................... 14
1.5.3 Skilled manpower ........................................................................................................ 14
1.5.4 Other barrier (If any) .................................................................................................... 14
2. PROPOSED EQUIPMENT FOR ENERGY EFFICENCY IMPROVEMENT ................. 15
2.1 Description of proposed equipment ............................................................................. 15
2.1.1 Detailed of proposed equipment .................................................................................. 15
2.1.2 Equipment/technology specification ............................................................................ 18
2.1.3 Integration with existing equipment ............................................................................. 18
2.1.4 Superiority over existing system .................................................................................. 18
2.1.5 Source of equipment ................................................................................................... 19
2.1.6 Availability of technology/equipment ............................................................................ 19
2.1.7 Service providers ........................................................................................................ 19
2.1.8 Terms and conditions in sales of equipment ................................................................ 19
2.1.9 Process down time ...................................................................................................... 19
2.2 Life cycle assessment and risks analysis .................................................................... 19
2.3 Suitable unit for implementation of proposed technology ............................................. 20
3. ECONOMIC BENEFITS FROM PROPOSED TECHNOLOGY .................................... 21
3.1 Technical benefit ......................................................................................................... 21
3.1.1 Fuel saving .................................................................................................................. 21
3.1.2 Electricity saving ......................................................................................................... 21
3.1.3 Improvement in product quality.................................................................................... 21
3.1.4 Increase in production ................................................................................................. 21
3.1.5 Reduction in raw material ............................................................................................ 21
3.1.6 Reduction in other losses ............................................................................................ 21
3.2 Monetary benefits ........................................................................................................ 21
3.3 Social benefits ............................................................................................................. 21
3.3.1 Improvement in working environment .......................................................................... 21
3.3.2 Improvement in workers skill ....................................................................................... 21
3.4 Environmental benefits ................................................................................................ 22
3.4.1 Reduction in effluent generation .................................................................................. 22
3.4.2 Reduction in GHG emission ........................................................................................ 22
3.4.3 Reduction in other emissions like SOX ......................................................................... 22
4 INSTALLATION OF PROPOSED EQUIPMENT ......................................................... 23
4.1 Cost of project ............................................................................................................. 23
4.1.1 Equipment cost ........................................................................................................... 23
4.1.2 Erection, commissioning and other misc. cost ............................................................. 23
4.2 Arrangements of funds ................................................................................................ 23
4.2.1 Entrepreneur’s contribution ......................................................................................... 23
4.2.2 Loan amount. .............................................................................................................. 23
4.2.3 Terms & conditions of loan .......................................................................................... 23
4.3 Financial indicators...................................................................................................... 24
4.3.1 Cash flow analysis....................................................................................................... 24
4.3.2 Simple payback period ................................................................................................ 24
4.3.3 Net Present Value (NPV)............................................................................................. 24
4.3.4 Internal rate of return (IRR) ......................................................................................... 24
4.3.5 Return on investment (ROI) ......................................................................................... 24
4.4 Sensitivity analysis ...................................................................................................... 24
4.5 Procurement and implementation schedule ................................................................. 25
vii
List of Annexure
Annexure -1: Energy audit data used for baseline establishment ........................................ 26
Annexure -2: Process flow diagram after project implementation ........................................ 27
Annexure -3: Detailed technology assessment report ......................................................... 28
Annexure -4 Drawings for proposed electrical & civil works ................................................ 30
Annexure -5: Detailed financial analysis .............................................................................. 32
Annexure:-6 Procurement and implementation schedule ................................................... 36
Annexure -7: Details of technology service providers .......................................................... 37
Annexure–8: Quotations or Techno-commercial bids for new technology/equipment .......... 38
List of Table
Table 1.1 Details of annual energy consumption ...................................................................... 1
Table 1.2 Details of types of product manufactured .................................................................. 2
Table 1.3 Energy usages pattern .............................................................................................. 3
Table 1.4 Average fuel and electricity consumption .................................................................. 7
Table 1.5 Average annual production ....................................................................................... 8
Table 1.6 Process wise (Main Equipment) wise cost of energy consumption ........................... 9
Table 1.7 Energy charges ...................................................................................................... 11
Table 1.8 Demand charge ...................................................................................................... 12
Table 1.9 Baseline Establishment........................................................................................... 13
Table 2.1 Saving Potential ...................................................................................................... 15
Table 2.2 Technical Specification considered ......................................................................... 18
Table 4.1 Details of proposed technology project cost ............................................................ 23
Table 4.2 Financial indicators of proposed technology/equipment .......................................... 24
Table 4.3 Sensitivity analysis at different scenarios ................................................................ 25
Table 4.4 Procurement and implementation schedule ............................................................ 25
viii
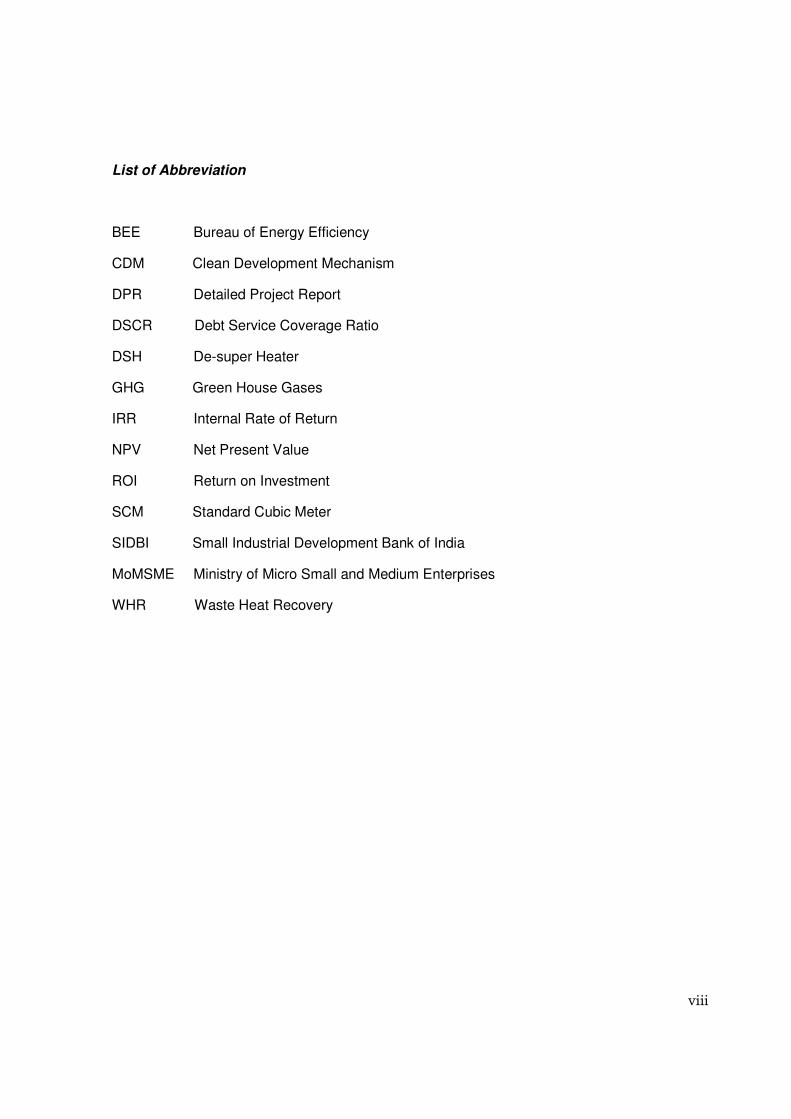
List of Abbreviation
BEE Bureau of Energy Efficiency
CDM Clean Development Mechanism
DPR Detailed Project Report
DSCR Debt Service Coverage Ratio
DSH De-super Heater
GHG Green House Gases
IRR Internal Rate of Return
NPV Net Present Value
ROI Return on Investment
SCM Standard Cubic Meter
SIDBI Small Industrial Development Bank of India
MoMSME Ministry of Micro Small and Medium Enterprises
WHR Waste Heat Recovery
ix
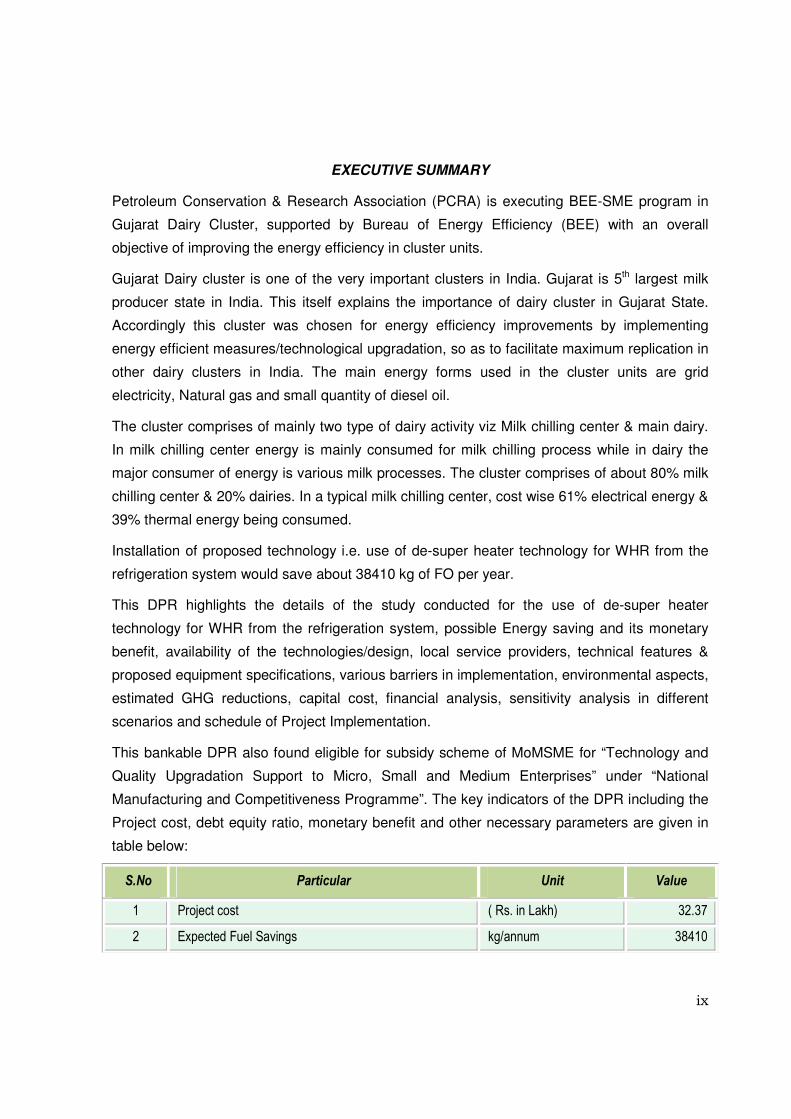
EXECUTIVE SUMMARY
Petroleum Conservation & Research Association (PCRA) is executing BEE-SME program in
Gujarat Dairy Cluster, supported by Bureau of Energy Efficiency (BEE) with an overall
objective of improving the energy efficiency in cluster units.
Gujarat Dairy cluster is one of the very important clusters in India. Gujarat is 5th largest milk
producer state in India. This itself explains the importance of dairy cluster in Gujarat State.
Accordingly this cluster was chosen for energy efficiency improvements by implementing
energy efficient measures/technological upgradation, so as to facilitate maximum replication in
other dairy clusters in India. The main energy forms used in the cluster units are grid
electricity, Natural gas and small quantity of diesel oil.
The cluster comprises of mainly two type of dairy activity viz Milk chilling center & main dairy.
In milk chilling center energy is mainly consumed for milk chilling process while in dairy the
major consumer of energy is various milk processes. The cluster comprises of about 80% milk
chilling center & 20% dairies. In a typical milk chilling center, cost wise 61% electrical energy &
39% thermal energy being consumed.
Installation of proposed technology i.e. use of de-super heater technology for WHR from the
refrigeration system would save about 38410 kg of FO per year.
This DPR highlights the details of the study conducted for the use of de-super heater
technology for WHR from the refrigeration system, possible Energy saving and its monetary
benefit, availability of the technologies/design, local service providers, technical features &
proposed equipment specifications, various barriers in implementation, environmental aspects,
estimated GHG reductions, capital cost, financial analysis, sensitivity analysis in different
scenarios and schedule of Project Implementation.
This bankable DPR also found eligible for subsidy scheme of MoMSME for “Technology and
Quality Upgradation Support to Micro, Small and Medium Enterprises” under “National
Manufacturing and Competitiveness Programme”. The key indicators of the DPR including the
Project cost, debt equity ratio, monetary benefit and other necessary parameters are given in
table below:
S.No Particular Unit Value
1 Project cost ( Rs. in Lakh) 32.37
2 Expected Fuel Savings kg/annum 38410
x
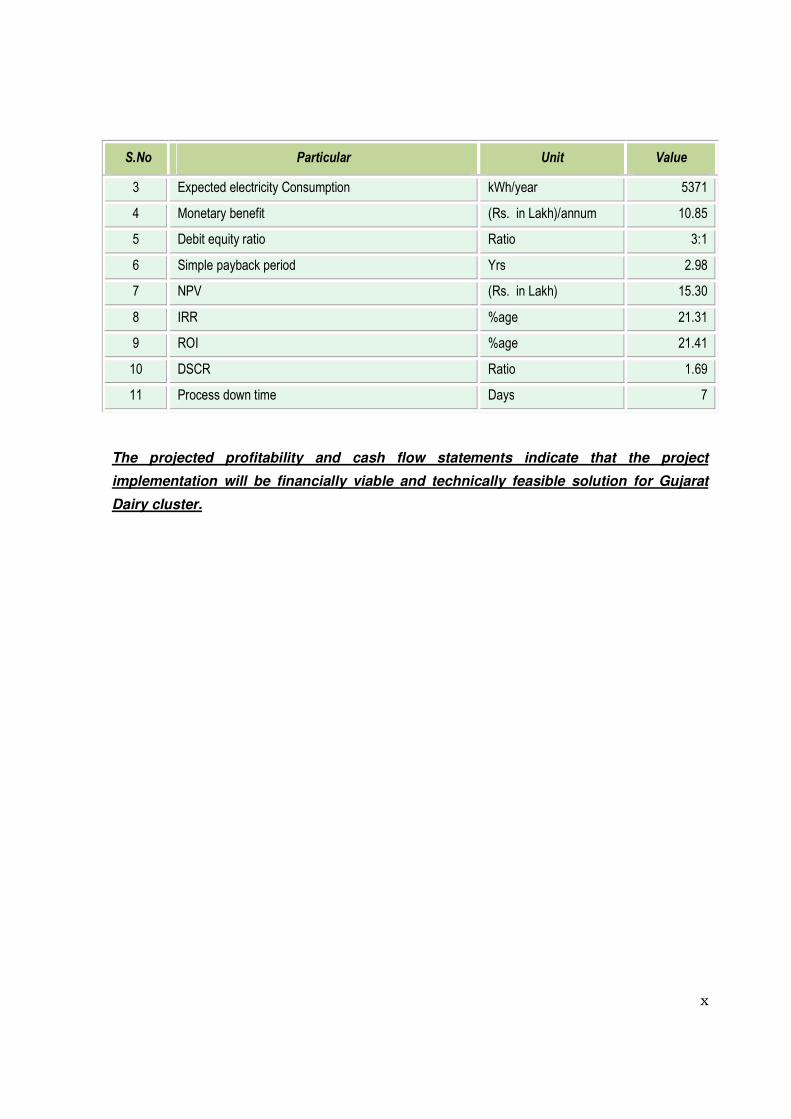
S.No Particular Unit Value
3 Expected electricity Consumption kWh/year 5371
4 Monetary benefit (Rs. in Lakh)/annum 10.85
5 Debit equity ratio Ratio 3:1
6 Simple payback period Yrs 2.98
7 NPV (Rs. in Lakh) 15.30
8 IRR %age 21.31
9 ROI %age 21.41
10 DSCR Ratio 1.69
11 Process down time Days 7
The projected profitability and cash flow statements indicate that the project
implementation will be financially viable and technically feasible solution for Gujarat
Dairy cluster.
xi
ABOUT BEE’S SME PROGRAM
Bureau of Energy Efficiency (BEE) is implementing a BEE-SME Programme to improve the
energy performance in 25 selected SMEs clusters. Gujarat Dairy Cluster is one of them. The
BEE’s SME Programme intends to enhance the energy efficiency awareness by
funding/subsidizing need based studies in SME clusters and giving energy conservation
recommendations. For addressing the specific problems of these SMEs and enhancing energy
efficiency in the clusters, BEE will be focusing on energy efficiency, energy conservation and
technology up-gradation through studies and pilot projects in these SMEs clusters.
Major activities in the BEE -SME program are furnished below:
Activity 1: Energy use and technology audit
The energy use technology studies would provide information on technology status, best
operating practices, gaps in skills and knowledge on energy conservation opportunities,
energy saving potential and new energy efficient technologies, etc for each of the sub sector in
SMEs.
Activity 2: Capacity building of stake holders in cluster on energy efficiency
In most of the cases SME entrepreneurs are dependent on the locally available technologies,
service providers for various reasons. To address this issue BEE has also undertaken capacity
building of local service providers and entrepreneurs/ Managers of SMEs on energy efficiency
improvement in their units as well as clusters. The local service providers will be trained in
order to be able to provide the local services in setting up of energy efficiency projects in the
clusters
Activity 3: Implementation of energy efficiency measures
To implement the technology up-gradation project in the clusters, BEE has proposed to
prepare the technology based detailed project reports (DPRs) for a minimum of five
technologies in three capacities for each technology.
Activity 4: Facilitation of innovative financing mechanisms for implementation of
energy efficiency projects
The objective of this activity is to facilitate the uptake of energy efficiency measures through
innovative financing mechanisms without creating market distortion.
WHRS In Refrigeration System (210 TRx01 No) By De-Super Heater Technology
1
1 INTRODUCTION
1.1 Brief introduction about cluster
The global objective of the BEE SME programme is to improve the energy intensity of the Indian
economy by undertaking actions in the SME sector which directly or indirectly produced 60% of
the GDP. The immediate objective of this programme is to create the awareness to accelerate
the adoption of EE technologies and practices in 29 chosen clusters in the SME sector through
knowledge sharing, capacity building and development of innovative financing mechanisms. To
build the energy efficiency awareness by funding/subsidizing need based studies in large
number units in the SMEs and giving energy conservation recommendations including
technology up-gradation opportunities.
Under “BEE-SME Programme - Gujarat Dairy”, the primary task was to carry preliminary energy
audit in 15 units & detail audit in 7 units. The aim of conducting preliminary energy audit in 15
Units is to identify the areas of high energy consumption and to carry out detailed audit and
comprehensive technology gap assessment in remaining 7 Units. Preliminary energy audit has
been carried out for, assessing the overall energy use in the unit, based on measurements such
as various monthly energy consumption rate, production rate, temperature measurement of
thermal & chilling system, illumination etc. Energy audit and Technology gap assessment study
at the plant results in identification of the following energy saving opportunities and however the
detail calculations of the identified saving measures is given in detail energy audit study.
The main form of energy used by the cluster units are grid electricity, Natural Gas, charcoal,
lignite, and diesel oil. Major consumptions of energy are in the form of Natural Gas and lignite.
Details of total energy consumption at Gujarat Dairy cluster are furnished in Table 1.1 below:
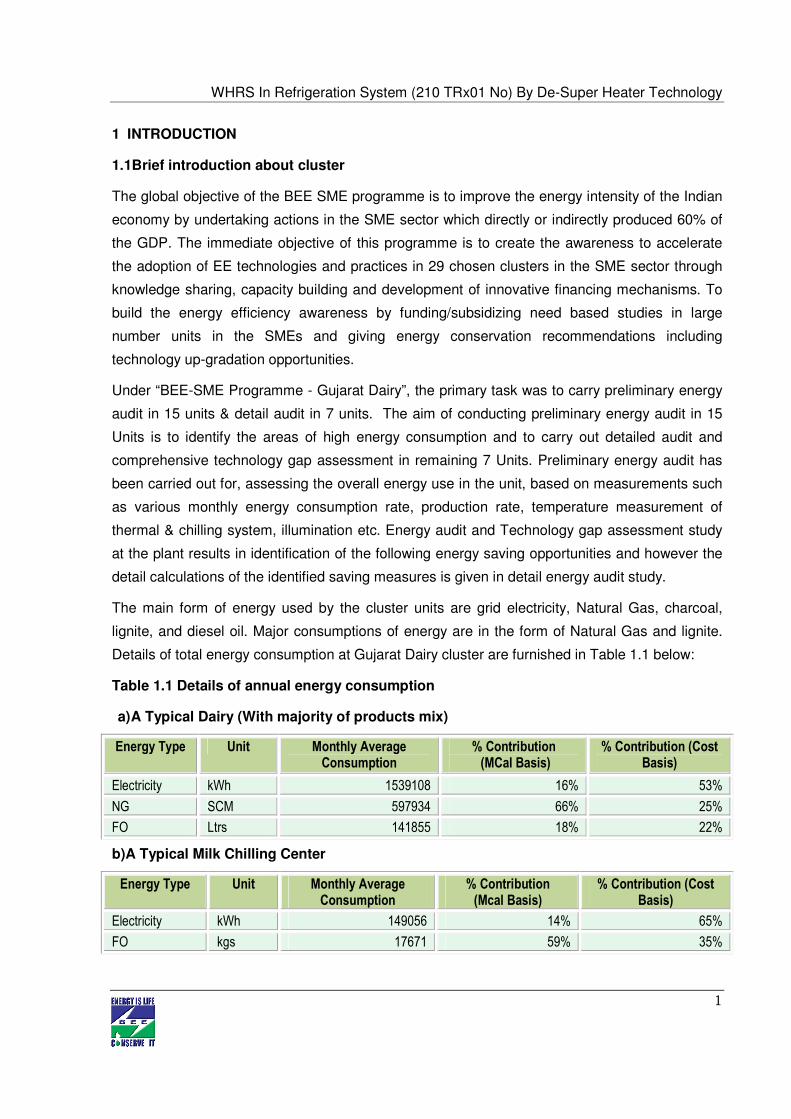
Table 1.1 Details of annual energy consumption
a) A Typical Dairy (With majority of products mix)
Energy Type Unit Monthly Average Consumption
% Contribution (MCal Basis)
% Contribution (Cost Basis)
Electricity kWh 1539108 16% 53%
NG SCM 597934 66% 25%
FO Ltrs 141855 18% 22%
b)A Typical Milk Chilling Center
Energy Type Unit Monthly Average Consumption
% Contribution (Mcal Basis)
% Contribution (Cost Basis)
Electricity kWh 149056 14% 65%
FO kgs 17671 59% 35%
WHRS In Refrigeration System (210 TRx01 No) By De-Super Heater Technology
2
Classification of Units
The Gujarat Dairy Cluster units can be broadly categorized into two types based on types of
process.
� Milk Chilling Center
� Dairy Units
Preliminary Energy Carried in 15 Nos. of units out of which 12 Nos. milk chilling centers & 03
Nos. are dairies. Detailed Energy audit carried in 7 units out which 5 Nos. of Dairies & 02 Nos. of
milk chilling center.
Products Manufactured
The various product manufactured in dairies covered under ‘Gujarat Dairy Cluster’ are as follow-
Dairies process following products from Milk while milk chilling center collects milk, weighs, chills
& dispatch to dairy.
1) Tea Milk / Tone Milk
2) Tetra Pack Milk
3) Butter Milk / Flavored Milk
4) Milk Cream / Curd
5) Ghee / Butter
6) Paneer / Cheese
7) Skimmed Milk Powder
8) Whole Milk Powder
9) Baby Food (Milk Powder Based)
10) Ice Cream / Indian Sweets.
In dairy industry production capacity is mainly decided by milk processed in kgs(Ltrs) per day.
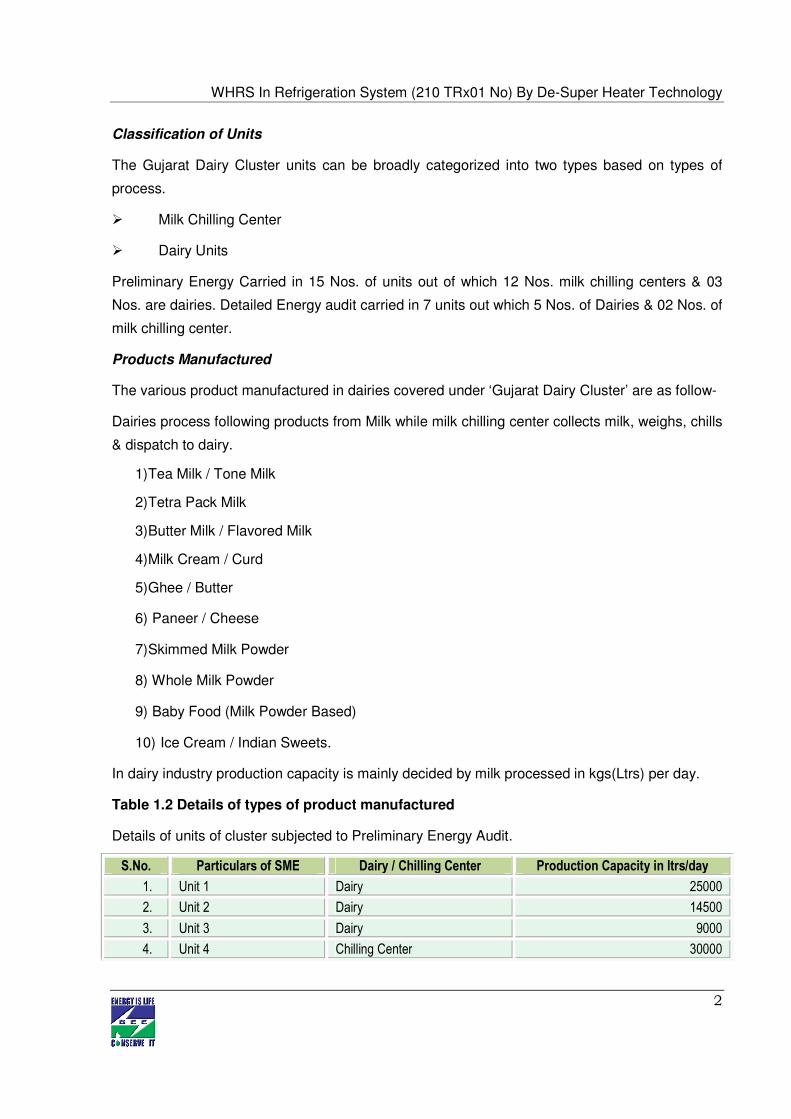
Table 1.2 Details of types of product manufactured
Details of units of cluster subjected to Preliminary Energy Audit.
S.No. Particulars of SME Dairy / Chilling Center Production Capacity in ltrs/day
1. Unit 1 Dairy 25000
2. Unit 2 Dairy 14500
3. Unit 3 Dairy 9000
4. Unit 4 Chilling Center 30000
WHRS In Refrigeration System (210 TRx01 No) By De-Super Heater Technology
3
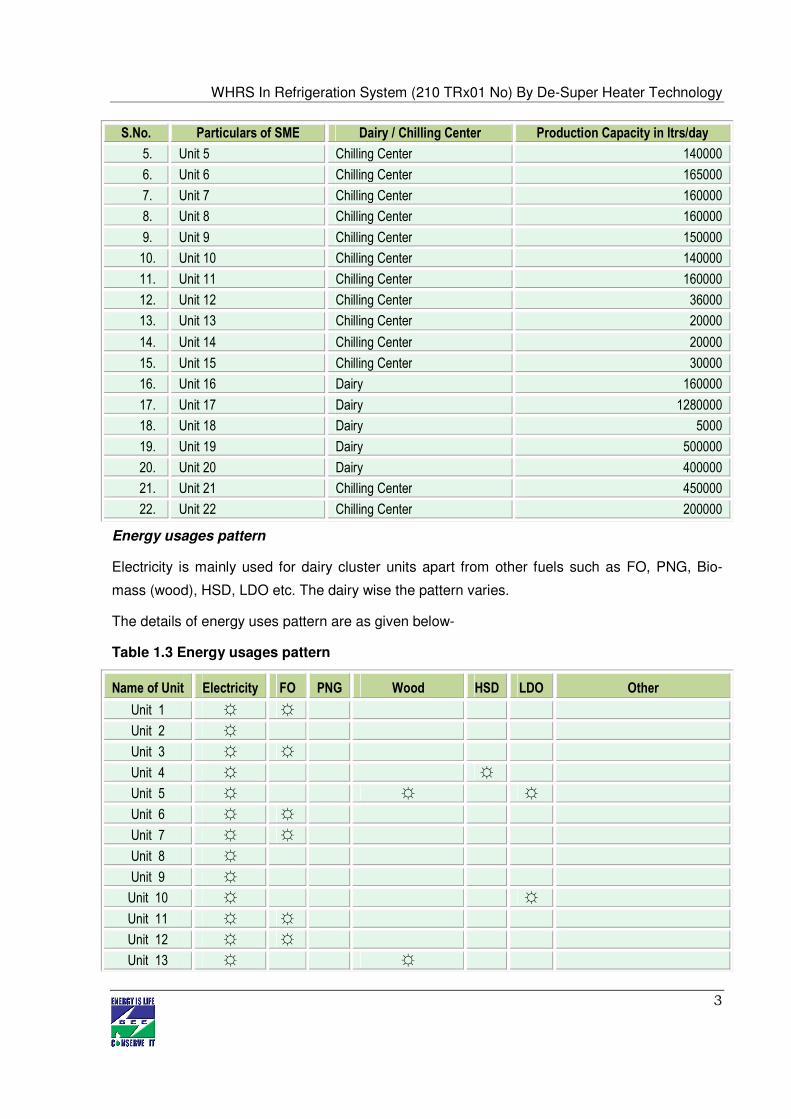
S.No. Particulars of SME Dairy / Chilling Center Production Capacity in ltrs/day
5. Unit 5 Chilling Center 140000
6. Unit 6 Chilling Center 165000
7. Unit 7 Chilling Center 160000
8. Unit 8 Chilling Center 160000
9. Unit 9 Chilling Center 150000
10. Unit 10 Chilling Center 140000
11. Unit 11 Chilling Center 160000
12. Unit 12 Chilling Center 36000
13. Unit 13 Chilling Center 20000
14. Unit 14 Chilling Center 20000
15. Unit 15 Chilling Center 30000
16. Unit 16 Dairy 160000
17. Unit 17 Dairy 1280000
18. Unit 18 Dairy 5000
19. Unit 19 Dairy 500000
20. Unit 20 Dairy 400000
21. Unit 21 Chilling Center 450000
22. Unit 22 Chilling Center 200000
Energy usages pattern
Electricity is mainly used for dairy cluster units apart from other fuels such as FO, PNG, Bio-
mass (wood), HSD, LDO etc. The dairy wise the pattern varies.
The details of energy uses pattern are as given below-
Table 1.3 Energy usages pattern
Name of Unit Electricity FO PNG Wood HSD LDO Other
Unit 1 ☼ ☼
Unit 2 ☼
Unit 3 ☼ ☼
Unit 4 ☼ ☼
Unit 5 ☼ ☼ ☼
Unit 6 ☼ ☼
Unit 7 ☼ ☼
Unit 8 ☼
Unit 9 ☼
Unit 10 ☼ ☼
Unit 11 ☼ ☼
Unit 12 ☼ ☼
Unit 13 ☼ ☼
WHRS In Refrigeration System (210 TRx01 No) By De-Super Heater Technology
4
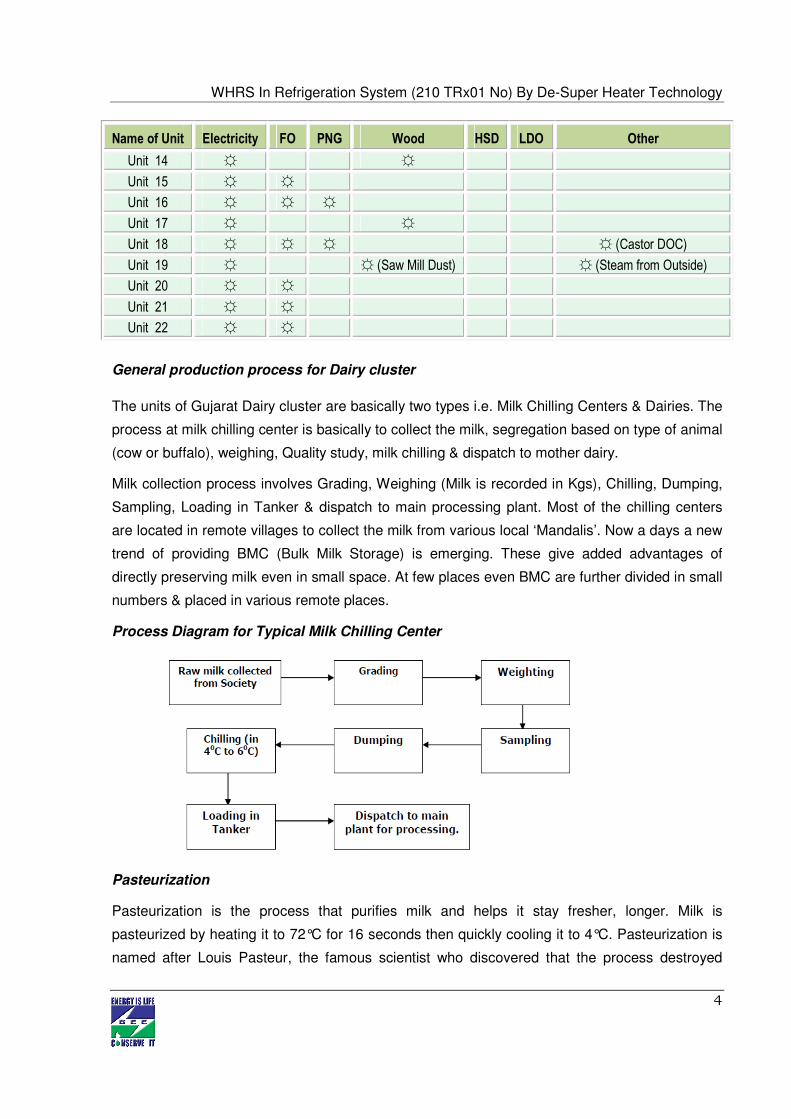
Name of Unit Electricity FO PNG Wood HSD LDO Other
Unit 14 ☼ ☼
Unit 15 ☼ ☼
Unit 16 ☼ ☼ ☼
Unit 17 ☼ ☼
Unit 18 ☼ ☼ ☼ ☼ (Castor DOC)
Unit 19 ☼ ☼ (Saw Mill Dust) ☼ (Steam from Outside)
Unit 20 ☼ ☼
Unit 21 ☼ ☼
Unit 22 ☼ ☼
General production process for Dairy cluster
The units of Gujarat Dairy cluster are basically two types i.e. Milk Chilling Centers & Dairies. The
process at milk chilling center is basically to collect the milk, segregation based on type of animal
(cow or buffalo), weighing, Quality study, milk chilling & dispatch to mother dairy.
Milk collection process involves Grading, Weighing (Milk is recorded in Kgs), Chilling, Dumping,
Sampling, Loading in Tanker & dispatch to main processing plant. Most of the chilling centers
are located in remote villages to collect the milk from various local ‘Mandalis’. Now a days a new
trend of providing BMC (Bulk Milk Storage) is emerging. These give added advantages of
directly preserving milk even in small space. At few places even BMC are further divided in small
numbers & placed in various remote places.
Process Diagram for Typical Milk Chilling Center
Pasteurization
Pasteurization is the process that purifies milk and helps it stay fresher, longer. Milk is
pasteurized by heating it to 72°C for 16 seconds then quickly cooling it to 4°C. Pasteurization is
named after Louis Pasteur, the famous scientist who discovered that the process destroyed
WHRS In Refrigeration System (210 TRx01 No) By De-Super Heater Technology
5
bacteria that naturally develops in raw milk. By destroying the bacteria, milk becomes safe to
drink and holds its delicious flavor for much longer.
Homogenization
Milk must then be homogenized. Without homogenization, the milk fat would separate from the
milk and rise to the top. Milk fat is what gives milk its rich and creamy taste. Homogenization
makes sure that the fat is spread out evenly in the milk so that every sip of milk has the same
delicious flavor and creamy texture. Milk is transferred to a piece of equipment called a
homogenizer. In this machine the milk fat is forced, under high pressure, through tiny holes that
break the fat cells up in to tiny particles, 1/8 their original size. Protein, contained in the milk,
quickly forms around each particle and this prevents the fat from rejoining. The milk fat cells then
stay suspended evenly throughout the milk.
Packaging Milk
Milk is pumped through automatic filling machines direct into bags, cartons and jugs. The
machines are carefully sanitized and packages are filled and sealed without human hands. This
keeps outside bacteria out of the milk which helps keep the milk stay fresh. During the entire
time that milk is at the dairy, it is kept at 1° - 2°C. This prevents the development of extra
bacteria and keeps the milk its freshest.
Cream Extraction & Butter
Milk cream is extracted from Milk using centrifuge. The butter making process involves quite a
number of stages. The continuous butter maker has become the most common type of
equipment used. The cream can be either supplied by a fluid milk dairy or separated from whole
milk by the butter manufacturer. The cream should be sweet (pH >6.6, TA = 0.10 - 0.12%), not
rancid and not oxidized. If the cream is separated by the butter manufacturer, the whole milk is
preheated to the required temperature in a milk pasteurizer before being passed through a
separator. The cream is cooled and led to a storage tank where the fat content is analyzed and
adjusted to the desired value, if necessary. It is usually destined for concentration and drying.
From the intermediate storage tanks, the cream goes to pasteurization at a temperature of 95oC
or more. The high temperature is needed to destroy enzymes and micro-organisms that would
impair the keeping quality of the butter.
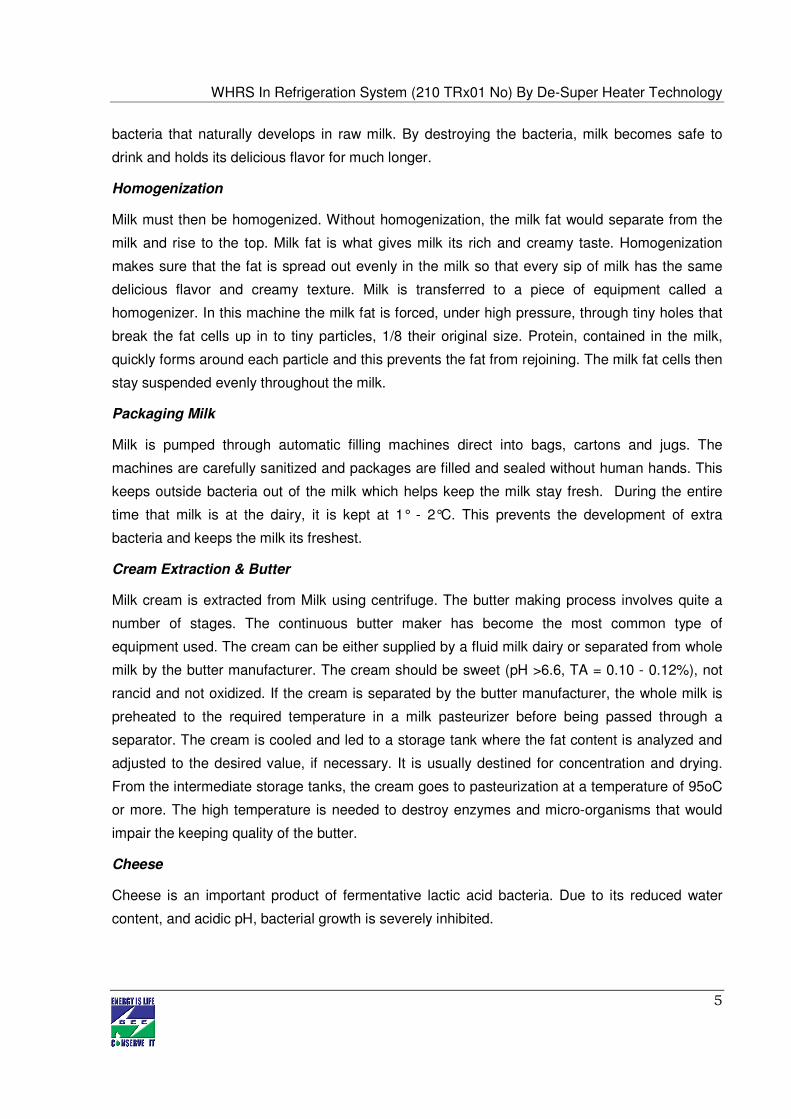
Cheese
Cheese is an important product of fermentative lactic acid bacteria. Due to its reduced water
content, and acidic pH, bacterial growth is severely inhibited.
WHRS In Refrigeration System (210 TRx01 No) By De-Super Heater Technology
6
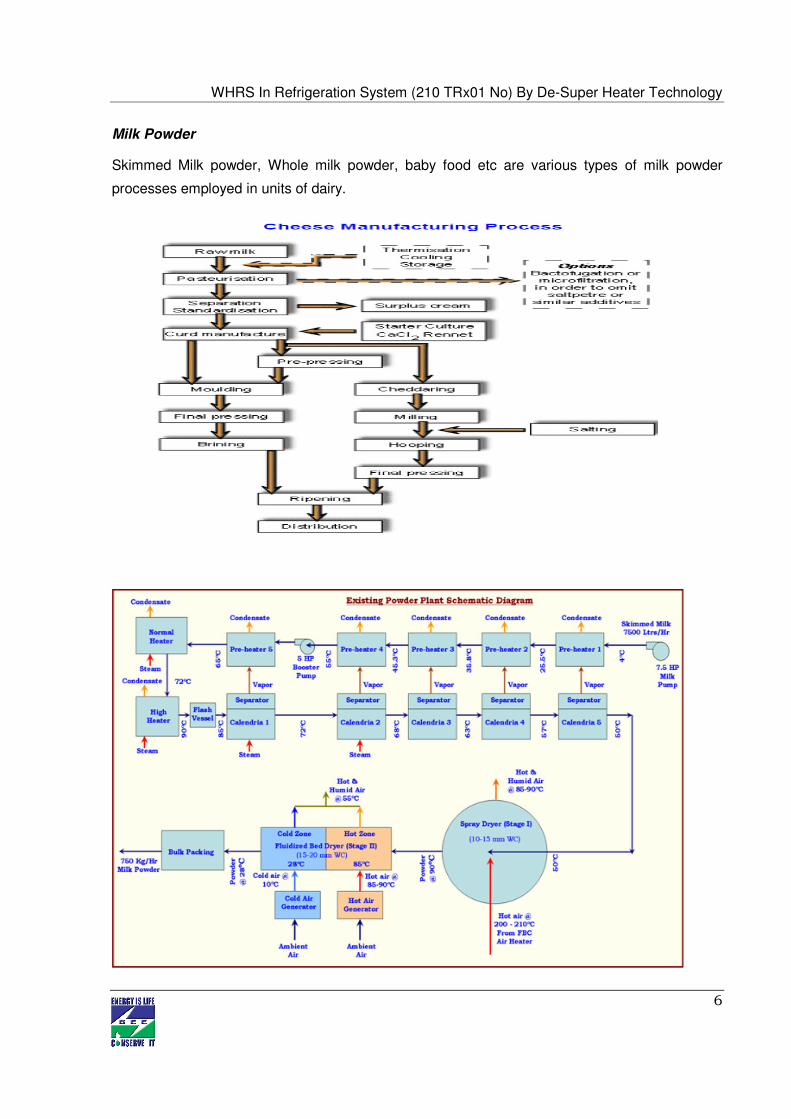
Milk Powder
Skimmed Milk powder, Whole milk powder, baby food etc are various types of milk powder
processes employed in units of dairy.
WHRS In Refrigeration System (210 TRx01 No) By De-Super Heater Technology
7
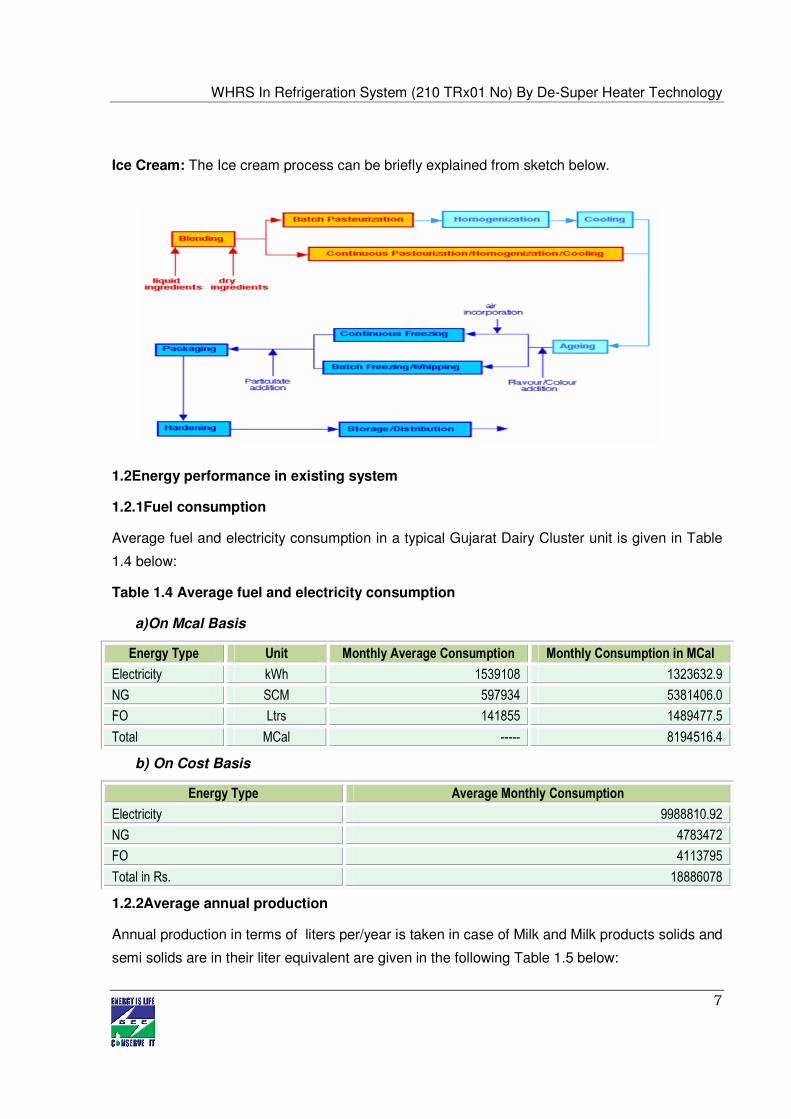
Ice Cream: The Ice cream process can be briefly explained from sketch below.
1.2 Energy performance in existing system
1.2.1Fuel consumption
Average fuel and electricity consumption in a typical Gujarat Dairy Cluster unit is given in Table
1.4 below:
Table 1.4 Average fuel and electricity consumption
a) On Mcal Basis
Energy Type Unit Monthly Average Consumption Monthly Consumption in MCal
Electricity kWh 1539108 1323632.9
NG SCM 597934 5381406.0
FO Ltrs 141855 1489477.5
Total MCal ----- 8194516.4
b) On Cost Basis
Energy Type Average Monthly Consumption
Electricity 9988810.92
NG 4783472
FO 4113795
Total in Rs. 18886078
1.2.2Average annual production
Annual production in terms of liters per/year is taken in case of Milk and Milk products solids and
semi solids are in their liter equivalent are given in the following Table 1.5 below:
WHRS In Refrigeration System (210 TRx01 No) By De-Super Heater Technology
8
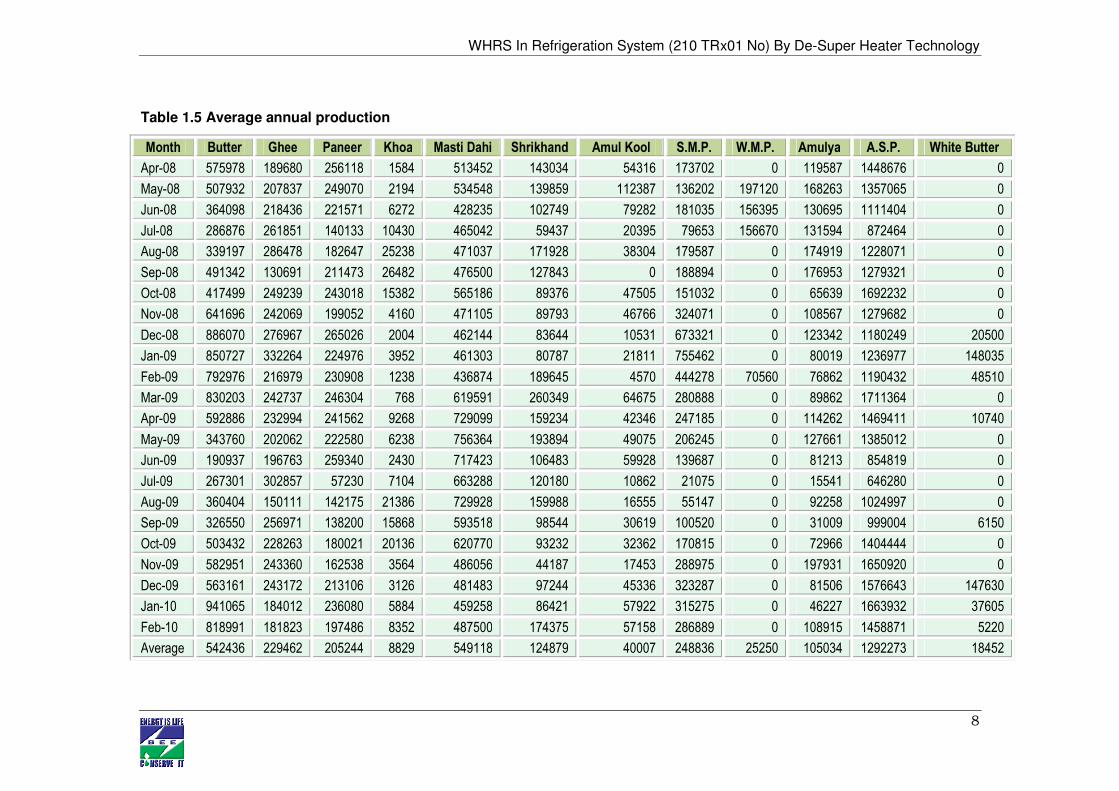
Table 1.5 Average annual production
Month Butter Ghee Paneer Khoa Masti Dahi Shrikhand Amul Kool S.M.P. W.M.P. Amulya A.S.P. White Butter
Apr-08 575978 189680 256118 1584 513452 143034 54316 173702 0 119587 1448676 0
May-08 507932 207837 249070 2194 534548 139859 112387 136202 197120 168263 1357065 0
Jun-08 364098 218436 221571 6272 428235 102749 79282 181035 156395 130695 1111404 0
Jul-08 286876 261851 140133 10430 465042 59437 20395 79653 156670 131594 872464 0
Aug-08 339197 286478 182647 25238 471037 171928 38304 179587 0 174919 1228071 0
Sep-08 491342 130691 211473 26482 476500 127843 0 188894 0 176953 1279321 0
Oct-08 417499 249239 243018 15382 565186 89376 47505 151032 0 65639 1692232 0
Nov-08 641696 242069 199052 4160 471105 89793 46766 324071 0 108567 1279682 0
Dec-08 886070 276967 265026 2004 462144 83644 10531 673321 0 123342 1180249 20500
Jan-09 850727 332264 224976 3952 461303 80787 21811 755462 0 80019 1236977 148035
Feb-09 792976 216979 230908 1238 436874 189645 4570 444278 70560 76862 1190432 48510
Mar-09 830203 242737 246304 768 619591 260349 64675 280888 0 89862 1711364 0
Apr-09 592886 232994 241562 9268 729099 159234 42346 247185 0 114262 1469411 10740
May-09 343760 202062 222580 6238 756364 193894 49075 206245 0 127661 1385012 0
Jun-09 190937 196763 259340 2430 717423 106483 59928 139687 0 81213 854819 0
Jul-09 267301 302857 57230 7104 663288 120180 10862 21075 0 15541 646280 0
Aug-09 360404 150111 142175 21386 729928 159988 16555 55147 0 92258 1024997 0
Sep-09 326550 256971 138200 15868 593518 98544 30619 100520 0 31009 999004 6150
Oct-09 503432 228263 180021 20136 620770 93232 32362 170815 0 72966 1404444 0
Nov-09 582951 243360 162538 3564 486056 44187 17453 288975 0 197931 1650920 0
Dec-09 563161 243172 213106 3126 481483 97244 45336 323287 0 81506 1576643 147630
Jan-10 941065 184012 236080 5884 459258 86421 57922 315275 0 46227 1663932 37605
Feb-10 818991 181823 197486 8352 487500 174375 57158 286889 0 108915 1458871 5220
Average 542436 229462 205244 8829 549118 124879 40007 248836 25250 105034 1292273 18452
WHRS IN REFRIGERATION SYSTEM (210 TRX01 NO) BY DE-SUPER HEATER TECHNOLOGY
9
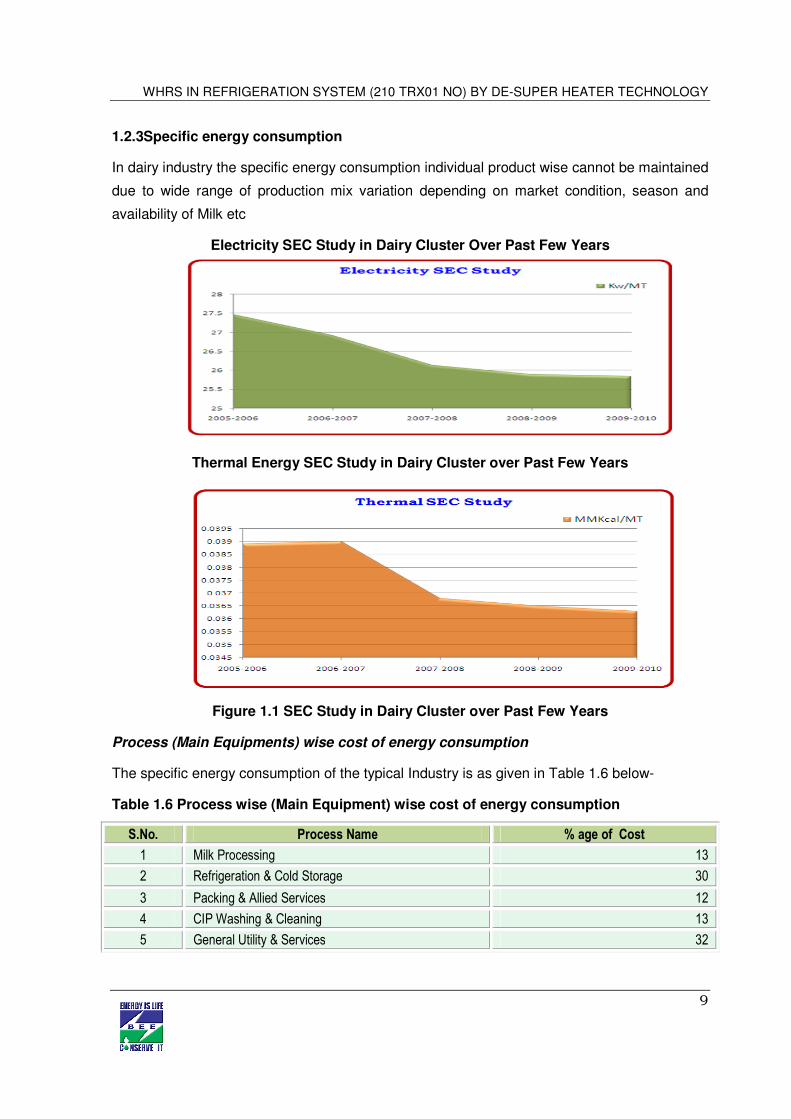
1.2.3Specific energy consumption
In dairy industry the specific energy consumption individual product wise cannot be maintained
due to wide range of production mix variation depending on market condition, season and
availability of Milk etc
Electricity SEC Study in Dairy Cluster Over Past Few Years
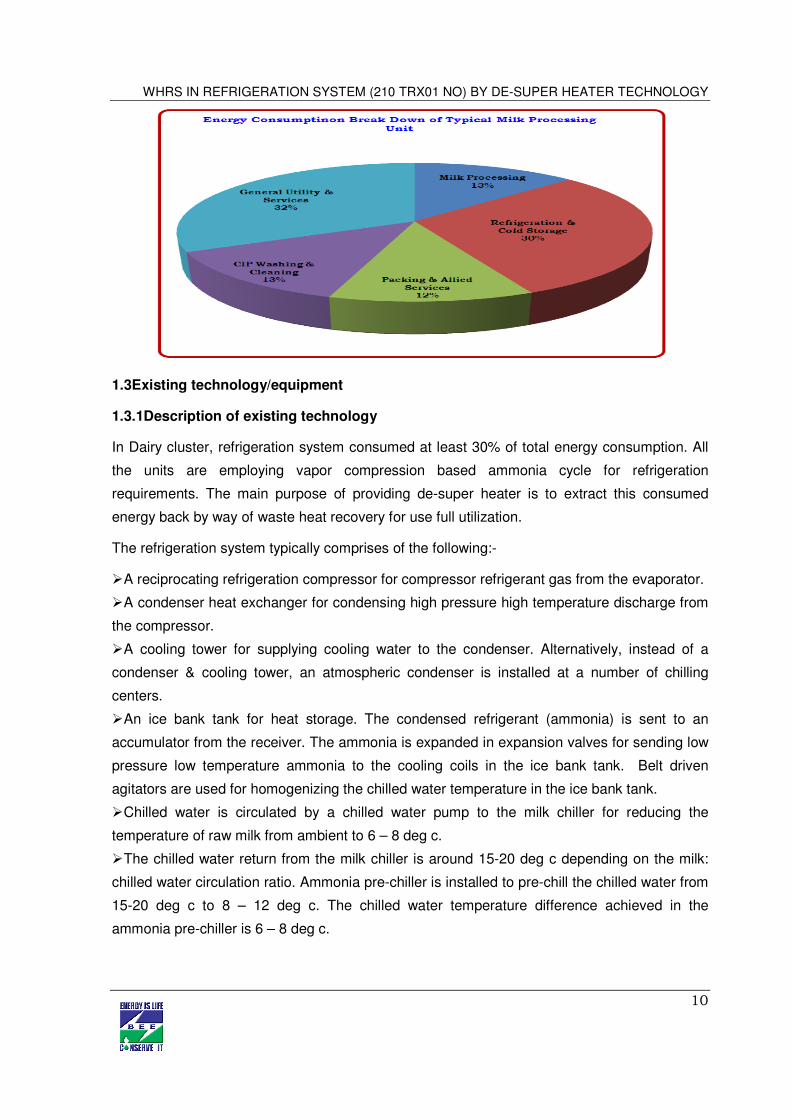
Thermal Energy SEC Study in Dairy Cluster over Past Few Years
Figure 1.1 SEC Study in Dairy Cluster over Past Few Years
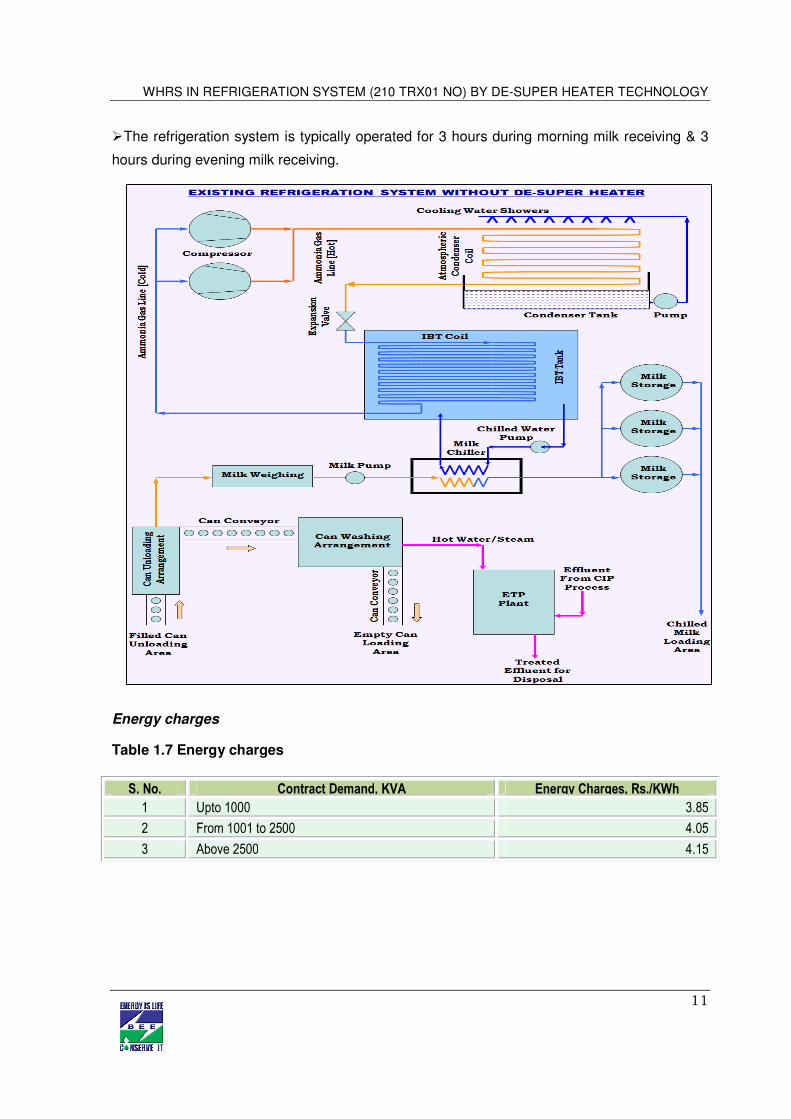
Process (Main Equipments) wise cost of energy consumption
The specific energy consumption of the typical Industry is as given in Table 1.6 below-
Table 1.6 Process wise (Main Equipment) wise cost of energy consumption
S.No. Process Name % age of Cost
1 Milk Processing 13
2 Refrigeration & Cold Storage 30
3 Packing & Allied Services 12
4 CIP Washing & Cleaning 13
5 General Utility & Services 32
WHRS IN REFRIGERATION SYSTEM (210 TRX01 NO) BY DE-SUPER HEATER TECHNOLOGY
10
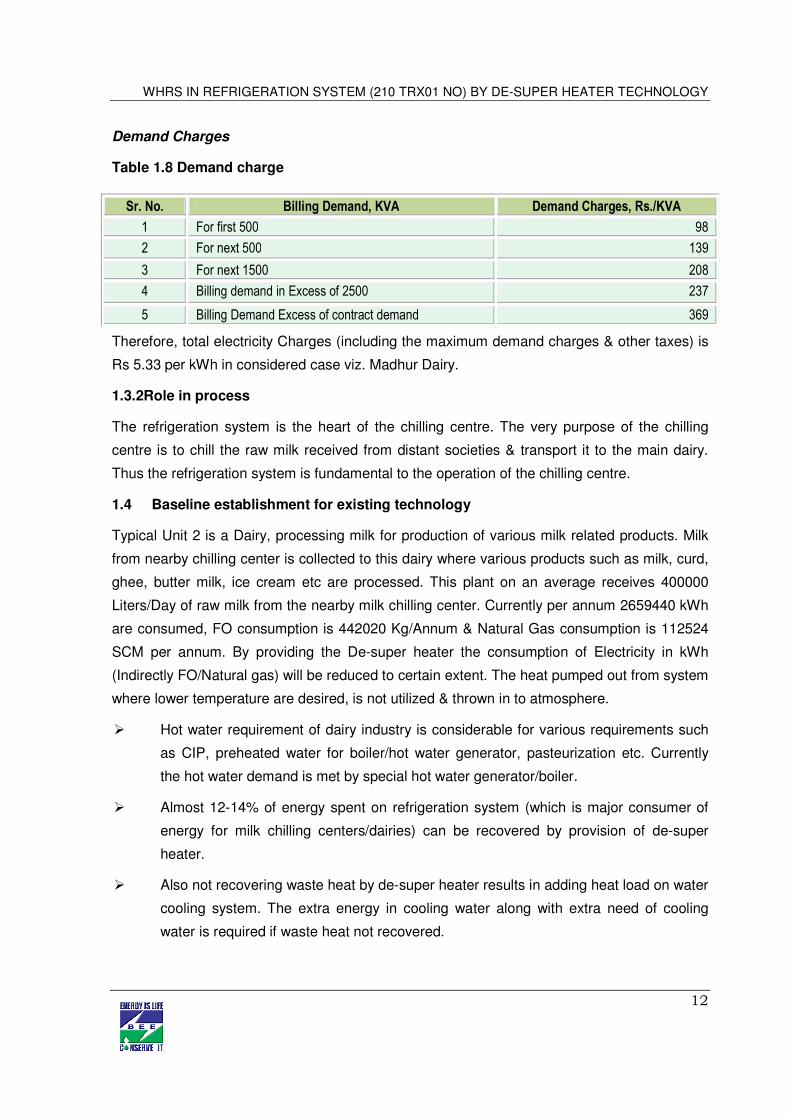
1.3 Existing technology/equipment
1.3.1Description of existing technology
In Dairy cluster, refrigeration system consumed at least 30% of total energy consumption. All
the units are employing vapor compression based ammonia cycle for refrigeration
requirements. The main purpose of providing de-super heater is to extract this consumed
energy back by way of waste heat recovery for use full utilization.
The refrigeration system typically comprises of the following:-
� A reciprocating refrigeration compressor for compressor refrigerant gas from the evaporator.
� A condenser heat exchanger for condensing high pressure high temperature discharge from
the compressor.
� A cooling tower for supplying cooling water to the condenser. Alternatively, instead of a
condenser & cooling tower, an atmospheric condenser is installed at a number of chilling
centers.
� An ice bank tank for heat storage. The condensed refrigerant (ammonia) is sent to an
accumulator from the receiver. The ammonia is expanded in expansion valves for sending low
pressure low temperature ammonia to the cooling coils in the ice bank tank. Belt driven
agitators are used for homogenizing the chilled water temperature in the ice bank tank.
� Chilled water is circulated by a chilled water pump to the milk chiller for reducing the
temperature of raw milk from ambient to 6 – 8 deg c.
� The chilled water return from the milk chiller is around 15-20 deg c depending on the milk:
chilled water circulation ratio. Ammonia pre-chiller is installed to pre-chill the chilled water from
15-20 deg c to 8 – 12 deg c. The chilled water temperature difference achieved in the
ammonia pre-chiller is 6 – 8 deg c.
WHRS IN REFRIGERATION SYSTEM (210 TRX01 NO) BY DE-SUPER HEATER TECHNOLOGY
11
� The refrigeration system is typically operated for 3 hours during morning milk receiving & 3
hours during evening milk receiving.
Energy charges
Table 1.7 Energy charges
S. No. Contract Demand, KVA Energy Charges, Rs./KWh
1 Upto 1000 3.85
2 From 1001 to 2500 4.05
3 Above 2500 4.15
WHRS IN REFRIGERATION SYSTEM (210 TRX01 NO) BY DE-SUPER HEATER TECHNOLOGY
12
Demand Charges
Table 1.8 Demand charge
Therefore, total electricity Charges (including the maximum demand charges & other taxes) is
Rs 5.33 per kWh in considered case viz. Madhur Dairy.
1.3.2Role in process
The refrigeration system is the heart of the chilling centre. The very purpose of the chilling
centre is to chill the raw milk received from distant societies & transport it to the main dairy.
Thus the refrigeration system is fundamental to the operation of the chilling centre.
1.4 Baseline establishment for existing technology
Typical Unit 2 is a Dairy, processing milk for production of various milk related products. Milk
from nearby chilling center is collected to this dairy where various products such as milk, curd,
ghee, butter milk, ice cream etc are processed. This plant on an average receives 400000
Liters/Day of raw milk from the nearby milk chilling center. Currently per annum 2659440 kWh
are consumed, FO consumption is 442020 Kg/Annum & Natural Gas consumption is 112524
SCM per annum. By providing the De-super heater the consumption of Electricity in kWh
(Indirectly FO/Natural gas) will be reduced to certain extent. The heat pumped out from system
where lower temperature are desired, is not utilized & thrown in to atmosphere.
� Hot water requirement of dairy industry is considerable for various requirements such
as CIP, preheated water for boiler/hot water generator, pasteurization etc. Currently
the hot water demand is met by special hot water generator/boiler.
� Almost 12-14% of energy spent on refrigeration system (which is major consumer of
energy for milk chilling centers/dairies) can be recovered by provision of de-super
heater.
� Also not recovering waste heat by de-super heater results in adding heat load on water
cooling system. The extra energy in cooling water along with extra need of cooling
water is required if waste heat not recovered.
Sr. No. Billing Demand, KVA Demand Charges, Rs./KVA
1 For first 500 98
2 For next 500 139
3 For next 1500 208
4 Billing demand in Excess of 2500 237
5 Billing Demand Excess of contract demand 369
WHRS IN REFRIGERATION SYSTEM (210 TRX01 NO) BY DE-SUPER HEATER TECHNOLOGY
13
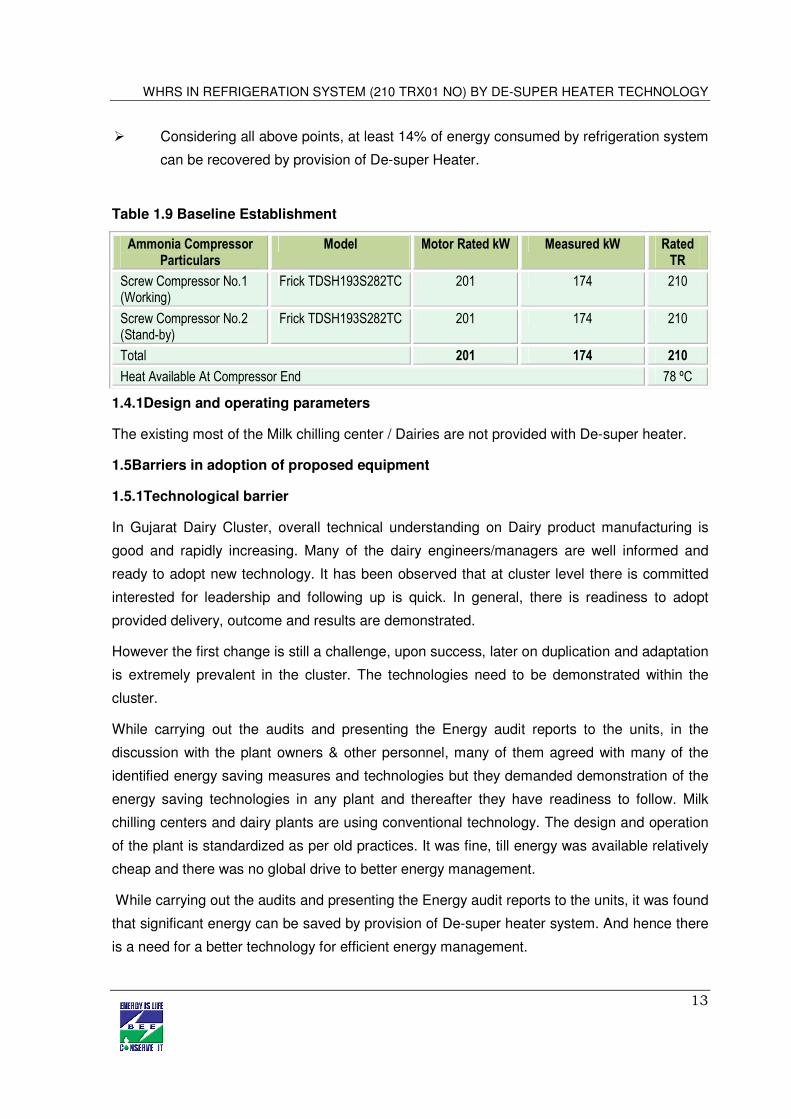
� Considering all above points, at least 14% of energy consumed by refrigeration system
can be recovered by provision of De-super Heater.
Table 1.9 Baseline Establishment
Ammonia Compressor Particulars
Model Motor Rated kW Measured kW Rated TR
Screw Compressor No.1 (Working)
Frick TDSH193S282TC 201 174 210
Screw Compressor No.2 (Stand-by)
Frick TDSH193S282TC 201 174 210
Total 201 174 210
Heat Available At Compressor End 78 ºC
1.4.1Design and operating parameters
The existing most of the Milk chilling center / Dairies are not provided with De-super heater.
1.5 Barriers in adoption of proposed equipment
1.5.1Technological barrier
In Gujarat Dairy Cluster, overall technical understanding on Dairy product manufacturing is
good and rapidly increasing. Many of the dairy engineers/managers are well informed and
ready to adopt new technology. It has been observed that at cluster level there is committed
interested for leadership and following up is quick. In general, there is readiness to adopt
provided delivery, outcome and results are demonstrated.
However the first change is still a challenge, upon success, later on duplication and adaptation
is extremely prevalent in the cluster. The technologies need to be demonstrated within the
cluster.
While carrying out the audits and presenting the Energy audit reports to the units, in the
discussion with the plant owners & other personnel, many of them agreed with many of the
identified energy saving measures and technologies but they demanded demonstration of the
energy saving technologies in any plant and thereafter they have readiness to follow. Milk
chilling centers and dairy plants are using conventional technology. The design and operation
of the plant is standardized as per old practices. It was fine, till energy was available relatively
cheap and there was no global drive to better energy management.
While carrying out the audits and presenting the Energy audit reports to the units, it was found
that significant energy can be saved by provision of De-super heater system. And hence there
is a need for a better technology for efficient energy management.
WHRS IN REFRIGERATION SYSTEM (210 TRX01 NO) BY DE-SUPER HEATER TECHNOLOGY
14
1.5.2Financial barrier
Availing finance is not the major issue. Among the SMEs, the larger units, if convinced are
capable of either financing it themselves or get the finance from their banks. The smaller units
will require competitive loan and other support to raise the loan. However as most of them
have been able to expand their setup and grow, there is readiness to spend for energy
efficiency technologies which have good returns. Energy Efficiency Financing Schemes such
as SIDBI’s, if focused on the cluster, will play a catalytic role in implementation of identified
energy conservation projects & technologies.
The cluster has significant potential of technological upgradation. However though there are
good returns, this project is highly capital intensive and requires support of policy as well as
innovative financial mechanisms. CDM needs to be duly applied to generate additional cash
flow to further improve the returns from the project.
1.5.3Skilled manpower
In Gujarat Dairy cluster, the availability of skilled manpower is one of the problems due to
more number of units. Local technical persons available at individual location take care of
maintenance or repair works of major equipments. Maintenance or repair work of major
equipments of Dairy cluster units like ammonia compressors, hot air generators for spray
dryers etc, are generally taken care by the equipment suppliers itself as they station one of
their experienced technical representatives at Ahmadabad for the maintenance work.
Specialized and focused training of the local service providers on better operation and
maintenance of the equipments, importance of the energy and its use and energy
conservation measures will improve awareness among the unit owners and workforce.
Original equipment suppliers should also participate in these programs.
1.5.4 Other barrier (If any)
Due to high TDS In the area & due to high iron contain in water, the scaling can be a problem
due to certain extent. To overcome the problem the de-super heater system provided with
water softening arrangement.
WHRS IN REFRIGERATION SYSTEM (210 TRX01 NO) BY DE-SUPER HEATER TECHNOLOGY
15
2. PROPOSED EQUIPMENT FOR ENERGY EFFICENCY IMPROVEMENT
2.1 Description of proposed equipment
De-super heaters are heat recovery heat exchangers that can generate hot water / hot fluid
up to a maximum temperature of 50°C without any increase in the operating cost of the
chillers. The heat recovery is virtually at very low operating cost, alternately meaning a
substantial increase in the efficiency of the water chiller. The amount of heat thus recovered is
a direct saving.
Saving Potential from Various Refrigeration System is mentioned as below-
Table 2.1 Saving Potential
Compressor Type Discharge Temperature
Screw (Indirect cooled) 70 to 80°C
Screw (Injection cooled) 50 to 60°C
Reciprocating 85 to 110°C
Boosters (Rotary & Reciprocating) 75 to 85°C
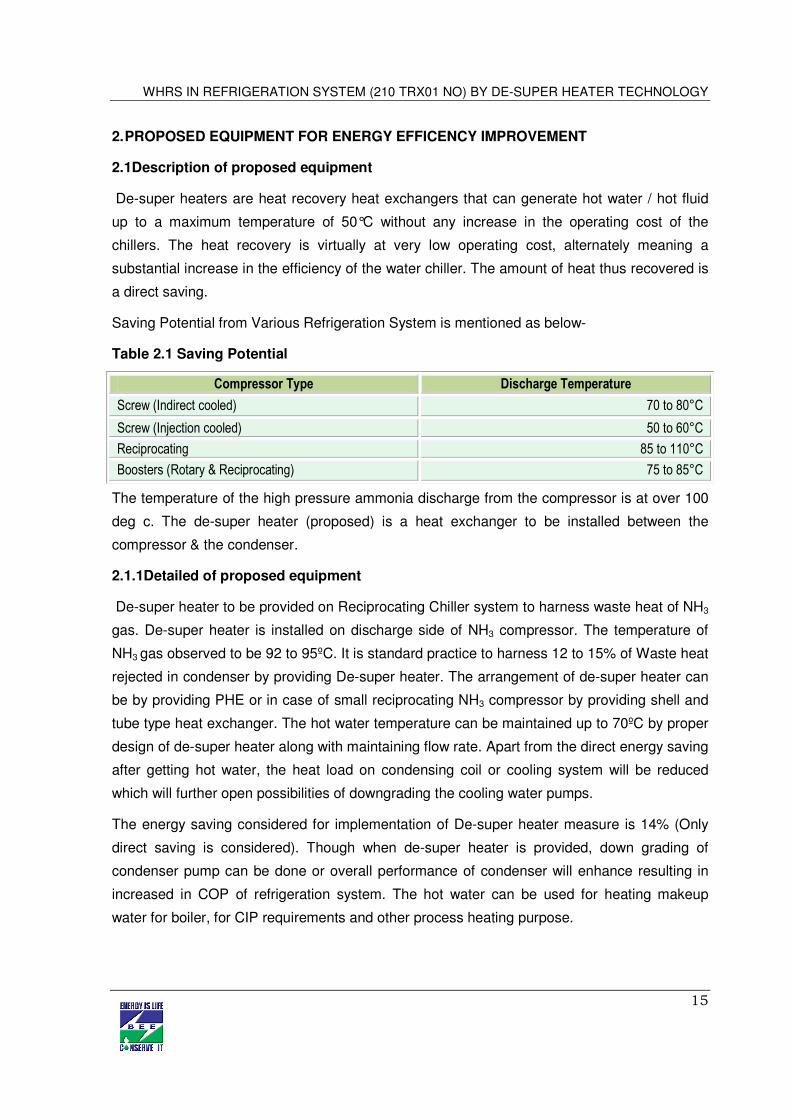
The temperature of the high pressure ammonia discharge from the compressor is at over 100
deg c. The de-super heater (proposed) is a heat exchanger to be installed between the
compressor & the condenser.
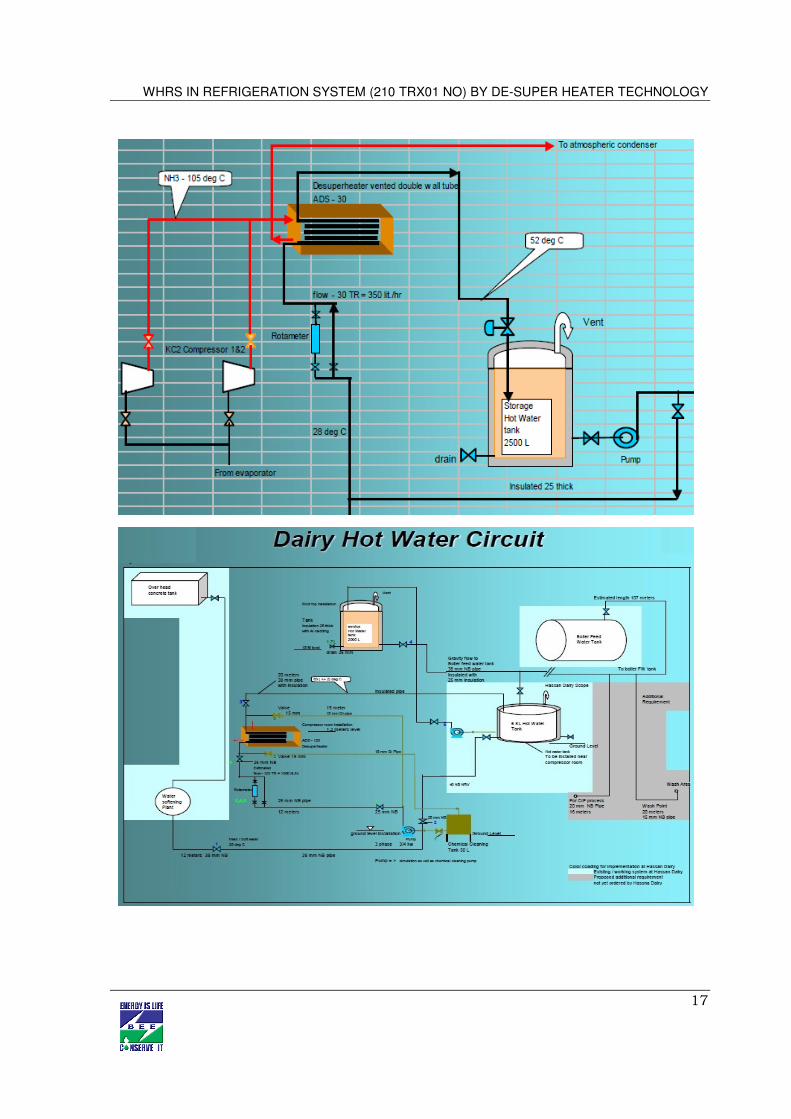
2.1.1Detailed of proposed equipment
De-super heater to be provided on Reciprocating Chiller system to harness waste heat of NH3
gas. De-super heater is installed on discharge side of NH3 compressor. The temperature of
NH3 gas observed to be 92 to 95ºC. It is standard practice to harness 12 to 15% of Waste heat
rejected in condenser by providing De-super heater. The arrangement of de-super heater can
be by providing PHE or in case of small reciprocating NH3 compressor by providing shell and
tube type heat exchanger. The hot water temperature can be maintained up to 70ºC by proper
design of de-super heater along with maintaining flow rate. Apart from the direct energy saving
after getting hot water, the heat load on condensing coil or cooling system will be reduced
which will further open possibilities of downgrading the cooling water pumps.
The energy saving considered for implementation of De-super heater measure is 14% (Only
direct saving is considered). Though when de-super heater is provided, down grading of
condenser pump can be done or overall performance of condenser will enhance resulting in
increased in COP of refrigeration system. The hot water can be used for heating makeup
water for boiler, for CIP requirements and other process heating purpose.
WHRS IN REFRIGERATION SYSTEM (210 TRX01 NO) BY DE-SUPER HEATER TECHNOLOGY
16
WHRS IN REFRIGERATION SYSTEM (210 TRX01 NO) BY DE-SUPER HEATER TECHNOLOGY
17
WHRS IN REFRIGERATION SYSTEM (210 TRX01 NO) BY DE-SUPER HEATER TECHNOLOGY
18
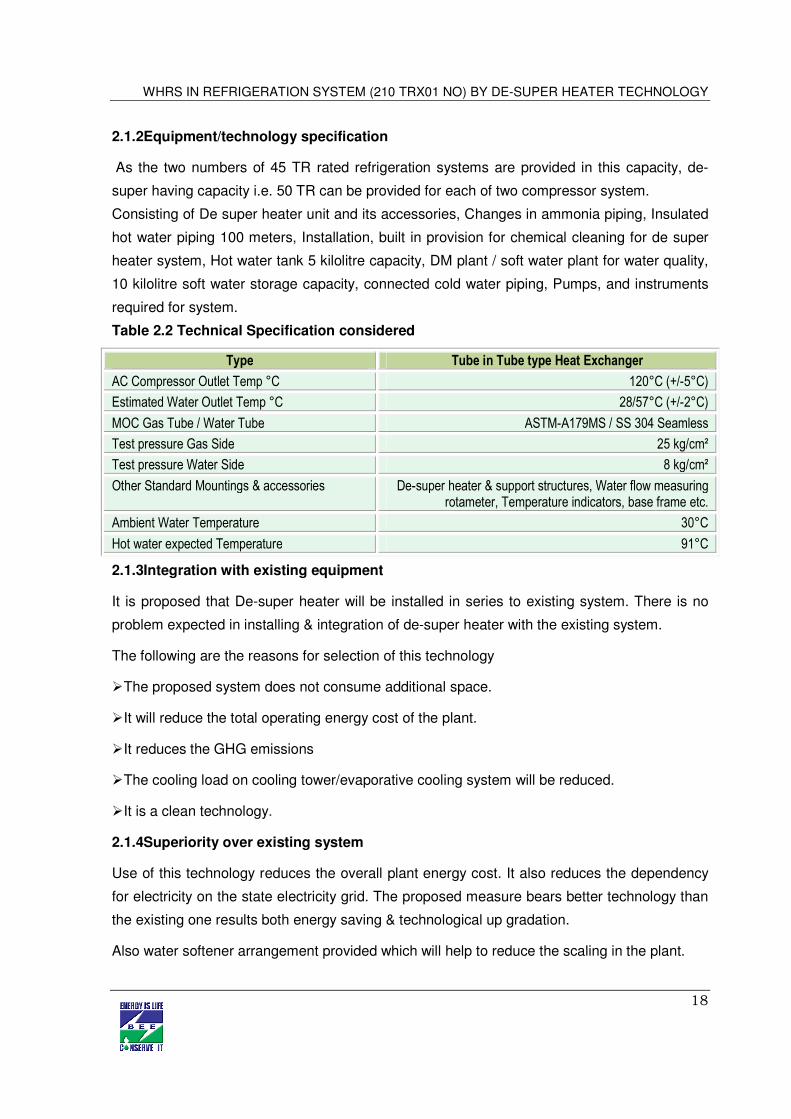
2.1.2Equipment/technology specification
As the two numbers of 45 TR rated refrigeration systems are provided in this capacity, de-
super having capacity i.e. 50 TR can be provided for each of two compressor system.
Consisting of De super heater unit and its accessories, Changes in ammonia piping, Insulated
hot water piping 100 meters, Installation, built in provision for chemical cleaning for de super
heater system, Hot water tank 5 kilolitre capacity, DM plant / soft water plant for water quality,
10 kilolitre soft water storage capacity, connected cold water piping, Pumps, and instruments
required for system.
Table 2.2 Technical Specification considered
Type Tube in Tube type Heat Exchanger
AC Compressor Outlet Temp °C 120°C (+/-5°C)
Estimated Water Outlet Temp °C 28/57°C (+/-2°C)
MOC Gas Tube / Water Tube ASTM-A179MS / SS 304 Seamless
Test pressure Gas Side 25 kg/cm²
Test pressure Water Side 8 kg/cm²
Other Standard Mountings & accessories De-super heater & support structures, Water flow measuring rotameter, Temperature indicators, base frame etc.
Ambient Water Temperature 30°C
Hot water expected Temperature 91°C
2.1.3Integration with existing equipment
It is proposed that De-super heater will be installed in series to existing system. There is no
problem expected in installing & integration of de-super heater with the existing system.
The following are the reasons for selection of this technology
� The proposed system does not consume additional space.
� It will reduce the total operating energy cost of the plant.
� It reduces the GHG emissions
� The cooling load on cooling tower/evaporative cooling system will be reduced.
� It is a clean technology.
2.1.4Superiority over existing system
Use of this technology reduces the overall plant energy cost. It also reduces the dependency
for electricity on the state electricity grid. The proposed measure bears better technology than
the existing one results both energy saving & technological up gradation.
Also water softener arrangement provided which will help to reduce the scaling in the plant.
WHRS IN REFRIGERATION SYSTEM (210 TRX01 NO) BY DE-SUPER HEATER TECHNOLOGY
19
2.1.5Source of equipment
The recommended technology is proven one and in various industries on normal basis. These
are running successfully and the unit owners had observed the savings in terms of energy.
2.1.6Availability of technology/equipment
Suppliers of this technology are available at local level as well as at international level very
easily. Even most of the suppliers took initiative and interacting with the dairy unit owners for
creating the awareness of use of this technology.
2.1.7Service providers
Details of technology service providers are shown in Annexure 7.
2.1.8Terms and conditions in sales of equipment
The suppliers have already extended standard warrantee conditions for exchange, replace or
repair against manufacturing defects for a period of 12 months after the date of
commissioning. Promoters will have to promptly notify the supplier in writing of obvious defects
or deficiencies after detection thereof. Replaced parts shall become the property of the
supplier upon request of the supplier.
Supplier is not liable or defects or deficiencies which are resulting from the following reasons,
as long as they are not resulting from a default of Supplier: Improper, unsuitable or negligent
use, handling and/or operation of the system by promoters or by third parties; use of spare
parts other than Genuine Parts; normal wear and tear; use of unsuitable consumables (such
as, fuel, oil cooling liquid or any other consumables), particularly the use of consumables not
conciliated in the operation manuals; improper building ground; chemical, electro- chemical or
electric influences.
All conditions associated with this system are standard in nature. No special clause is
incorporated. The conditions are very common in most of the plant & machinery sales.
2.1.9Process down time
Process down time of Milk Chilling Unit of about 1 weeks maximum will be required for the
interconnection of the De-super heater with the existing system.
2.2 Life cycle assessment and risks analysis
Life of the equipment is about 15 years. Risk involves in the installation of proposed project
are as follows:
� Risk involved in delay in implementation of the proposed project is due to the high initial
investment cost.

WHRS IN REFRIGERATION SYSTEM (210 TRX01 NO) BY DE-SUPER HEATER TECHNOLOGY
20
2.3 Suitable unit for implementation of proposed technology
The measure & technology is suitable for the milk chilling center & dairy units under the
Gujarat Dairy Cluster & similar units outside cluster. This measure in fact will result in
technological up gradation in vital energy consuming area of these units.
WHRS IN REFRIGERATION SYSTEM (210 TRX01 NO) BY DE-SUPER HEATER TECHNOLOGY
21
3. ECONOMIC BENEFITS FROM PROPOSED TECHNOLOGY
3.1 TECHNICAL BENEFIT
3.1.1Fuel saving
The Furnace oil saved is about 38410 kg per year on a nominal cost of electricity consumption
which is around few hundred of Electricity units per year.
3.1.2Electricity saving
There is no direct electricity savings, however, at the same time additional electricity
consumption would be 5371 kWh annually.
3.1.3Improvement in product quality
The measure does not have any impact on quality of product directly or indirectly.
3.1.4Increase in production
Production will be the same as in present.
3.1.5Reduction in raw material
Raw material consumption is same even after the implementation of proposed technology.
3.1.6Reduction in other losses
No impact on other losses directly or indirectly.
3.2 Monetary benefits
Implementation of project will result in good, consistent monetary benefit. Total monetary
saving is Rs. 10.85 lakh per year. Details of total monetary benefit are given in Annexure 3.
3.3 SOCIAL BENEFITS
3.3.1Improvement in working environment
Use of De-super heater system in Dairy Industry reduces the energy consumption. This
improves efficiency of refrigeration system and reduces CO2 generation.
3.3.2Improvement in workers skill
Technical skills of persons will definitely be improved. As the training will be provided by
equipment suppliers which improve the technical skills of manpower required for operating of
the equipment and also the technology implementation will create awareness among the
workforce about energy efficiency and energy saving.
WHRS IN REFRIGERATION SYSTEM (210 TRX01 NO) BY DE-SUPER HEATER TECHNOLOGY
22
3.4 ENVIRONMENTAL BENEFITS
3.4.1Reduction in effluent generation
There is no impact in effluent generation due to implementation of the project.
3.4.2Reduction in GHG emission
Implementation of this technology will reduce the CO2 emissions. Reduction in CO2 emissions
will be possible due to Energy saving. This project results in reduction of peak demand and
uses off-peak electricity. The project will be able to reduce 130.6 tonnes of CO2 produced
annually by its saving using the waste heat for the purpose.
3.4.3Reduction in other emissions like SOX
Amount of SOX will be reducing due to improved efficiency of the power plants due to better
plant load factor.
WHRS IN REFRIGERATION SYSTEM (210 TRX01 NO) BY DE-SUPER HEATER TECHNOLOGY
23
4 INSTALLATION OF PROPOSED EQUIPMENT
4.1 COST OF PROJECT
4.1.1Equipment cost
Cost of De-super heater including taxes is ` 29.41 Lacs (after considering vendor discount)
per 210 TR System.
4.1.2Erection, commissioning and other misc. cost
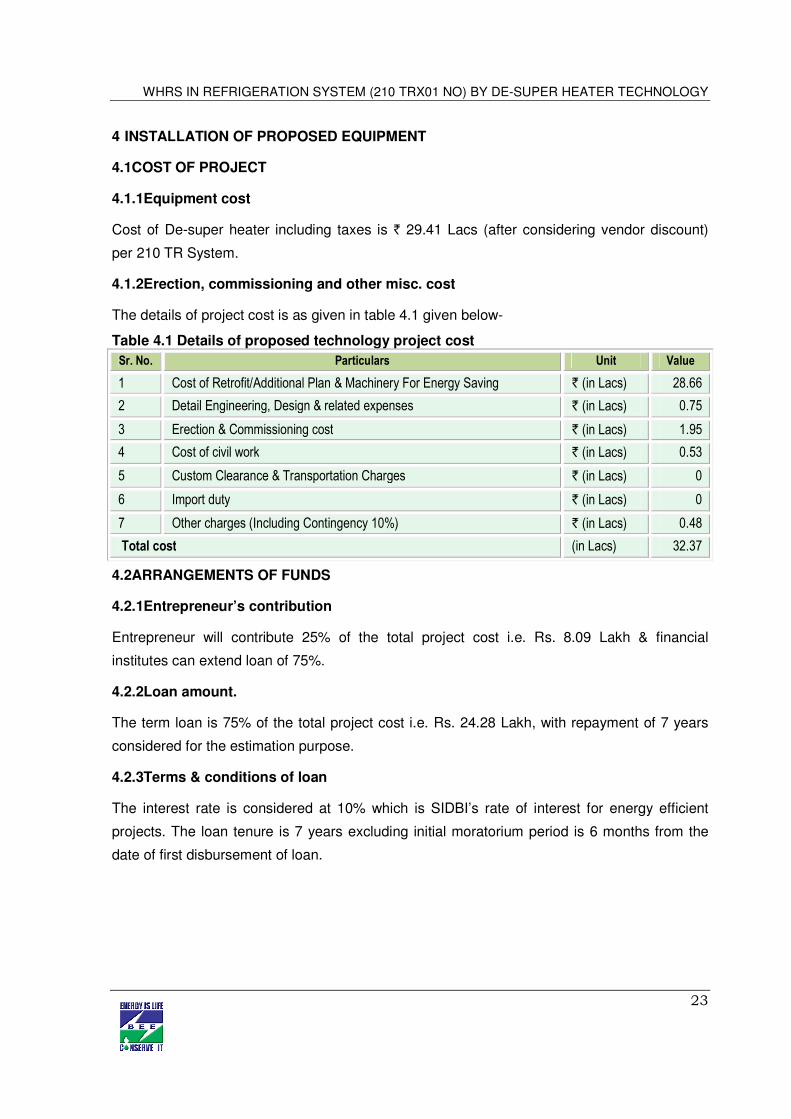
The details of project cost is as given in table 4.1 given below-
Table 4.1 Details of proposed technology project cost
Sr. No. Particulars Unit Value
1 Cost of Retrofit/Additional Plan & Machinery For Energy Saving ` (in Lacs) 28.66
2 Detail Engineering, Design & related expenses ` (in Lacs) 0.75
3 Erection & Commissioning cost ` (in Lacs) 1.95
4 Cost of civil work ` (in Lacs) 0.53
5 Custom Clearance & Transportation Charges ` (in Lacs) 0
6 Import duty ` (in Lacs) 0
7 Other charges (Including Contingency 10%) ` (in Lacs) 0.48
Total cost (in Lacs) 32.37
4.2 ARRANGEMENTS OF FUNDS
4.2.1Entrepreneur’s contribution
Entrepreneur will contribute 25% of the total project cost i.e. Rs. 8.09 Lakh & financial
institutes can extend loan of 75%.
4.2.2Loan amount.
The term loan is 75% of the total project cost i.e. Rs. 24.28 Lakh, with repayment of 7 years
considered for the estimation purpose.
4.2.3Terms & conditions of loan
The interest rate is considered at 10% which is SIDBI’s rate of interest for energy efficient
projects. The loan tenure is 7 years excluding initial moratorium period is 6 months from the
date of first disbursement of loan.
WHRS IN REFRIGERATION SYSTEM (210 TRX01 NO) BY DE-SUPER HEATER TECHNOLOGY
24
4.3 FINANCIAL INDICATORS
4.3.1Cash flow analysis
Profitability and cash flow statements have been worked out for a period of 10 years. The
financials have been worked out on the basis of certain reasonable assumptions, which are
outlined below.
The project is expected to achieve monetary savings of Rs. 10.85 lakh per.
� The Operation and Maintenance cost is estimated at 2% of cost of total project with 5%
increase in every year as escalations.
� Interest on term loan is estimated at 10%.
� Depreciation is provided as per the rates provided in the companies act.
Considering the above mentioned assumptions, the net cash accruals starting with ` 6.48 lakh
in the first’s year operation and ` 38.10 lakh at the end of tenth year.
4.3.2Simple payback period
The estimated payback period is about 2.98 years or about 36 months.
4.3.3Net Present Value (NPV)
The Net present value of the investment at 10% works out to be 15.30 lakh.
4.3.4Internal rate of return (IRR)
The after tax IRR of the project works out to be 21.31%. Thus the project is financially viable
for both types of fuels.
4.3.5Return on investment (ROI)
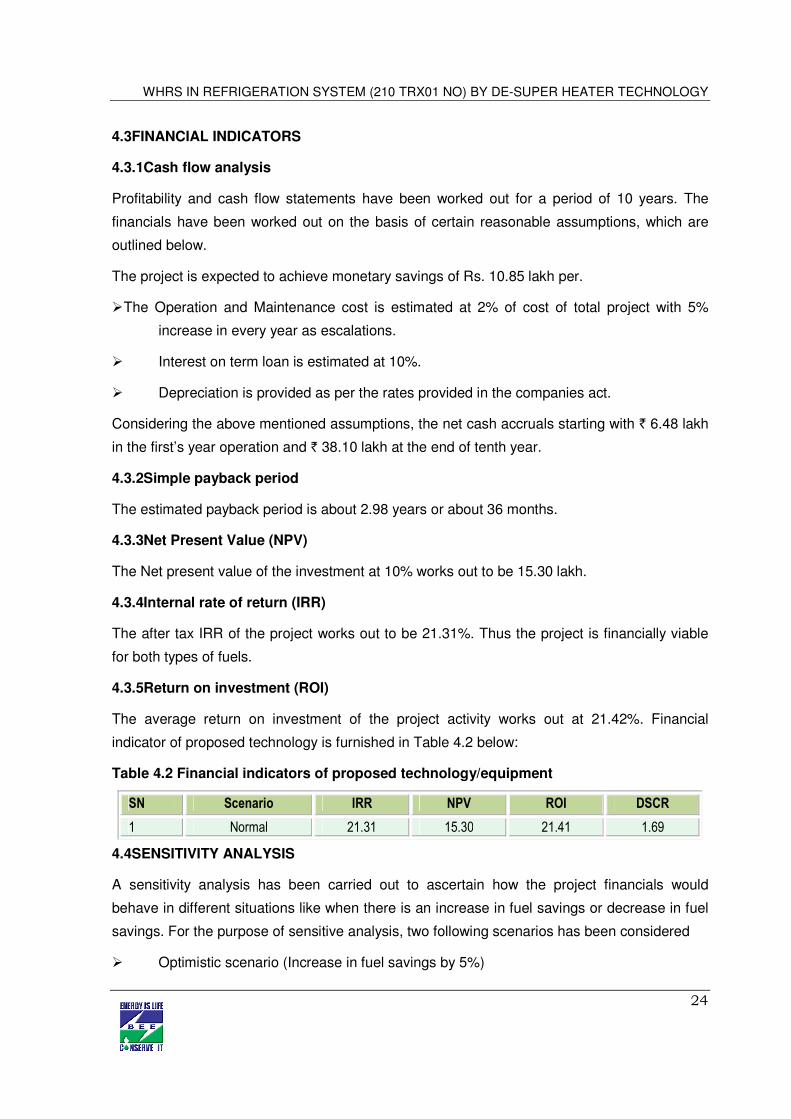
The average return on investment of the project activity works out at 21.42%. Financial
indicator of proposed technology is furnished in Table 4.2 below:
Table 4.2 Financial indicators of proposed technology/equipment
SN Scenario IRR NPV ROI DSCR
1 Normal 21.31 15.30 21.41 1.69
4.4 SENSITIVITY ANALYSIS
A sensitivity analysis has been carried out to ascertain how the project financials would
behave in different situations like when there is an increase in fuel savings or decrease in fuel
savings. For the purpose of sensitive analysis, two following scenarios has been considered
� Optimistic scenario (Increase in fuel savings by 5%)
WHRS IN REFRIGERATION SYSTEM (210 TRX01 NO) BY DE-SUPER HEATER TECHNOLOGY
25
� Pessimistic scenario (Decrease in fuel savings by 5%)
In each scenario, other inputs are assumed as a constant. The financial indicators in each of
the above situation are indicated along with standard indicators.
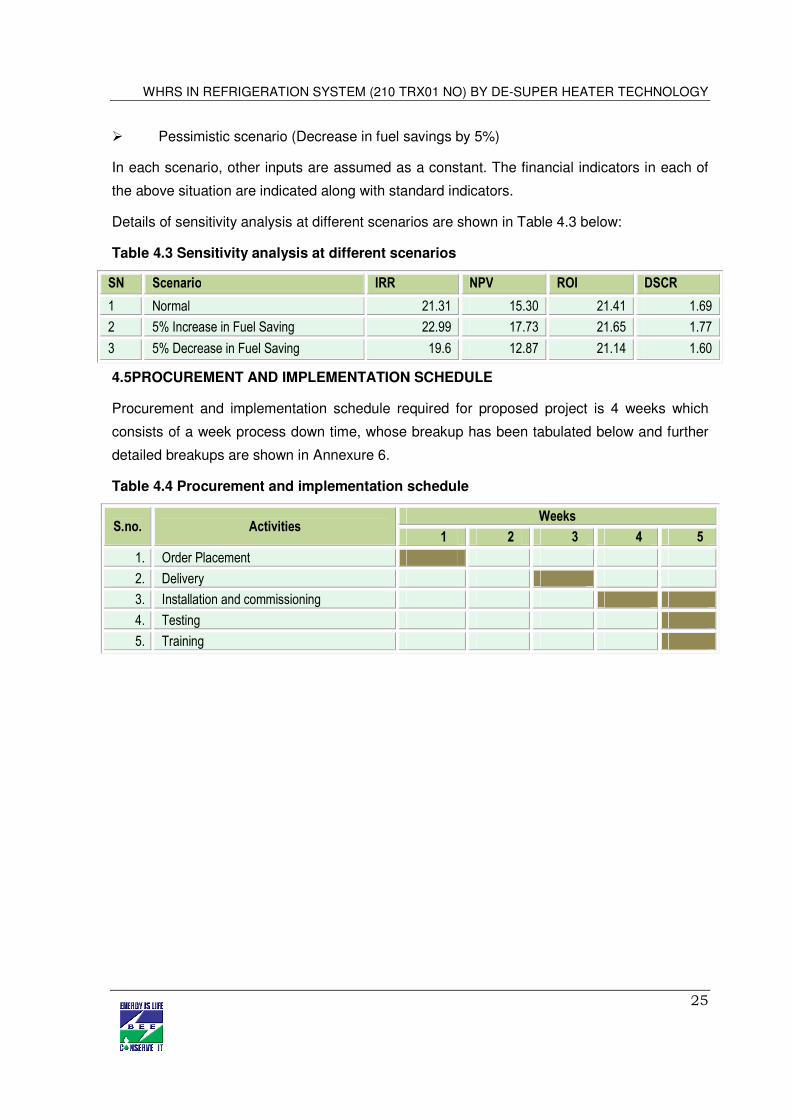
Details of sensitivity analysis at different scenarios are shown in Table 4.3 below:
Table 4.3 Sensitivity analysis at different scenarios
SN Scenario IRR NPV ROI DSCR
1 Normal 21.31 15.30 21.41 1.69
2 5% Increase in Fuel Saving 22.99 17.73 21.65 1.77
3 5% Decrease in Fuel Saving 19.6 12.87 21.14 1.60
4.5 PROCUREMENT AND IMPLEMENTATION SCHEDULE
Procurement and implementation schedule required for proposed project is 4 weeks which
consists of a week process down time, whose breakup has been tabulated below and further
detailed breakups are shown in Annexure 6.
Table 4.4 Procurement and implementation schedule
S.no. Activities Weeks
1 2 3 4 5
1. Order Placement
2. Delivery
3. Installation and commissioning
4. Testing
5. Training
WHRS IN REFRIGERATION SYSTEM (210 TRX01 NO) BY DE-SUPER HEATER TECHNOLOGY
26
Annexure
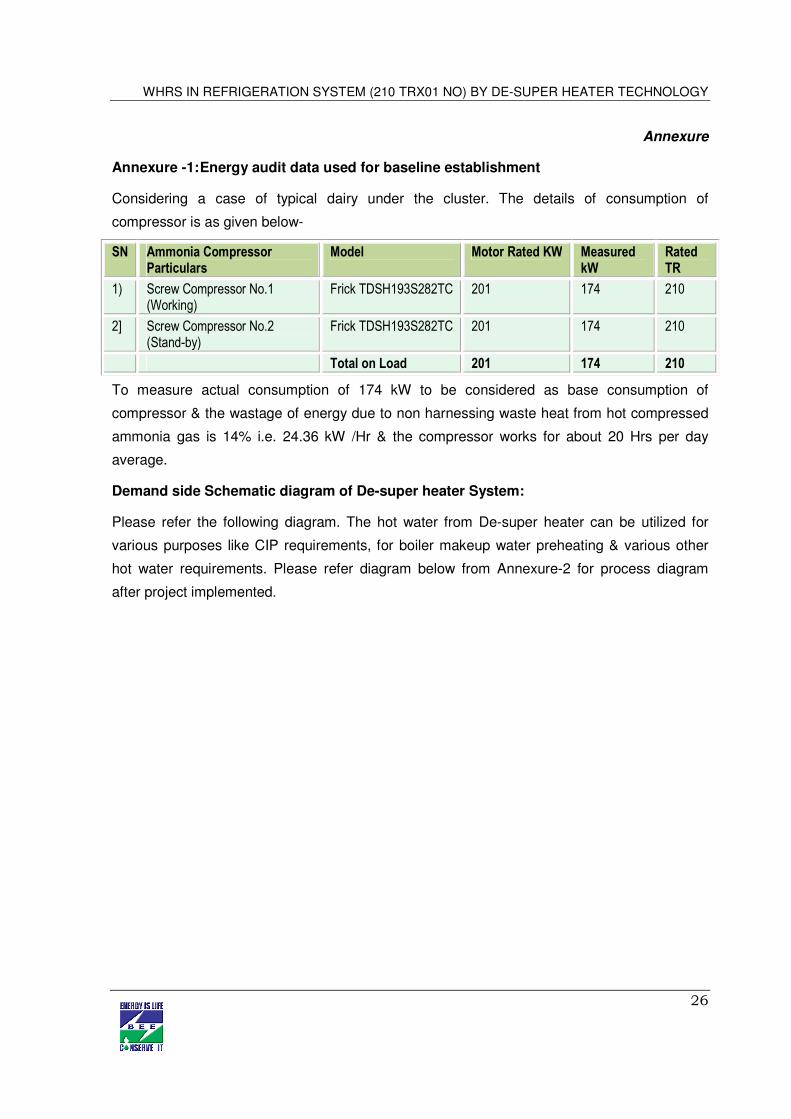
Annexure -1: Energy audit data used for baseline establishment
Considering a case of typical dairy under the cluster. The details of consumption of
compressor is as given below-
SN Ammonia Compressor Particulars
Model Motor Rated KW Measured kW
Rated TR
1) Screw Compressor No.1 (Working)
Frick TDSH193S282TC 201 174 210
2] Screw Compressor No.2 (Stand-by)
Frick TDSH193S282TC 201 174 210
Total on Load 201 174 210
To measure actual consumption of 174 kW to be considered as base consumption of
compressor & the wastage of energy due to non harnessing waste heat from hot compressed
ammonia gas is 14% i.e. 24.36 kW /Hr & the compressor works for about 20 Hrs per day
average.
Demand side Schematic diagram of De-super heater System:
Please refer the following diagram. The hot water from De-super heater can be utilized for
various purposes like CIP requirements, for boiler makeup water preheating & various other
hot water requirements. Please refer diagram below from Annexure-2 for process diagram
after project implemented.
WHRS IN REFRIGERATION SYSTEM (210 TRX01 NO) BY DE-SUPER HEATER TECHNOLOGY
27
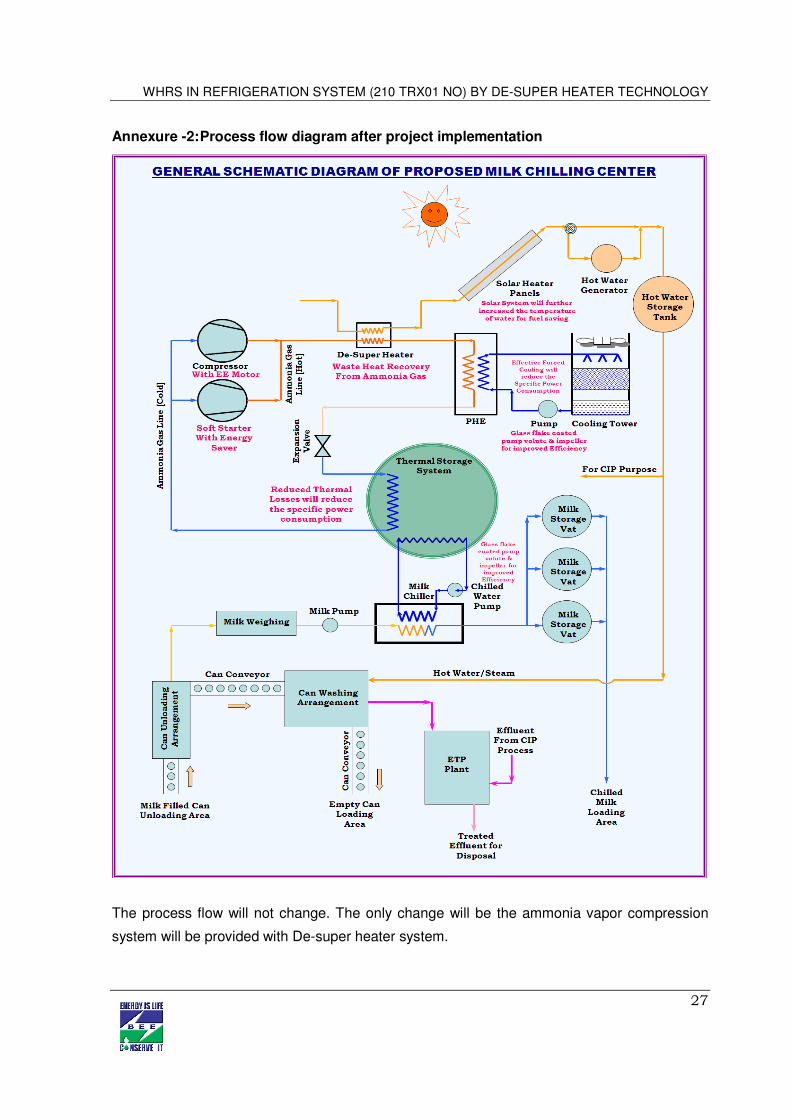
Annexure -2: Process flow diagram after project implementation
The process flow will not change. The only change will be the ammonia vapor compression
system will be provided with De-super heater system.
WHRS IN REFRIGERATION SYSTEM (210 TRX01 NO) BY DE-SUPER HEATER TECHNOLOGY
28
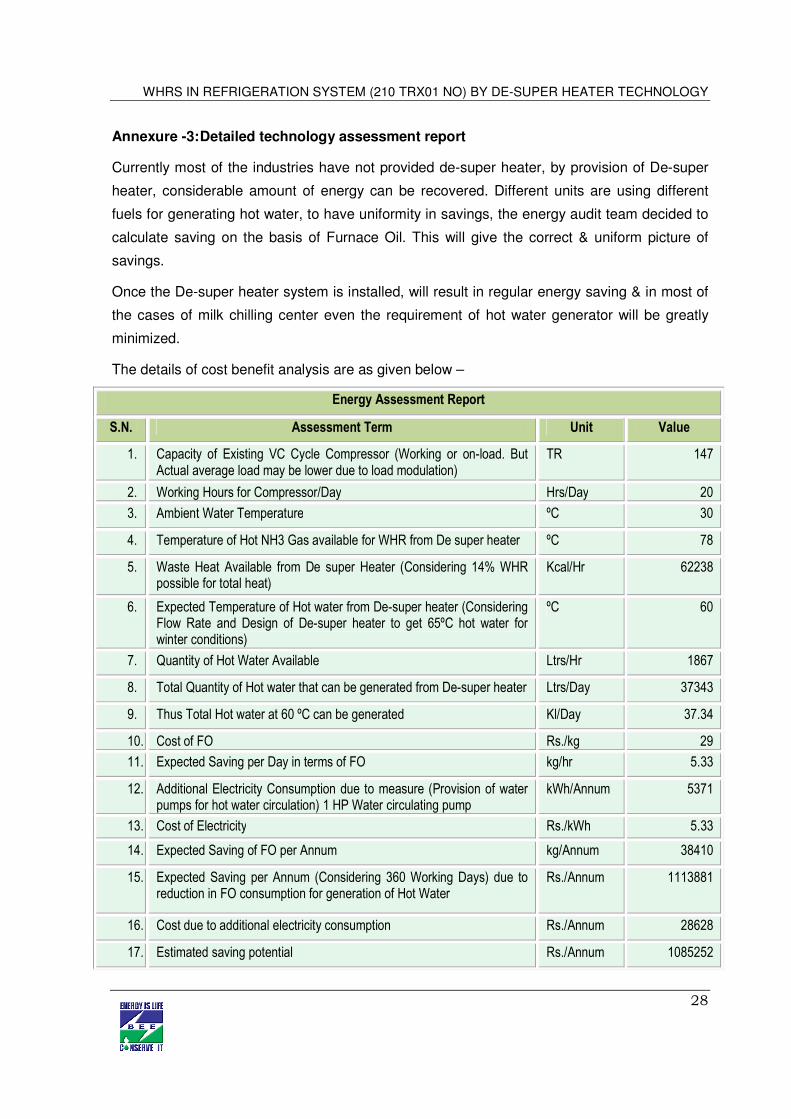
Annexure -3: Detailed technology assessment report
Currently most of the industries have not provided de-super heater, by provision of De-super
heater, considerable amount of energy can be recovered. Different units are using different
fuels for generating hot water, to have uniformity in savings, the energy audit team decided to
calculate saving on the basis of Furnace Oil. This will give the correct & uniform picture of
savings.
Once the De-super heater system is installed, will result in regular energy saving & in most of
the cases of milk chilling center even the requirement of hot water generator will be greatly
minimized.
The details of cost benefit analysis are as given below –
Energy Assessment Report
S.N. Assessment Term Unit Value
1. Capacity of Existing VC Cycle Compressor (Working or on-load. But Actual average load may be lower due to load modulation)
TR 147
2. Working Hours for Compressor/Day Hrs/Day 20
3. Ambient Water Temperature ºC 30
4. Temperature of Hot NH3 Gas available for WHR from De super heater ºC 78
5. Waste Heat Available from De super Heater (Considering 14% WHR possible for total heat)
Kcal/Hr 62238
6. Expected Temperature of Hot water from De-super heater (Considering Flow Rate and Design of De-super heater to get 65ºC hot water for winter conditions)
ºC 60
7. Quantity of Hot Water Available Ltrs/Hr 1867
8. Total Quantity of Hot water that can be generated from De-super heater Ltrs/Day 37343
9. Thus Total Hot water at 60 ºC can be generated Kl/Day 37.34
10. Cost of FO Rs./kg 29
11. Expected Saving per Day in terms of FO kg/hr 5.33
12. Additional Electricity Consumption due to measure (Provision of water pumps for hot water circulation) 1 HP Water circulating pump
kWh/Annum 5371
13. Cost of Electricity Rs./kWh 5.33
14. Expected Saving of FO per Annum kg/Annum 38410
15. Expected Saving per Annum (Considering 360 Working Days) due to reduction in FO consumption for generation of Hot Water
Rs./Annum 1113881
16. Cost due to additional electricity consumption Rs./Annum 28628
17. Estimated saving potential Rs./Annum 1085252
WHRS IN REFRIGERATION SYSTEM (210 TRX01 NO) BY DE-SUPER HEATER TECHNOLOGY
29
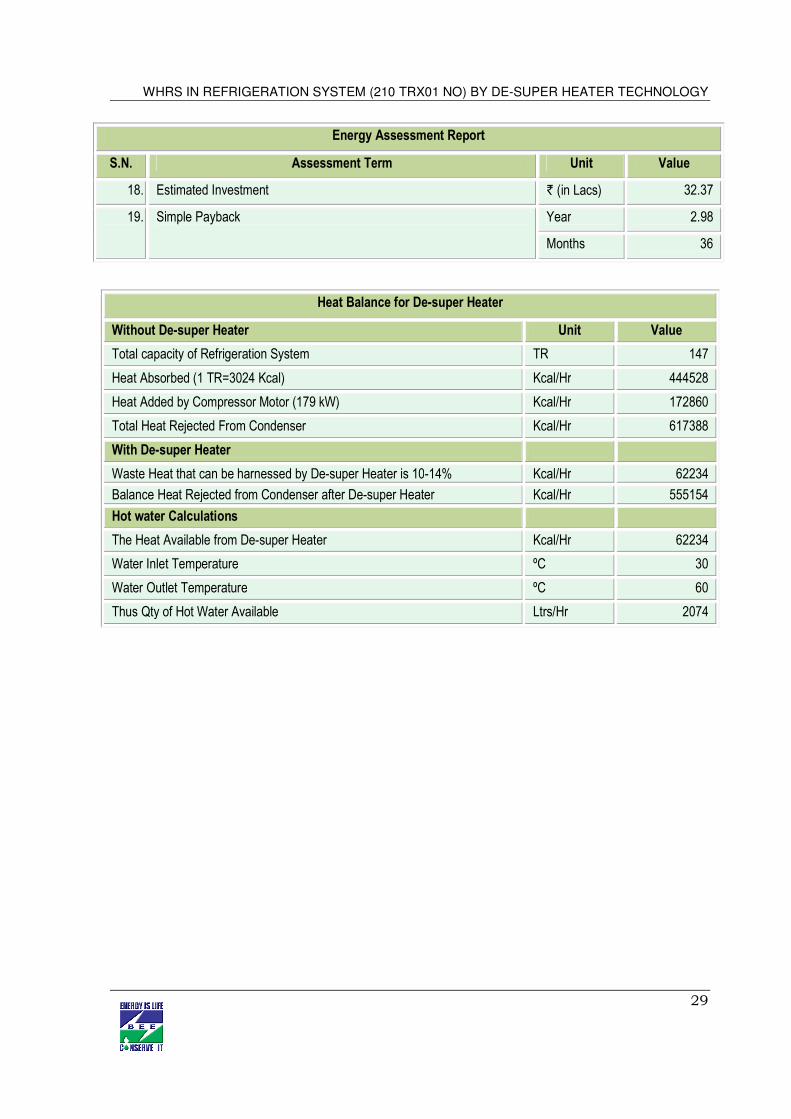
Energy Assessment Report
S.N. Assessment Term Unit Value
18. Estimated Investment ` (in Lacs) 32.37
19. Simple Payback Year 2.98
Months 36
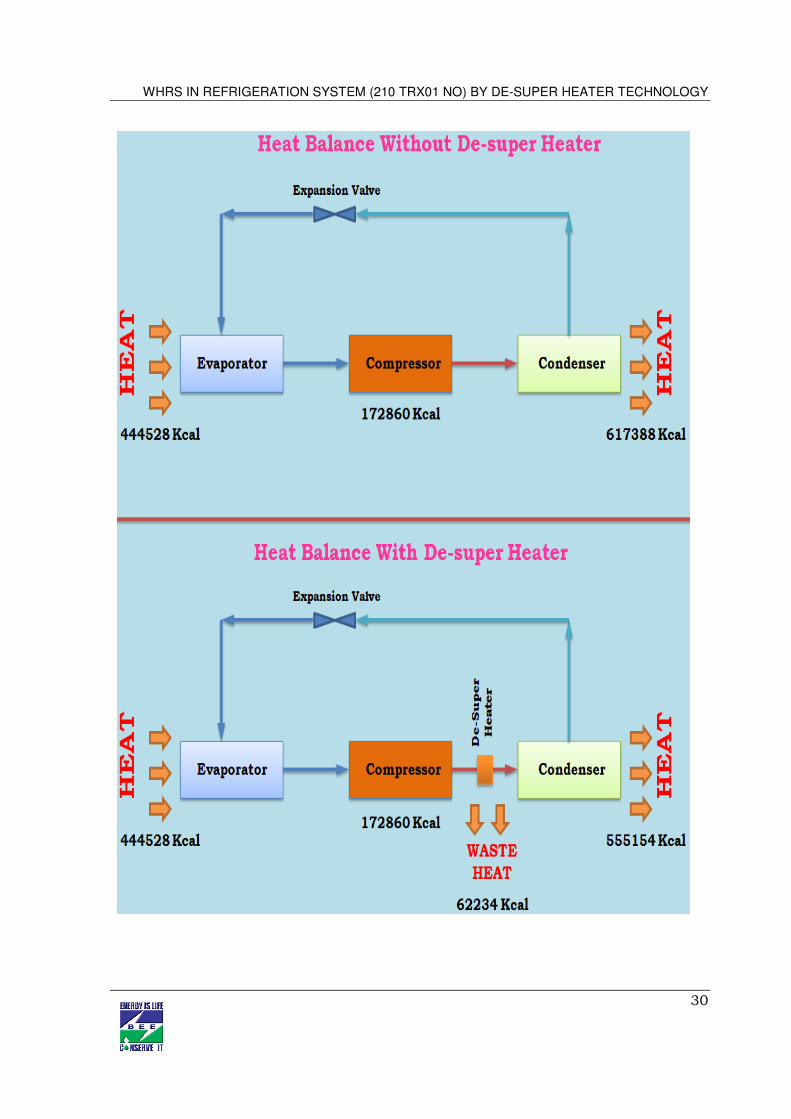
Heat Balance for De-super Heater
Without De-super Heater Unit Value
Total capacity of Refrigeration System TR 147
Heat Absorbed (1 TR=3024 Kcal) Kcal/Hr 444528
Heat Added by Compressor Motor (179 kW) Kcal/Hr 172860
Total Heat Rejected From Condenser Kcal/Hr 617388
With De-super Heater
Waste Heat that can be harnessed by De-super Heater is 10-14% Kcal/Hr 62234
Balance Heat Rejected from Condenser after De-super Heater Kcal/Hr 555154
Hot water Calculations
The Heat Available from De-super Heater Kcal/Hr 62234
Water Inlet Temperature ºC 30
Water Outlet Temperature ºC 60
Thus Qty of Hot Water Available Ltrs/Hr 2074
WHRS IN REFRIGERATION SYSTEM (210 TRX01 NO) BY DE-SUPER HEATER TECHNOLOGY
30

WHRS IN REFRIGERATION SYSTEM (210 TRX01 NO) BY DE-SUPER HEATER TECHNOLOGY
31
Annexure -4 Drawings for proposed electrical & civil works
No additional Electrical or civil work is required. Minor civil grouting for pipe support required
or minor brackets for pipe line support required. No substantial civil work required.
**For Hot circulation pump, foundation will definitely be required & for support structure for
De-super heater system will be required to be grouted either in wall or separate support
structure grouting may be required.
WHRS IN REFRIGERATION SYSTEM (210 TRX01 NO) BY DE-SUPER HEATER TECHNOLOGY
32
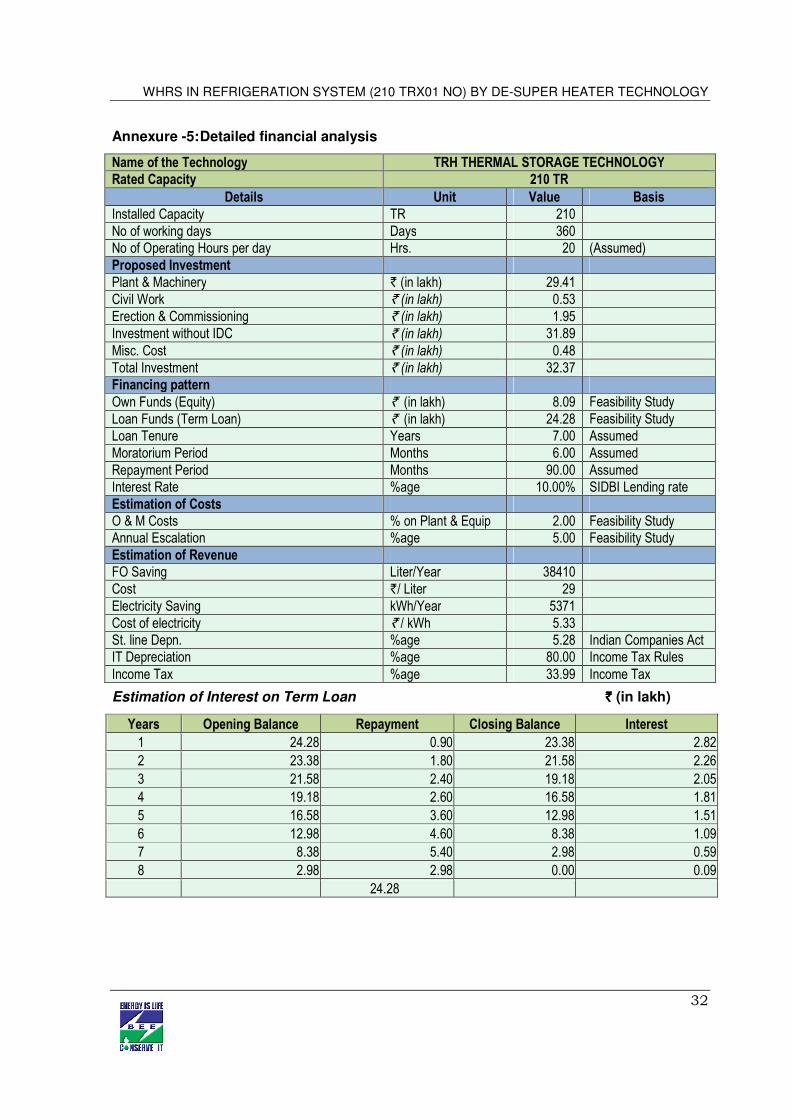
Annexure -5: Detailed financial analysis
Name of the Technology TRH THERMAL STORAGE TECHNOLOGY
Rated Capacity 210 TR
Details Unit Value Basis
Installed Capacity TR 210 No of working days Days 360 No of Operating Hours per day Hrs. 20 (Assumed) Proposed Investment Plant & Machinery ` (in lakh) 29.41 Civil Work ` (in lakh) 0.53 Erection & Commissioning ` (in lakh) 1.95 Investment without IDC ` (in lakh) 31.89 Misc. Cost ` (in lakh) 0.48 Total Investment ` (in lakh) 32.37 Financing pattern Own Funds (Equity) ` (in lakh) 8.09 Feasibility Study Loan Funds (Term Loan) ` (in lakh) 24.28 Feasibility Study Loan Tenure Years 7.00 Assumed Moratorium Period Months 6.00 Assumed Repayment Period Months 90.00 Assumed Interest Rate %age 10.00% SIDBI Lending rate Estimation of Costs O & M Costs % on Plant & Equip 2.00 Feasibility Study Annual Escalation %age 5.00 Feasibility Study Estimation of Revenue FO Saving Liter/Year 38410 Cost `/ Liter 29 Electricity Saving kWh/Year 5371 Cost of electricity ` / kWh 5.33 St. line Depn. %age 5.28 Indian Companies Act IT Depreciation %age 80.00 Income Tax Rules Income Tax %age 33.99 Income Tax
Estimation of Interest on Term Loan `̀̀̀ (in lakh)
Years Opening Balance Repayment Closing Balance Interest
1 24.28 0.90 23.38 2.82
2 23.38 1.80 21.58 2.26
3 21.58 2.40 19.18 2.05
4 19.18 2.60 16.58 1.81
5 16.58 3.60 12.98 1.51
6 12.98 4.60 8.38 1.09
7 8.38 5.40 2.98 0.59
8 2.98 2.98 0.00 0.09
24.28
WHRS IN REFRIGERATION SYSTEM (210 TRX01 NO) BY DE-SUPER HEATER TECHNOLOGY
33
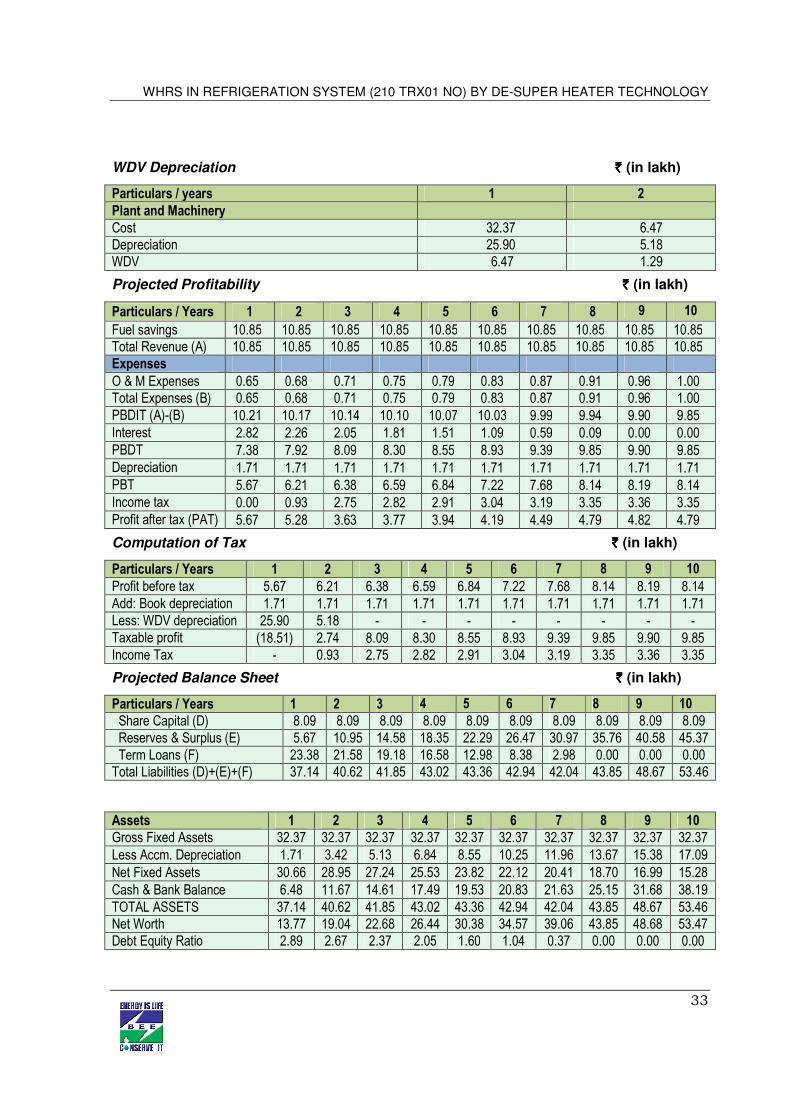
WDV Depreciation `̀̀̀ (in lakh)
Particulars / years 1 2
Plant and Machinery
Cost 32.37 6.47 Depreciation 25.90 5.18 WDV 6.47 1.29
Projected Profitability `̀̀̀ (in lakh)
Particulars / Years 1 2 3 4 5 6 7 8 9 10
Fuel savings 10.85 10.85 10.85 10.85 10.85 10.85 10.85 10.85 10.85 10.85 Total Revenue (A) 10.85 10.85 10.85 10.85 10.85 10.85 10.85 10.85 10.85 10.85 Expenses O & M Expenses 0.65 0.68 0.71 0.75 0.79 0.83 0.87 0.91 0.96 1.00 Total Expenses (B) 0.65 0.68 0.71 0.75 0.79 0.83 0.87 0.91 0.96 1.00 PBDIT (A)-(B) 10.21 10.17 10.14 10.10 10.07 10.03 9.99 9.94 9.90 9.85 Interest 2.82 2.26 2.05 1.81 1.51 1.09 0.59 0.09 0.00 0.00 PBDT 7.38 7.92 8.09 8.30 8.55 8.93 9.39 9.85 9.90 9.85 Depreciation 1.71 1.71 1.71 1.71 1.71 1.71 1.71 1.71 1.71 1.71 PBT 5.67 6.21 6.38 6.59 6.84 7.22 7.68 8.14 8.19 8.14 Income tax 0.00 0.93 2.75 2.82 2.91 3.04 3.19 3.35 3.36 3.35 Profit after tax (PAT) 5.67 5.28 3.63 3.77 3.94 4.19 4.49 4.79 4.82 4.79
Computation of Tax `̀̀̀ (in lakh)
Particulars / Years 1 2 3 4 5 6 7 8 9 10
Profit before tax 5.67 6.21 6.38 6.59 6.84 7.22 7.68 8.14 8.19 8.14 Add: Book depreciation 1.71 1.71 1.71 1.71 1.71 1.71 1.71 1.71 1.71 1.71 Less: WDV depreciation 25.90 5.18 - - - - - - - - Taxable profit (18.51) 2.74 8.09 8.30 8.55 8.93 9.39 9.85 9.90 9.85 Income Tax - 0.93 2.75 2.82 2.91 3.04 3.19 3.35 3.36 3.35
Projected Balance Sheet ̀̀̀̀ (in lakh)
Particulars / Years 1 2 3 4 5 6 7 8 9 10
Share Capital (D) 8.09 8.09 8.09 8.09 8.09 8.09 8.09 8.09 8.09 8.09 Reserves & Surplus (E) 5.67 10.95 14.58 18.35 22.29 26.47 30.97 35.76 40.58 45.37 Term Loans (F) 23.38 21.58 19.18 16.58 12.98 8.38 2.98 0.00 0.00 0.00 Total Liabilities (D)+(E)+(F) 37.14 40.62 41.85 43.02 43.36 42.94 42.04 43.85 48.67 53.46
Assets 1 2 3 4 5 6 7 8 9 10
Gross Fixed Assets 32.37 32.37 32.37 32.37 32.37 32.37 32.37 32.37 32.37 32.37 Less Accm. Depreciation 1.71 3.42 5.13 6.84 8.55 10.25 11.96 13.67 15.38 17.09 Net Fixed Assets 30.66 28.95 27.24 25.53 23.82 22.12 20.41 18.70 16.99 15.28 Cash & Bank Balance 6.48 11.67 14.61 17.49 19.53 20.83 21.63 25.15 31.68 38.19 TOTAL ASSETS 37.14 40.62 41.85 43.02 43.36 42.94 42.04 43.85 48.67 53.46 Net Worth 13.77 19.04 22.68 26.44 30.38 34.57 39.06 43.85 48.68 53.47 Debt Equity Ratio 2.89 2.67 2.37 2.05 1.60 1.04 0.37 0.00 0.00 0.00
WHRS IN REFRIGERATION SYSTEM (210 TRX01 NO) BY DE-SUPER HEATER TECHNOLOGY
34
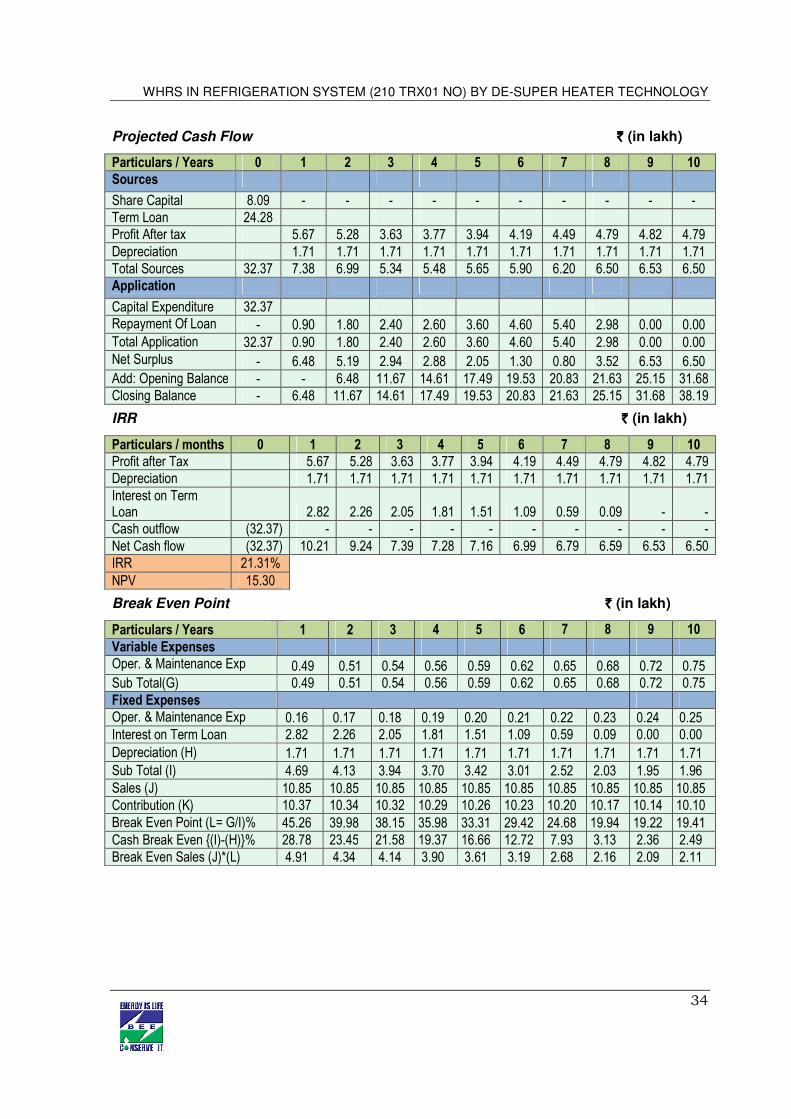
Projected Cash Flow ̀̀̀̀ (in lakh)
Particulars / Years 0 1 2 3 4 5 6 7 8 9 10
Sources
Share Capital 8.09 - - - - - - - - - - Term Loan 24.28 Profit After tax 5.67 5.28 3.63 3.77 3.94 4.19 4.49 4.79 4.82 4.79 Depreciation 1.71 1.71 1.71 1.71 1.71 1.71 1.71 1.71 1.71 1.71 Total Sources 32.37 7.38 6.99 5.34 5.48 5.65 5.90 6.20 6.50 6.53 6.50 Application
Capital Expenditure 32.37 Repayment Of Loan - 0.90 1.80 2.40 2.60 3.60 4.60 5.40 2.98 0.00 0.00 Total Application 32.37 0.90 1.80 2.40 2.60 3.60 4.60 5.40 2.98 0.00 0.00 Net Surplus - 6.48 5.19 2.94 2.88 2.05 1.30 0.80 3.52 6.53 6.50 Add: Opening Balance - - 6.48 11.67 14.61 17.49 19.53 20.83 21.63 25.15 31.68 Closing Balance - 6.48 11.67 14.61 17.49 19.53 20.83 21.63 25.15 31.68 38.19
IRR `̀̀̀ (in lakh)
Particulars / months 0 1 2 3 4 5 6 7 8 9 10
Profit after Tax 5.67 5.28 3.63 3.77 3.94 4.19 4.49 4.79 4.82 4.79 Depreciation 1.71 1.71 1.71 1.71 1.71 1.71 1.71 1.71 1.71 1.71 Interest on Term Loan 2.82 2.26 2.05 1.81 1.51 1.09 0.59 0.09 - - Cash outflow (32.37) - - - - - - - - - - Net Cash flow (32.37) 10.21 9.24 7.39 7.28 7.16 6.99 6.79 6.59 6.53 6.50 IRR 21.31% NPV 15.30
Break Even Point `̀̀̀ (in lakh)
Particulars / Years 1 2 3 4 5 6 7 8 9 10
Variable Expenses Oper. & Maintenance Exp (75%)
0.49 0.51 0.54 0.56 0.59 0.62 0.65 0.68 0.72 0.75 Sub Total(G) 0.49 0.51 0.54 0.56 0.59 0.62 0.65 0.68 0.72 0.75 Fixed Expenses Oper. & Maintenance Exp (25%)
0.16 0.17 0.18 0.19 0.20 0.21 0.22 0.23 0.24 0.25 Interest on Term Loan 2.82 2.26 2.05 1.81 1.51 1.09 0.59 0.09 0.00 0.00 Depreciation (H) 1.71 1.71 1.71 1.71 1.71 1.71 1.71 1.71 1.71 1.71 Sub Total (I) 4.69 4.13 3.94 3.70 3.42 3.01 2.52 2.03 1.95 1.96 Sales (J) 10.85 10.85 10.85 10.85 10.85 10.85 10.85 10.85 10.85 10.85 Contribution (K) 10.37 10.34 10.32 10.29 10.26 10.23 10.20 10.17 10.14 10.10 Break Even Point (L= G/I)% 45.26 39.98 38.15 35.98 33.31 29.42 24.68 19.94 19.22 19.41 Cash Break Even {(I)-(H)}% 28.78 23.45 21.58 19.37 16.66 12.72 7.93 3.13 2.36 2.49 Break Even Sales (J)*(L) 4.91 4.34 4.14 3.90 3.61 3.19 2.68 2.16 2.09 2.11
WHRS IN REFRIGERATION SYSTEM (210 TRX01 NO) BY DE-SUPER HEATER TECHNOLOGY
35
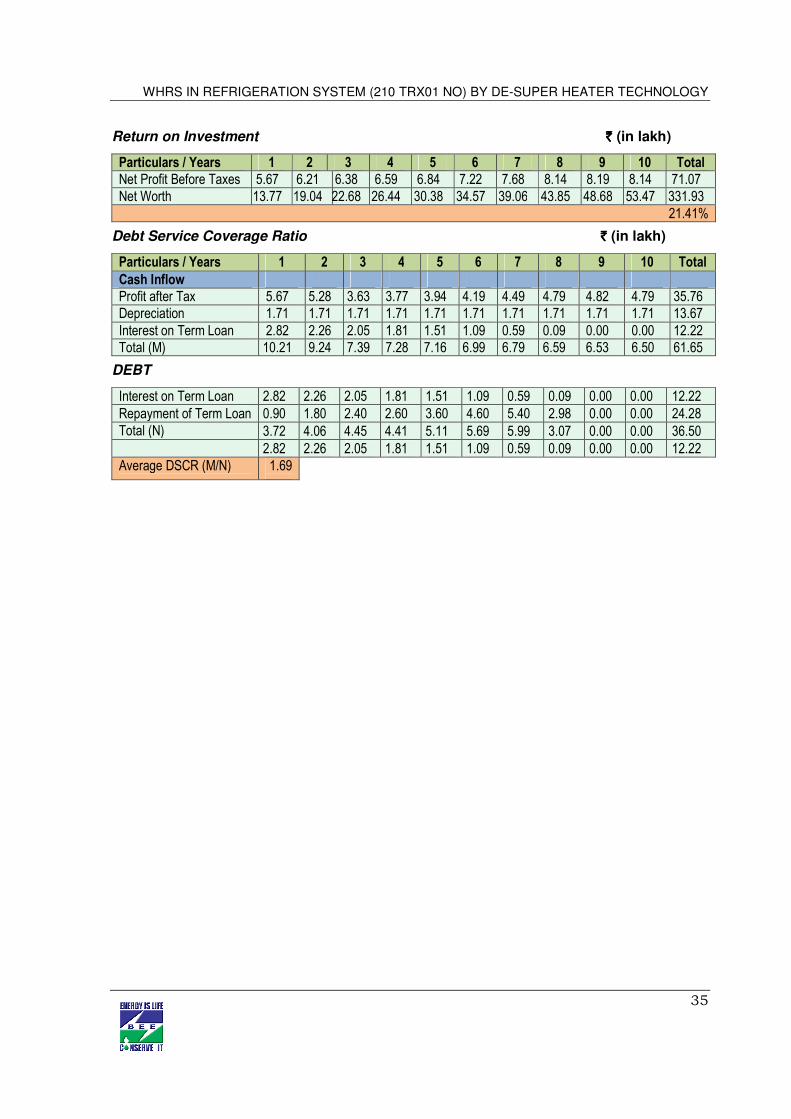
Return on Investment `̀̀̀ (in lakh)
Particulars / Years 1 2 3 4 5 6 7 8 9 10 Total
Net Profit Before Taxes 5.67 6.21 6.38 6.59 6.84 7.22 7.68 8.14 8.19 8.14 71.07 Net Worth 13.77 19.04 22.68 26.44 30.38 34.57 39.06 43.85 48.68 53.47 331.93
21.41%
Debt Service Coverage Ratio `̀̀̀ (in lakh)
Particulars / Years 1 2 3 4 5 6 7 8 9 10 Total
Cash Inflow Profit after Tax 5.67 5.28 3.63 3.77 3.94 4.19 4.49 4.79 4.82 4.79 35.76 Depreciation 1.71 1.71 1.71 1.71 1.71 1.71 1.71 1.71 1.71 1.71 13.67 Interest on Term Loan 2.82 2.26 2.05 1.81 1.51 1.09 0.59 0.09 0.00 0.00 12.22 Total (M) 10.21 9.24 7.39 7.28 7.16 6.99 6.79 6.59 6.53 6.50 61.65
DEBT
Interest on Term Loan 2.82 2.26 2.05 1.81 1.51 1.09 0.59 0.09 0.00 0.00 12.22 Repayment of Term Loan 0.90 1.80 2.40 2.60 3.60 4.60 5.40 2.98 0.00 0.00 24.28 Total (N) 3.72 4.06 4.45 4.41 5.11 5.69 5.99 3.07 0.00 0.00 36.50 2.82 2.26 2.05 1.81 1.51 1.09 0.59 0.09 0.00 0.00 12.22 Average DSCR (M/N) 1.69
WHRS IN REFRIGERATION SYSTEM (210 TRX01 NO) BY DE-SUPER HEATER TECHNOLOGY
36
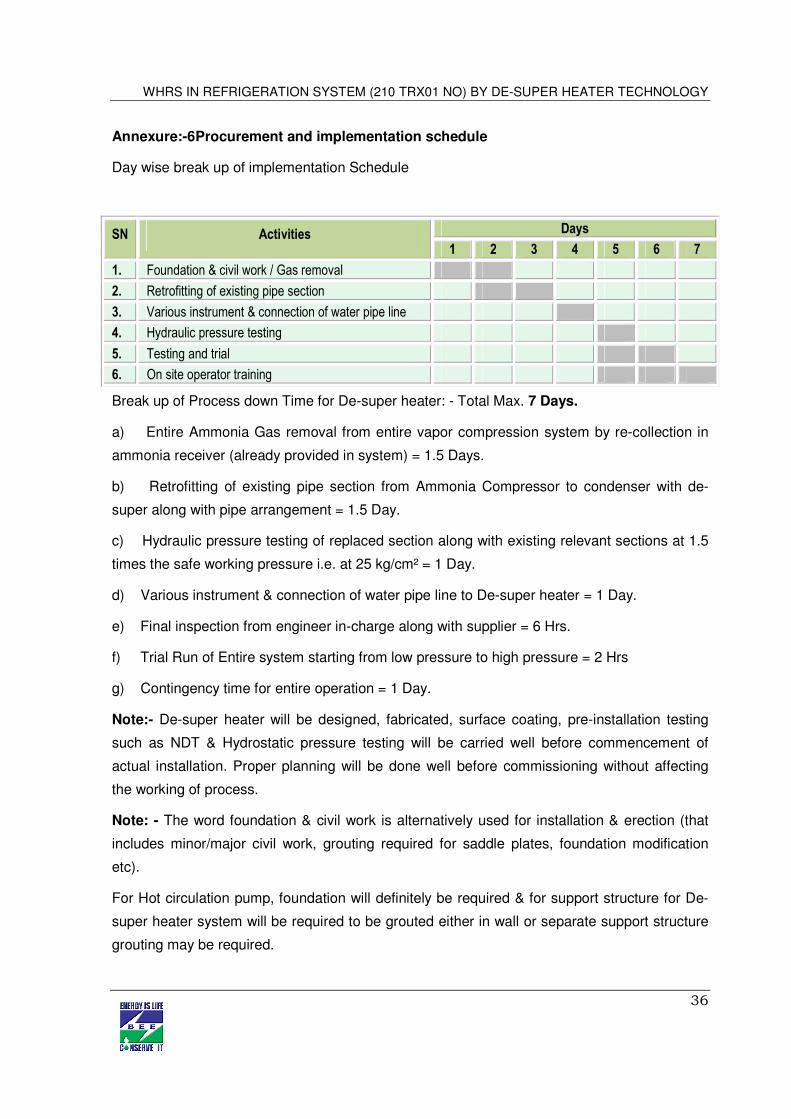
Annexure:-6 Procurement and implementation schedule
Day wise break up of implementation Schedule
SN Activities Days
1 2 3 4 5 6 7
1. Foundation & civil work / Gas removal
2. Retrofitting of existing pipe section
3. Various instrument & connection of water pipe line
4. Hydraulic pressure testing
5. Testing and trial
6. On site operator training
Break up of Process down Time for De-super heater: - Total Max. 7 Days.
a) Entire Ammonia Gas removal from entire vapor compression system by re-collection in
ammonia receiver (already provided in system) = 1.5 Days.
b) Retrofitting of existing pipe section from Ammonia Compressor to condenser with de-
super along with pipe arrangement = 1.5 Day.
c) Hydraulic pressure testing of replaced section along with existing relevant sections at 1.5
times the safe working pressure i.e. at 25 kg/cm² = 1 Day.
d) Various instrument & connection of water pipe line to De-super heater = 1 Day.
e) Final inspection from engineer in-charge along with supplier = 6 Hrs.
f) Trial Run of Entire system starting from low pressure to high pressure = 2 Hrs
g) Contingency time for entire operation = 1 Day.
Note:- De-super heater will be designed, fabricated, surface coating, pre-installation testing
such as NDT & Hydrostatic pressure testing will be carried well before commencement of
actual installation. Proper planning will be done well before commissioning without affecting
the working of process.
Note: - The word foundation & civil work is alternatively used for installation & erection (that
includes minor/major civil work, grouting required for saddle plates, foundation modification
etc).
For Hot circulation pump, foundation will definitely be required & for support structure for De-
super heater system will be required to be grouted either in wall or separate support structure
grouting may be required.
WHRS IN REFRIGERATION SYSTEM (210 TRX01 NO) BY DE-SUPER HEATER TECHNOLOGY
37
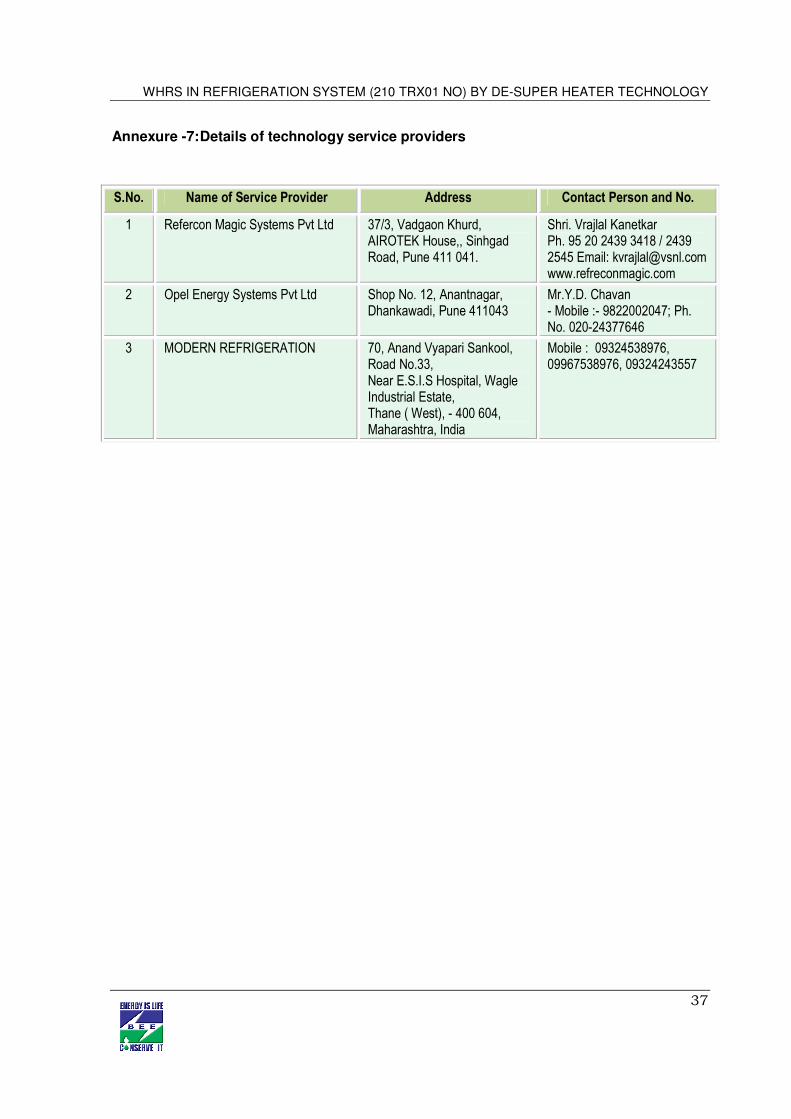
Annexure -7: Details of technology service providers
S.No. Name of Service Provider Address Contact Person and No.
1 Refercon Magic Systems Pvt Ltd 37/3, Vadgaon Khurd, AIROTEK House,, Sinhgad Road, Pune 411 041.
Shri. Vrajlal Kanetkar Ph. 95 20 2439 3418 / 2439 2545 Email: [email protected] www.refreconmagic.com
2 Opel Energy Systems Pvt Ltd Shop No. 12, Anantnagar, Dhankawadi, Pune 411043
Mr.Y.D. Chavan - Mobile :- 9822002047; Ph. No. 020-24377646
3 MODERN REFRIGERATION 70, Anand Vyapari Sankool, Road No.33, Near E.S.I.S Hospital, Wagle Industrial Estate, Thane ( West), - 400 604, Maharashtra, India
Mobile : 09324538976, 09967538976, 09324243557
WHRS IN REFRIGERATION SYSTEM (210 TRX01 NO) BY DE-SUPER HEATER TECHNOLOGY
38
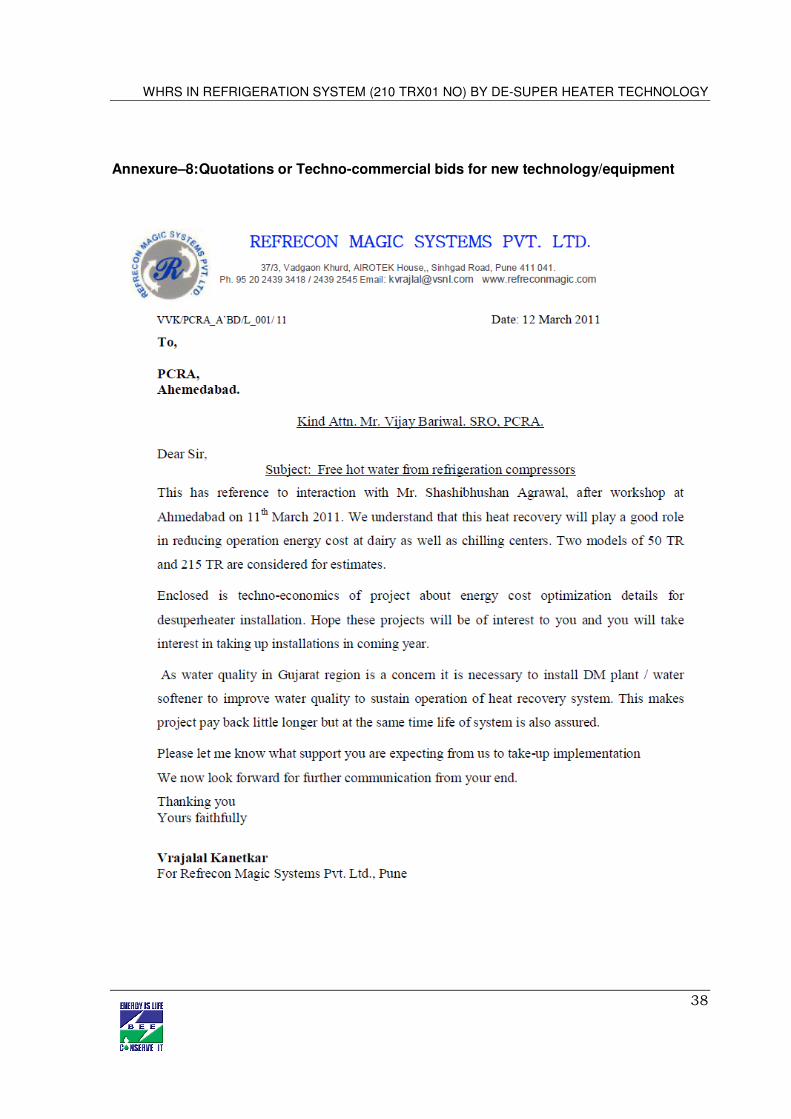
Annexure–8: Quotations or Techno-commercial bids for new technology/equipment
WHRS IN REFRIGERATION SYSTEM (210 TRX01 NO) BY DE-SUPER HEATER TECHNOLOGY
39

India SME Technology Services Ltd DFC Building, Plot No.37-38, D-Block, Pankha Road, Institutional Area, Janakpuri, New Delhi-110058 Tel: +91-11-28525534, Fax: +91-11-28525535 Website: www.techsmall.com
Bureau of Energy Efficiency (BEE) (Ministry of Power, Government of India) 4th Floor, Sewa Bhawan, R. K. Puram, New Delhi – 110066 Ph.: +91 – 11 – 26179699 (5 Lines), Fax: +91 – 11 – 26178352
Websites: www.bee-india.nic.in, www.energymanagertraining.com
Petroleum Conservation & Research Association Office Address :- Western Region
C-5, Keshava Building, Bandra-
Kurla Complex; Mumbai – 400051
Website: www.pcra.org


![INDEX [environmentclearance.nic.in]environmentclearance.nic.in/writereaddata/Online/... · WHRS 20 MW along with DG Sets of 2000 KVA (1000/500/250/125 KVA) and Residential Colony](https://img.pdfslide.us/doc/110x75/5f728e29161f03242d58a472/index-whrs-20-mw-along-with-dg-sets-of-2000-kva-1000500250125-kva-and-residential.jpg)